
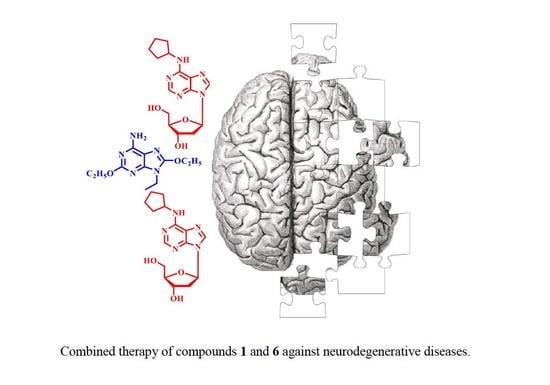
Combined Therapy of A1AR Agonists and A2AAR Antagonists in Neuroinflammation


 ,
,  , ,
, ,  and
and
Abstract
1. Introduction
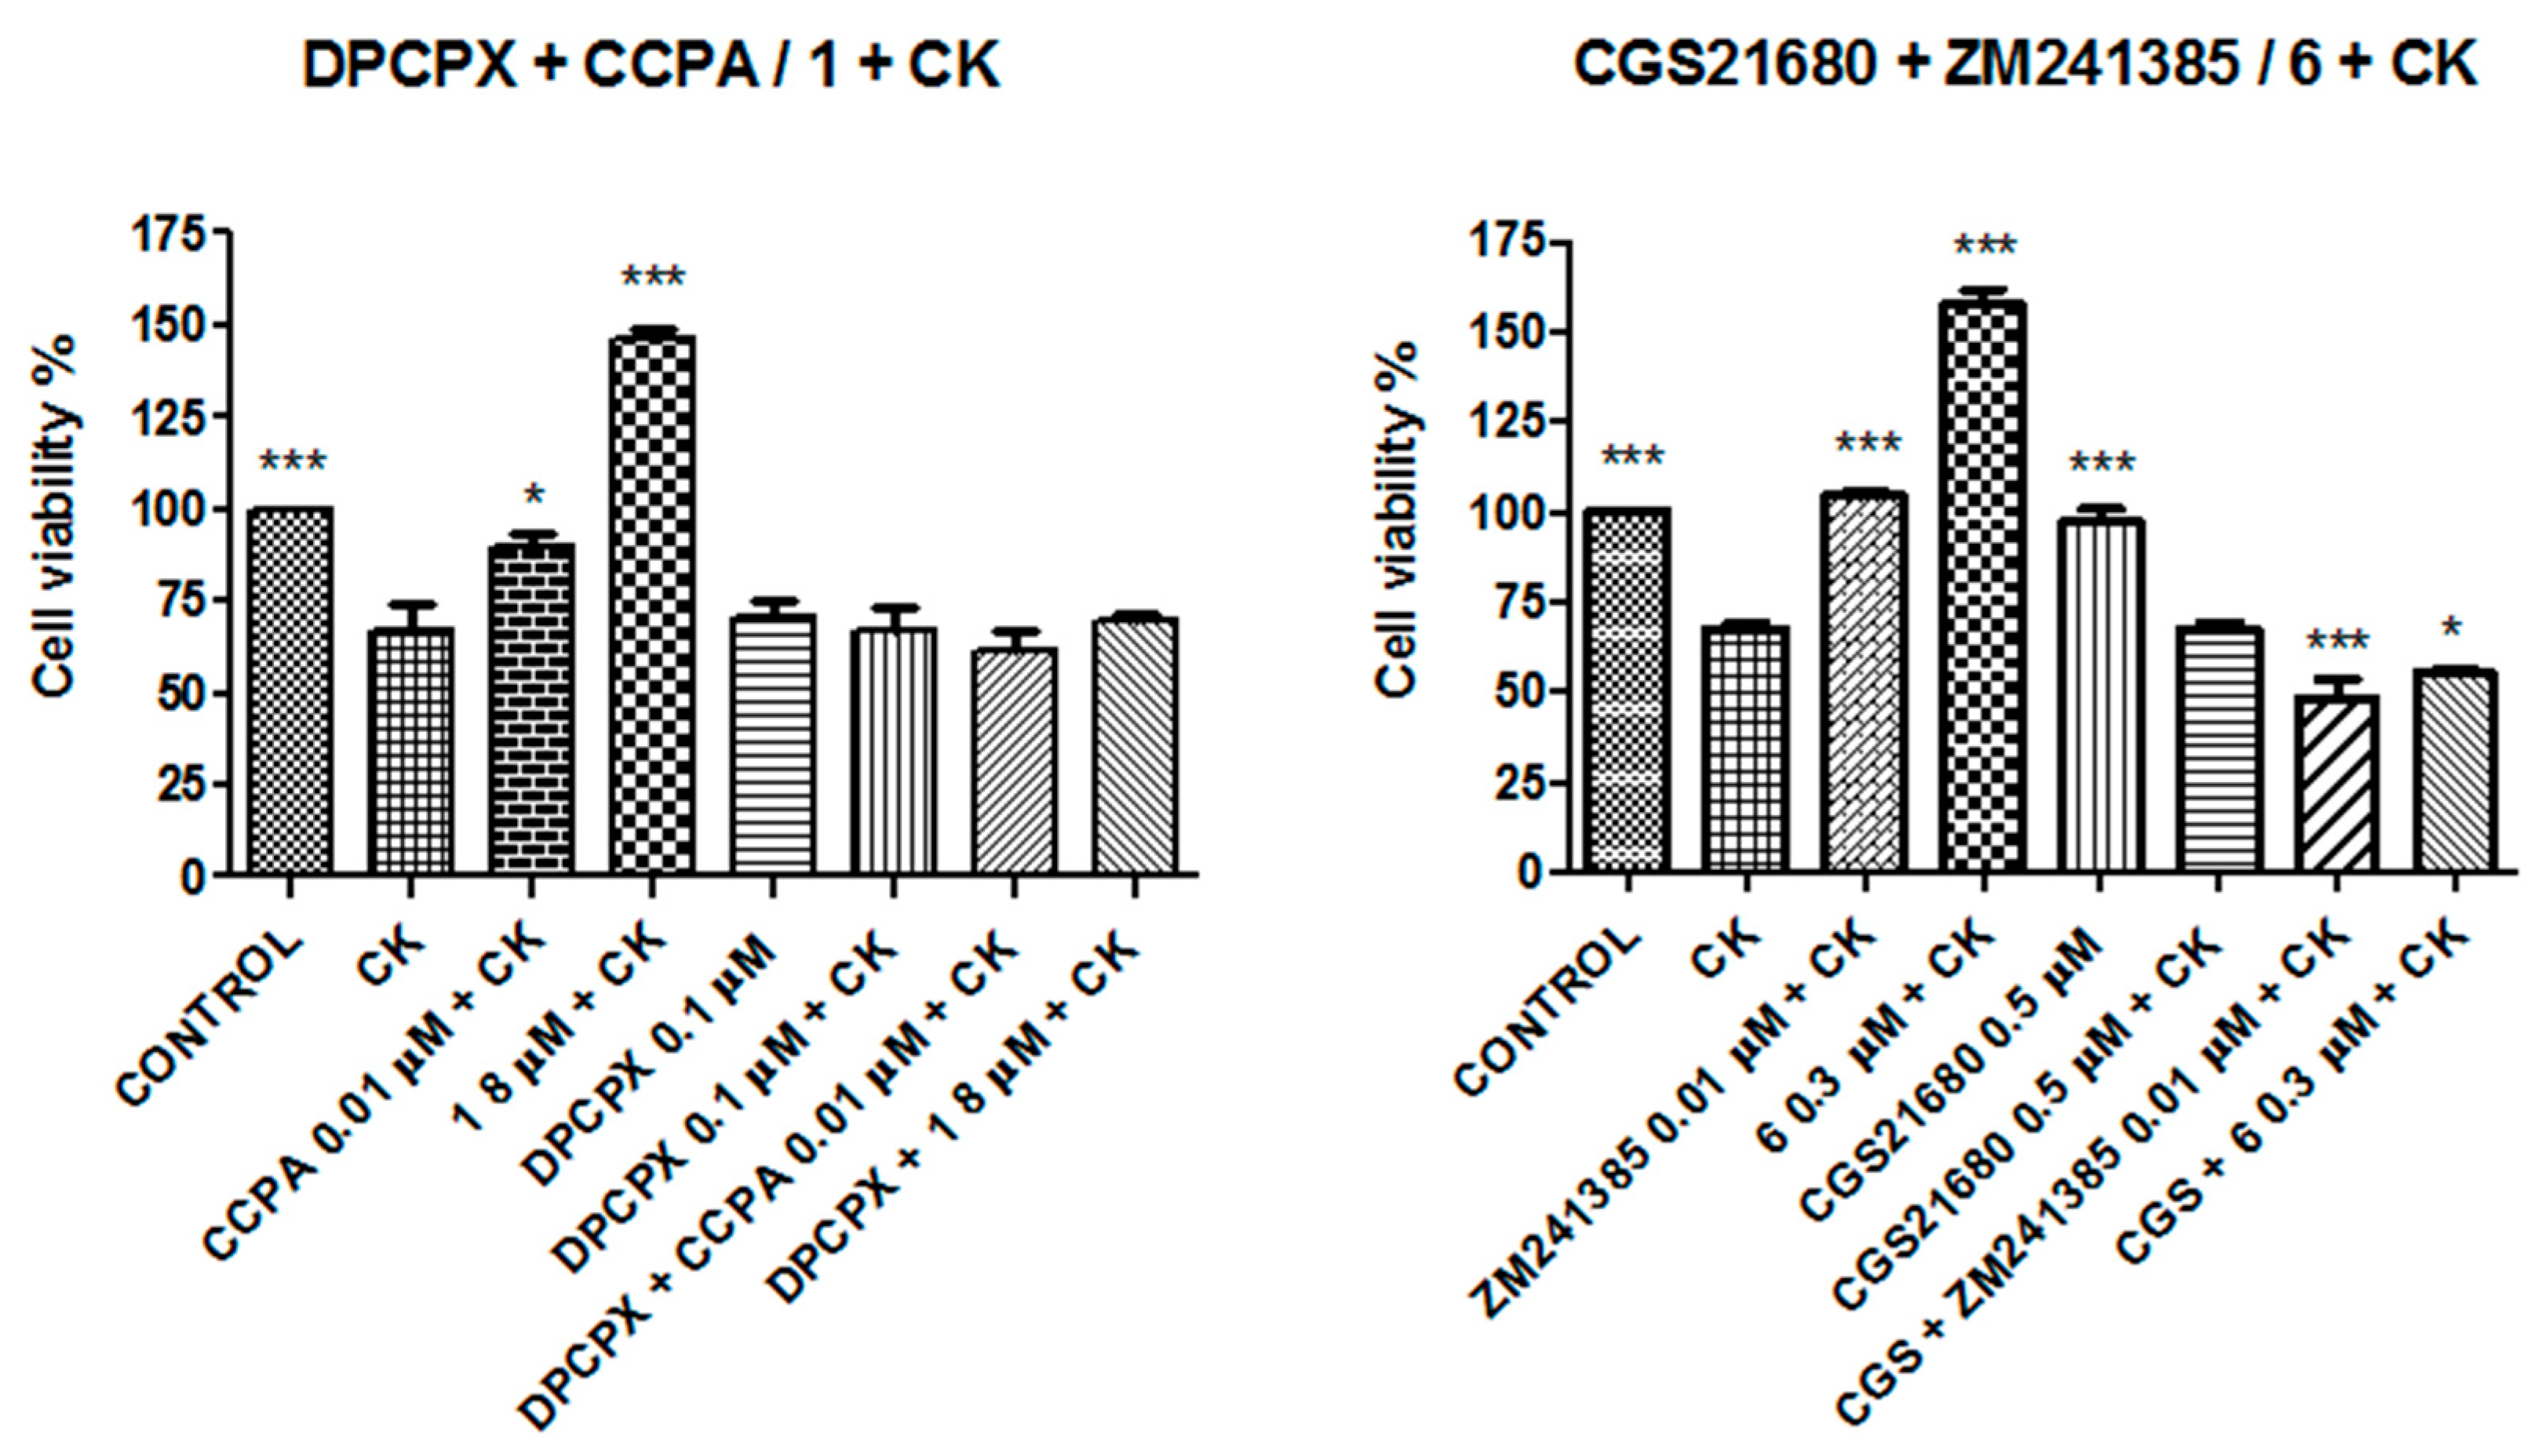
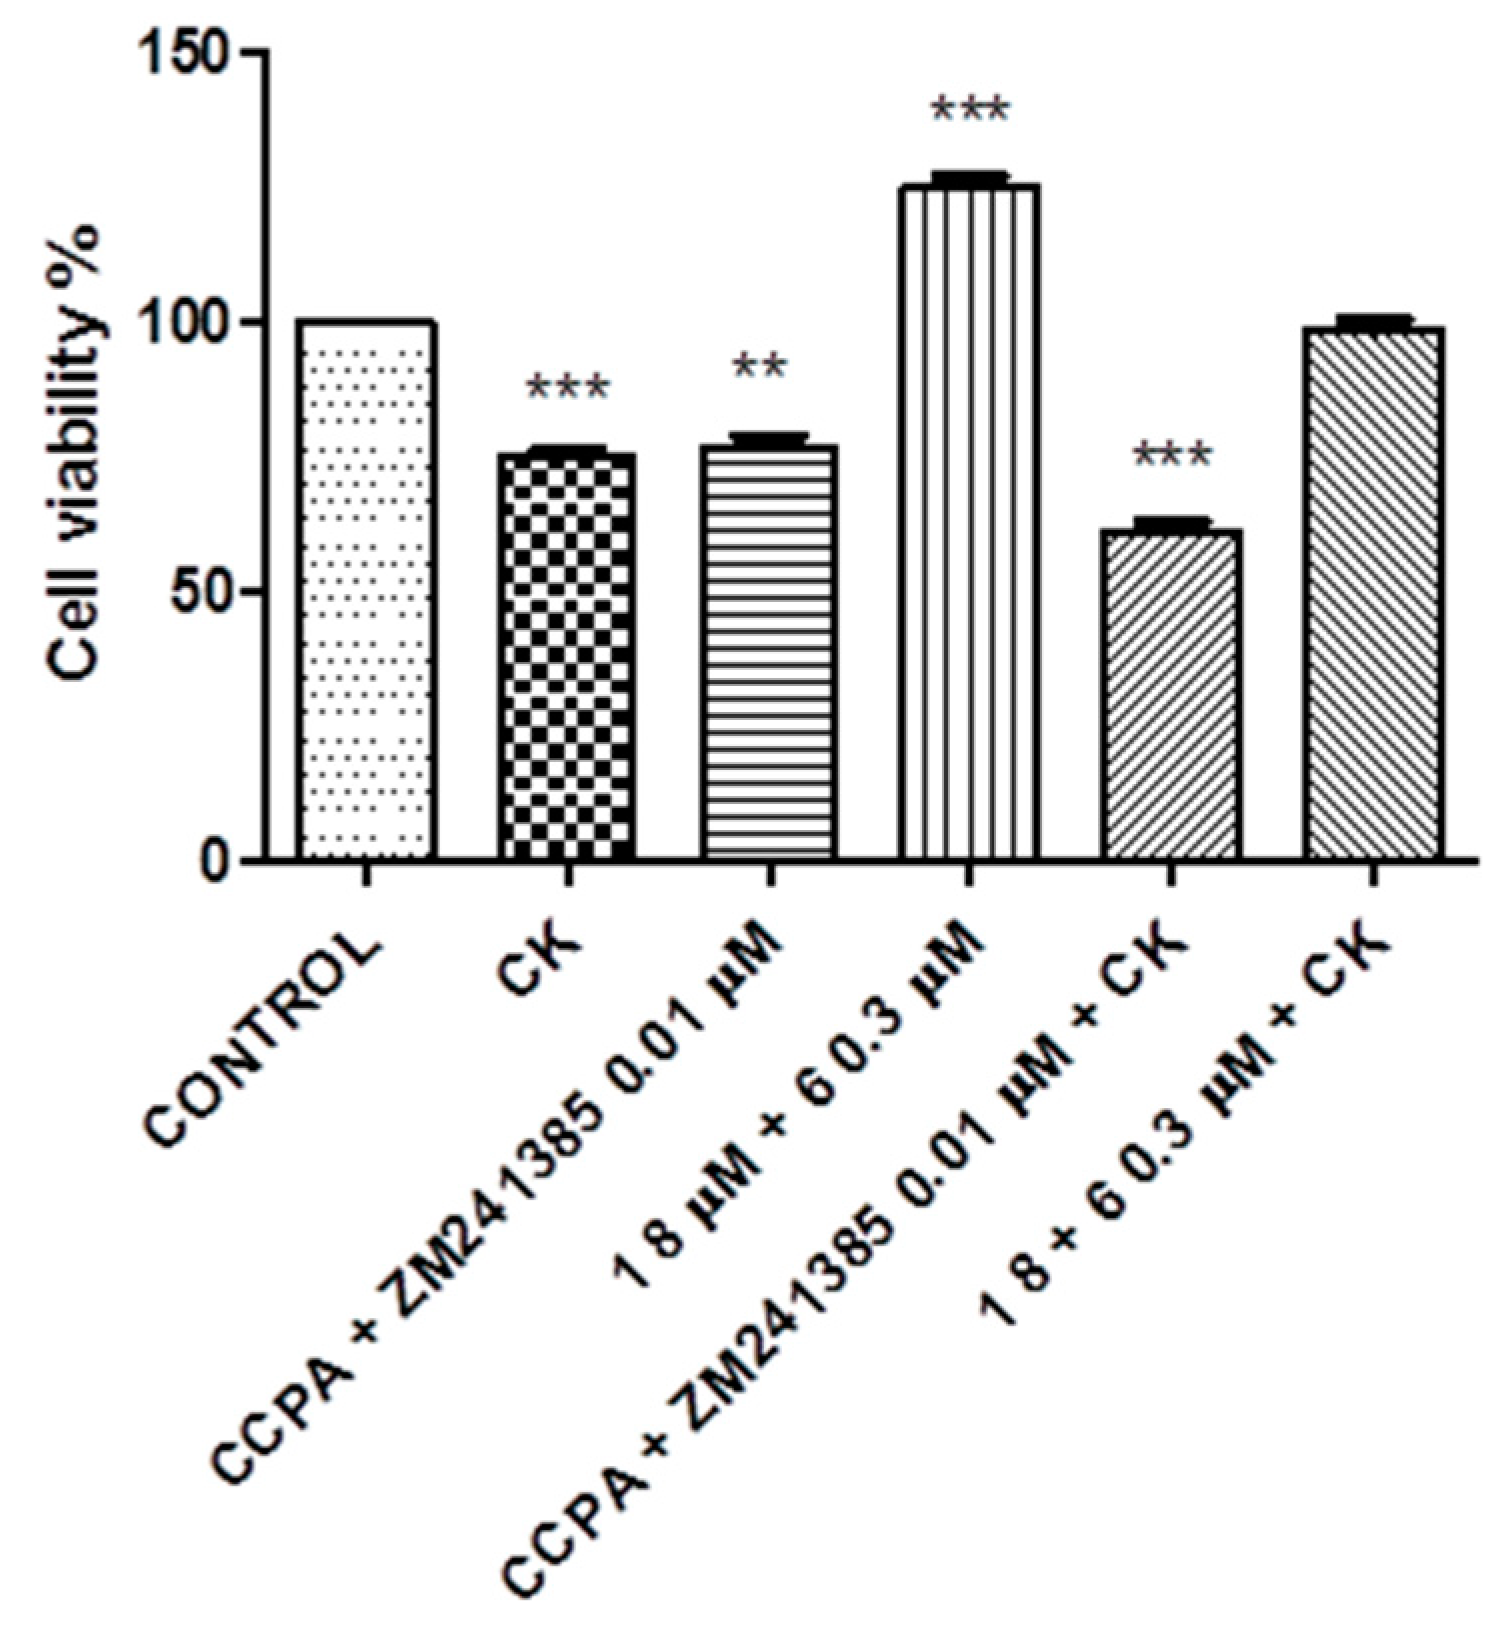
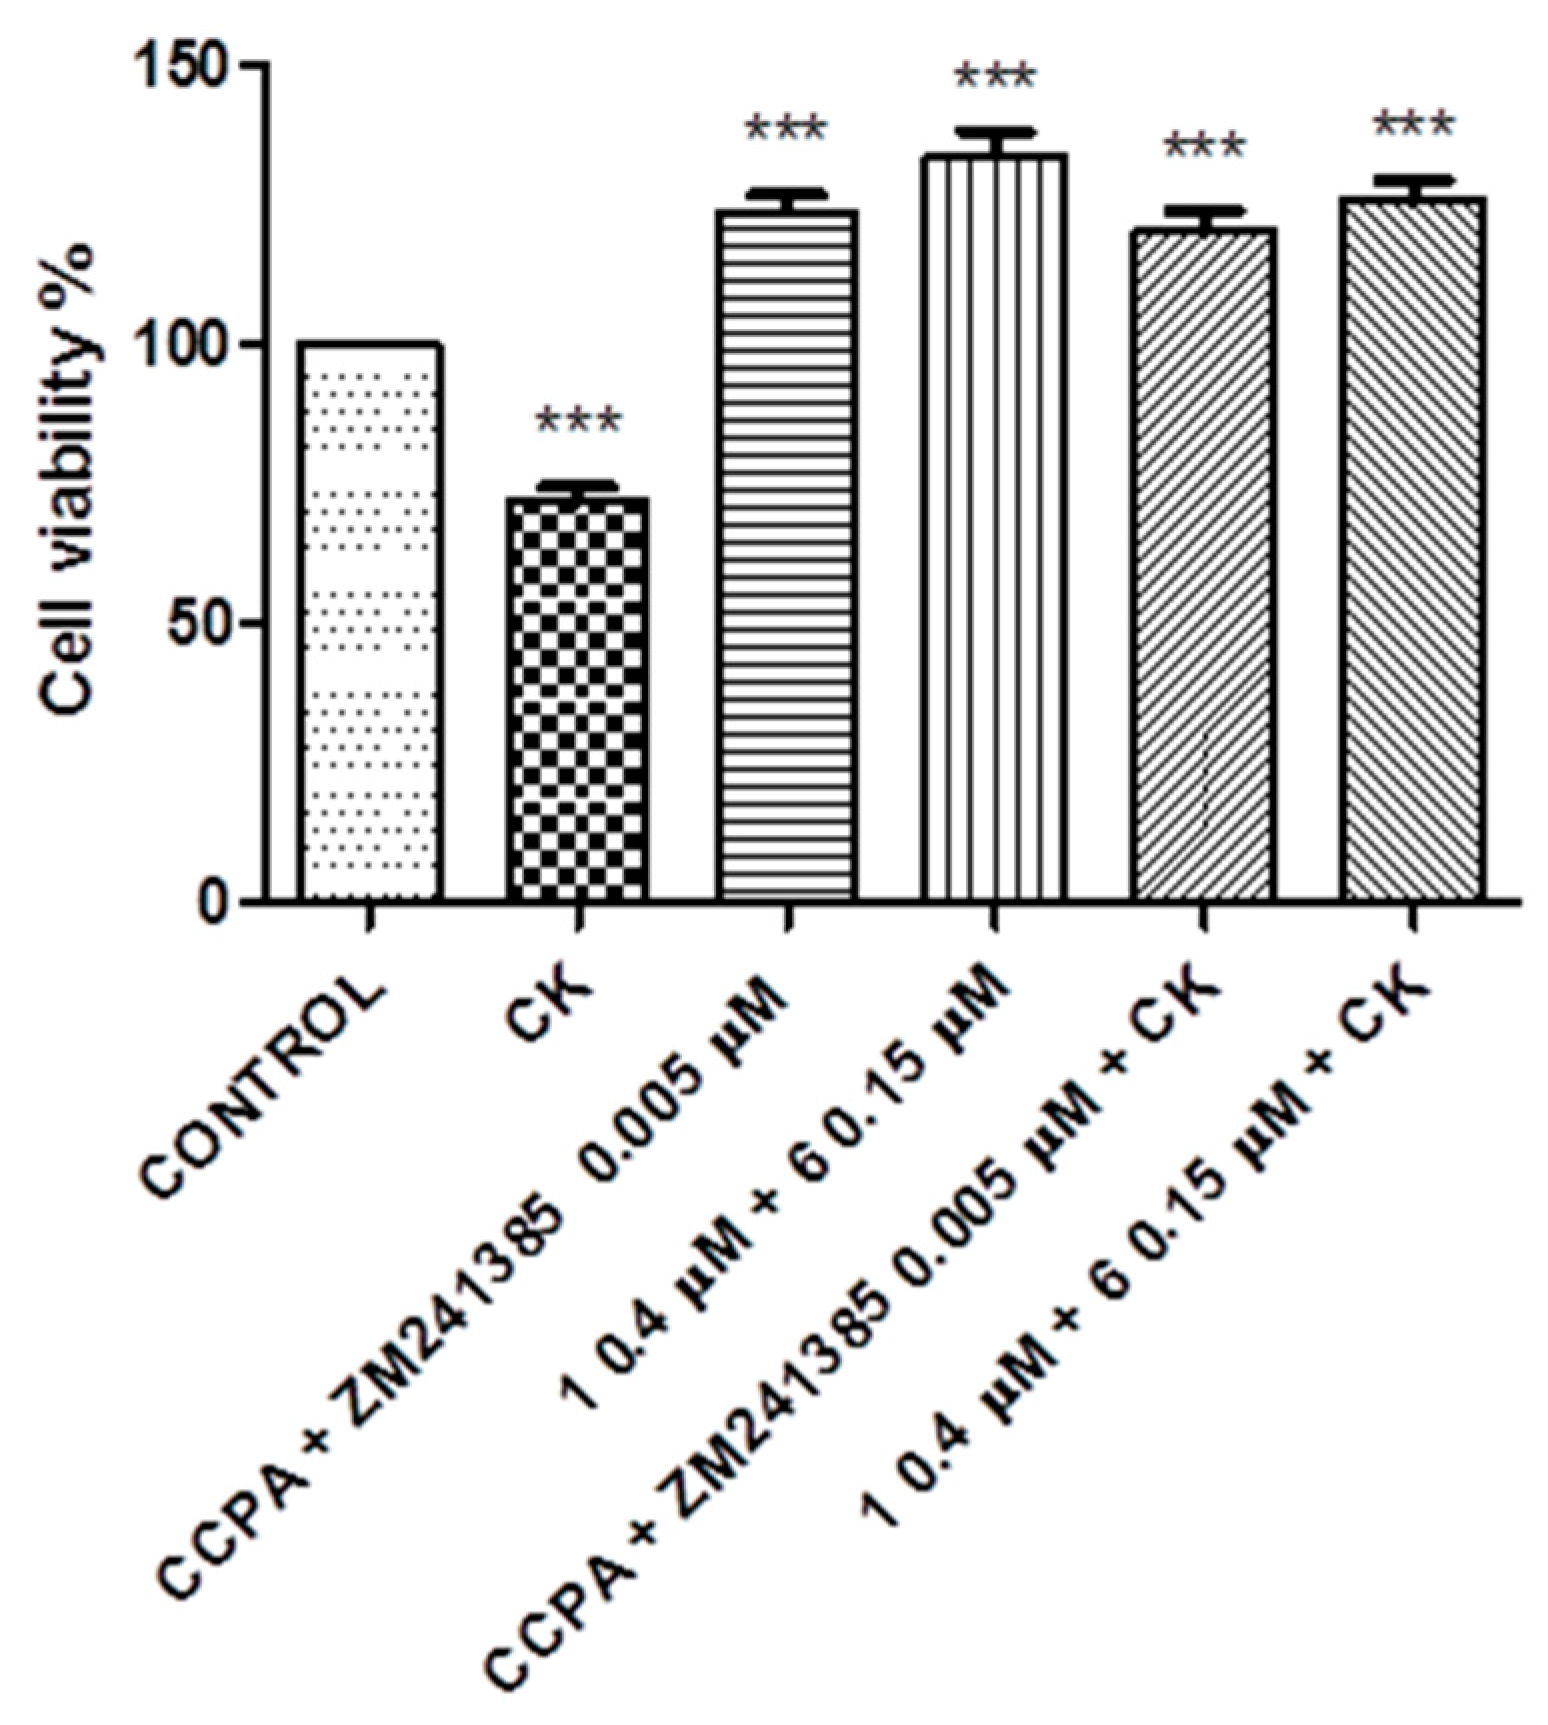
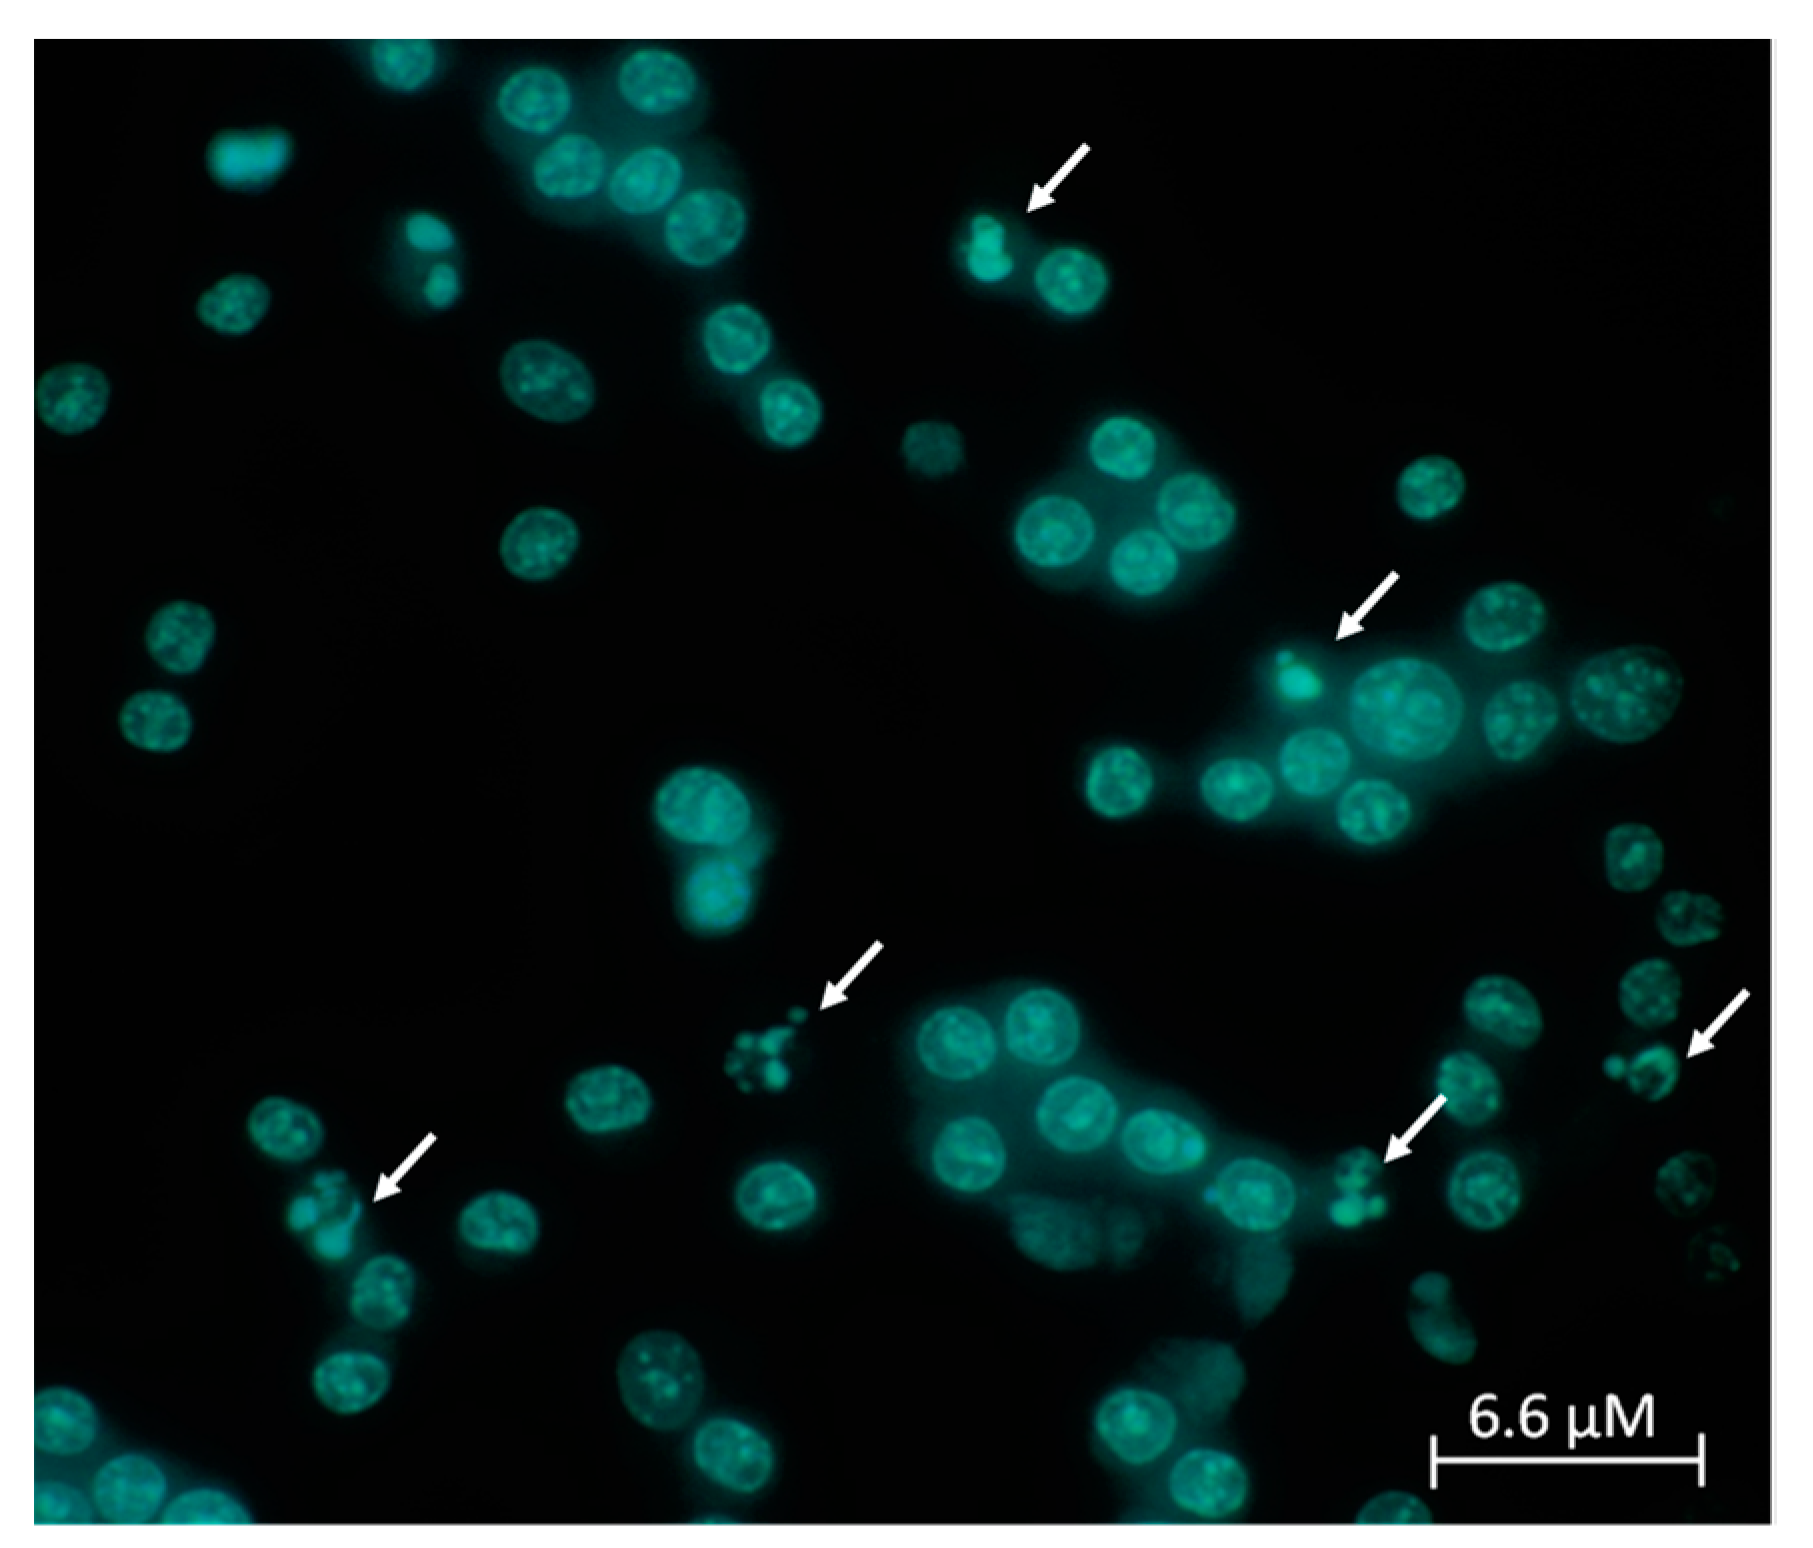
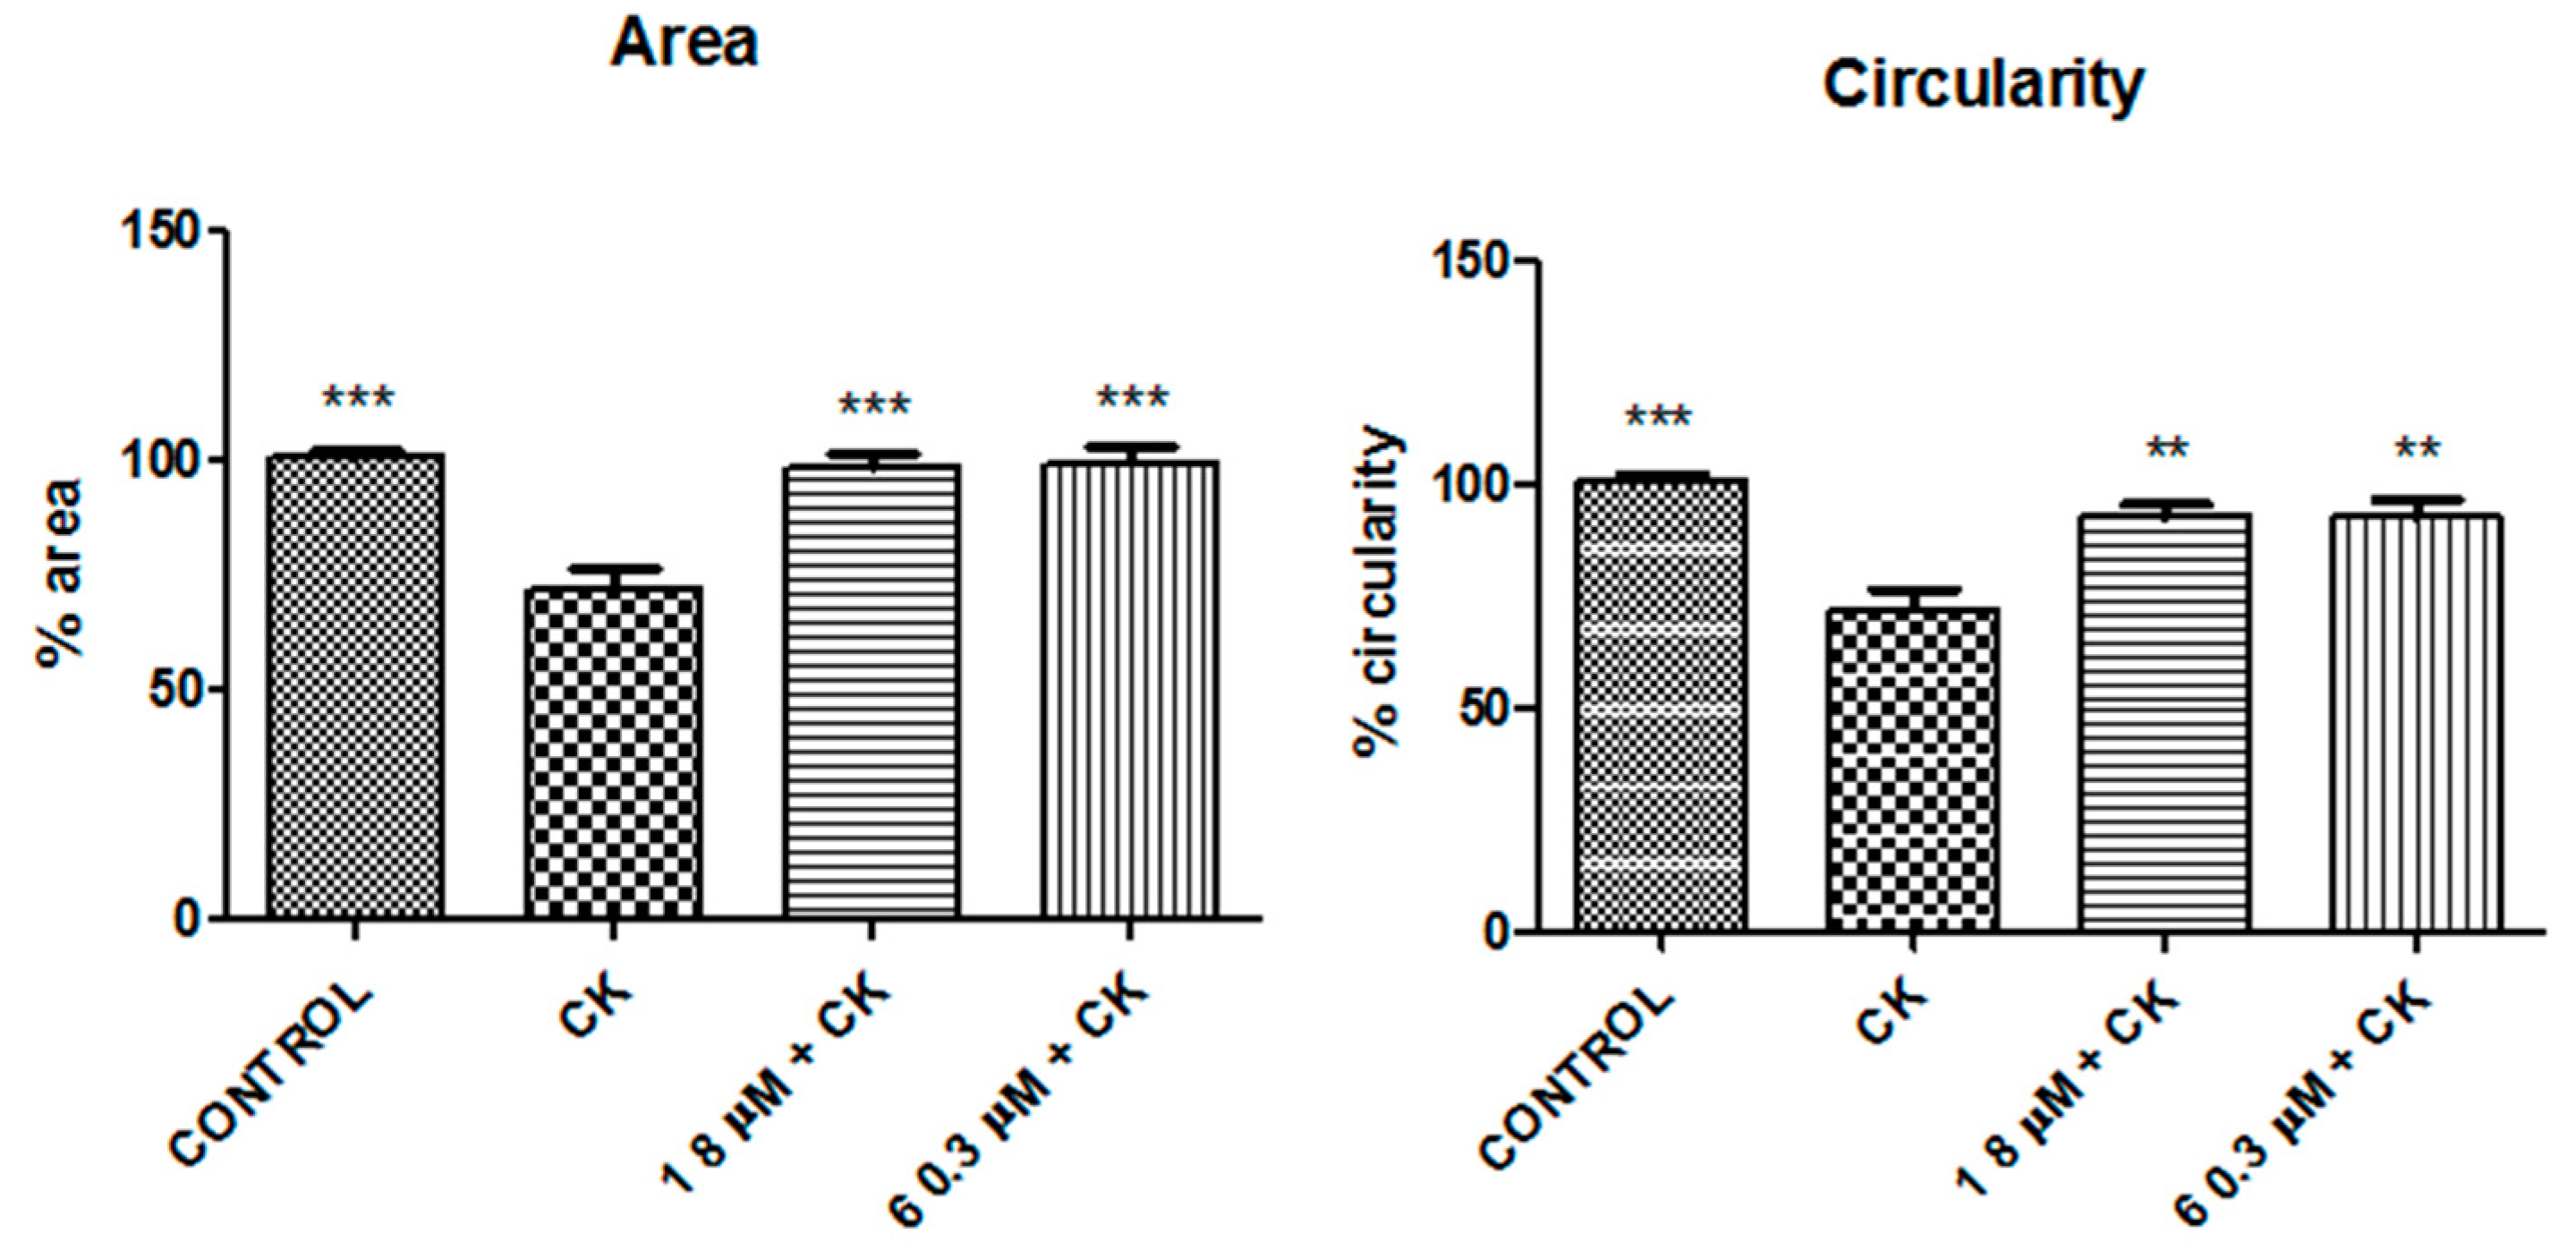
2. Results
3. Discussion
4. Materials and Methods
4.1. Cells Culture
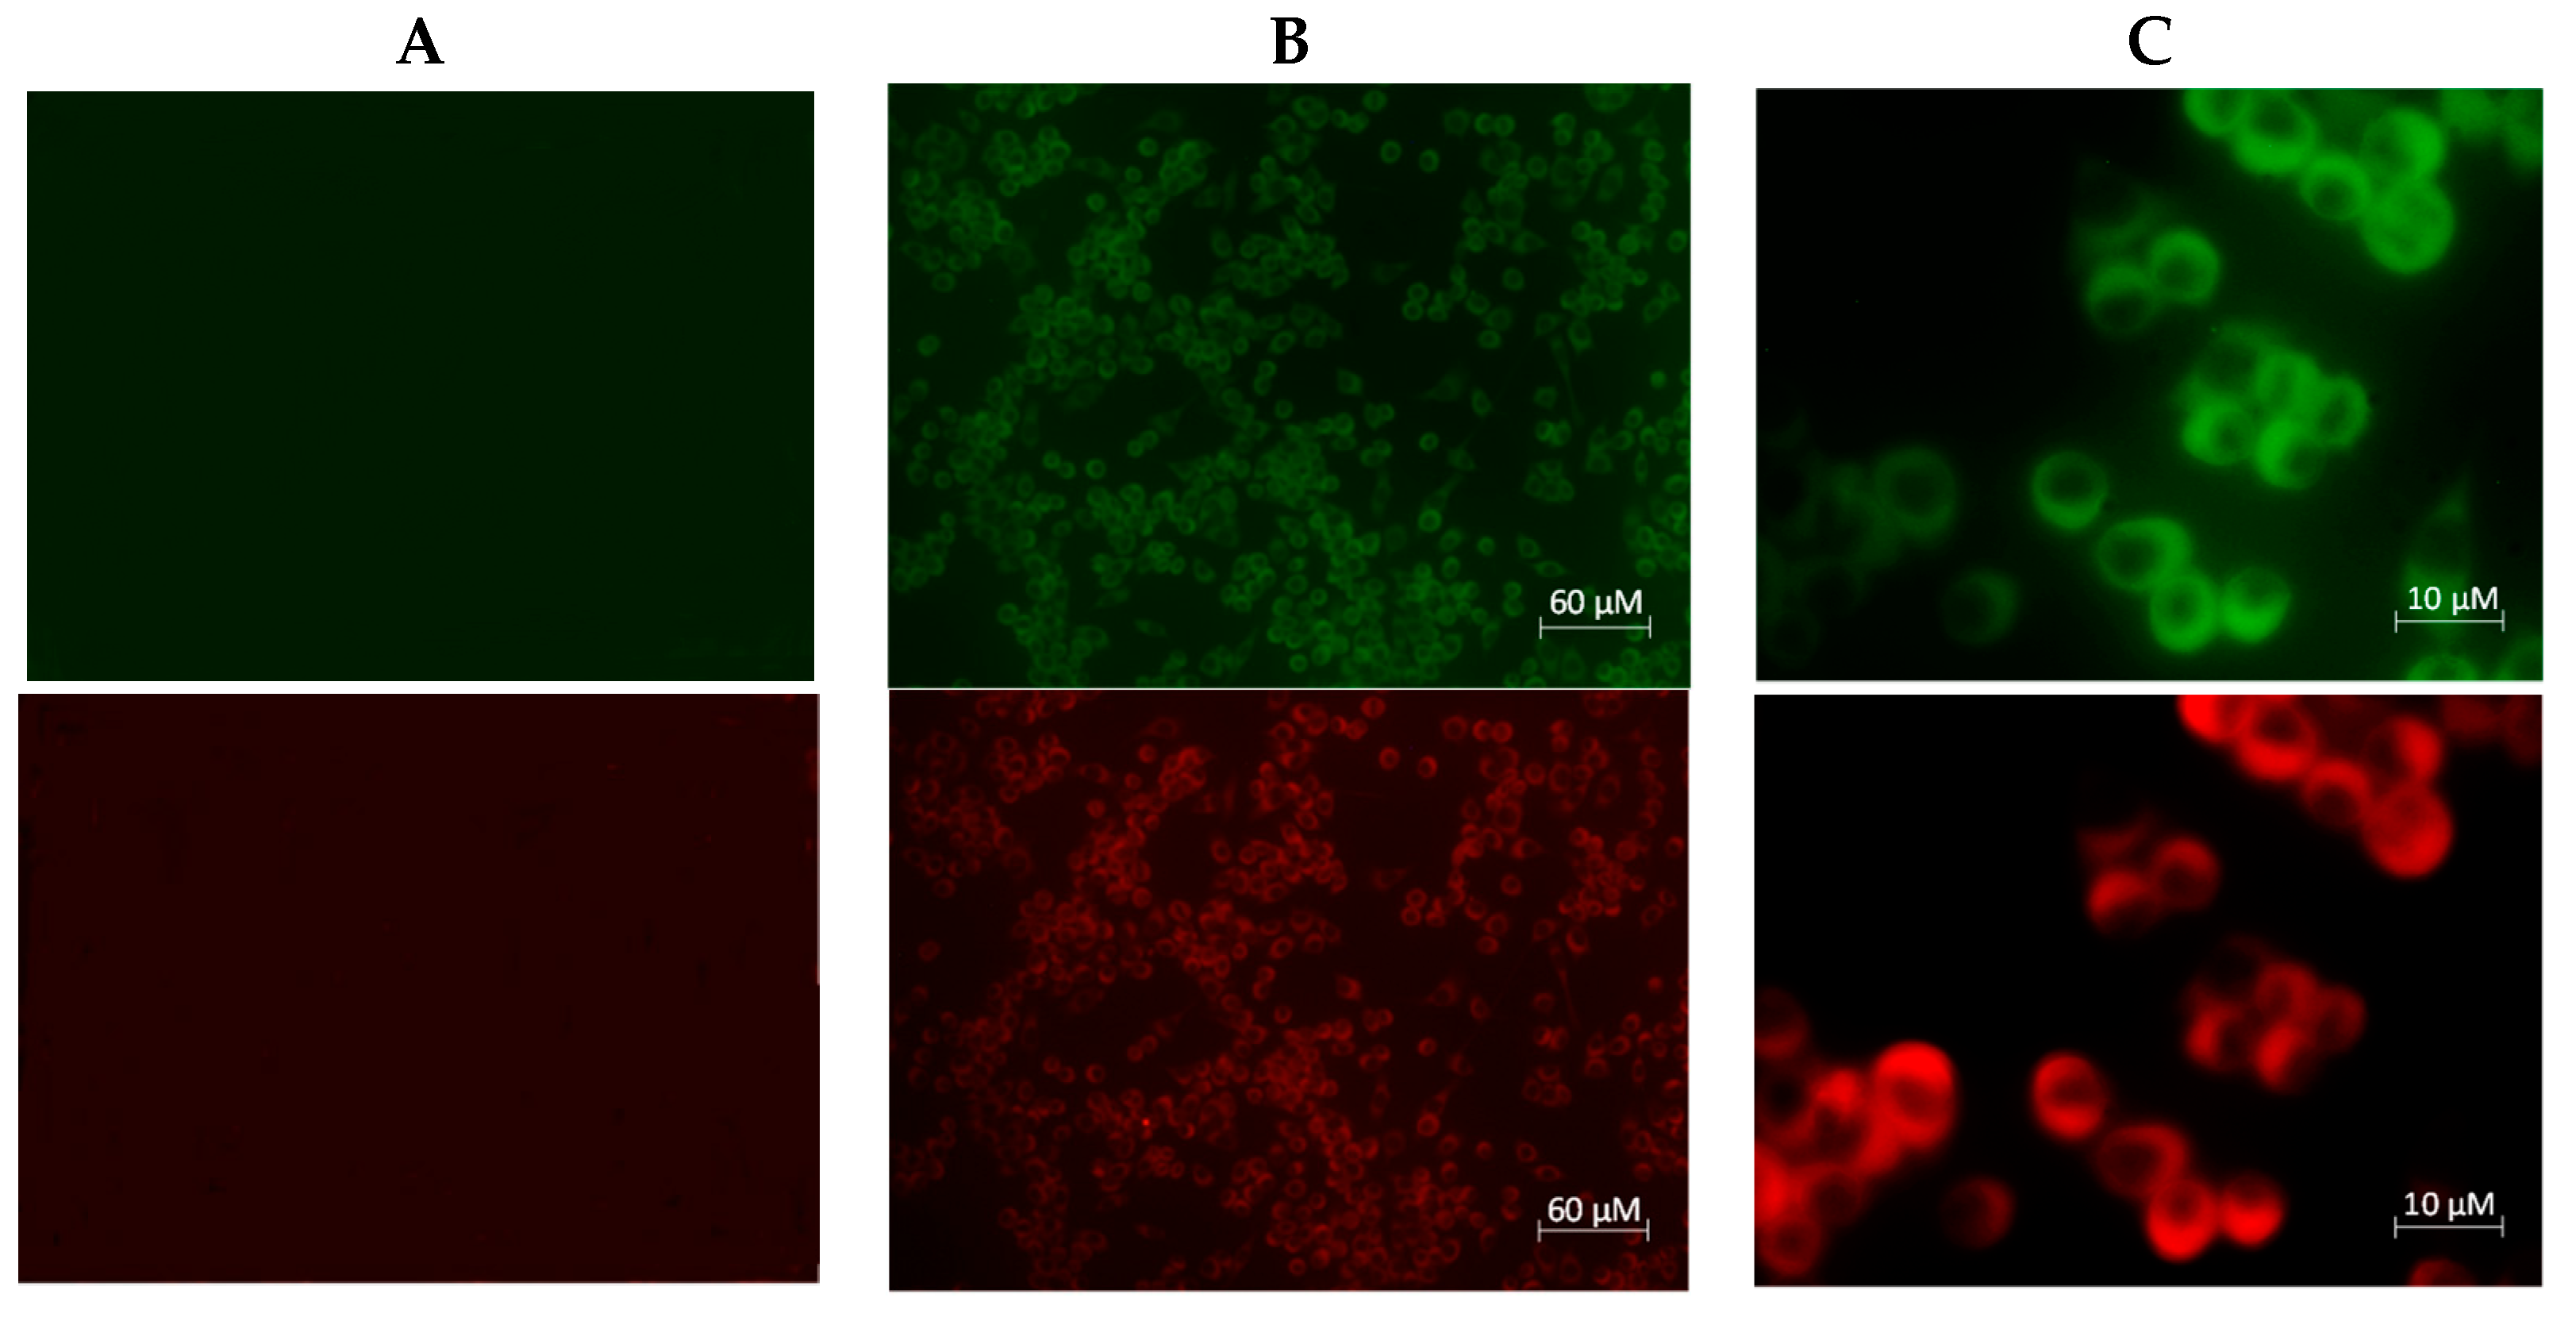
4.2. Immunocytochemistry
4.3. Trypan Blue Exclusion Test
4.4. Cell Titer 96® AQueous One Solution Cell Proliferation Assay
4.5. CellTiter-Glo® Luminescent Cell Viability Assay
4.6. Hoechst Assay
4.7. Apoptosis and Necrosis Assay
4.8. Statistical Analysis
5. Conclusions
Author Contributions
Funding
Data Availability Statement
Conflicts of Interest
Sample Availability
References
- Pelvig, D.P.; Pakkenberg, H.; Stark, A.K.; Pakkenberg, B. Neocortical glial cell numbers in human brains. Neurobiol. Aging 2008, 29, 1754–1762. [Google Scholar] [CrossRef] [PubMed]
- Verkhratsky, A.; Nedergaard, M. Physiology of Astroglia. Physiol. Rev. 2018, 98, 239–389. [Google Scholar] [CrossRef] [PubMed]
- Perry, V.H.; Cunningham, C.; Holmes, C. Systemic infections and inflammation affect chronic neurodegeneration. Nat. Rev. 2007, 7, 161–167. [Google Scholar] [CrossRef]
- Streit, W.J.; Mrak, R.E.; Griffin, W.S. Microglia and neuroinflammation: A pathological perspective. J. Neuroinflamm. 2004, 1, 14. [Google Scholar] [CrossRef] [PubMed][Green Version]
- Hanisch, U.K.; Kettenmann, H. Microglia: Active sensor and versatile effector cells in the normal and pathologic brain. Nat. Neurosci. 2007, 10, 1387–1394. [Google Scholar] [CrossRef]
- Davalos, D.; Grutzendler, J.; Yang, G.; Kim, J.V.; Zuo, Y.; Jung, S.; Littman, D.R.; Dustin, M.L.; Gan, W.B. ATP mediates rapid microglia response to local brain injury in vivo. Nat. Neurosci. 2005, 8, 752–758. [Google Scholar] [CrossRef]
- Koizumi, S.; Shigemoto-Mogami, Y.; Nasu-Tada, K.; Shinozaki, Y.; Ohsawa, K.; Tsuda, M.; Joshi, B.V.; Jacobson, K.A.; Kohsaka, S.; Inoue, K. UDP acting at P2Y6 receptors is a mediator of microglia phagocytosis. Nature 2007, 446, 1091–1095. [Google Scholar] [CrossRef]
- Boison, D. Adenosine as a modulator of brain activity. Drug News Perspect. 2007, 20, 607–611. [Google Scholar] [CrossRef] [PubMed]
- Schmidt, J.; Ferk, P. Safety issues of compounds acting on adenosinergic signalling. J. Pharm. Pharmacol. 2017, 69, 790–806. [Google Scholar] [CrossRef] [PubMed]
- Sebastiao, A.M.; Ribeiro, J.A. Fine-tuning neuromodulation by adenosine. Trends Pharmacol. Sci. 2000, 21, 341–346. [Google Scholar] [CrossRef]
- Sebastiao, A.M.; Ribeiro, J.A. Adenosine receptors and the central nervous system. Handb. Exp. Pharmacol. 2009, 193, 471–534. [Google Scholar]
- De Mendoncca, A.; Ribeiro, J.A. Adenosine and synaptic plasticity. Drug Dev. Res. 2001, 52, 283–290. [Google Scholar] [CrossRef]
- Stone, T.W.; Ceruti, S.; Abbracchio, M.P. Adenosine receptors and neurological disease: Neuroprotection and neurodegeneration. Handb. Exp. Pharmacol. 2009, 193, 535–587. [Google Scholar]
- Stockwell, J.; Jakova, E.; Cayabyab, F.S. Adenosine A1 and A2A receptors in the brain: Current research and their role in neurodegeneration. Molecules 2017, 22, 676. [Google Scholar] [CrossRef] [PubMed]
- Luongo, L.; Guida, F.; Imperatore, R.; Napolitano, F.; Gatta, L.; Cristino, L.; Giordano, C.; Siniscalco, D.; Di Marzo, V.; Bellini, G.; et al. The A1 adenosine receptor as a new player in microglia physiology. Glia 2014, 62, 122–132. [Google Scholar] [CrossRef] [PubMed]
- Blackburn, M.R.; Vance, C.O.; Morschl, E.; Wilson, C.N. Adenosine receptors and inflammation. In Adenosine Receptors in Health and Disease; Wilson, C.N., Mustafa, S.J., Eds.; Springer: Berlin/Heidelberg, Germany, 2009; Volume 193, pp. 215–269. [Google Scholar]
- Cronstein, B.N.; Levin, R.I.; Philips, M.; Hirschhorn, R.; Abramson, S.B.; Weissmann, G. Neutrophil adherence to endothelium is enhanced via adenosine A1 receptors and inhibited via adenosine A2 receptors. J. Immunol. 1992, 148, 2201–2206. [Google Scholar]
- Zahler, S.; Becker, B.F.; Raschke, P.; Gerlach, E. Stimulation of endothelial adenosine A1 receptors enhances adhesion of neutrophils in the intact guinea pig coronary system. Cardiovasc. Res. 1994, 28, 1366–1372. [Google Scholar] [CrossRef] [PubMed][Green Version]
- Lambertucci, C.; Vittori, S.; Mishra, R.C.; Dal Ben, D.; Klotz, K.N.; Volpini, R.; Cristalli, G. Synthesis and Biological Activity of Trisubstituted Adenines as A2A Adenosine Receptor Antagonists. Nucleosides Nucleotides Nucleic Acids 2007, 26, 1443–1446. [Google Scholar] [CrossRef]
- Martire, A.; Lambertucci, C.; Pepponi, R.; Ferrante, A.; Benati, N.; Buccioni, M.; Dal Ben, D.; Marucci, G.; Klotz, K.N.; Volpini, R.; et al. Neuroprotective potential of adenosine A1 receptor partial agonists in experimental models of cerebral ischemia. J. Neurochem. 2019, 149, 11–230. [Google Scholar] [CrossRef]
- Takahashi, H.K.; Iwagaki, H.; Hamano, R.; Wake, H.; Kanke, T.; Liu, K.; Yoshino, T.; Tanaka, N.; Nishibori, M. Effects of adenosine on adhesion molecule expression and cytokine production in human PBMC depend on the receptor subtype activated. Br. J. Pharmacol. 2007, 150, 816–822. [Google Scholar] [CrossRef] [PubMed]
- Wiwin, I.E.; Tatsuya, N.; Kazuyuki, K.; Yoshihiro, N. Focusing on Adenosine Receptors as a Potential Targeted Therapy in Human Diseases. Cells 2020, 9, 785. [Google Scholar]
- Ohta, A.; Sitkovsky, M. Role of G-protein-coupled adenosine receptors in downregulation of inflammation and protection from tissue damage. Nature 2001, 414, 916–920. [Google Scholar] [CrossRef] [PubMed]
- Minghetti, L.; Greco, A.; Potenza, R.L.; Pezzola, A.; Blum, D.; Bantubungi, K.; Popoli, P. Effects of the adenosine A2A receptor antagonist SCH 58621 on cyclooxygenase-2 expression, glial activation, and brain-derived neurotrophic factor availability in a rat model of striatal neurodegeneration. J. Neuropathol. Exp. Neurol. 2007, 66, 363–371. [Google Scholar] [CrossRef] [PubMed]
- Orr, A.G.; Orr, A.L.; Li, X.J.; Gross, R.E.; Traynelis, S.F. Adenosine A2A receptor mediates microglial process retraction. Nat. Neurosci. 2009, 12, 872–878. [Google Scholar] [CrossRef]
- Colella, M.; Zinni, M.; Pansiot, J.; Cassanello, M.; Mairesse, J.; Ramenghi, L.; Baud, O. Modulation of Microglial Activation by Adenosine A2A Receptor in Animal Models of Perinatal Brain Injury. Front. Neurol. 2018, 9, 605. [Google Scholar] [CrossRef]
- Lasley, R.D.; Kristo, G.; Keith, B.J.; Mentzer, R.M. The A2a/A2b receptor antagonist ZM-241385 blocks the cardioprotective effect of adenosine agonist pretreatment in in vivo rat myocardium. Am. J. Physiol. Heart Circ. Physiol. 2007, 292, 426–431. [Google Scholar] [CrossRef]
- Borea, P.A.; Gessi, S.; Merighi, S.; Vincenzi, F.; Varani, K. Pathological overproduction: The bad side of adenosine. Br. J. Pharmacol. 2017, 174, 1945–1960. [Google Scholar] [CrossRef]
- Ongini, E.; Dionisotti, S.; Gessi, S.; Irenius, E.; Fredholm, B.B. Comparison of CGS 15943, ZM 241385 and SCH 58261 as antagonists at human adenosine receptors. Naunyn-Schmiedeberg’s Arch. Pharmacol. 1999, 359, 7–10. [Google Scholar] [CrossRef] [PubMed]
- Cristalli, G.; Palle, V.; Zablocki, J. Partial and Full Agonists of A1 Adenosine Receptors. 2004. Available online: https://patentscope2.wipo.int/search/en/detail.jsf?docId=WO2004016635 (accessed on 22 February 2021).
- Klotz, K.N.; Kachler, S.; Lambertucci, C.; Vittori, S.; Volpini, R.; Cristalli, G. 9-Ethyladenine derivatives as adenosine receptor antagonists: 2- and 8-substitution results in distinct selectivities. Naunyn-Schmiedeberg’s Arch. Pharmacol. 2003, 367, 629–634. [Google Scholar] [CrossRef]
- Salter, M.W.; Stevens, B. Microglia emerge as central players in brain disease. Nat. Med. 2017, 23, 1018–1027. [Google Scholar] [CrossRef] [PubMed]
- Sachdeva, S.; Gupta, M. Adenosine and its receptors as therapeutic targets: An overview. Saudi Pharm. J. 2013, 21, 245–253. [Google Scholar] [CrossRef] [PubMed]
- Franco, R.; Martínez-Pinilla, E.; Navarro, G.; Zamarbide, M. Potential of GPCRs to modulate MAPK and mTOR pathways in Alzheimer’s disease. Prog. Neurobiol. 2017, 149–150, 21–38. [Google Scholar] [CrossRef]
- Cunha, R.A. Neuroprotection by adenosine in the brain: From A(1) receptor activation to A (2A) receptor blockade. Purinergic Signal. 2005, 1, 111–134. [Google Scholar] [CrossRef] [PubMed]
- Shakya, A.K.; Naik, R.R.; Almasri, I.M.; Kaur, A. Role and Function of Adenosine and its Receptors in Inflammation, Neuroinflammation, IBS, Autoimmune Inflammatory Disorders, Rheumatoid Arthritis and Psoriasis. Curr. Pharm. Des. 2019, 25, 2875–2891. [Google Scholar] [CrossRef] [PubMed]
- Gomesa, C.V.; Kastera, M.P.; Tomé, A.R.; Agostinho, P.M.; Cunha, R.A. Adenosine receptors and brain diseases: Neuroprotection and neurodegeneration. Biochim. Biophys. Acta 2011, 1808, 1380–1399. [Google Scholar] [CrossRef] [PubMed]
- Haskó, G.; Pacher, P.; Vizi, E.S.; Illes, P. Adenosine receptor signaling in the brain immune system. Trends Pharmacol. Sci. 2005, 26, 511–516. [Google Scholar] [CrossRef]
- Sheth, S.; Brito, R.; Mukherjea, D.; Rybak, L.P.; Ramkumar, V. Adenosine Receptors: Expression, Function and Regulation. Int. J. Mol. Sci. 2014, 15, 2024–2052. [Google Scholar] [CrossRef]
- Tsutsui, S.; Schnermann, J.; Noorbakhsh, F.; Henry, S.; Yong, V.W.; Winston, B.W.; Warren, K.; Power, C. A1 adenosine receptor upregulation and activation attenuates neuroinflammation and demyelination in a model of multiple sclerosis. J. Neurosci. 2004, 11, 1521–1529. [Google Scholar] [CrossRef] [PubMed]
- Saura, J.; Angulo, E.; Ejarque, A.; Casadó, V.; Tusell, J.M.; Moratalla, R.; Chen, J.F.; Schwarzschild, M.A.; Lluis, C.; Franco, R.; et al. Adenosine A2A receptor stimulation potentiates nitric oxide release by activated microglia. J. Neurochem. 2005, 95, 919–929. [Google Scholar] [CrossRef]
- Benveniste, E.N.; Benos, D.J. TNF-alpha- and IFN-gamma-mediated signal transduction pathways: Effects on glial cell gene expression and function. FASEB J. 1995, 9, 1577–1584. [Google Scholar] [CrossRef]
- Zhu, B.T. Mechanistic explanation for the unique pharmacologic properties of receptor partial agonists. Biomed. Pharmacother. 2005, 59, 76–89. [Google Scholar] [CrossRef]
- Clark, R.B.; Knoll, B.J.; Barber, R. Show all authors Partial agonists and G protein-coupled receptor desensitization. Review 1999, 20, 279–286. [Google Scholar]
- Smalley, K.S.M.; Haass, N.K.; Brafford, P.A.; Lioni, M.; Flaherty, K.T.; Herlyn, M. Multiple signaling pathways must be targeted to overcome drug resistance in cell lines derived from melanoma metastases. Mol. Cancer Ther. 2006, 5, 1136–1144. [Google Scholar] [CrossRef] [PubMed]
- Kitano, H. A robustness-based approach to systemsoriented drug design. Nat. Rev. Drug Discov. 2007, 6, 202–210. [Google Scholar] [CrossRef] [PubMed]
- Zimmermann, G.R.; Lehar, J.; Keith, C.T. Multi-target therapeutics: When the whole is greater than the sum of the parts. Drug Discov. Today 2007, 12, 34–42. [Google Scholar] [CrossRef] [PubMed]
- Podolsky, S.H.; Greene, J.A. Combination drugs–hype, harm, and hope. N. Engl. J. Med. 2011, 365, 488–491. [Google Scholar] [CrossRef]
- Ghavami, S.; Shojaei, S.; Yeganeh, B.; Ande, S.R.; Jangamreddy, J.R.; Mehrpour, M.; Christoffersson, J.; Chaabane, W.; Moghadam, A.R.; Kashani, H.H.; et al. Autophagy and apoptosis dysfunction in neurodegenerative disorders. Prog. Neurobiol. 2014, 112, 24–49. [Google Scholar] [CrossRef]
- Lopes, L.V.; Sebastião, A.M.; Ribeiro, J.A. Adenosine and related drugs in brain diseases: Present and future in clinical trials. Curr. Top. Med. Chem. 2011, 11, 1087–1101. [Google Scholar] [CrossRef]
- Jacobson, K.A.; Tosh, D.K.; Jain, S.; Gao, Z.G. Historical and Current Adenosine Receptor Agonists in Preclinical and Clinical Development Front. Cell. Neurosci. 2019, 13, 124. [Google Scholar] [CrossRef]
- Horita, T.K.; Kobayashi, M.; Mori, A.; Jenner, P.; Kanda, T. Effects of the adenosine A2A antagonist istradefylline on cognitive performance in rats with a 6-OHDA lesion in prefrontal cortex. Psychopharmacolog 2013, 230, 345–352. [Google Scholar] [CrossRef]
- Kondo, T.; Mizuno, Y.; Japanese Istradefylline Study Group. A long-term study of istradefylline safety and efficacy in patients with Parkinson disease. Clin. Neuropharmacol. 2015, 38, 41–46. [Google Scholar] [CrossRef]
- Pinna, A. Adenosine A2A receptor antagonists in Parkinson’s disease: Progress in clinical trials from the newly approved istradefylline to drugs in early development and those already discontinued. CNS Drugs 2014, 28, 455–474. [Google Scholar] [CrossRef] [PubMed]
- Uchida, S.I.; Tashiro, T.; Kawai-Uchida, M.; Mori, A.; Jenner, P.; Kanda, T. The Adenosine A2A-Receptor. Antagonist Istradefylline Enhances the Motor Response of L-DOPA without Worsening Dyskinesia inMPTP-Treated Common Marmosets. J. Pharmacol. Sci. 2014, 124, 480–485. [Google Scholar] [CrossRef] [PubMed]
- Agostini, M.; Tucci, P.; Melino, G. Cell death pathology: Perspective for human diseases. Biochem. Biophys. Res. Commun. 2011, 28, 414–451. [Google Scholar] [CrossRef] [PubMed]
- Pietkiewicz, S.; SchmidtInna, J.H.; Lavrik, N. Quantification of apoptosis and necroptosis at the single cell level by a combination of Imaging Flow Cytometry with classical Annexin V/propidium iodide staining. J. Immunol. Methods 2015, 423, 99–103. [Google Scholar] [CrossRef] [PubMed]
- Martí Navia, A.; Dal Ben, D.; Lambertucci, C.; Spinaci, A.; Volpini, R.; Marques-Morgado, I.; Coelho, J.E.; Lopes, L.V.; Marucci, G.; Buccioni, M. Adenosine Receptors as Neuroinflammation Modulators: Role of A1 Agonists and A2A Antagonists. Cells 2020, 9, 1739. [Google Scholar] [CrossRef] [PubMed]
- Antognoni, F.; Lianza, M.; Poli, F.; Buccioni, M.; Sntinelli, C.; Caprioli, G.; Iannarelli, R.; Lupidi, G.; Damiani, E.; Beghelli, D.; et al. Polar extracts from the berry-like fruits of Hypericum androsaemum L. as a promising ingredient in skin care formulations. J. Ethnopharmacol. 2017, 195, 255–265. [Google Scholar] [CrossRef]
- Fezai, M.; Slaymi, C.; Ben-Attia, M.; Kroemer, G.; Lang, F.; Jemaa, M. Inhibition of Colon Carcinoma Cell Migration Following Treatment with Purified Venom from Lesser Weever Fish (Trachinus Vipera). Cell. Physiol. Biochem. 2017, 41, 2279–2288. [Google Scholar] [CrossRef] [PubMed]
- Viswanathan, A.; Zhurina, A.; Assoah, B.; Paakkunainen, A.; Musa, A.; Kute, D.; Saravanan, K.M.; Yli-Harja, O.; Candeias, N.R.; Kandhavelu, M. Decane-1,2-diol derivatives as potential antitumor agents for the treatment of Glioblastoma. Eur. J. Pharmacol. 2018, 837, 105–116. [Google Scholar] [CrossRef]


| Compound | R1 | R2 | R3 | hA1 b Ki nM | hA2A c Ki nM | hA2B e EC50 nM | hA3 d Ki nM |
|---|---|---|---|---|---|---|---|
| 1 | H | OH | H | 816 | >30,000 | >30,000 | >30,000 |
| 2 | OH | H | H | 10.5 (±1.8) | 16,000 (±714) | >30,000 | 7190 (±510) |
| 3 | OH | H | Cl | 10.4 (±2) | 10,400 (±806) | >30,000 | 5300 (±1081) |
| CCPA | OH | OH | Cl | 1.2 (±0.2) | 2050 (±400) | 18,800 (±320) | 26 (±5) |

| Compound | R1 | R2 | hA1 b Ki nM | hA2A c Ki nM | hA2B e IC50 * Ki nM | hA3 d Ki nM |
|---|---|---|---|---|---|---|
| 4 | H | OCH2CH3 | 752 (±188) | 45 (±13) | 7940 (±1588) | >30,000 |
| 5 | H | 2-Furyl | 49 (±9) | 2.6 (±0.4) | 1000 (±100) | 4700 (±890) |
| 6 | OCH2CH3 | OCH2CH3 | 4247 (±842) | 32 (±6.3) | 4860 (±516) | 948 (±187) |
| ZM241385 | − | − | 255 (±35) | 1 (±0.18) | * 50 (±0.11) | >30,000 |
| Compound | Concentration 1 (μM) | Concentration 2 (μM) | Concentration 3 (μM) |
|---|---|---|---|
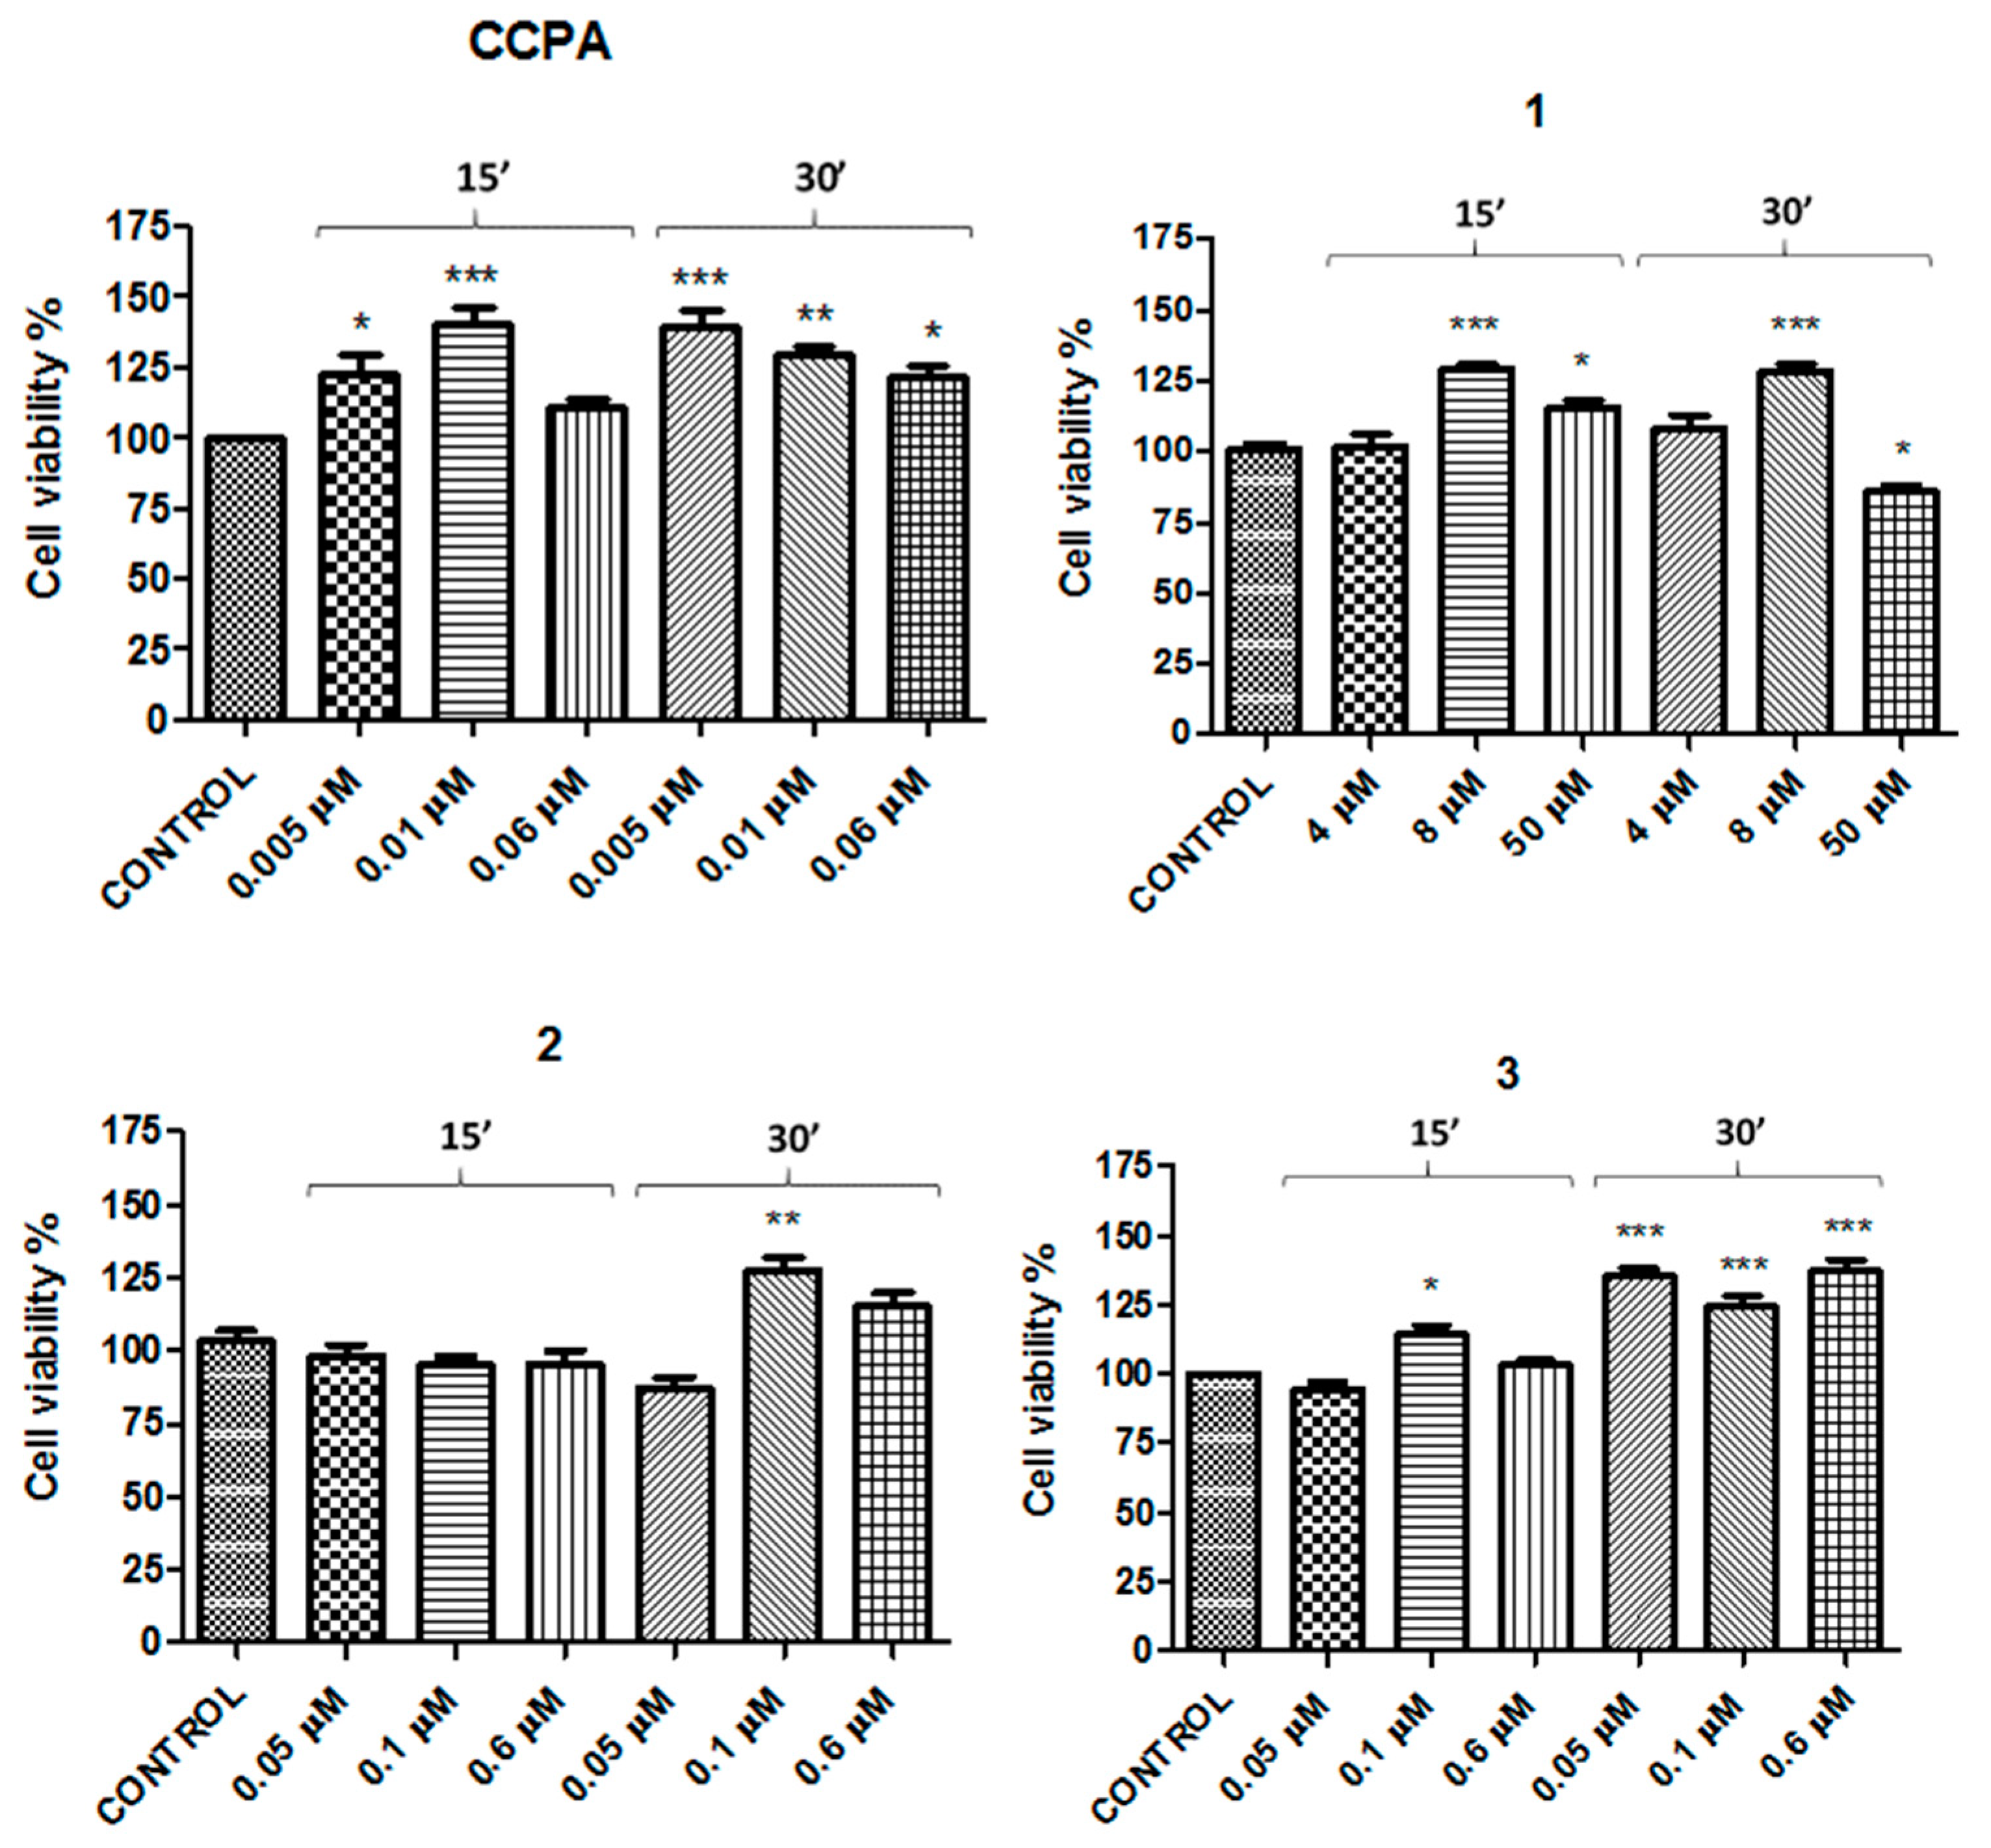
| CCPA | 0.005 | 0.01 | 0.06 |
| 1 | 4 | 8 | 50 |
| 2 | 0.05 | 0.1 | 0.6 |
| 3 | 0.05 | 0.1 | 0.6 |
| B. Concentrations of A2AAR ligands tested | |||
| ZM241385 | 0.005 | 0.01 | 0.06 |
| 4 | 0.2 | 0.45 | 2.7 |
| 5 | 0.02 | 0.04 | 0.25 |
| 6 | 0.15 | 0.3 | 2 |
Publisher’s Note: MDPI stays neutral with regard to jurisdictional claims in published maps and institutional affiliations. |
© 2021 by the authors. Licensee MDPI, Basel, Switzerland. This article is an open access article distributed under the terms and conditions of the Creative Commons Attribution (CC BY) license (http://creativecommons.org/licenses/by/4.0/).
Share and Cite
Marucci, G.; Ben, D.D.; Lambertucci, C.; Navia, A.M.; Spinaci, A.; Volpini, R.; Buccioni, M. Combined Therapy of A1AR Agonists and A2AAR Antagonists in Neuroinflammation. Molecules 2021, 26, 1188. https://doi.org/10.3390/molecules26041188
Marucci G, Ben DD, Lambertucci C, Navia AM, Spinaci A, Volpini R, Buccioni M. Combined Therapy of A1AR Agonists and A2AAR Antagonists in Neuroinflammation. Molecules. 2021; 26(4):1188. https://doi.org/10.3390/molecules26041188
Chicago/Turabian StyleMarucci, Gabriella, Diego Dal Ben, Catia Lambertucci, Aleix Martí Navia, Andrea Spinaci, Rosaria Volpini, and Michela Buccioni. 2021. "Combined Therapy of A1AR Agonists and A2AAR Antagonists in Neuroinflammation" Molecules 26, no. 4: 1188. https://doi.org/10.3390/molecules26041188
APA StyleMarucci, G., Ben, D. D., Lambertucci, C., Navia, A. M., Spinaci, A., Volpini, R., & Buccioni, M. (2021). Combined Therapy of A1AR Agonists and A2AAR Antagonists in Neuroinflammation. Molecules, 26(4), 1188. https://doi.org/10.3390/molecules26041188