
Cyclodextrin Complexed Lipid Nanoparticles of Irbesartan for Oral Applications: Design, Development, and In Vitro Characterization

Abstract
:1. Introduction
2. Materials and Methods
2.1. Quantification of IR by HPLC
2.2. Phase Solubility Studies:
2.3. Preparation of Physical Mixture
2.4. Preparation of SDs
2.5. Drug Content
2.6. Inclusion Efficiency
2.7. In Vitro Dissolution Study
2.8. Dissolution Studies
2.9. Dissolution Efficiency (DE)
2.9.1. Mean Dissolution Rate (MDR)
2.9.2. Mean Dissolution Time (MDT)
2.9.3. Initial Dissolution Rate (IDR)
2.10. Preparation of IR-SLNs and IR-CD-SLNs
2.11. Preparation of IR Suspension (IR-CS)
2.12. Characterization of IR-SLNs and IR-CD-SLNs
2.12.1. Particle Size (PS), Polydispersity Index (PDI), and Zeta Potential (ZP)
2.12.2. Drug Content
2.12.3. Entrapment Efficiency (EE)
2.12.4. In Vitro Release Studies
2.12.5. Lyophilization
2.13. Solid-State Characterization
2.13.1. Differential Scanning Calorimetry (DSC)
2.13.2. Powder X-ray Diffraction (PXRD)
2.13.3. Stability Studies of IR-CD, IR-SLN, and IR-CD-SLN
2.13.4. Statistical Analysis
3. Results and Discussion
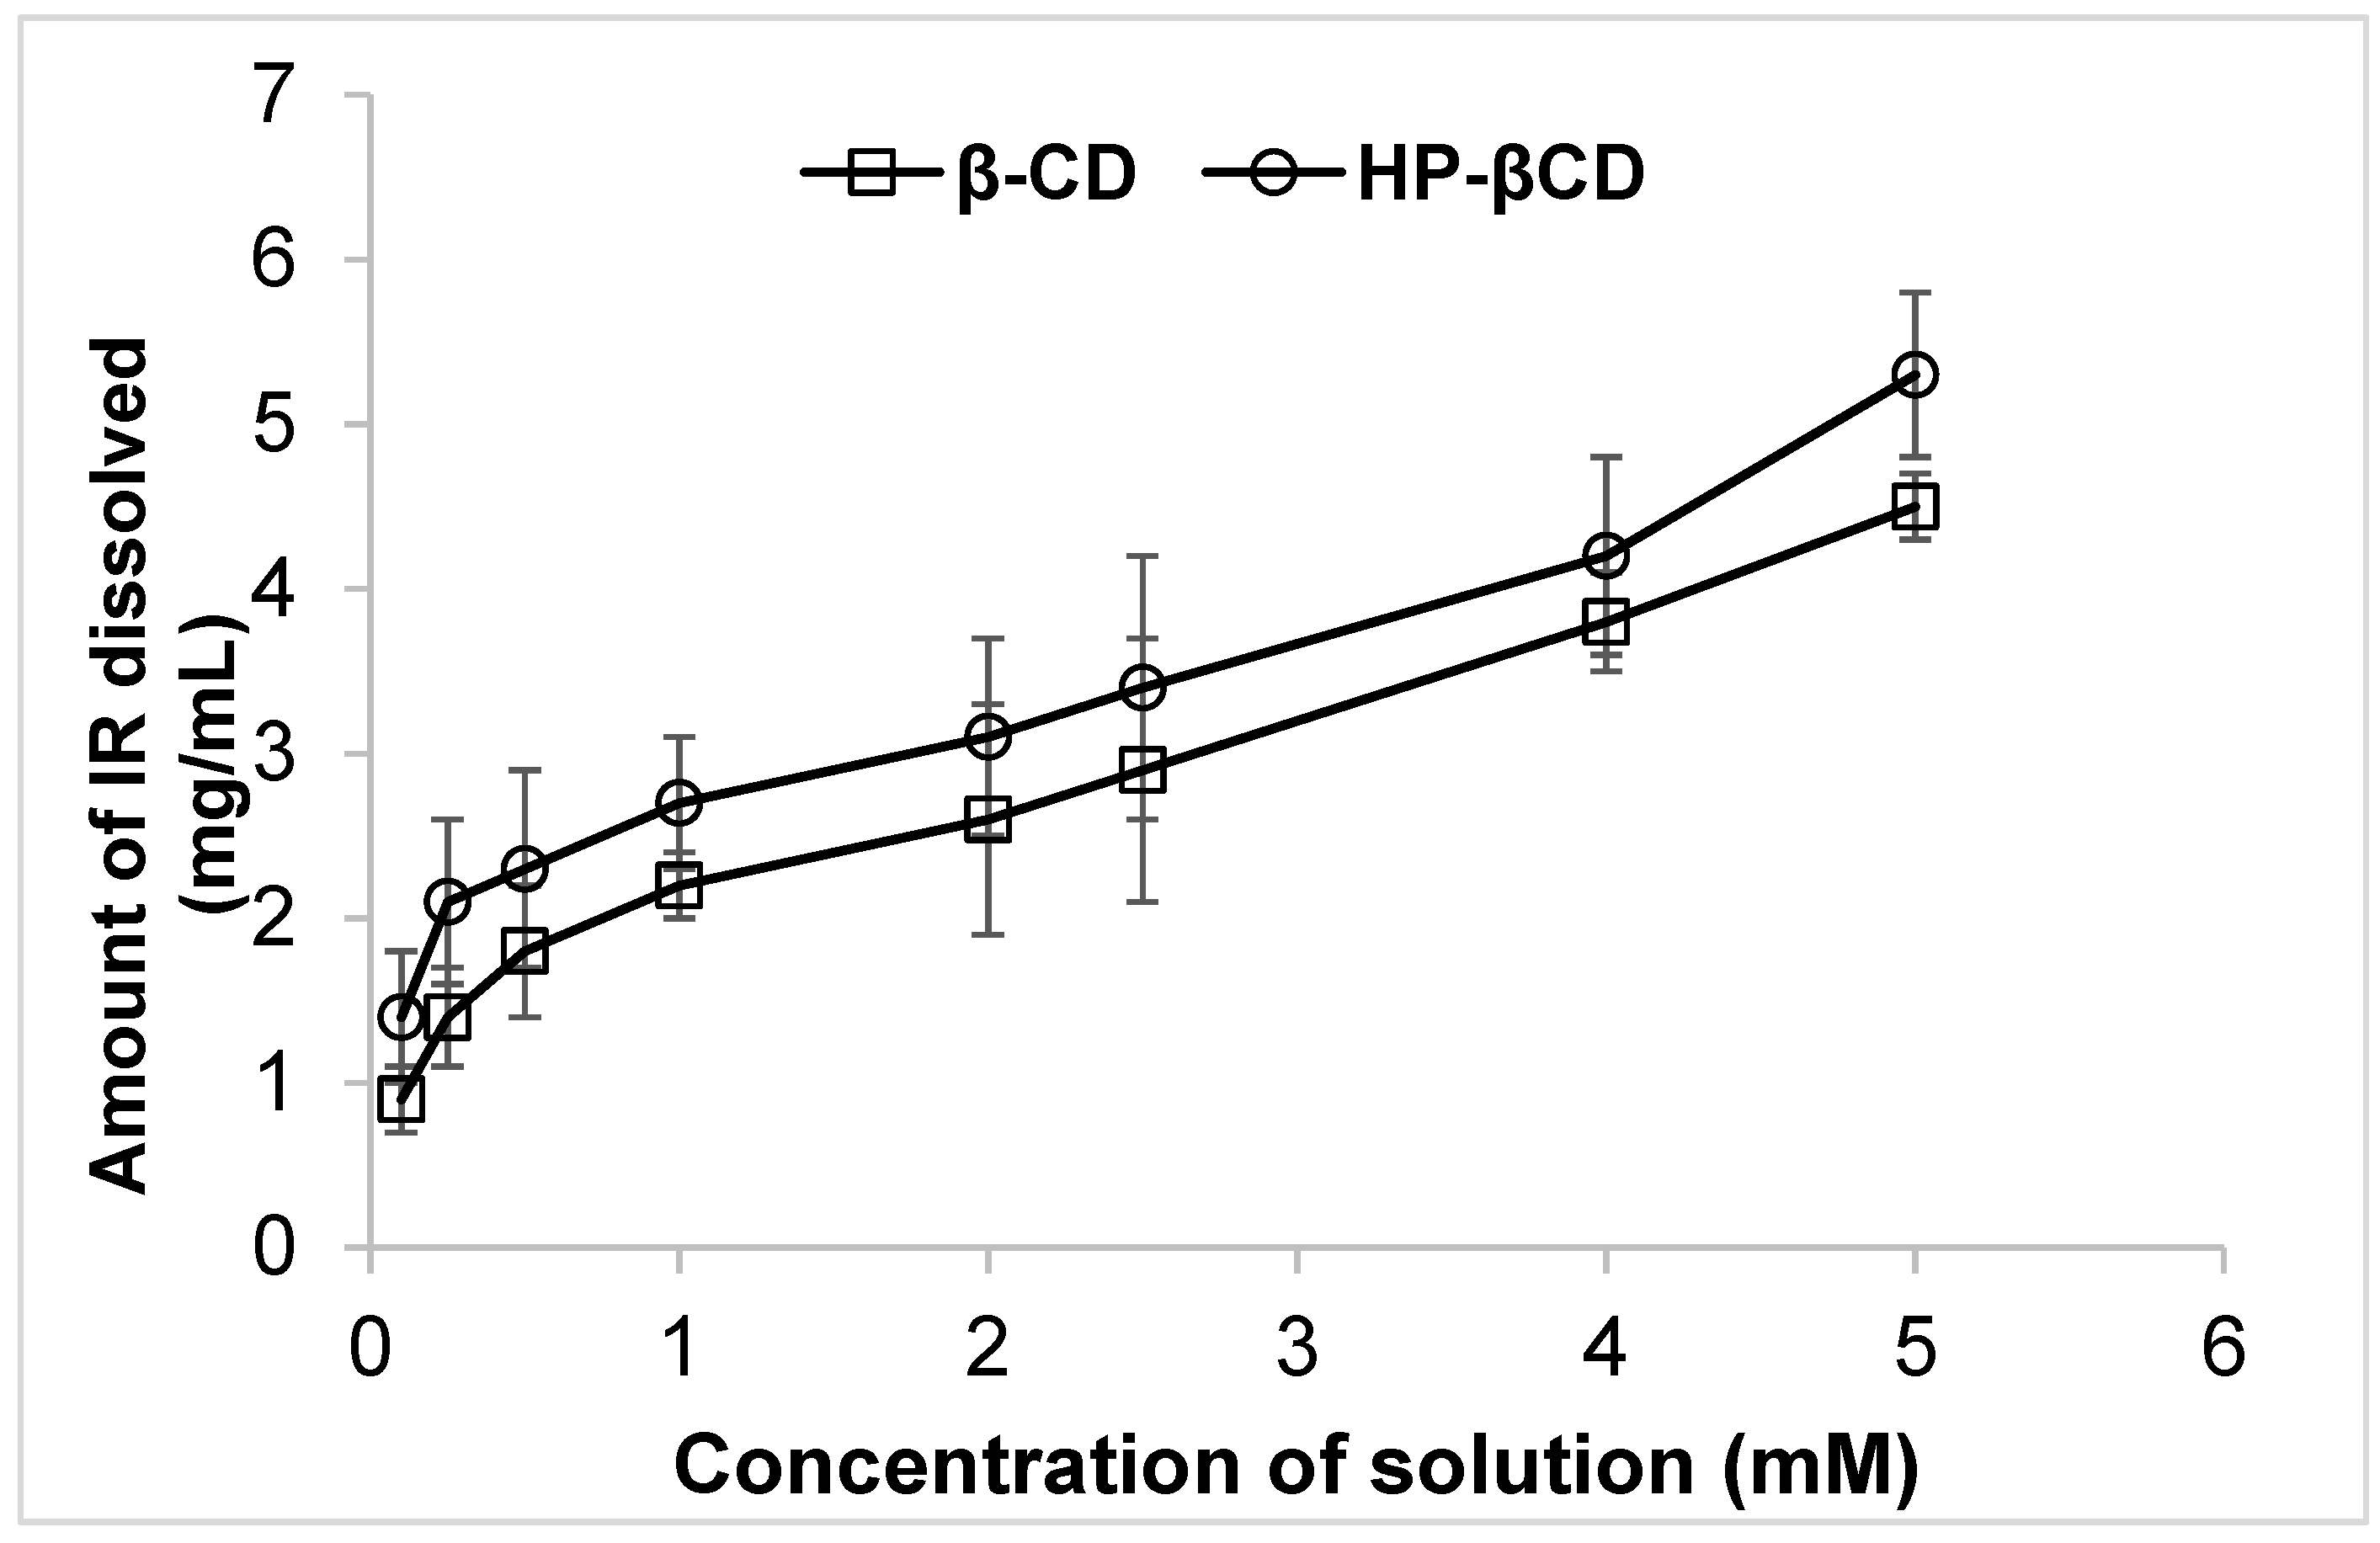
3.1. Phase Solubility Studies
3.2. Drug Content and Inclusion Efficiency
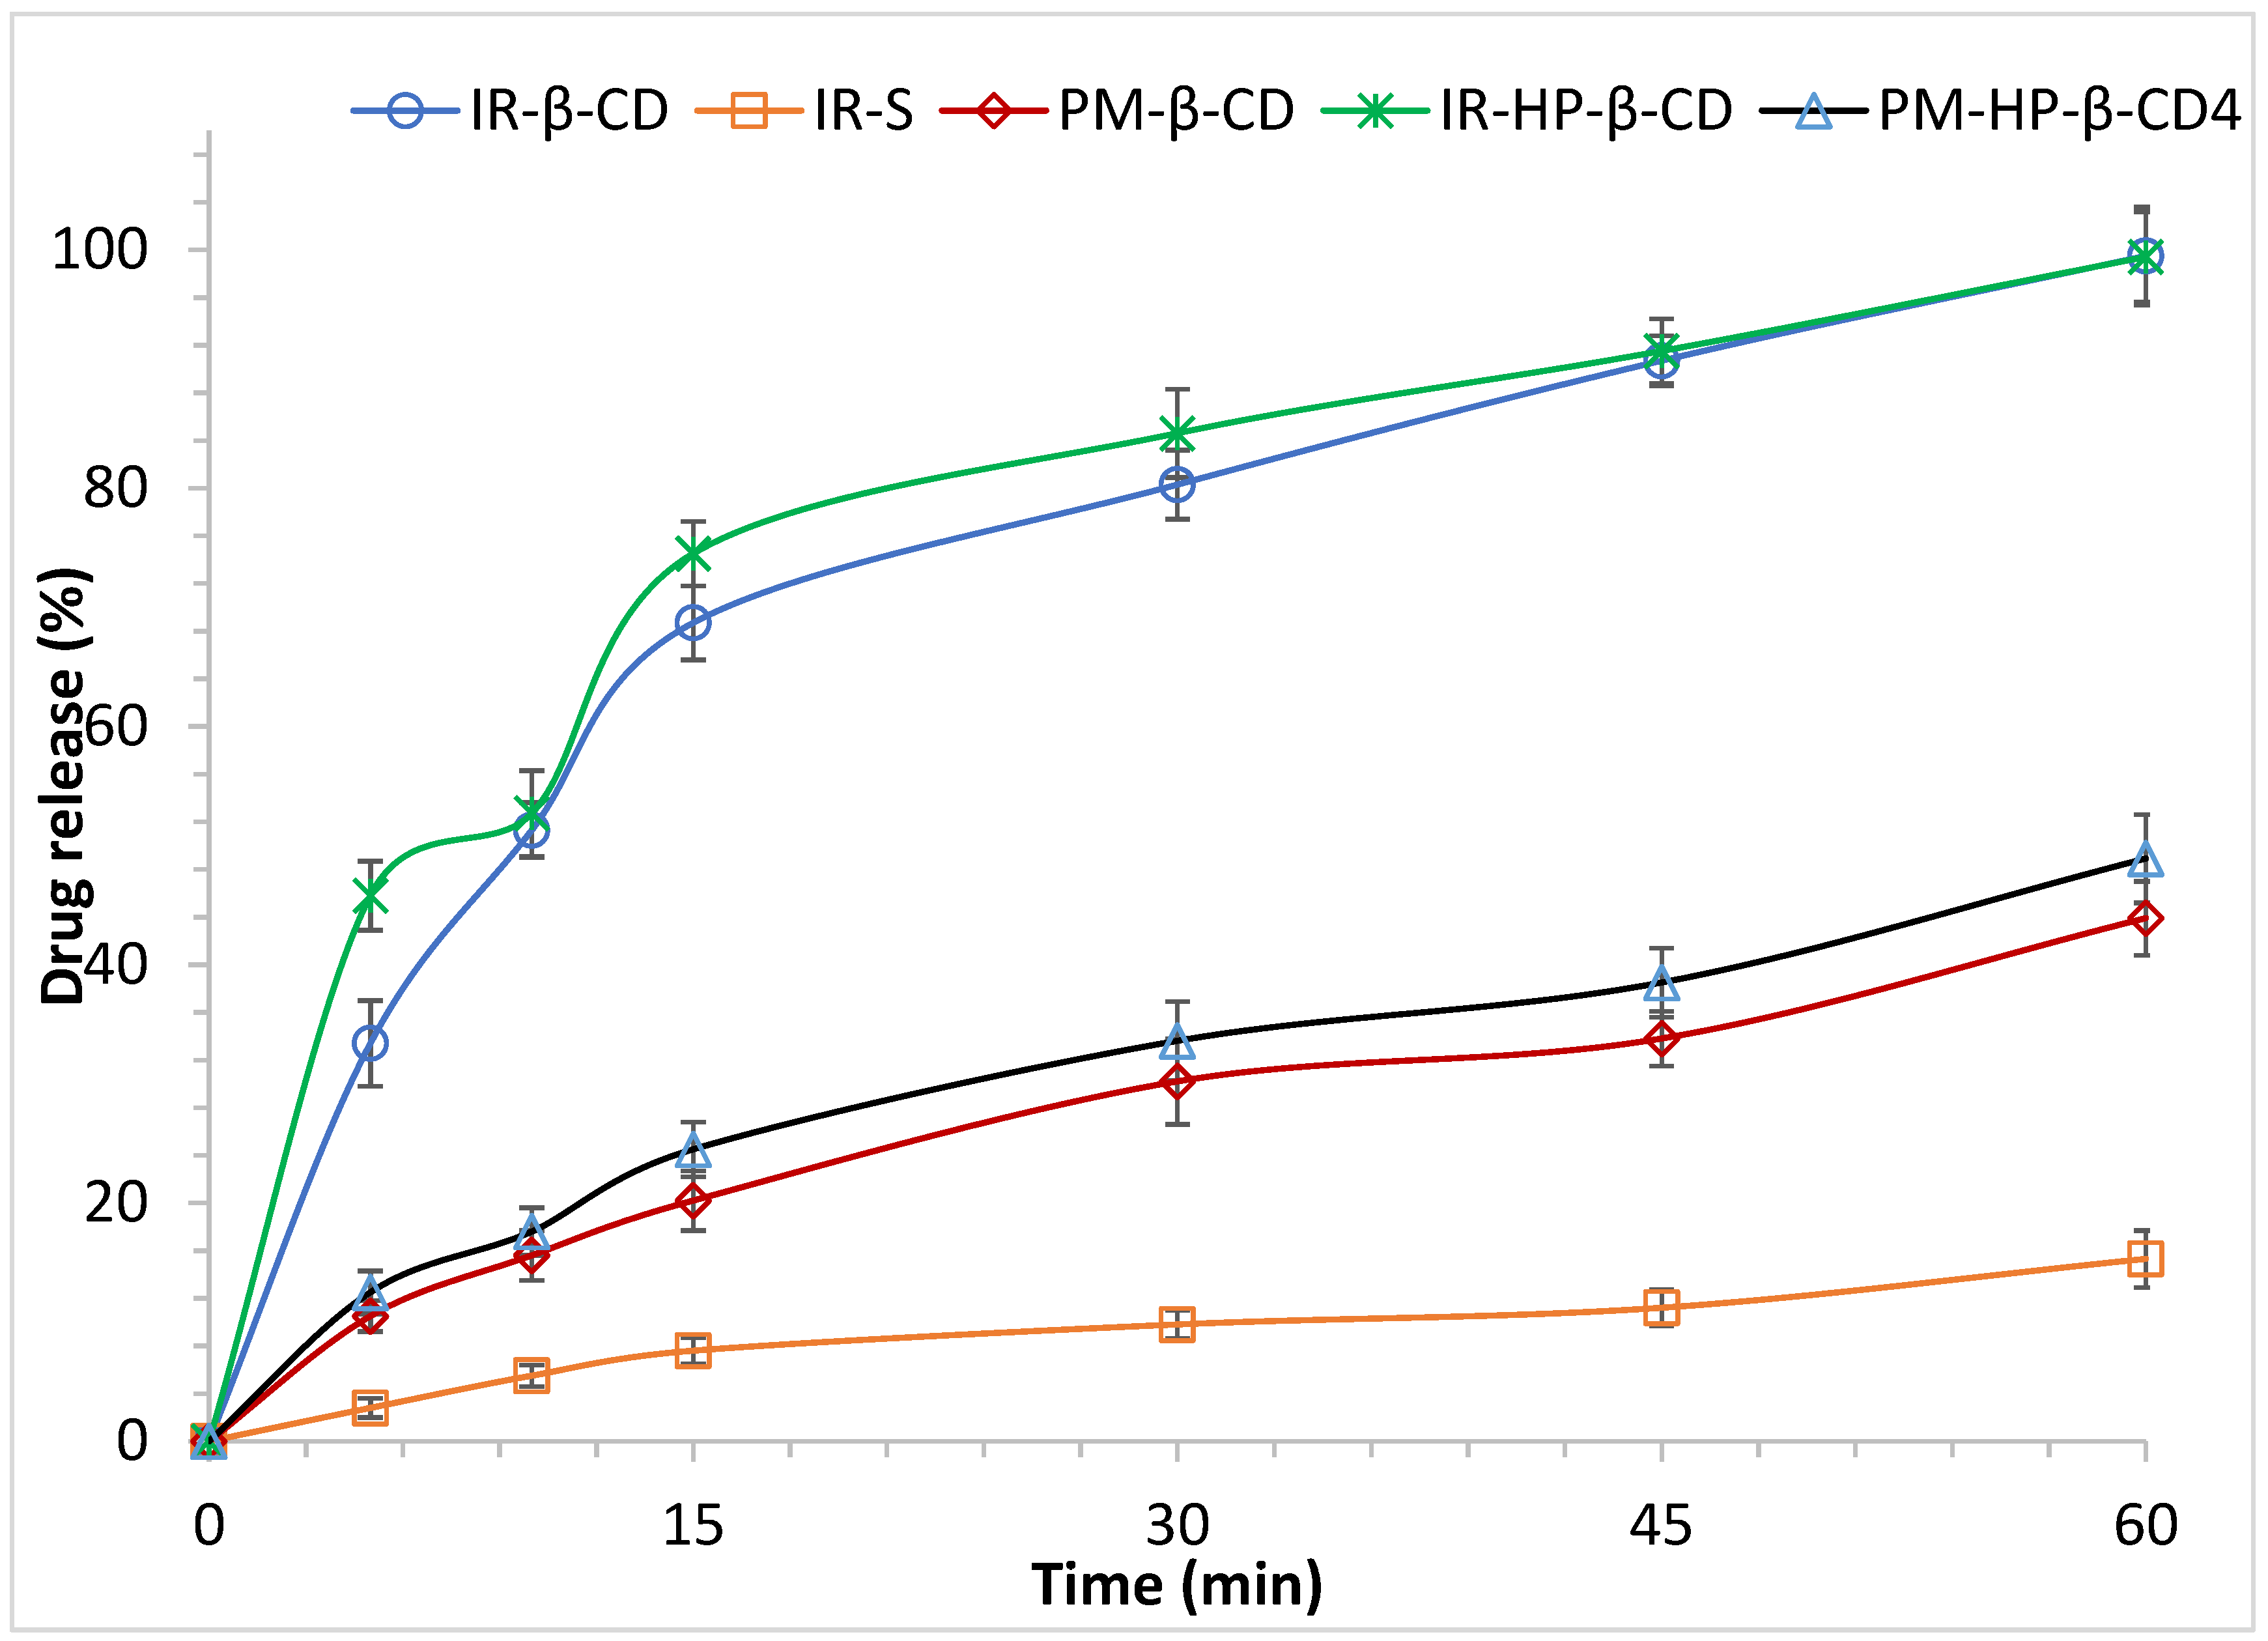
3.3. Analysis of Dissolution Data
3.4. IR-SLNs and IR-CD-SLNs
3.5. PS, PDI, and ZP of IR-SLNs and IR-CD-SLNs
3.6. Assay and EE of IR-SLNs and IR-CD-SLNs
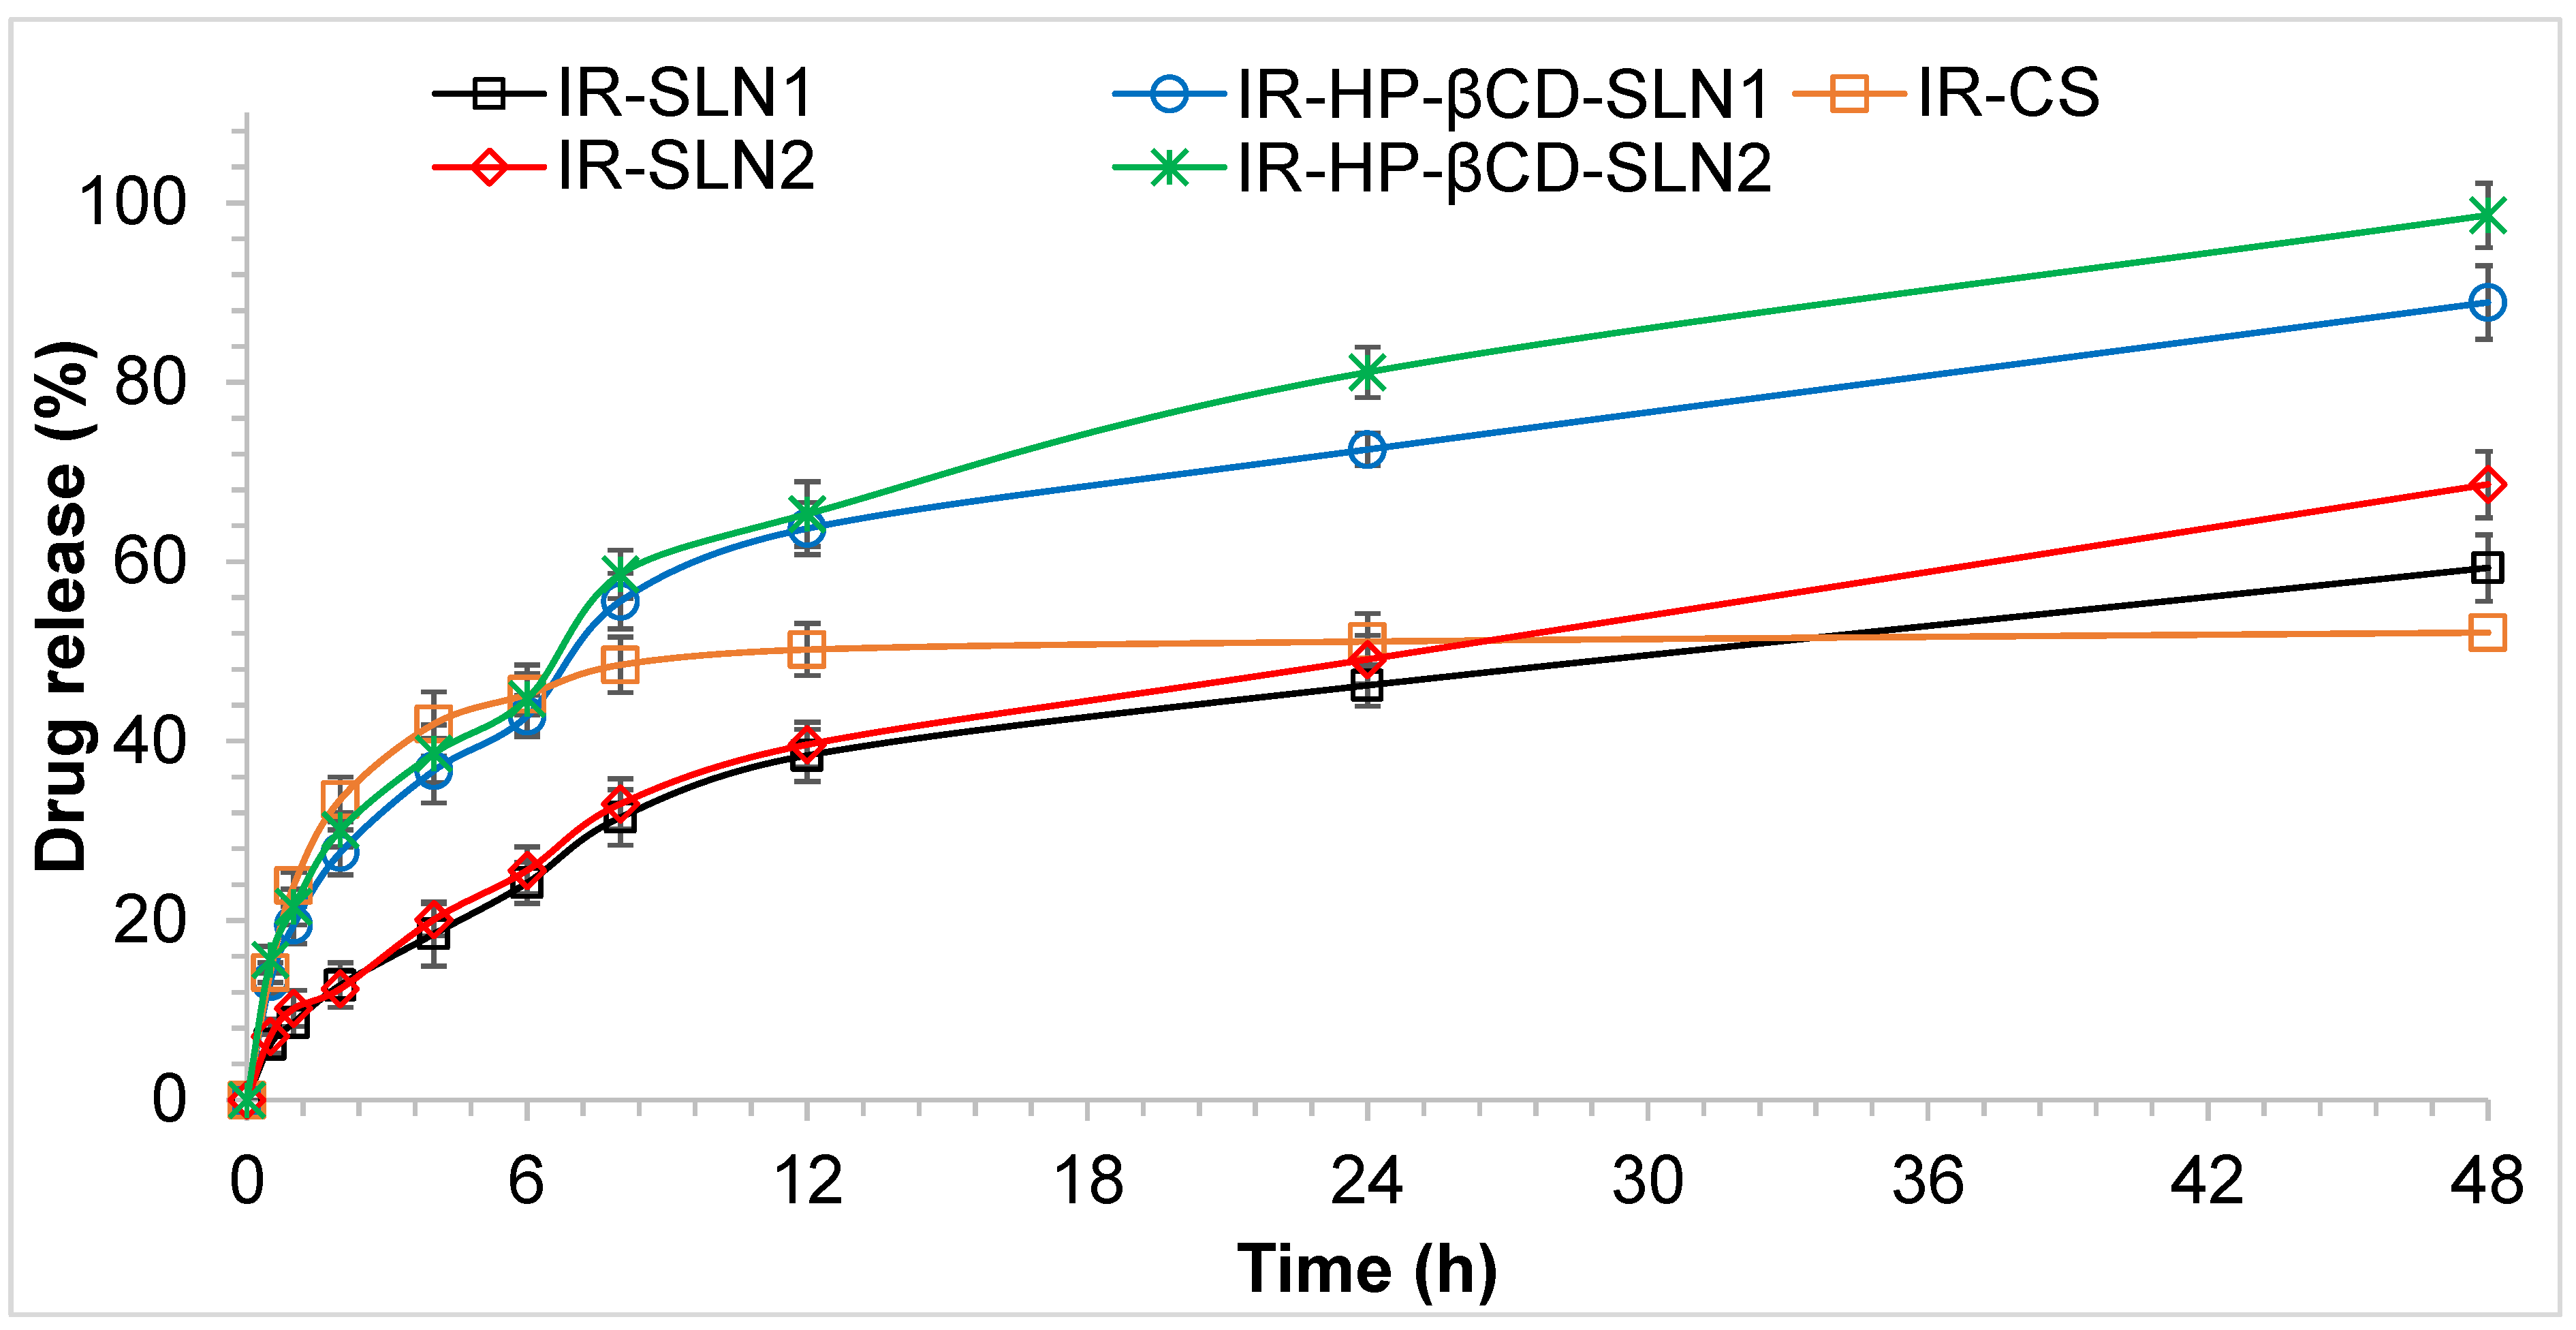
3.7. In Vitro Release Studies of IR-SLNs and IR-CD-SLNs
3.8. Stability Studies of the Optimized SLNs Formulation
3.9. Lyophilization
3.10. DSC
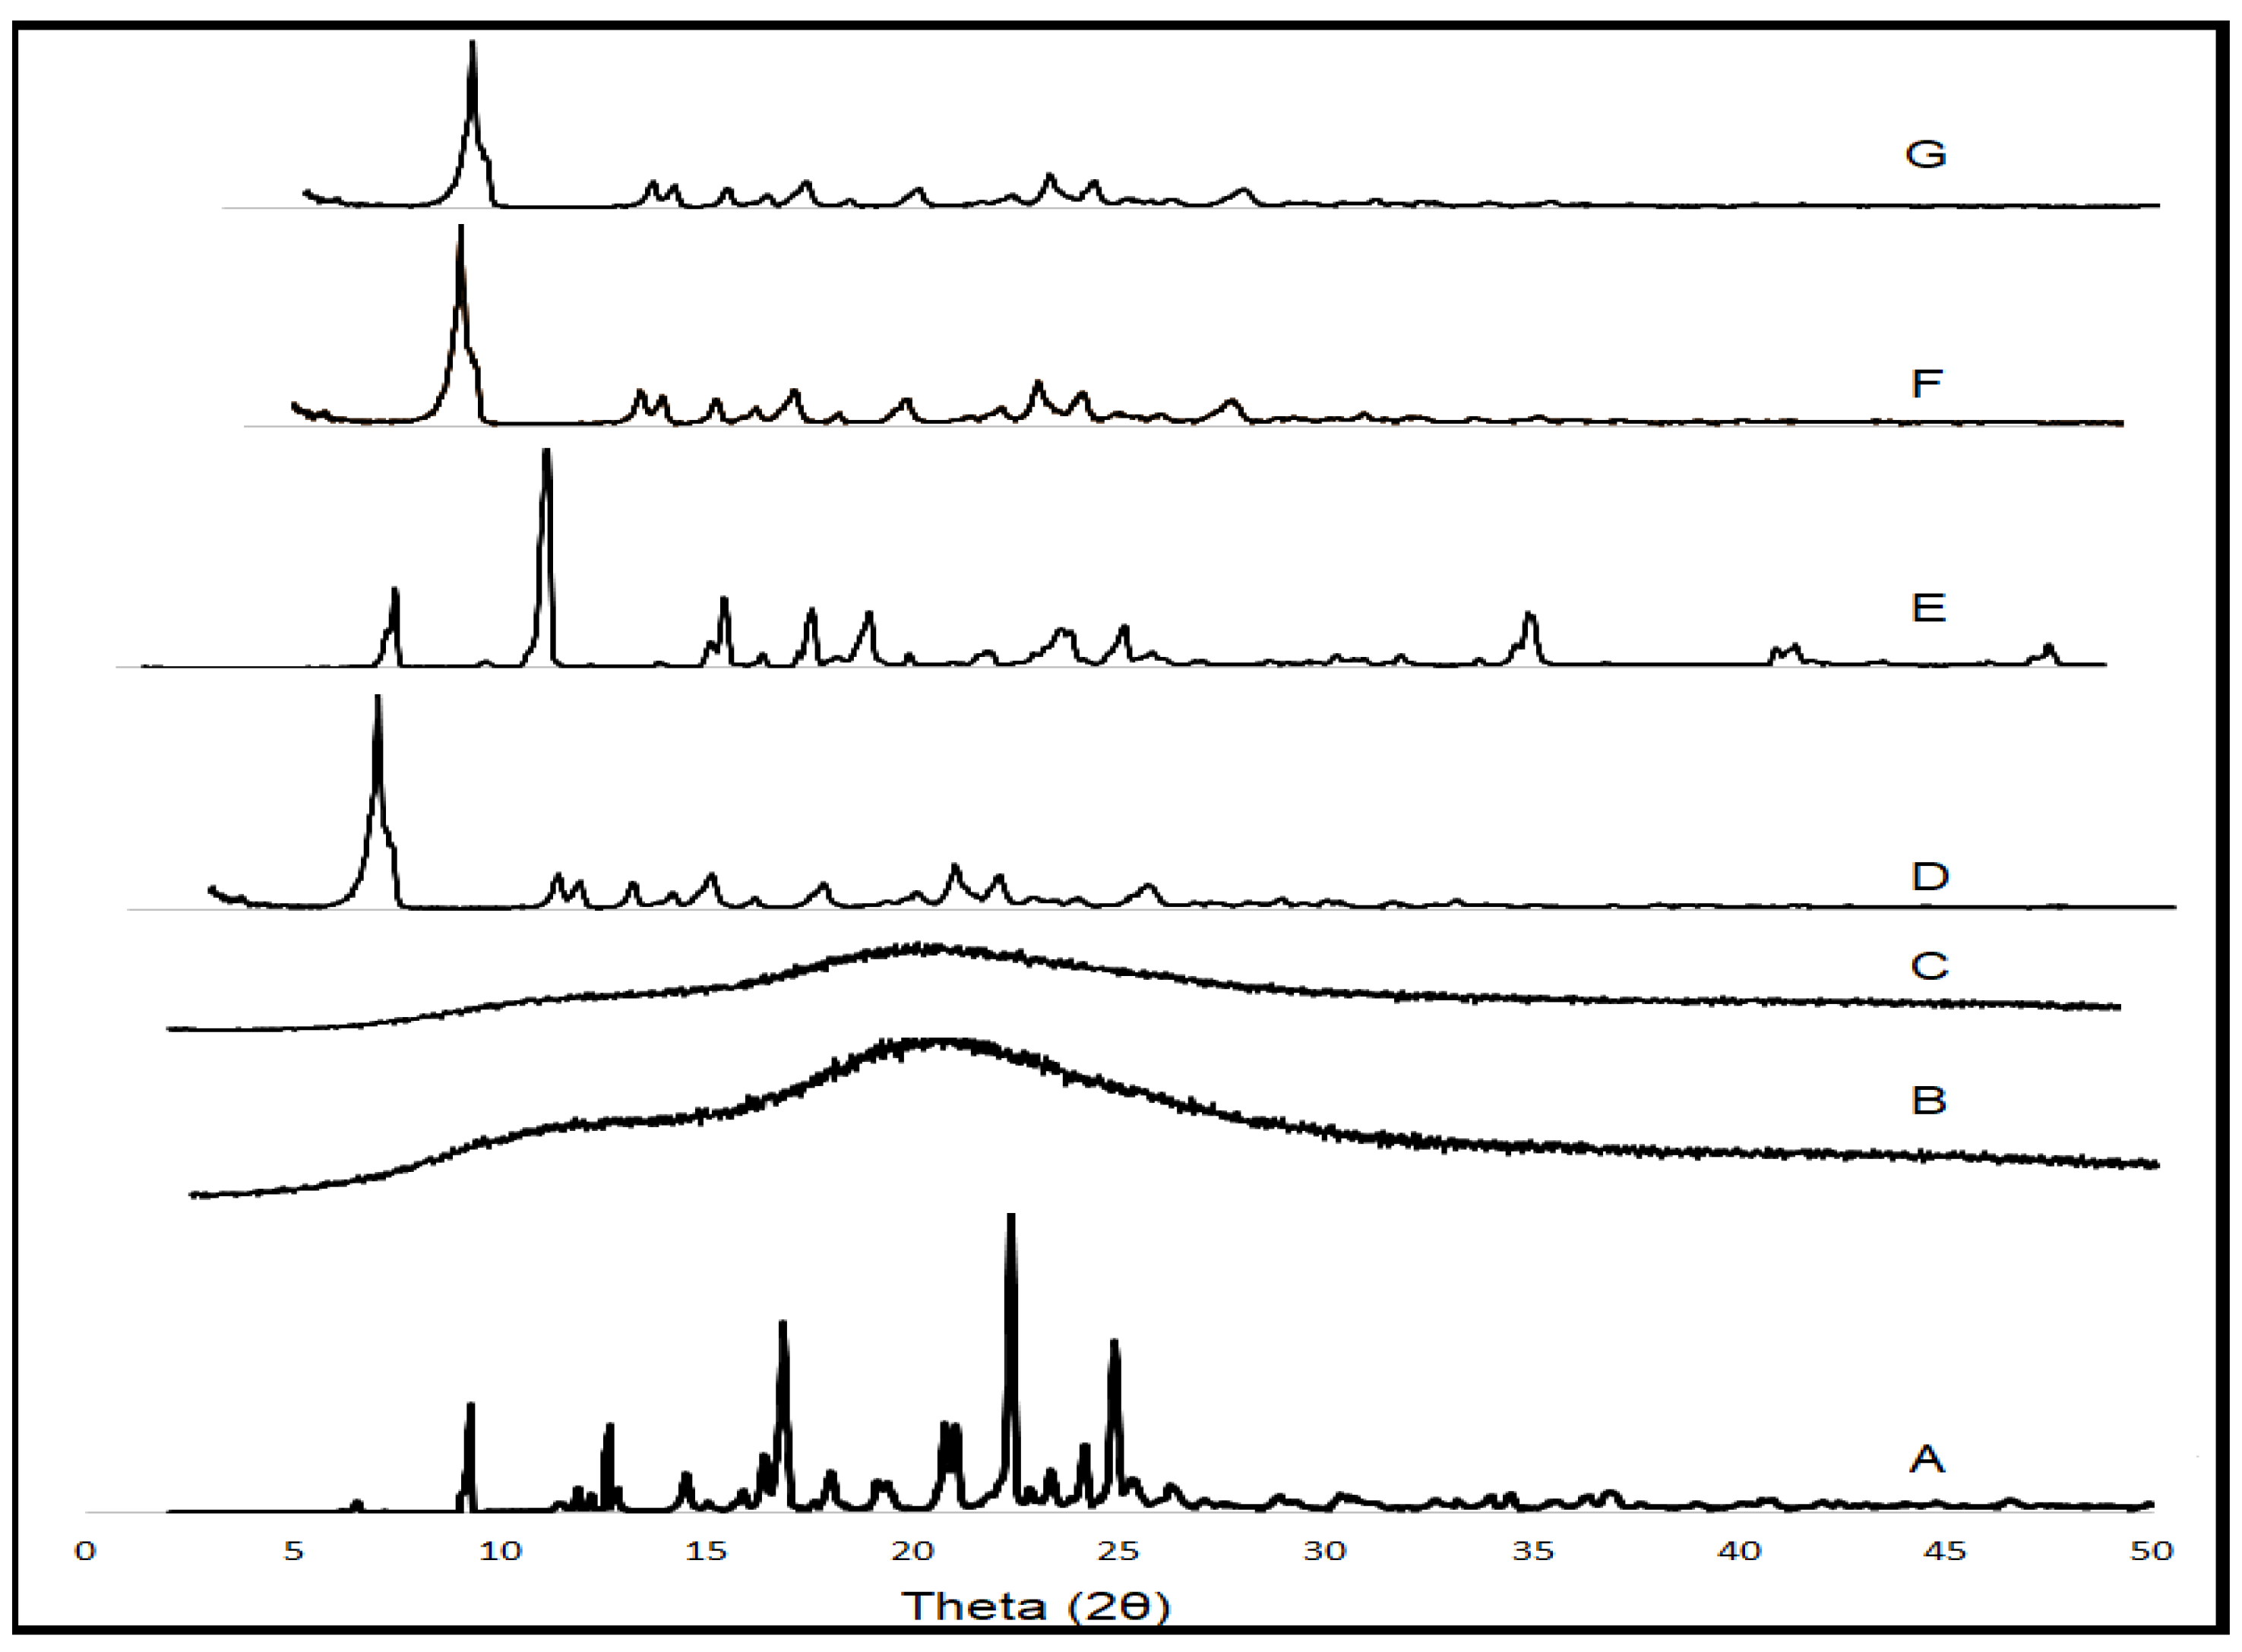
3.11. PXRD
4. Conclusions
Author Contributions
Funding
Data Availability Statement
Conflicts of Interest
Sample Availability
References
- Alqahtani, M.S.; Kazi, M.; Alsenaidy, M.A.; Ahmad, M.Z. Advances in Oral Drug Delivery. Front. Pharmacol. 2021, 12, 62. [Google Scholar] [CrossRef] [PubMed]
- Prasad, V.; De Jesus-Morales, K.; Mailankody, S. The High Price of Anticancer Drugs: Origins, Implications, Barriers, Solutions. Nat. Rev. Clin. Oncol. 2017, 14, 381–390. [Google Scholar] [CrossRef]
- Dudhipala, N. A Comprehensive Review on Solid Lipid Nanoparticles as Delivery Vehicle for Enhanced Pharmacokinetic and Pharmacodynamic Activity of Poorly Soluble Drugs. Int. J. Pharm. Sci. Nanotechnol. 2019, 12, 20. [Google Scholar] [CrossRef]
- Bummer, P.M. Physical Chemical Considerations of Lipid-Based Oral Drug Delivery-Solid Lipid Nanoparticles. CRT 2004, 21, 1–20. [Google Scholar] [CrossRef]
- Aungst, B.J. Absorption Enhancers: Applications and Advances. AAPS J. 2012, 14, 10–18. [Google Scholar] [CrossRef] [Green Version]
- Gaucher, G.; Dufresne, M.-H.; Sant, V.P.; Kang, N.; Maysinger, D.; Leroux, J.-C. Block Copolymer Micelles: Preparation, Characterization and Application in Drug Delivery. J. Control. Release 2005, 109, 169–188. [Google Scholar] [CrossRef]
- Blagden, N.; de Matas, M.; Gavan, P.T.; York, P. Crystal Engineering of Active Pharmaceutical Ingredients to Improve Solubility and Dissolution Rates. Adv. Drug Deliv. Rev. 2007, 59, 617–630. [Google Scholar] [CrossRef] [PubMed]
- Lu, J.; Shah, S.; Jo, S.; Majumdar, S.; Gryczke, A.; Kolter, K.; Langley, N.; Repka, M.A. Investigation of Phase Diagrams and Physical Stability of Drug–Polymer Solid Dispersions. Pharm. Dev. Technol. 2015, 20, 105–117. [Google Scholar] [CrossRef] [PubMed]
- Loftsson, T.; Brewster, M.E. Pharmaceutical Applications of Cyclodextrins. 1. Drug Solubilization and Stabilization. J. Pharm. Sci. 1996, 85, 1017–1025. [Google Scholar] [CrossRef]
- Shirodkar, R.K.; Kumar, L.; Mutalik, S.; Lewis, S. Solid Lipid Nanoparticles and Nanostructured Lipid Carriers: Emerging Lipid Based Drug Delivery Systems. Pharm. Chem. J. 2019, 53, 440–453. [Google Scholar] [CrossRef]
- Dudhipala, N. Influence of solid lipid nanoparticles on pharmaco-dynamic activity of poorly oral bioavailable drugs. Int. J. Pharm. Sci. Nanotechnol. 2020, 13, 4979–4983. [Google Scholar] [CrossRef]
- MuÈller, R.H.; MaÈder, K.; Gohla, S. Solid Lipid Nanoparticles (SLN) for Controlled Drug Delivery ± a Review of the State of the Art. Eur. J. Pharm. Biopharm. 2000, 17, 161–177. [Google Scholar] [CrossRef]
- Hines, J.; Fluharty, S.J.; Sakai, R.R. The Angiotensin AT1 Receptor Antagonist Irbesartan Has Near-Peptide Affinity and Potently Blocks Receptor Signaling. Eur. J. Pharmacol. 1999, 384, 81–89. [Google Scholar] [CrossRef]
- Puri, V.; Nagpal, M.; Sharma, A.; Thakur, G.S.; Singh, M.; Aggarwal, G. Development of Binary Dispersions and Nanocomposites of Irbesartan with Enhanced Antihypertensive Activity. Bioimpacts 2020, 10, 269–278. [Google Scholar] [CrossRef]
- Rajeswari, K.R.; Brungi, V.; Bennuru, S.; Cheeli, S.; Vankadari, R.G. Studies on the Development of Orally Disintegrating Tablets of Irbesartan. Asian J. Pharm. Res. 2020, 10, 01–07. [Google Scholar] [CrossRef]
- Vyas, A.; Saraf, S.; Saraf, S. Cyclodextrin Based Novel Drug Delivery Systems. J. Incl. Phenom. Macrocycl. Chem. 2008, 20, 23–42. [Google Scholar] [CrossRef]
- Leonis, G.; Christodoulou, E.; Ntountaniotis, D.; Chatziathanasiadou, M.; Mavromoustakos, T.; Naziris, N.; Chountoulesi, M.; Demetzos, C.; Valsami, G.; Damalas, D.; et al. Antihypertensive Activity and Molecular Interactions of Irbesartan in Complex with 2-hydroxypropyl-β-cyclodextrin. Chem. Biol. Drug Des. 2020, 96, 668–683. [Google Scholar] [CrossRef] [PubMed]
- Liossi, A.S.; Ntountaniotis, D.; Kellici, T.F.; Chatziathanasiadou, M.V.; Megariotis, G.; Mania, M.; Becker-Baldus, J.; Kriechbaum, M.; Krajnc, A.; Christodoulou, E.; et al. Exploring the Interactions of Irbesartan and Irbesartan–2-Hydroxypropyl-β-Cyclodextrin Complex with Model Membranes. Biochim. Biophys. Acta Biomembr. 2017, 1859, 1089–1098. [Google Scholar] [CrossRef]
- Soma, D.; Attari, Z.; Reddy, M.S.; Damodaram, A.; Koteshwara, K.B.G. Solid Lipid Nanoparticles of Irbesartan: Preparation, Characterization, Optimization and Pharmacokinetic Studies. Braz. J. Pharm. Sci. 2017, 53, 1–10. [Google Scholar] [CrossRef] [Green Version]
- Alanazi, A.M.; Abdelhameed, A.S.; Khalil, N.Y.; Khan, A.A.; Darwish, I.A. HPLC Method with Monolithic Column for Simultaneous Determination of Irbesartan and Hydrochlorothiazide in Tablets. Acta Pharm. 2014, 64, 187–198. [Google Scholar] [CrossRef] [Green Version]
- Nicolescu, C.; Aram, C.; Nedelcu, A.; Monciu, C.-M. Phase solubility studies of the inclusion complexes of repaglinide with β-cyclodextrin and β-cyclodextrin derivatives. Farmacia 2010, 58, 620–628. [Google Scholar]
- Hirlekar, R.; Kadam, V. Preformulation Study of the Inclusion Complex Irbesartan-β-Cyclodextrin. AAPS PharmSciTech 2009, 10, 276–281. [Google Scholar] [CrossRef] [Green Version]
- Dudhipala, N.; Veerabrahma, K. Pharmacokinetic and Pharmacodynamic Studies of Nisoldipine-Loaded Solid Lipid Nanoparticles Developed by Central Composite Design. Drug Dev. Ind. Pharm. 2015, 41, 1968–1977. [Google Scholar] [CrossRef]
- Gondrala, U.K.; Dudhipala, N.; Kishan, V. Preparation, Characterization and In Vivo Evaluation of Felodipine Solid-Lipid Nanoparticles for Improved Oral Bioavailability. Int. J. Pharm. Sci. Nanotechnol. 2015, 8, 9. [Google Scholar]
- Dudhipala, N.; Puchchakayala, G. Capecitabine Lipid Nanoparticles for Anti-Colon Cancer Activity in 1,2-Dimethylhydrazine-Induced Colon Cancer: Preparation, Cytotoxic, Pharmacokinetic, and Pathological Evaluation. Drug Dev. Ind. Pharm. 2018, 44, 1572–1582. [Google Scholar] [CrossRef] [PubMed]
- Thirupathi, G.; Swetha, E.; Narendar, D. Role of Isradipine Loaded Solid Lipid Nanoparticles on the Pharmacodynamic Effect in Rats. Drug Res. 2017, 67, 163–169. [Google Scholar] [CrossRef] [PubMed]
- Nagaraj, K.; Narendar, D.; Kishan, V. Development of Olmesartan Medoxomil Optimized Nanosuspension Using the Box-Behnken Design to Improve Oral Bioavailability. Drug Dev. Ind. Pharm. 2017, 43, 1186–1196. [Google Scholar] [CrossRef]
- Dudhipala, N.; Janga, K.Y.; Gorre, T. Comparative Study of Nisoldipine-Loaded Nanostructured Lipid Carriers and Solid Lipid Nanoparticles for Oral Delivery: Preparation, Characterization, Permeation and Pharmacokinetic Evaluation. Artif. Cells Nanomed. Biotechnol. 2018, 46, 616–625. [Google Scholar] [CrossRef]
- Youssef, A.; Dudhipala, N.; Majumdar, S. Ciprofloxacin Loaded Nanostructured Lipid Carriers Incorporated into In-Situ Gels to Improve Management of Bacterial Endophthalmitis. Pharmaceutics 2020, 12, 572. [Google Scholar] [CrossRef]
- Liu, L.; Guo, Q.-X. The Driving Forces in the Inclusion Complexation of Cyclodextrins. J. Incl. Phenom. Macrocycl. Chem. 2002, 42, 1–14. [Google Scholar] [CrossRef]
- Narendar, D.; Ettireddy, S. Influence of β-Cyclodextrin and Hydroxypropyl-β-Cyclodextrin on Enhancement of Solubility and Dissolution of Isradipine. Int. J. Pharm. Sci. Nanotechnol. 2017, 10, 3752–3757. [Google Scholar]
- Challa, R.; Ahuja, A.; Ali, J.; Khar, R.K. Cyclodextrins in Drug Delivery: An Updated Review. AAPS PharmSciTech 2005, 6, E329–E357. [Google Scholar] [CrossRef]
- Higuchi, T. A Phase Solubility Technique. Adv. Anal. Chem. Instrum. 1965, 4, 117–211. [Google Scholar]
- Loftsson, T.; Vogensen, S.B.; Brewster, M.E.; Konráðsdóttir, F. Effects of Cyclodextrins on Drug Delivery through Biological Membranes. J. Pharm. Sci. 2007, 96, 2532–2546. [Google Scholar] [CrossRef] [PubMed]
- Connors, K.A. Population Characteristics of Cyclodextrin Complex Stabilities in Aqueous Solution. J. Pharm. Sci. 1995, 84, 843–848. [Google Scholar] [CrossRef] [PubMed]
- Torrado, S.; Torrado, S.; Torrado, J.J.; Cadórniga, R. Preparation, Dissolution and Characterization of Albendazole Solid Dispersions. Int. J. Pharm. 1996, 140, 247–250. [Google Scholar] [CrossRef]
- Podczeck, F.; Jones, B.E. The In Vitro Dissolution of Theophylline from Different Types of Hard Shell Capsules. Drug Dev. Ind. Pharm. 2002, 28, 1163–1169. [Google Scholar] [CrossRef]
- Loftsson, T.; Másson, M.; Brewster, M.E. Self-Association of Cyclodextrins and Cyclodextrin Complexes. J. Pharm. Sci. 2004, 93, 1091–1099. [Google Scholar] [CrossRef]
- Brewster, M.E.; Loftsson, T. Cyclodextrins as Pharmaceutical Solubilizers. Adv. Drug Deliv. Rev. 2007, 59, 645–666. [Google Scholar] [CrossRef]
- Messner, M.; Kurkov, S.V.; Jansook, P.; Loftsson, T. Self-Assembled Cyclodextrin Aggregates and Nanoparticles. Int. J. Pharm. 2010, 387, 199–208. [Google Scholar] [CrossRef]
- Youssef, A.A.A.; Cai, C.; Dudhipala, N.; Majumdar, S. Design of Topical Ocular Ciprofloxacin Nanoemulsion for the Management of Bacterial Keratitis. Pharmaceuticals 2021, 14, 210. [Google Scholar] [CrossRef]
- Khan, A.A.; Mudassir, J.; Mohtar, N.; Darwis, Y. Advanced Drug Delivery to the Lymphatic System: Lipid-Based Nanoformulations. Int J. Nanomed. 2013, 8, 2733–2744. [Google Scholar] [CrossRef] [Green Version]
- Yuan, H.; Chen, J.; Du, Y.-Z.; Hu, F.-Q.; Zeng, S.; Zhao, H.-L. Studies on Oral Absorption of Stearic Acid SLN by a Novel Fluorometric Method. Colloids Surf. B Biointerfaces 2007, 58, 157–164. [Google Scholar] [CrossRef] [PubMed]
- Bhattacharjee, S. DLS and Zeta Potential–What They Are and What They Are Not? J. Control. Release 2016, 235, 337–351. [Google Scholar] [CrossRef] [PubMed]
- Dudhipala, N.; Veerabrahma, K. Improved Anti-Hyperlipidemic Activity of Rosuvastatin Calcium via Lipid Nanoparticles: Pharmacokinetic and Pharmacodynamic Evaluation. Eur. J. Pharm. Biopharm. 2017, 110, 47–57. [Google Scholar] [CrossRef] [PubMed]
- Hou, D.; Xie, C.; Huang, K.; Zhu, C. The Production and Characteristics of Solid Lipid Nanoparticles (SLNs). Biomaterials 2003, 24, 1781–1785. [Google Scholar] [CrossRef]
- Haneef, J.; Chadha, R. Drug-Drug Multicomponent Solid Forms: Cocrystal, Coamorphous and Eutectic of Three Poorly Soluble Antihypertensive Drugs Using Mechanochemical Approach. AAPS PharmSciTech 2017, 18, 2279–2290. [Google Scholar] [CrossRef]
- Cirri, M.; Maestrini, L.; Maestrelli, F.; Mennini, N.; Mura, P.; Ghelardini, C.; Di Cesare Mannelli, L. Design, Characterization and in Vivo Evaluation of Nanostructured Lipid Carriers (NLC) as a New Drug Delivery System for Hydrochlorothiazide Oral Administration in Pediatric Therapy. Drug Deliv. 2018, 25, 1910–1921. [Google Scholar] [CrossRef]
- Westesen, K.; Bunjes, H.; Koch, M.H.J. Physicochemical Characterization of Lipid Nanoparticles and Evaluation of Their Drug Loading Capacity and Sustained Release Potential. J. Control. Release 1997, 48, 223–236. [Google Scholar] [CrossRef]
- Dudhipala, N.R.; Ettireddy, S.R.; Puchakayala, G.R. Attenuation of lipid levels in triton induced hyperlipidemia rats through rosuvastatin calcium nanoparticles: Pharmacokinetic and pharmacodynamic studies. Chem. Phys. Lipids 2021, 237, 105081. [Google Scholar] [CrossRef]
- Pikal, M.J.; Shah, S.; Roy, M.L.; Putman, R. The Secondary Drying Stage of Freeze Drying: Drying Kinetics as a Function of Temperature and Chamber Pressure. Int. J. Pharm. 1990, 60, 203–207. [Google Scholar] [CrossRef]
- Dudhipala, N.; Ay, A.A. Amelioration of ketoconazole in lipid nanoparticles for enhanced antifungal activity and bioavailability through oral administration for management of fungal infections. Chem. Phys. Lipids 2020, 232, 104953. [Google Scholar] [CrossRef] [PubMed]
- Zhang, Z.-L.; Le, Y.; Wang, J.-X.; Chen, J.-F. Preparation of Stable Micron-Sized Crystalline Irbesartan Particles for the Enhancement of Dissolution Rate. Drug Dev. Ind. Pharm. 2011, 37, 1357–1364. [Google Scholar] [CrossRef]
- Su, J.; Chen, J.; Li, L.; Li, B.; Shi, L.; Zhang, H.; Ding, X. Preparation of Natural Borneol/2-Hydroxypropyl-β-Cyclodextrin Inclusion Complex and Its Effect on the Absorption of Tetramethylpyrazine Phosphate in Mouse. Chem. Pharm. Bull. 2012, 60, 736–742. [Google Scholar] [CrossRef] [PubMed] [Green Version]
- Mobley, W.; Schreier, H. Phase Transition Temperature Reduction and Glass Formation in Dehydroprotected Lyophilized Liposomes. J. Control. Release 1994, 31, 73–87. [Google Scholar] [CrossRef]
- Dudhipala, N.; Veerabrahma, K. Candesartan cilexetil loaded solid lipid nanoparticles for oral delivery: Characterization, pharmacokinetic and pharmacodynamic evaluation. Drug Deliv. 2016, 23, 395–404. [Google Scholar] [CrossRef] [PubMed] [Green Version]
- Kamble, R.; Gaikwad, S.; Maske, A.; Patil, S. Fabrication of Elecrospun Nanofibres of BCS II Drug for Enhanced Dissolution and Permeation across Skin. J. Adv. Res. 2016, 7, 483–489. [Google Scholar] [CrossRef] [PubMed] [Green Version]
- Mokhtar, M.S.; Suliman, F.O.; Elbashir, A.A. Experimental and Molecular Modeling Investigations of Inclusion Complexes of Imazapyr with 2-Hydroxypropyl(β/γ) Cyclodextrin. J. Mol. Liq. 2018, 262, 504–513. [Google Scholar] [CrossRef]
- Dudhipala, N.; Gorre, T. Neuroprotective effect of ropinirole lipid nanoparticles enriched hydrogel for parkinson’s disease: In vitro, ex vivo, pharmacokinetic and pharmacodynamic evaluation. Pharmaceutics 2020, 12, 448. [Google Scholar] [CrossRef] [PubMed]


| Formulations | Drug Content (%) | Inclusion Efficiency (%) | Solubility Parameters at 25 °C | |
|---|---|---|---|---|
| Solubility (mg/mL) | Folds Improved | |||
| Water | - | - | 0.1 ± 0.03 | - |
| PM βCD (1:1) | 89.1 ± 2.4 | 68.3 ± 2.1 | 0.8 ± 0.3 | 8 |
| PM HP-βCD (1:1) | 92.9 ± 1.7 | 71.5 ± 1.8 | 1.2 ± 0.1 | 12 |
| IR βCD (1:1) | 93.6 ± 1.2 | 75.2 ± 2.3 | 1.8 ± 0.5 | 18 |
| IR βCD (1:2.5) | 92.3 ± 2.5 | 85.2 ± 1.7 | 2.3 ± 0.3 | 23 |
| IR βCD (1:4) | 96.6 ± 3.1 | 93.9 ± 2.2 | 3.4 ± 0.4 | 34 |
| IR HP-βCD (1:1) | 96.2 ± 1.9 | 80.6 ± 2.2 | 2.5 ± 0.3 | 25 |
| IR HP-βCD (1:2.5) | 95.3 ± 2.1 | 86.2 ± 1.7 | 3.2 ± 0.6 | 32 |
| IR HP-βCD (1:4) | 98.2 ± 3.0 | 95.6 ± 3.1 | 4.8 ± 0.8 | 48 |
| Formulation | Dissolution Parameter | ||||||
|---|---|---|---|---|---|---|---|
| Q15 | Q60 | DE15 | DE60 | MDT | MDR | IDR | |
| IR * | 7.6 | 15.3 | 12.5 | 21.1 | 24.2 | 0.2 | 1.2 |
| PM-βCD | 27.7 | 40.7 | 21.9 | 31.2 | 23.0 | 0.5 | 1.8 |
| IR-βCD (1:4) | 68.7 | 76.2 | 28.4 | 59.4 | 15.5 | 1.3 | 4.4 |
| PM HP-βCD | 29.9 | 43.9 | 12.5 | 52.5 | 22.2 | 1.2 | 1.9 |
| IR-HP-βCD (1:4) | 76.9 | 94.4 | 35.3 | 72.4 | 13.4 | 1.6 | 5.1 |
| Composition | IR-SLN1 | IR-HP-βCD-SLN1 | IR-SLN2 | IR-HP-βCD-SLN2 |
|---|---|---|---|---|
| Irbesartan (mg) | 10 | - | 10 | - |
| Irbesartan + HPβCD (mg) * | - | 52.6 | - | 52.6 |
| Glyceryl monostearate (mg) | 200 | 200 | - | - |
| Dyanasn 112 (mg) | - | - | 200 | 200 |
| Soyalecithin | 200 | 200 | 200 | 200 |
| Poloxamer 188 (mg) | 150 | 150 | 150 | 150 |
| Double distilled water up to (mL) | 10 | 10 | 10 | 10 |
| Formulation | Size (nm) | PDI | ZP (mV) | Assay (%) | EE (%) |
|---|---|---|---|---|---|
| IR-SLN1 | 300.7 ± 4.8 | 0.29 ± 0.08 | −20.5 ± 4.1 | 99.2 ± 1.4 | 89.1 ± 2.8 |
| IR-HP-βCD-SLN1 | 339.9 ± 8.3 | 0.28 ± 0.02 | −22.6 ± 3.4 | 98.4 ± 1.8 | 86.9 ± 1.8 |
| IR-SLN2 | 240.2 ± 6.7 | 0.19 ± 0.05 | −29.4 ± 4.8 | 98.7 ± 1.5 | 90.6 ± 4.3 |
| IR-HP-βCD-SLN2 | 257.6 ± 5.1 | 0.21 ± 0.03 | −30.5 ± 4.1 | 99.8 ± 2.5 | 93.7 ± 2.5 |
| Day | IR-HP-βCD-SLN2 | IR-SLN2 | ||||||||
|---|---|---|---|---|---|---|---|---|---|---|
| Size (nm) | PDI | ZP (mV) | Assay (%) | EE (%) | Size (nm) | PDI | ZP (mV) | Assay (%) | EE (%) | |
| 1 | 251.4 ± 7.6 | 0.21 ± 0.03 | −30.5 ± 4.1 | 99.8 ± 2.5 | 92.4 ± 1.6 | 234.8 ± 7.2 | 0.20 ± 0.02 | −29.1 ± 3.1 | 97.9 ± 1.9 | 91.1 ± 2.5 |
| 30 | 261.5 ± 3.9 | 0.23 ± 0.05 | −28.6 ± 2.0 | 97.6 ± 1.7 | 90.7 ± 2.2 | 244.3 ± 5.9 | 0.21 ± 0.04 | −28.2 ± 2.7 | 98.3 ± 2.1 | 90.2 ± 1.9 |
| 60 | 276.6 ± 5.8 | 0.23 ± 0.06 | −27.9 ± 2.9 | 96.9 ± 2.6 | 90.1 ± 1.9 | 256.3 ± 8.6 | 0.22 ± 0.05 | −29.6 ± 4.4 | 96.8 ± 1.5 | 88.6 ± 2.2 |
| Formulation | Pre-lyophilization | Post-lyophilization | ||||||||
|---|---|---|---|---|---|---|---|---|---|---|
| Size (nm) | PDI | ZP (mV) | Assay (%) | EE (%) | Size (nm) | PDI | ZP (mV) | Assay (%) | EE (%) | |
| IR-HP-βCD-SLN2 | 270.3 ± 8.6 | 0.24 ± 0.05 | −28.9 ± 2.7 | 98.1 ± 1.6 | 91.6 ± 1.9 | 465.7 ± 10.5 | 0.43 ± 0.06 | −26.5 ± 1.3 | 97.6 ± 2.1 | 92.3 ± 1.6 |
| IR-SLN2 | 251.3 ± 4.9 | 0.21 ± 0.02 | −31.9 ± 1.8 | 99.3 ± 2.0 | 89.6 ± 1.7 | 410.6 ± 11.9 | 0.23 ± 0.06 | −29.3 ± 2.3 | 97.6 ± 2.7 | 88.9 ± 2.1 |
Publisher’s Note: MDPI stays neutral with regard to jurisdictional claims in published maps and institutional affiliations. |
© 2021 by the authors. Licensee MDPI, Basel, Switzerland. This article is an open access article distributed under the terms and conditions of the Creative Commons Attribution (CC BY) license (https://creativecommons.org/licenses/by/4.0/).
Share and Cite
Dudhipala, N.; Ettireddy, S.; Youssef, A.A.A.; Puchchakayala, G. Cyclodextrin Complexed Lipid Nanoparticles of Irbesartan for Oral Applications: Design, Development, and In Vitro Characterization. Molecules 2021, 26, 7538. https://doi.org/10.3390/molecules26247538
Dudhipala N, Ettireddy S, Youssef AAA, Puchchakayala G. Cyclodextrin Complexed Lipid Nanoparticles of Irbesartan for Oral Applications: Design, Development, and In Vitro Characterization. Molecules. 2021; 26(24):7538. https://doi.org/10.3390/molecules26247538
Chicago/Turabian StyleDudhipala, Narendar, Swetha Ettireddy, Ahmed Adel Ali Youssef, and Goverdhan Puchchakayala. 2021. "Cyclodextrin Complexed Lipid Nanoparticles of Irbesartan for Oral Applications: Design, Development, and In Vitro Characterization" Molecules 26, no. 24: 7538. https://doi.org/10.3390/molecules26247538
APA StyleDudhipala, N., Ettireddy, S., Youssef, A. A. A., & Puchchakayala, G. (2021). Cyclodextrin Complexed Lipid Nanoparticles of Irbesartan for Oral Applications: Design, Development, and In Vitro Characterization. Molecules, 26(24), 7538. https://doi.org/10.3390/molecules26247538