Article

Electrochemical Detection of Dopamine at Fe3O4/SPEEK Modified Electrode

by
Mogomotsi N. Ranku
1,2,
Gloria E. Uwaya
1,2 and
Omolola E. Fayemi
1,2,*
1
Department of Chemistry, Faculty of Natural and Agricultural Sciences, North-West University (Mafikeng Campus), Private Bag X2046, Mmabatho 2735, South Africa
2
Material Science Innovation and Modelling (MaSIM) Research Focus Area, Faculty of Natural and Agricultural Sciences, North-West University (Mafikeng Campus), Private Bag X2046, Mmabatho 2735, South Africa
*
Author to whom correspondence should be addressed.
Molecules 2021, 26(17), 5357; https://doi.org/10.3390/molecules26175357
Submission received: 4 August 2021 / Revised: 26 August 2021 / Accepted: 26 August 2021 / Published: 3 September 2021

Abstract

:
Reported here is the design of an electrochemical sensor for dopamine (DA) based on a screen print carbon electrode modified with a sulphonated polyether ether ketone-iron (III) oxide composite (SPCE-Fe3O4/SPEEK). L. serica leaf extract was used in the synthesis of iron (III) oxide nanoparticles (Fe3O4NPs). Successful synthesis of Fe3O4NP was confirmed through characterization using Fourier transform infrared (FTIR), ultraviolet–visible light (UV–VIS), X-ray diffractometer (XRD), and scanning electron microscopy (SEM). Cyclic voltammetry (CV) was used to investigate the electrochemical behaviour of Fe3O4/SPEEK in 0.1 M of phosphate buffer solution (PBS) containing 5 mM of potassium ferricyanide (III) solution (K3[Fe(CN)6]). An increase in peak current was observed at the nanocomposite modified electrode SPCE-Fe3O4/SPEEK) but not SPCE and SPCE-Fe3O4, which could be ascribed to the presence of SPEEK. CV and square wave voltammetry (SWV) were employed in the electroxidation of dopamine (0.1 mM DA). The detection limit (LoD) of 7.1 μM and 0.005 μA/μM sensitivity was obtained for DA at the SPCE-Fe3O4/SPEEK electrode with concentrations ranging from 5–50 μM. LOD competes well with other electrodes reported in the literature. The developed sensor demonstrated good practical applicability for DA in a DA injection with good resultant recovery percentages and RSDs values.

Graphical Abstract

1. Introduction

Dopamine (3,4-dihydroxyphenethylamine), an organic chemical of the catecholamine neurotransmitters, is one of the most researched neurotransmitters (NTs) because of its major role in the human body such as in the hormonal, renal, central, and cardiovascular systems, and the human metabolism [1,2,3,4,5,6,7]. DA plays an important role within and outside the brain’s rewards system by reinforcing certain behaviour that results in rewards. In addition, DA controls movements, emotional response functions as a vasodilator, and expands the urine output in the pancreas and kidneys by reducing the formation of insulin. However, elevated dopamine concentration in the brain could cause many neurological disorders such as Tourette’s syndrome, restless leg syndrome (RLS), and several illnesses such as drug dependence, schizophrenia, Parkinson’s disease, depression, degenerative diseases, and attention deficit hyperactivity disorder (ADHD) [8,9,10,11,12,13,14]. As a result, maintaining and controlling the high levels of DA in the human body is important. The health import of DA calls for the need to develop a cost-effective, simple, sensitive, and selective assay with a fast response for DA investigation in pharmaceutical samples.
Different assays such as chromatography [15,16], chemiluminescence [17], fluorescence [18], and electrochemistry [19,20,21,22] is employed for DA detection. The use of electrochemistry has found wide attraction among the various methods owing to high selectivity, sensitivity, simple instrumentation with a fast response, and cost-effectiveness [19,20,21,22]. Iron (III) oxide (Fe3O4) nanoparticles are one of the most researched forms of iron oxides due to their attractive characteristics, which include low toxicity, biocompatibility, super magnetism, high surface area, and low cost [23]. Fe3O4 nanoparticles have found applications in catalysis, magnetic resonance imaging contrast, lithium batteries, antibacterial studies, and the removal of heavy metals such as arsenic in water [24]. Fe3O4 nanoparticles are prepared via a chemical process [25,26,27] or biological (green) methods [23,24]. SPEEK, a non-fluorinated polymer, has found application in electrochemical studies owing to its properties such as excellent stability (chemical, thermal, and mechanical), good thermo-oxidative resistance, and proton conductivity [28]. Polymer metal oxide composites are used as electrode modifiers in electrochemical studies, because of the interactions of intrinsic properties of metal oxide nanoparticles and polymers with increased electrical conductivity and stability [29]. For instance, composites of zinc oxide-sulphonated polyether ether ketone (SPEEK/ZnO), polyaniline–iron (III) oxide (PANI/Fe3O4) [19,20,21,22], polyaniline-bismuth oxide (PANI-Bi2O3) [30], polypyrrole-iron (III) oxide (PPy/Fe3O4) [29], polyaniline-binary metal oxide (NiO/CuO/PANI) [30], and polypyrrole-tunsgten oxide (PPy-WO3) [31] were applied as electrode materials for the sensing of dopamine (DA), pramipexole, serotonin, glucose, and gas (hydrogen sulphide) accordingly. Polypyrrole-titanium oxide (PPy-TiO2) and polyaniline–zinc oxide (PANI/ZnO) nanocomposites were employed for light-emitting diodes and corrosion protection, respectively [32,33]. Moreover, SPEEK/TiO2 was employed in the fabrication of electrodes for fuel cells [28]. In addition, nanostructured carbon black was applied in DA detection [34].
This study, for the first time, reports dopamine electroxidation at the sulphonated polyether ether ketone-Iron (III) oxide modified screen-printed carbon electrode (SPCE-Fe3O4/SPEEK). The Fe3O4 nanoparticle (Fe3O4NPs) was synthesized through a green route (from L. serica leaf extract) because the method is environmentally safe, less toxic, and cheap since materials are naturally available. There is no report on nanoparticles synthesized from the L. serica leaf. The nanocomposite-modified electrode displayed a well-defined redox voltammogram in the redox probe and good electrocatalytic oxidation of dopamine than the bare SPCE. It also had a good detection limit, selectivity, and was successfully utilized to determine DA in the pharmaceutical sample. Fabrication of the electrode was simple, convenient, and economical.

2. Results

2.1. Characterization of Fe3O4 and Fe3O4/SPEEK

2.1.1. UV–Visible Study

The formation of Fe3O4NPs is ascribed to ferrous, ferric salts (iron (II) chloride tetrahydrate, iron (III) chloride tetrahydrate, and the leaf extract of L. serica. The reduction that occurred on the Fe2+ ions is explained by the visible colour change in the reaction mixture which physically confirms the Fe-O nanoparticles by using a UV–Visible spectrophotometer. Figure 1 shows the UV–visible spectra of green mediated Fe3O4NPs with an absorbed peak of approximately 296 nm, which is close to absorption peaks (296, 259, and 282) reported in previous studies [35]. However, the obtained results show a great biomolecule capping surface of the Fe3O4NPs without the presence of a Plasmon resonance surface. The energy band gap was calculated to be 4.19 eV according to Equation (1) using the obtained maximum absorption peak (296 nm):
E bg = 1240 λ   ( eV )

2.1.2. FTIR Study

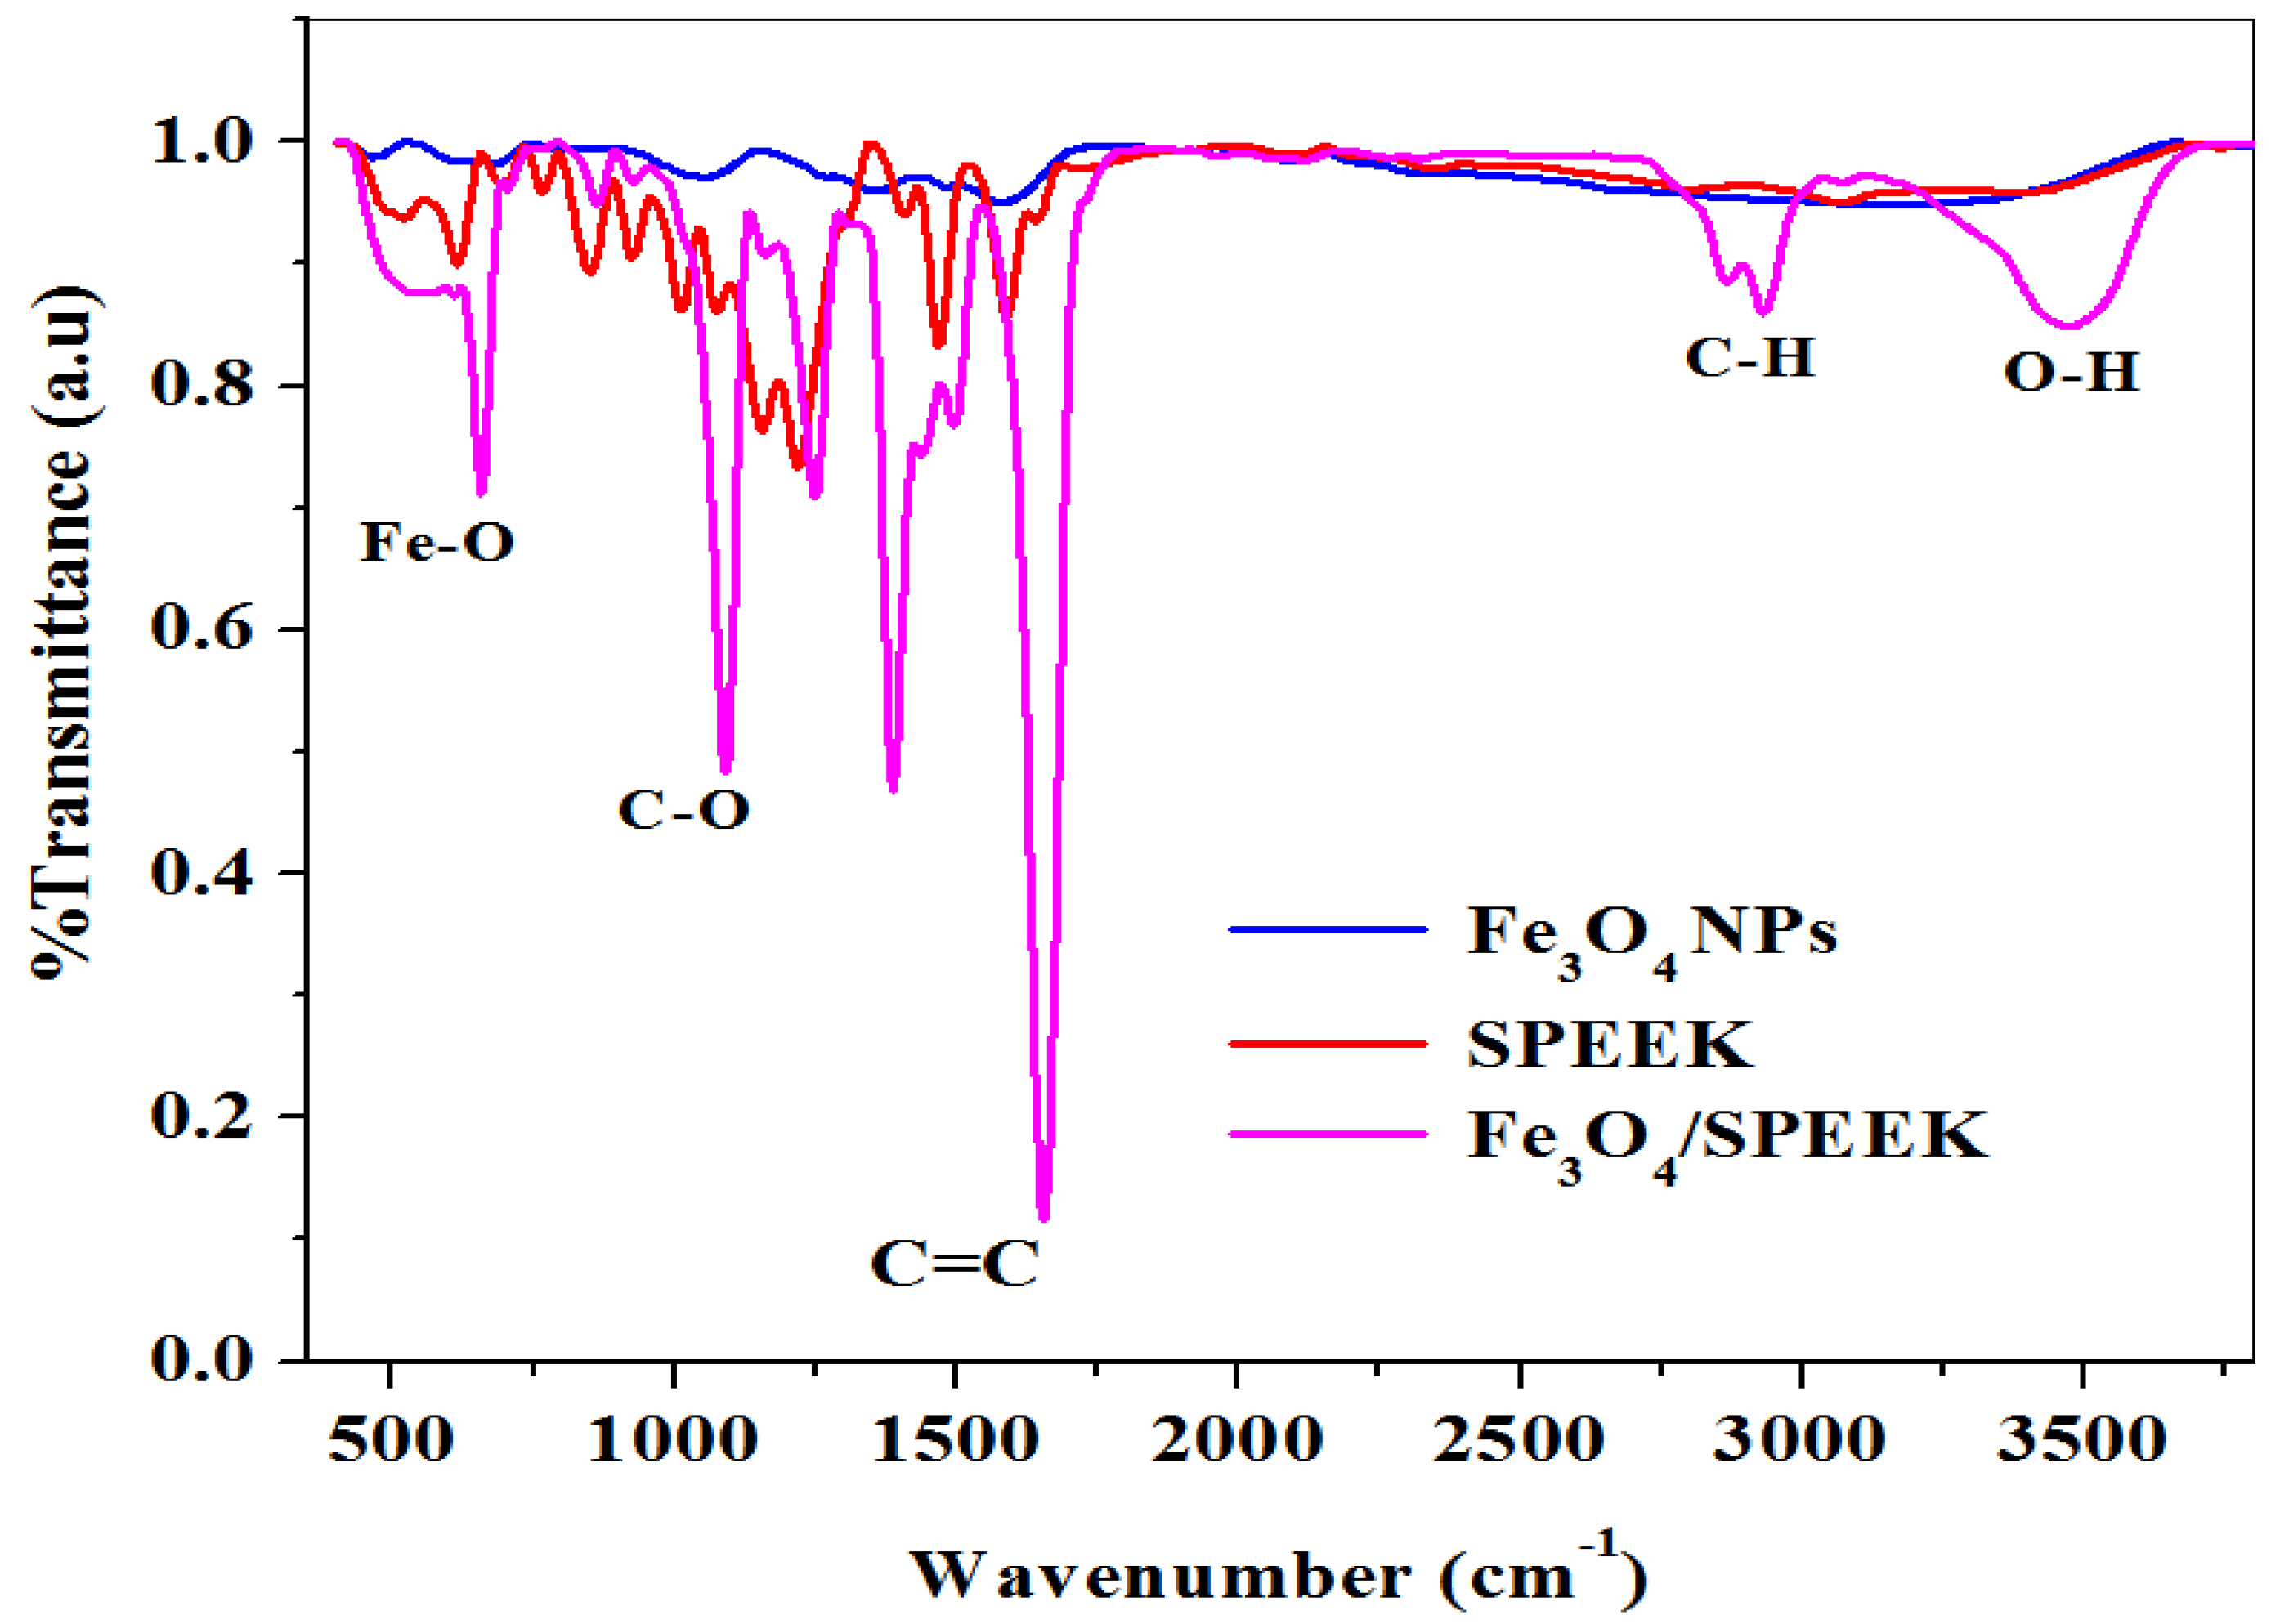
FTIR spectra of SPEEK, Fe3O4NPs, and Fe3O4/SPEEK nanocomposites recorded on the wavenumber from 400–4000 cm−1 presented in Figure 2 gives the information on different functional groups of the compounds present. The absorption peak at 3485, 2929, and 2858 cm−1 correspond to the –OH stretching of the phenol group and –C-H stretch, which agrees with the literature [36]. The absorption at the 1656, 1596, and 1460 cm−1 band corresponds to –C=C stretch which indicates the nitriles group [37]. The 1639 and 1591 cm−1 peaks reflect the –C=C stretch aromatic vibrations [38]. The intense peaks at 1090, 1242, and 1215 cm−1 are attributed to the –C-O stretch, phenol or alcohol group, and deformation bands in the lignin [37]. The absorption peaks at 469 and 654 cm−1 corresponding to Fe-O stretch, confirms the successful synthesis of Fe3O4NPs, and Fe3O4/SPEEK nanocomposites, respectively. It is possible that the presence of the phenol –OH group and the amide –N-H group played a role in the reduction of the precursor compound into iron oxide nanoparticles. The polymer SPEEK and iron oxide nanoparticles showed a significant interaction as shown in the composite peaks absorbed (Figure 2).

2.1.3. XRD Study

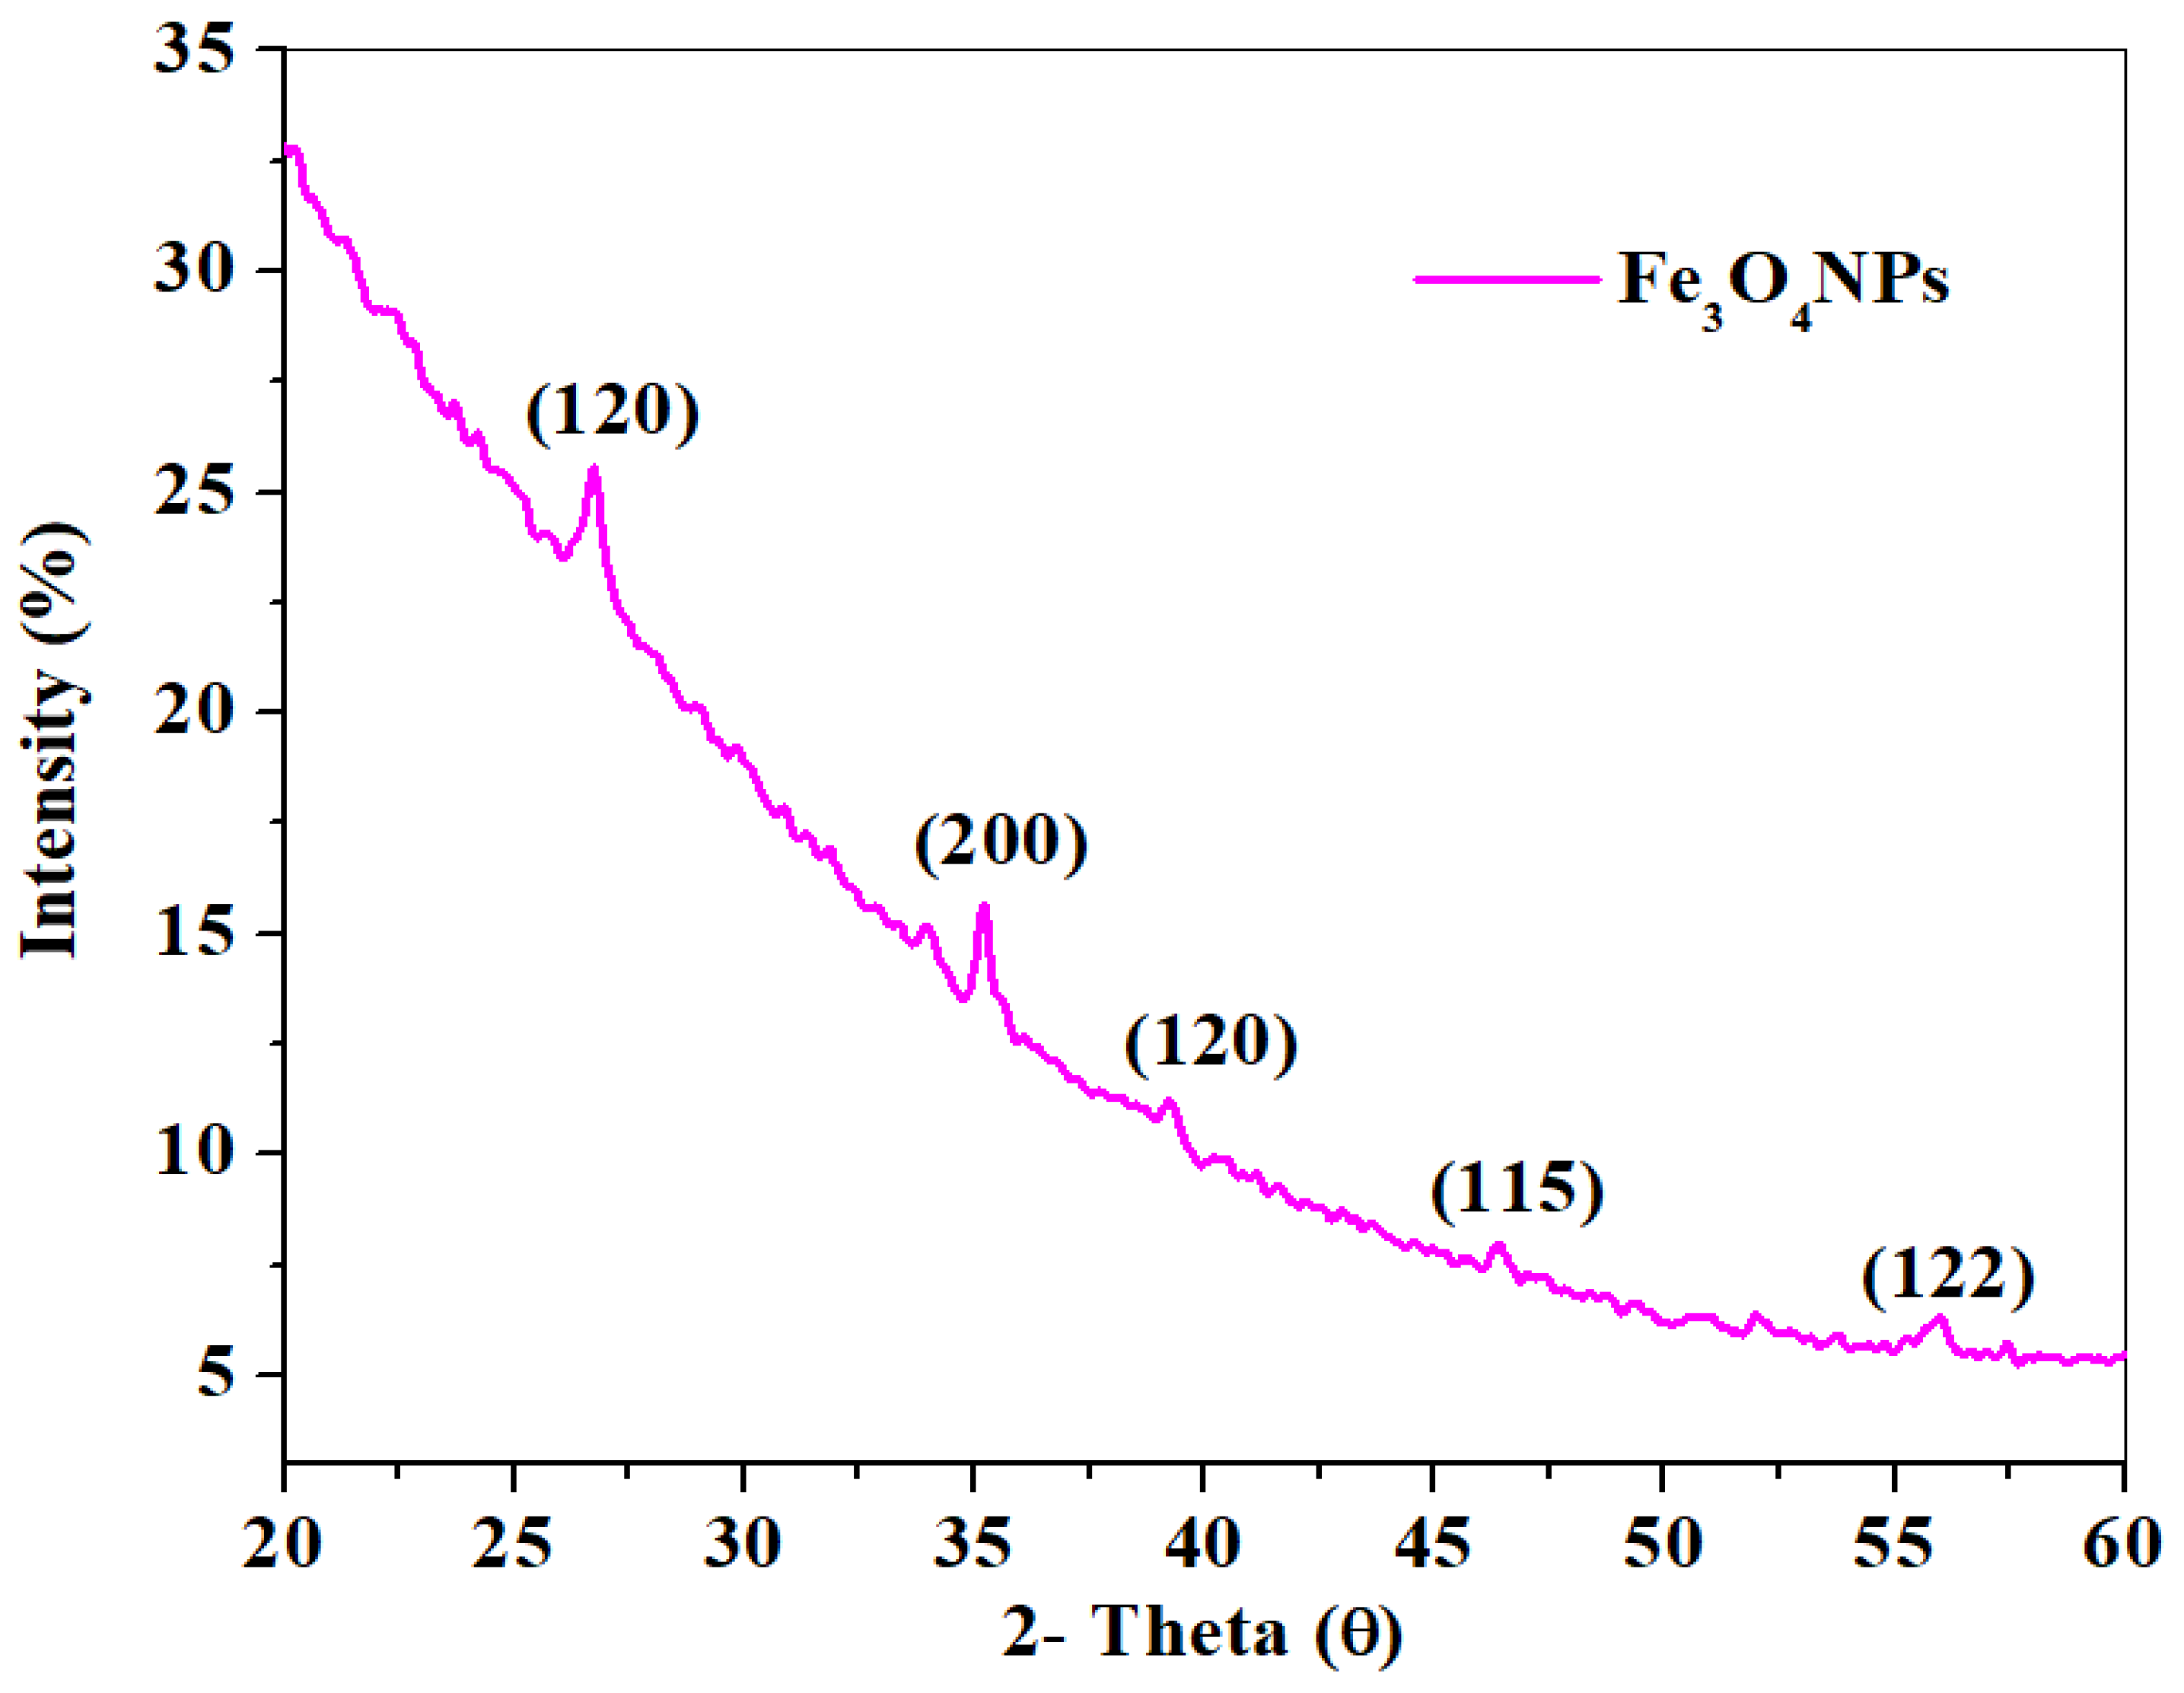
The crystallographic structure of the samples can be determined using XRD. Figure 3 shows the XRD pattern of Fe3O4NPs with diffraction peaks and their corresponding planes at 2thetha (θ) values of 26.75° (120), 35.16° (200), 39.22° (123), 52.01° (115), and 55.99° (122), which are similar to a reported study [39]. The diffraction peaks observed confirm the crystalline nature of Fe3O4 nanoparticles, and the planes of the magnetite Fe3O4NPs also confirm the rhombohedral hematite phase. The diffraction peak obtained in the XRD patterns indicates that there was no trace of additional planes observed, which indicates the mediated Fe3O4NPs were obtained in high purity at room temperature [40,41].

2.1.4. SEM Study

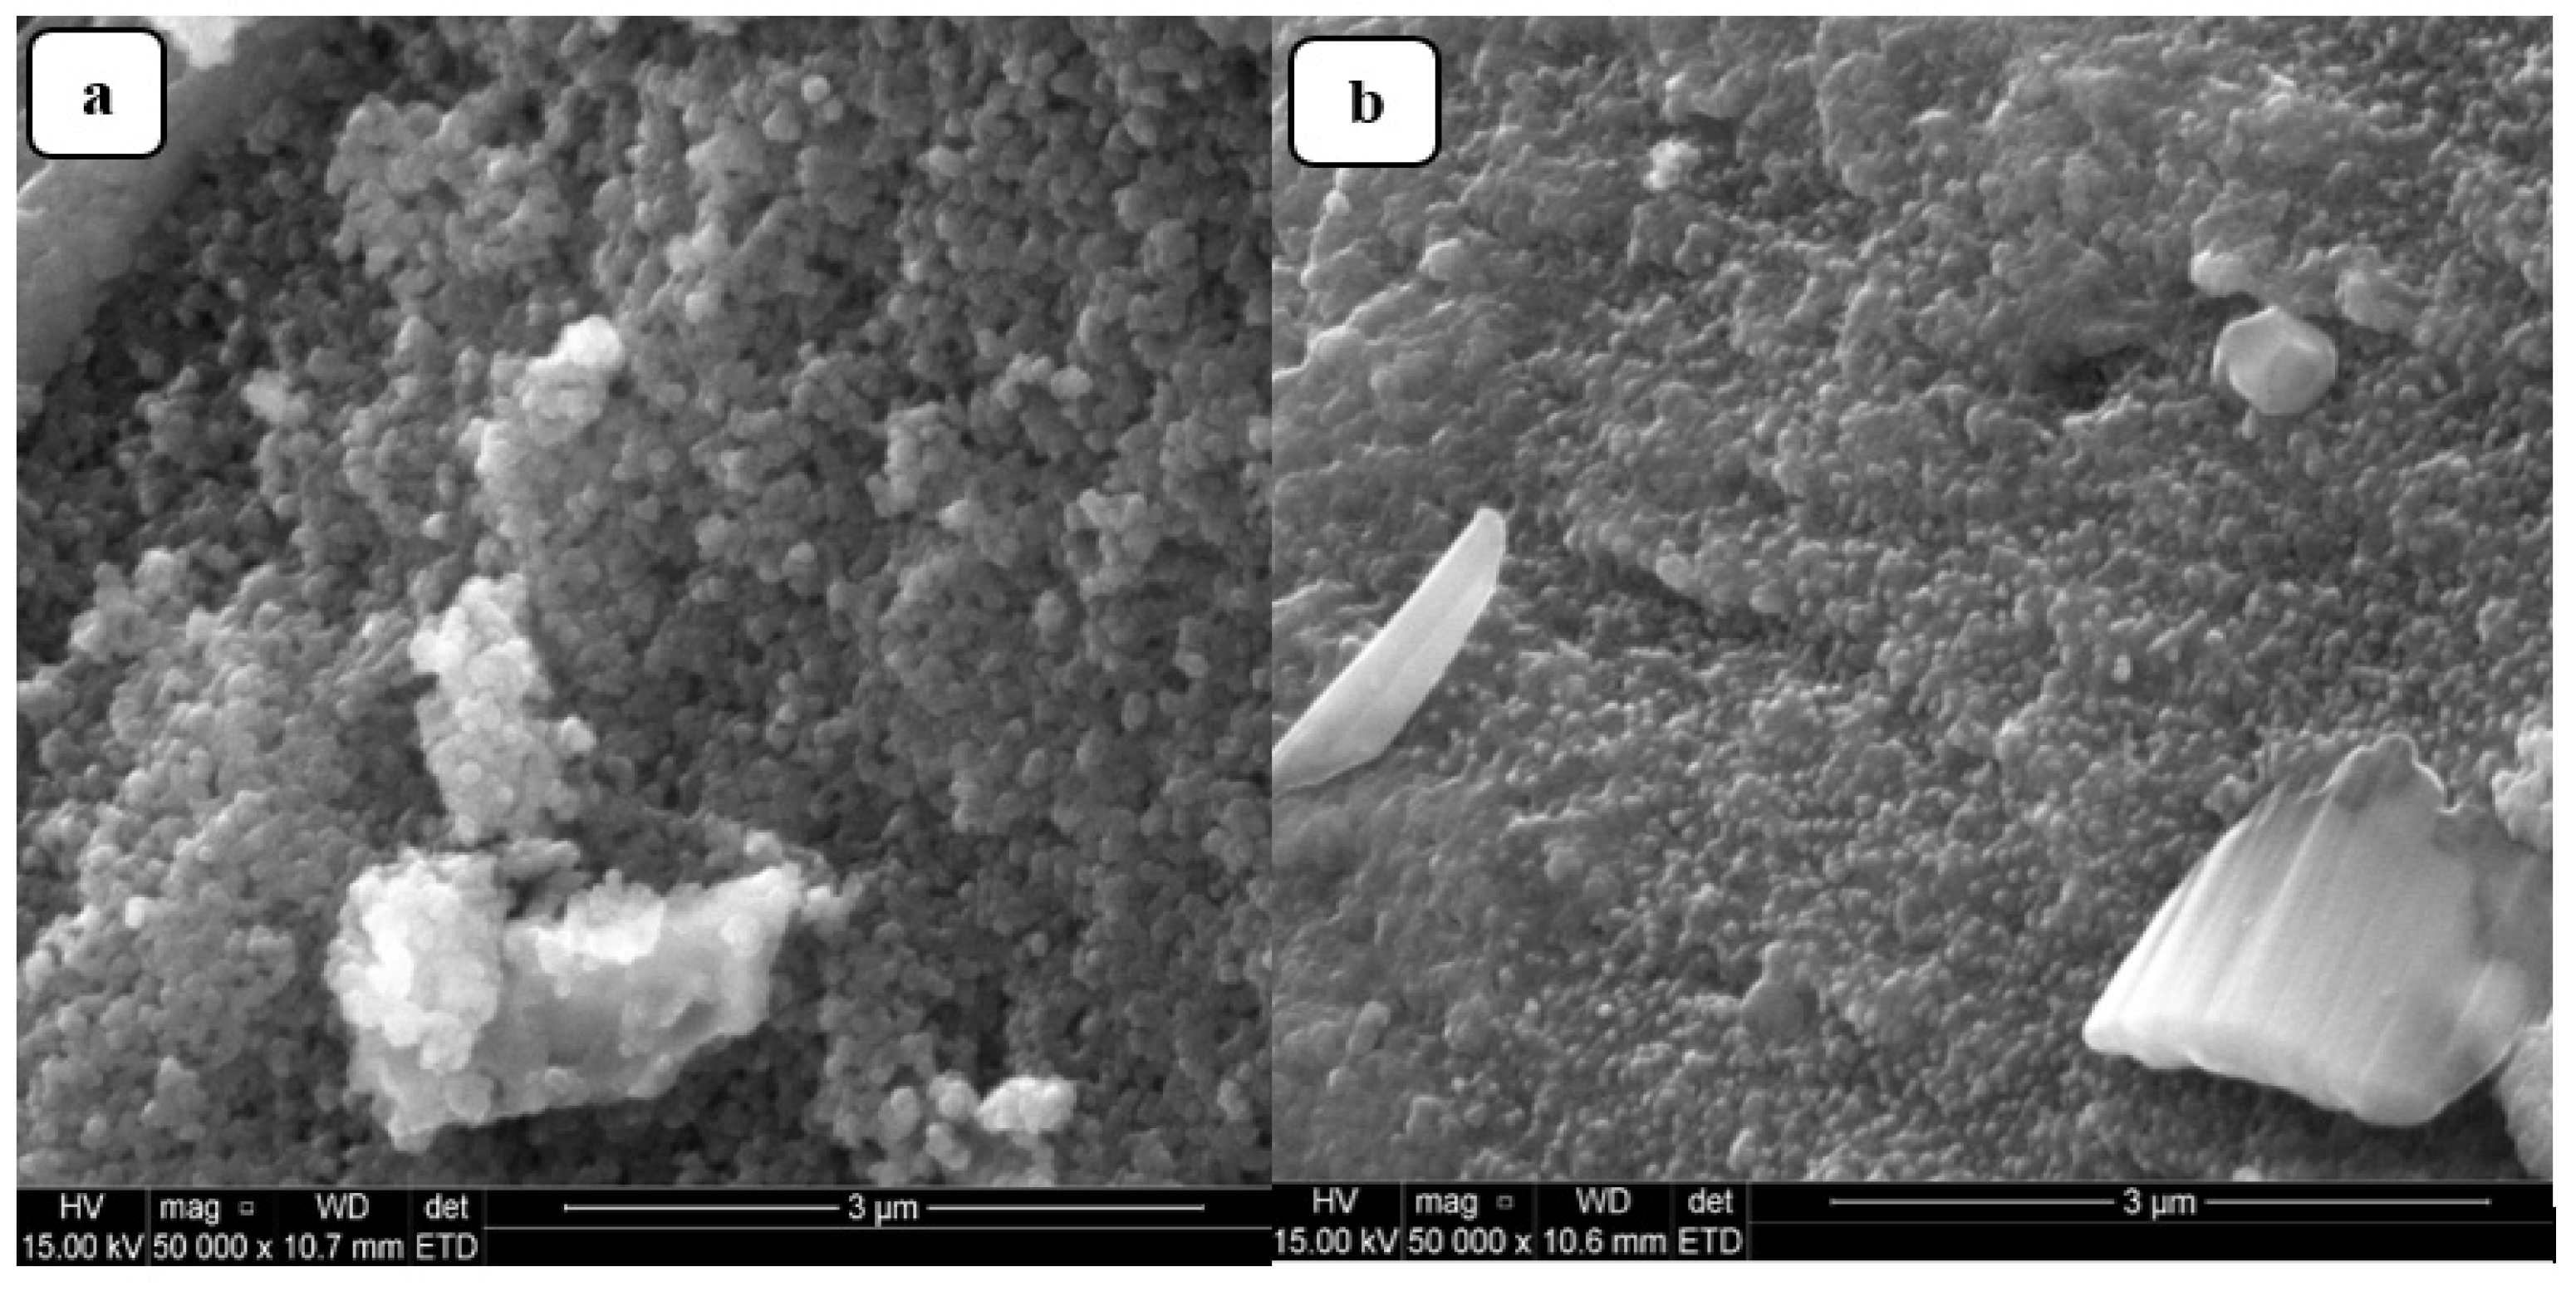
The surface morphology of the prepared Fe3O4NPs from the green synthesis of L. serica leaf extract was analyzed by scanning electron microscopy (SEM). Figure 4a,b represent the SEM images of Fe3O4NPs and Fe3O4/SPEEK nanocomposites, respectively. Figure 4a depicts the morphology of Fe3O4NPs that appears to be roughly agglomerated spherical particles in shape, which could be due to the steric effect associated with the magnetic Fe3O4NPs surface interaction by the active sites [42]. Figure 4b shows the morphology of the Fe3O4/SPEEK nanocomposites that appeared to have some crystal-like structure which indicates the presence of the SPEEK polymer in the nanocomposite, indicating the occurrence of interaction between Fe3O4 and SPEEK. Hence, particles appeared to be clustered together, thus, maintaining the agglomerated spherical shape [43].

2.2. Electrochemical Characterization

2.2.1. Electrochemical Characterization of Electrodes

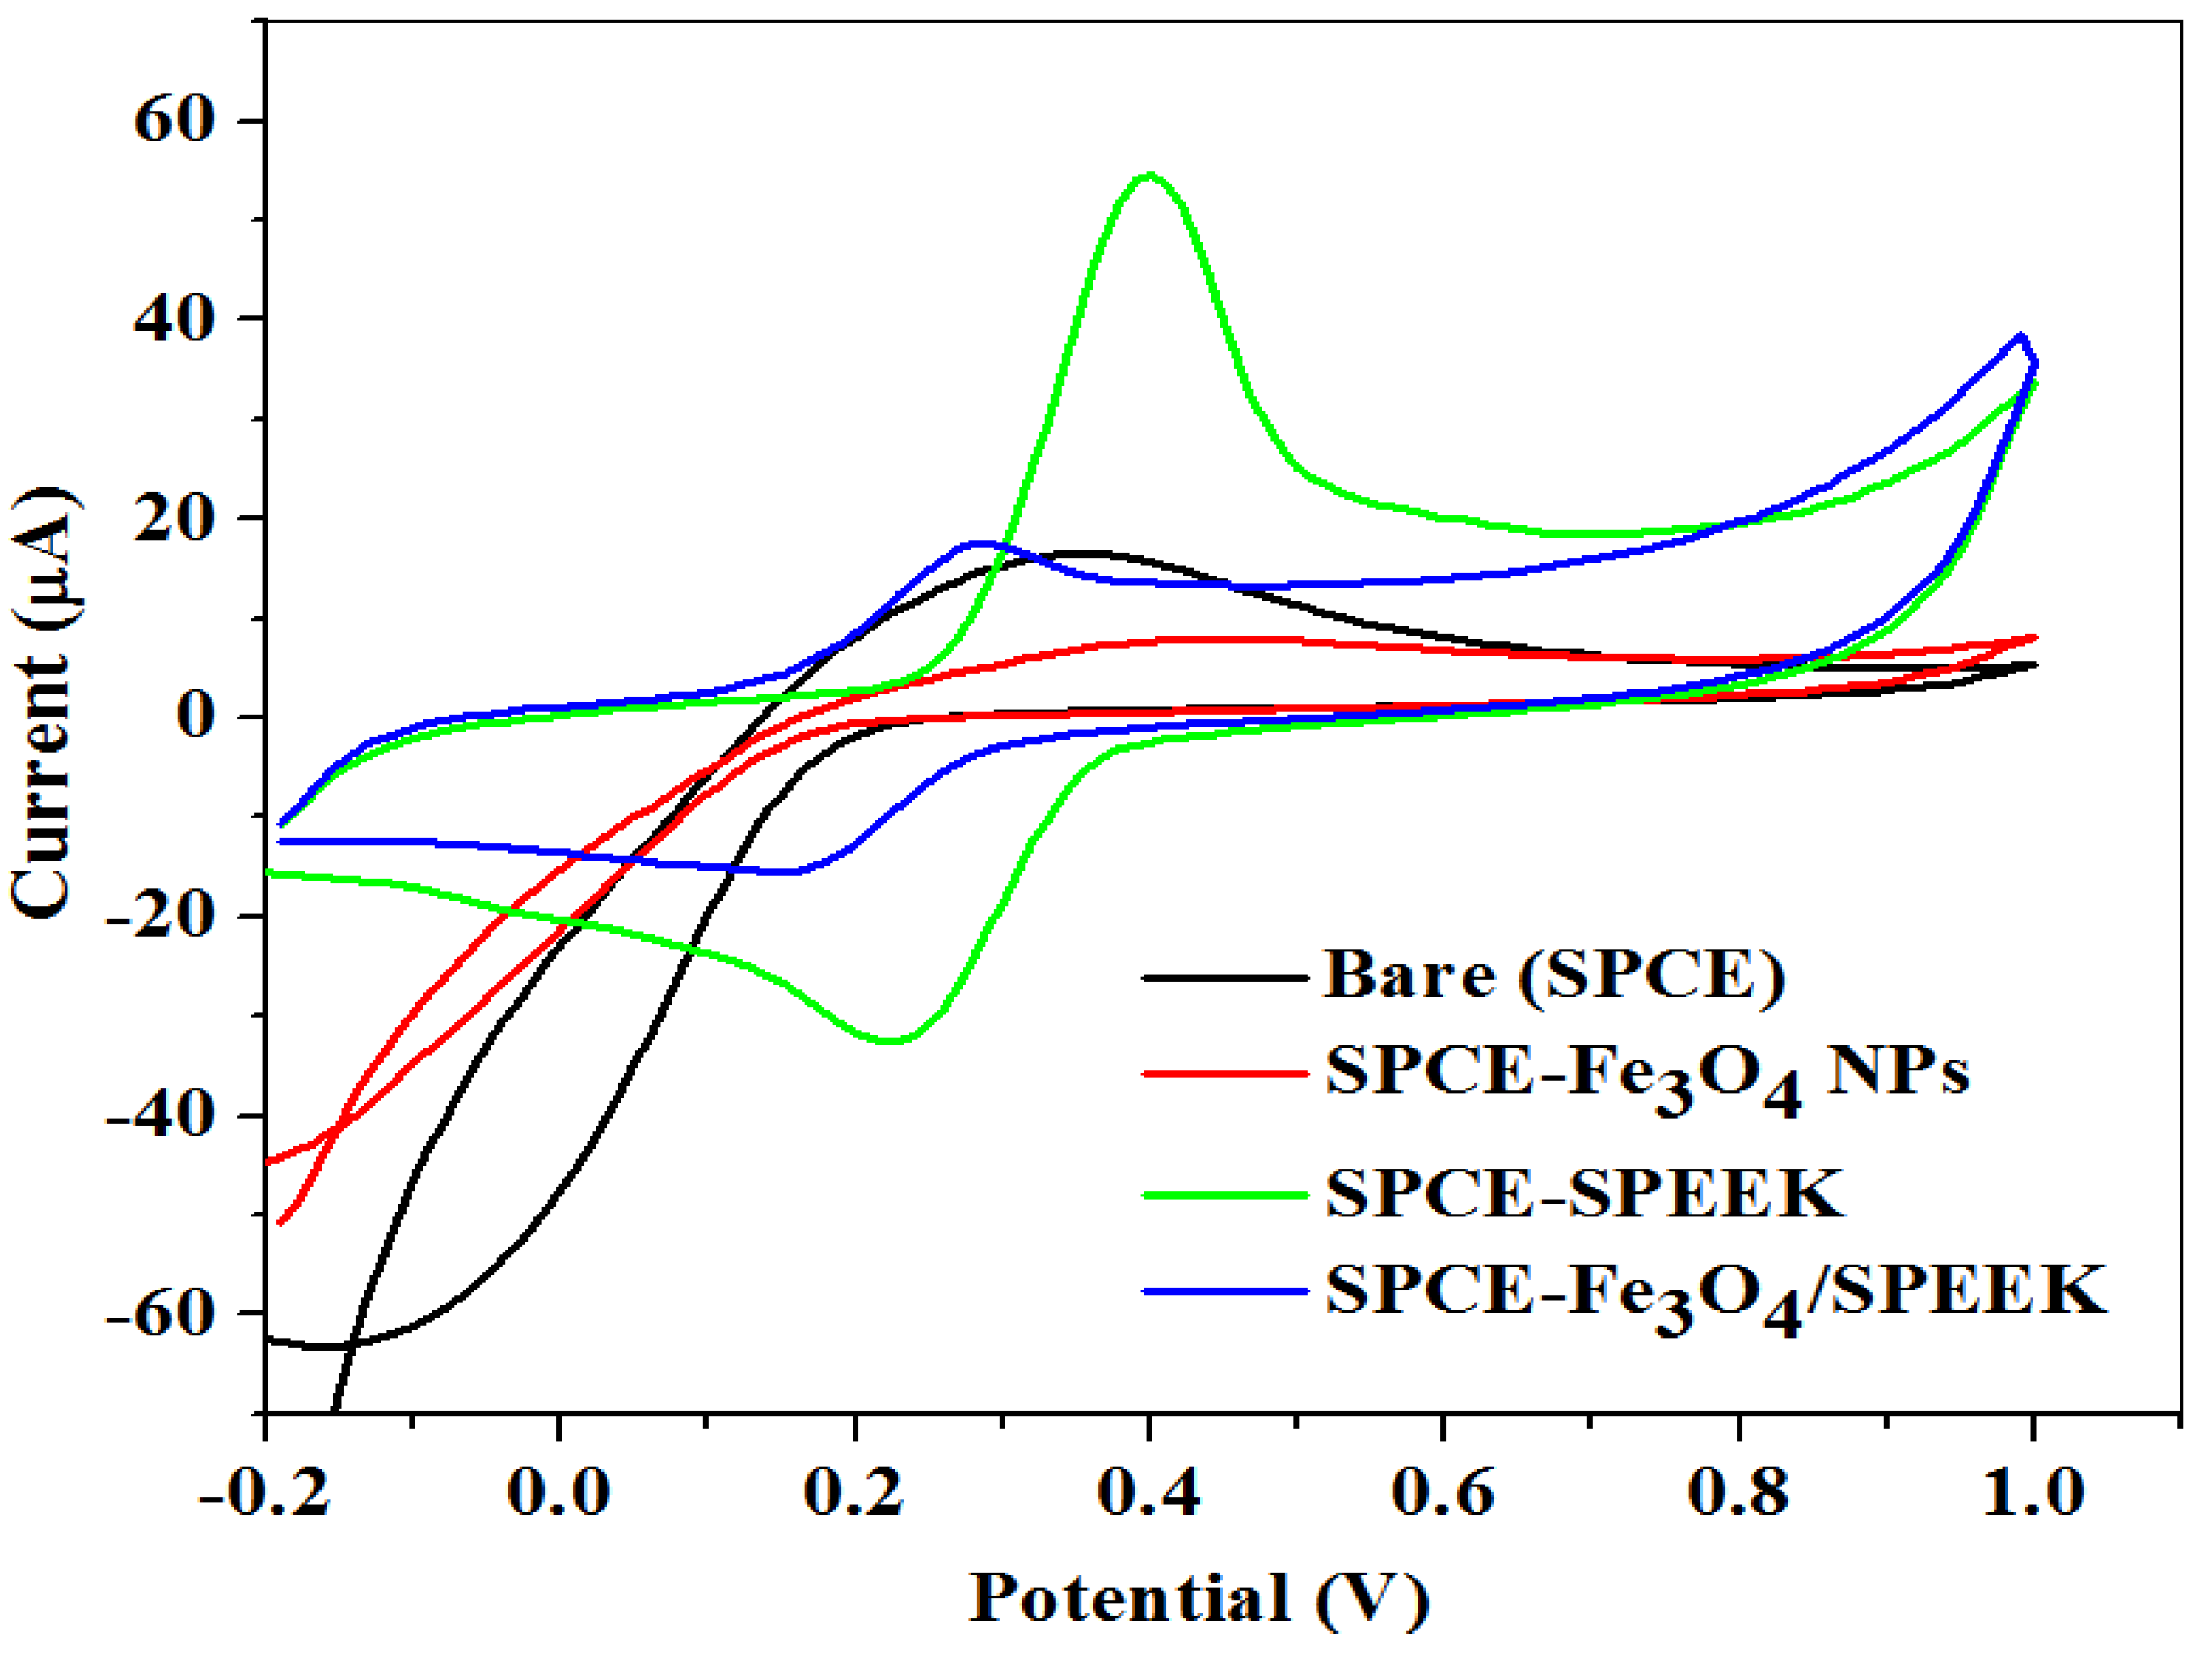
The electrochemical efficiency and electron transport properties of electrodes (bare-SPCE, SPCE-Fe3O4NPs, SPCE-SPEEK, and SPCE-Fe3O4/SPEEK nanocomposites) were investigated using cyclic voltammetry (CV) at a scan rate of 25 mV/s within −0.2–1.0 V potential window in 0.1 M PBS of pH 7.4 containing 5 mM K3[Fe(CN)6]. A comparative cyclic voltammogram of the electrodes is presented in Figure 5. The current response was enhanced at the SPCE-SPEEK and SPCE-Fe3O4/SPEEK electrodes as opposed to the bare and nanoparticle-modified electrodes, which could be due to the presence of SPEEK which has excellent electrocatalytic properties. Table 1 shows the parameters measured at the electrodes.

2.2.2. Scan Rate Study at SPCE-Fe3O4/SPEEK Electrode

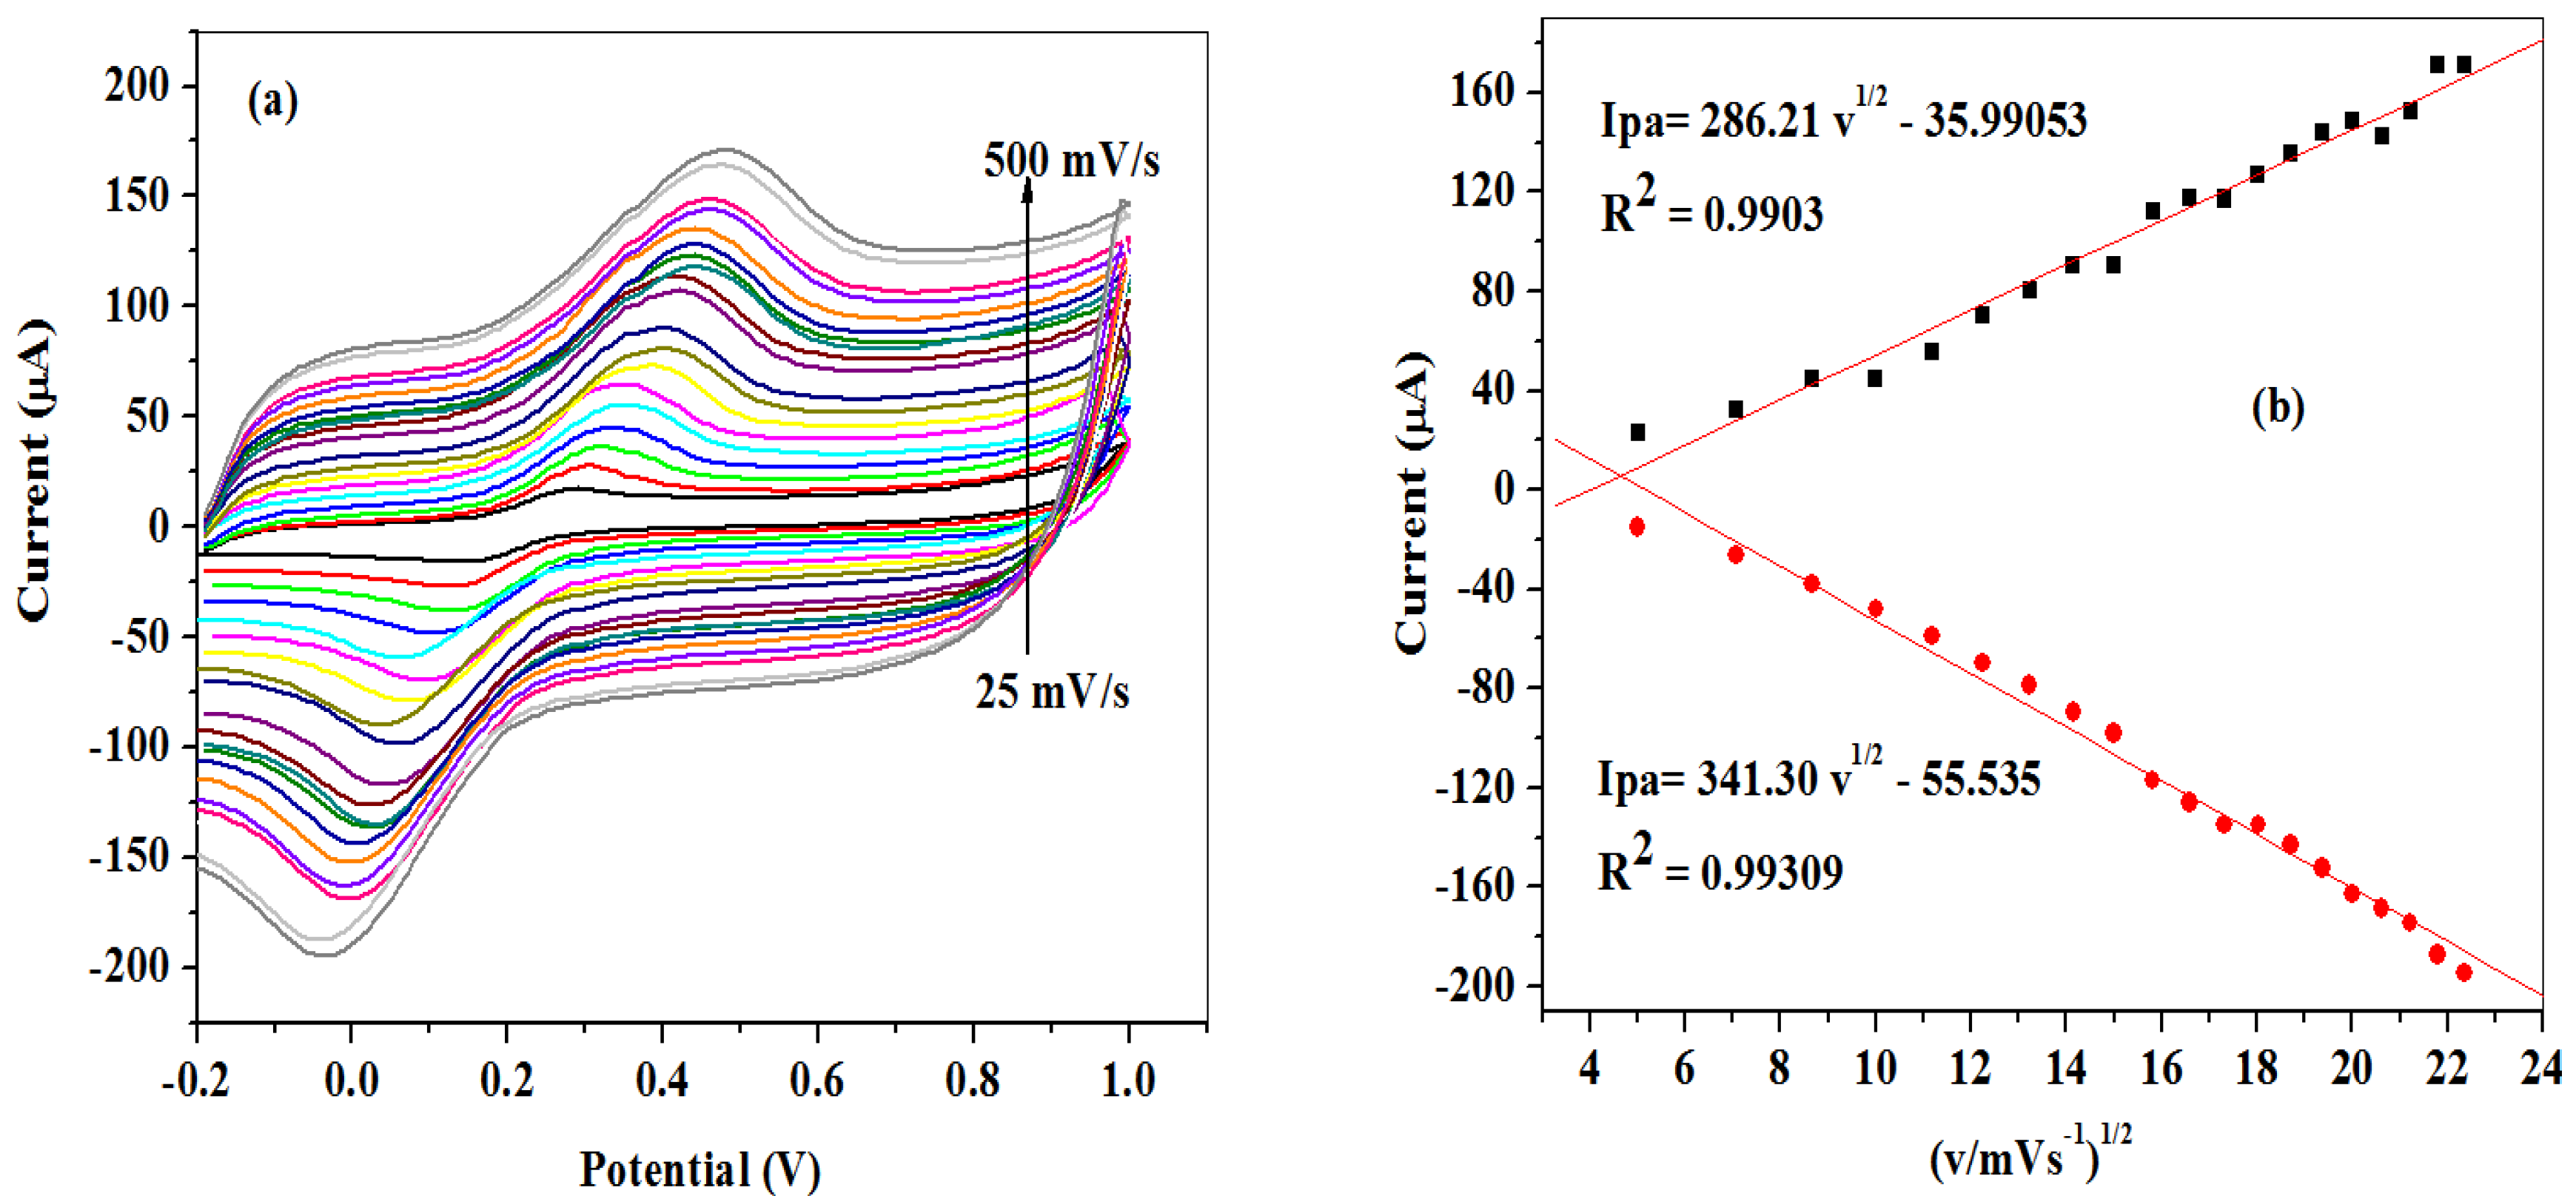
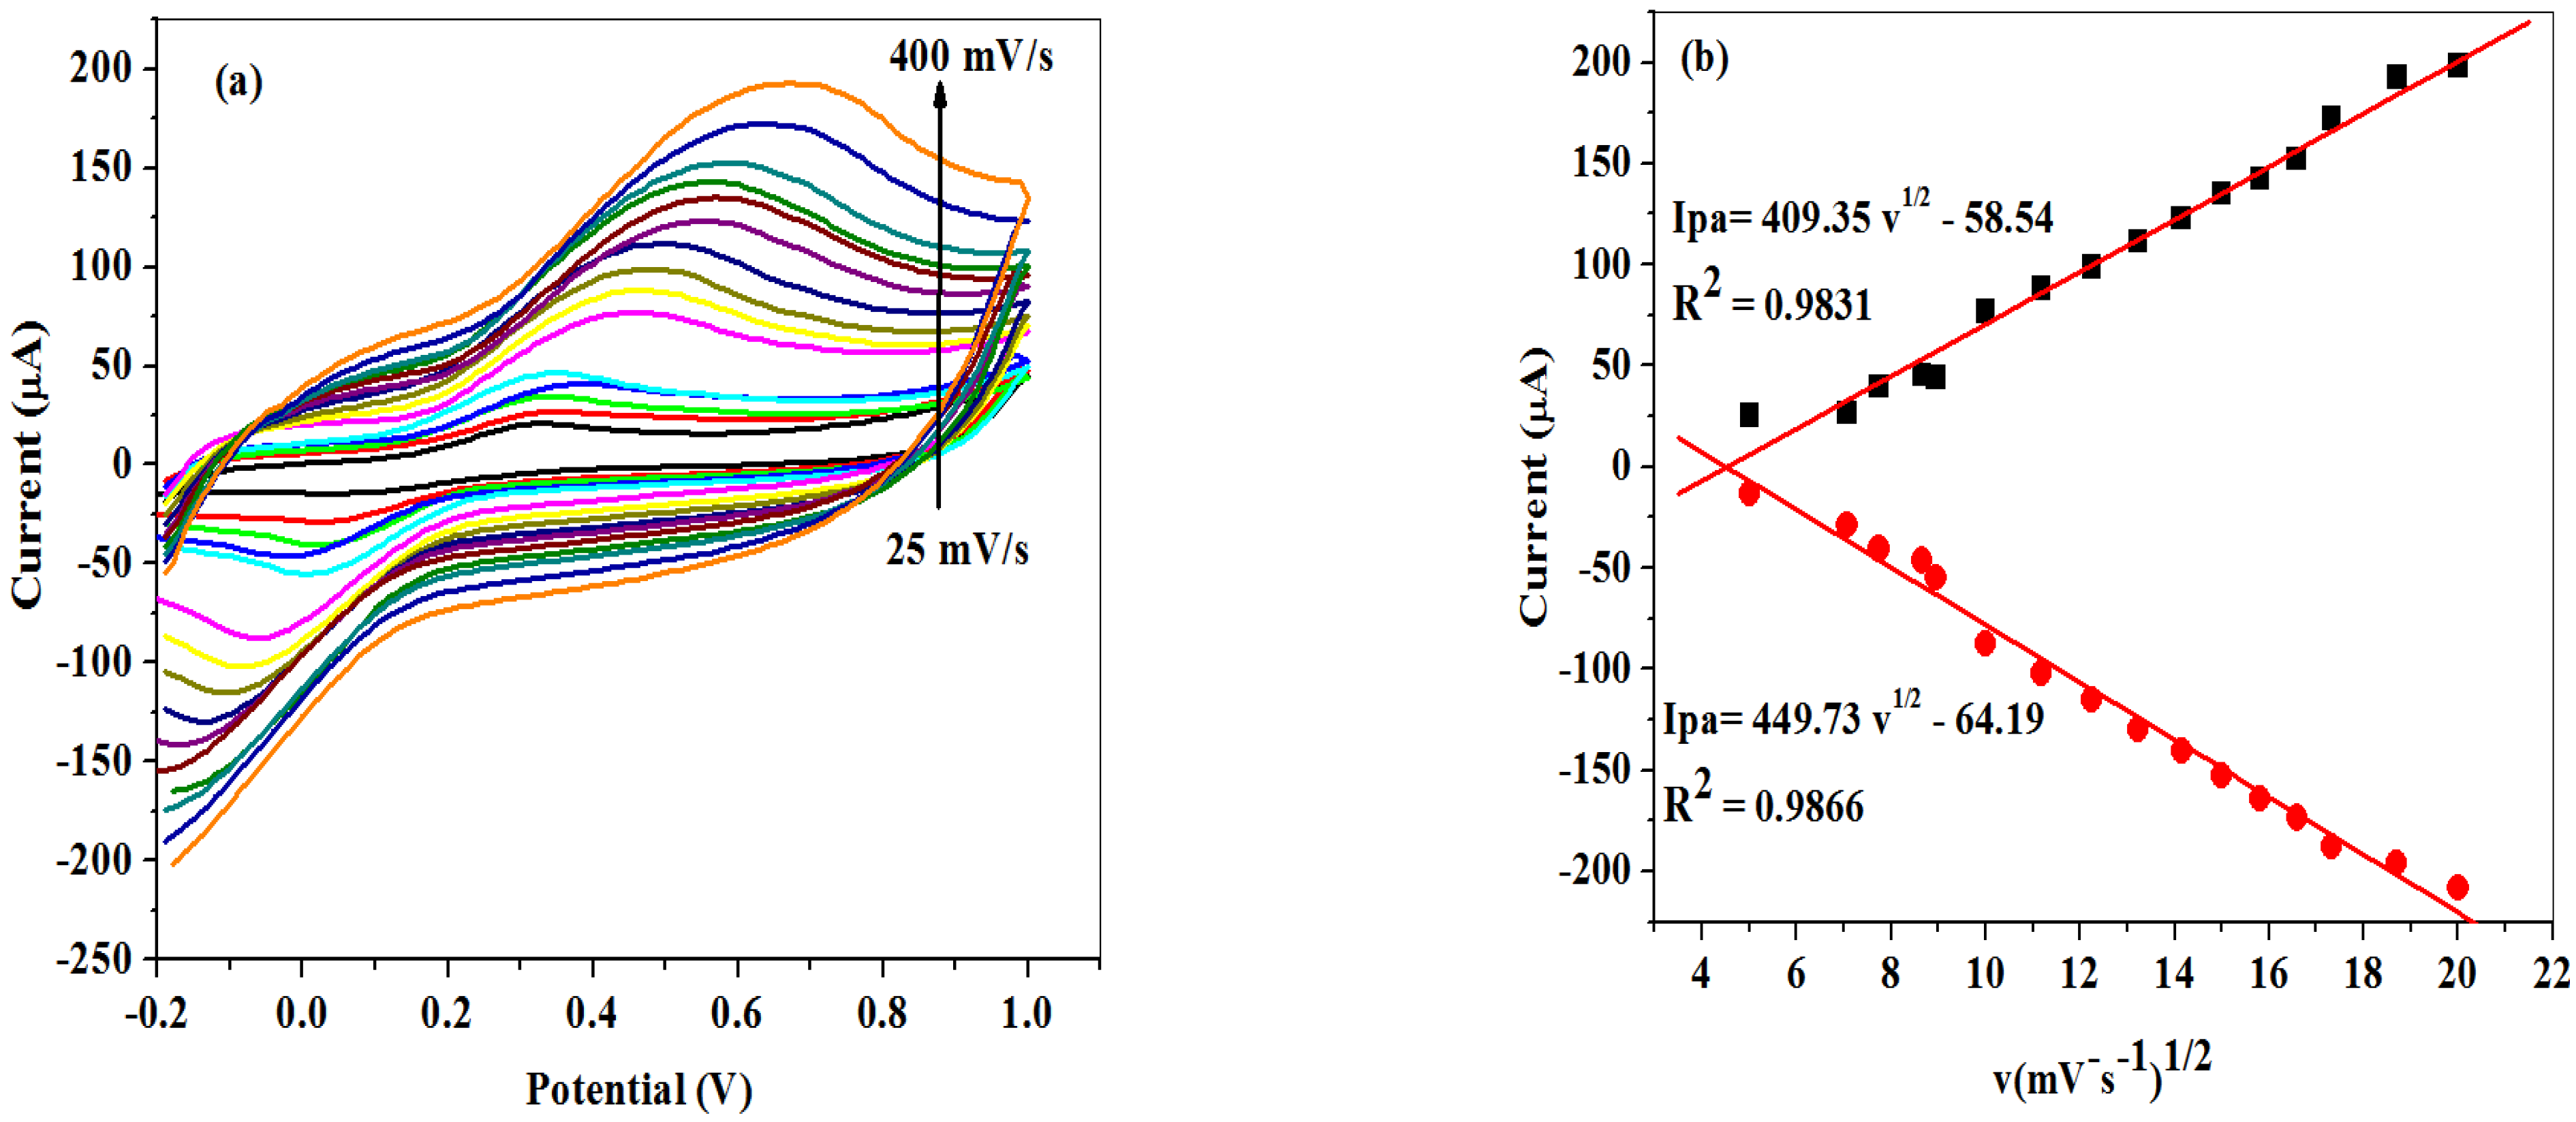
The effect of scan rate variation on peak currents of modified SPCE-Fe3O4/SPEEK in 5 mM prepared in 0.1 M PBS, pH 7.4 solution was studied using CV in the range from 25–500 mV/s scan rate as shown in Figure 6a. As the scan rate increases, the oxidation peak potentials shifted to the more positive. In consequence, a linear plot of peak currents versus square root of scan rate (v1/2) was deduced (Figure 6b). The graph clearly shows an increase of the peak currents with an increase in the square root of the scan rate, indicating a diffusion-controlled electrochemical process, which was also confirmed by the correlation coefficient (R2) value of 0.99 [44]. The surface area of the modified nanocomposite electrode (SPCE-Fe3O4/SPEEK) was found to be 2.799 cm2, using a Randle–Sevcik Equation (2) which is higher than the geometry of the bare SPCE (0.125 cm2):
I p = ( 2.69 × 10 5 ) n 3 2 AD 1 2 Cv 1 2   n
where Ip represents peak current (A), n is the number of electron transfer, A represents surface area (cm2), D represents diffusion coefficient (cm2/s), C represents concentration (mol/cm3), and v represents scan rate (V/s).
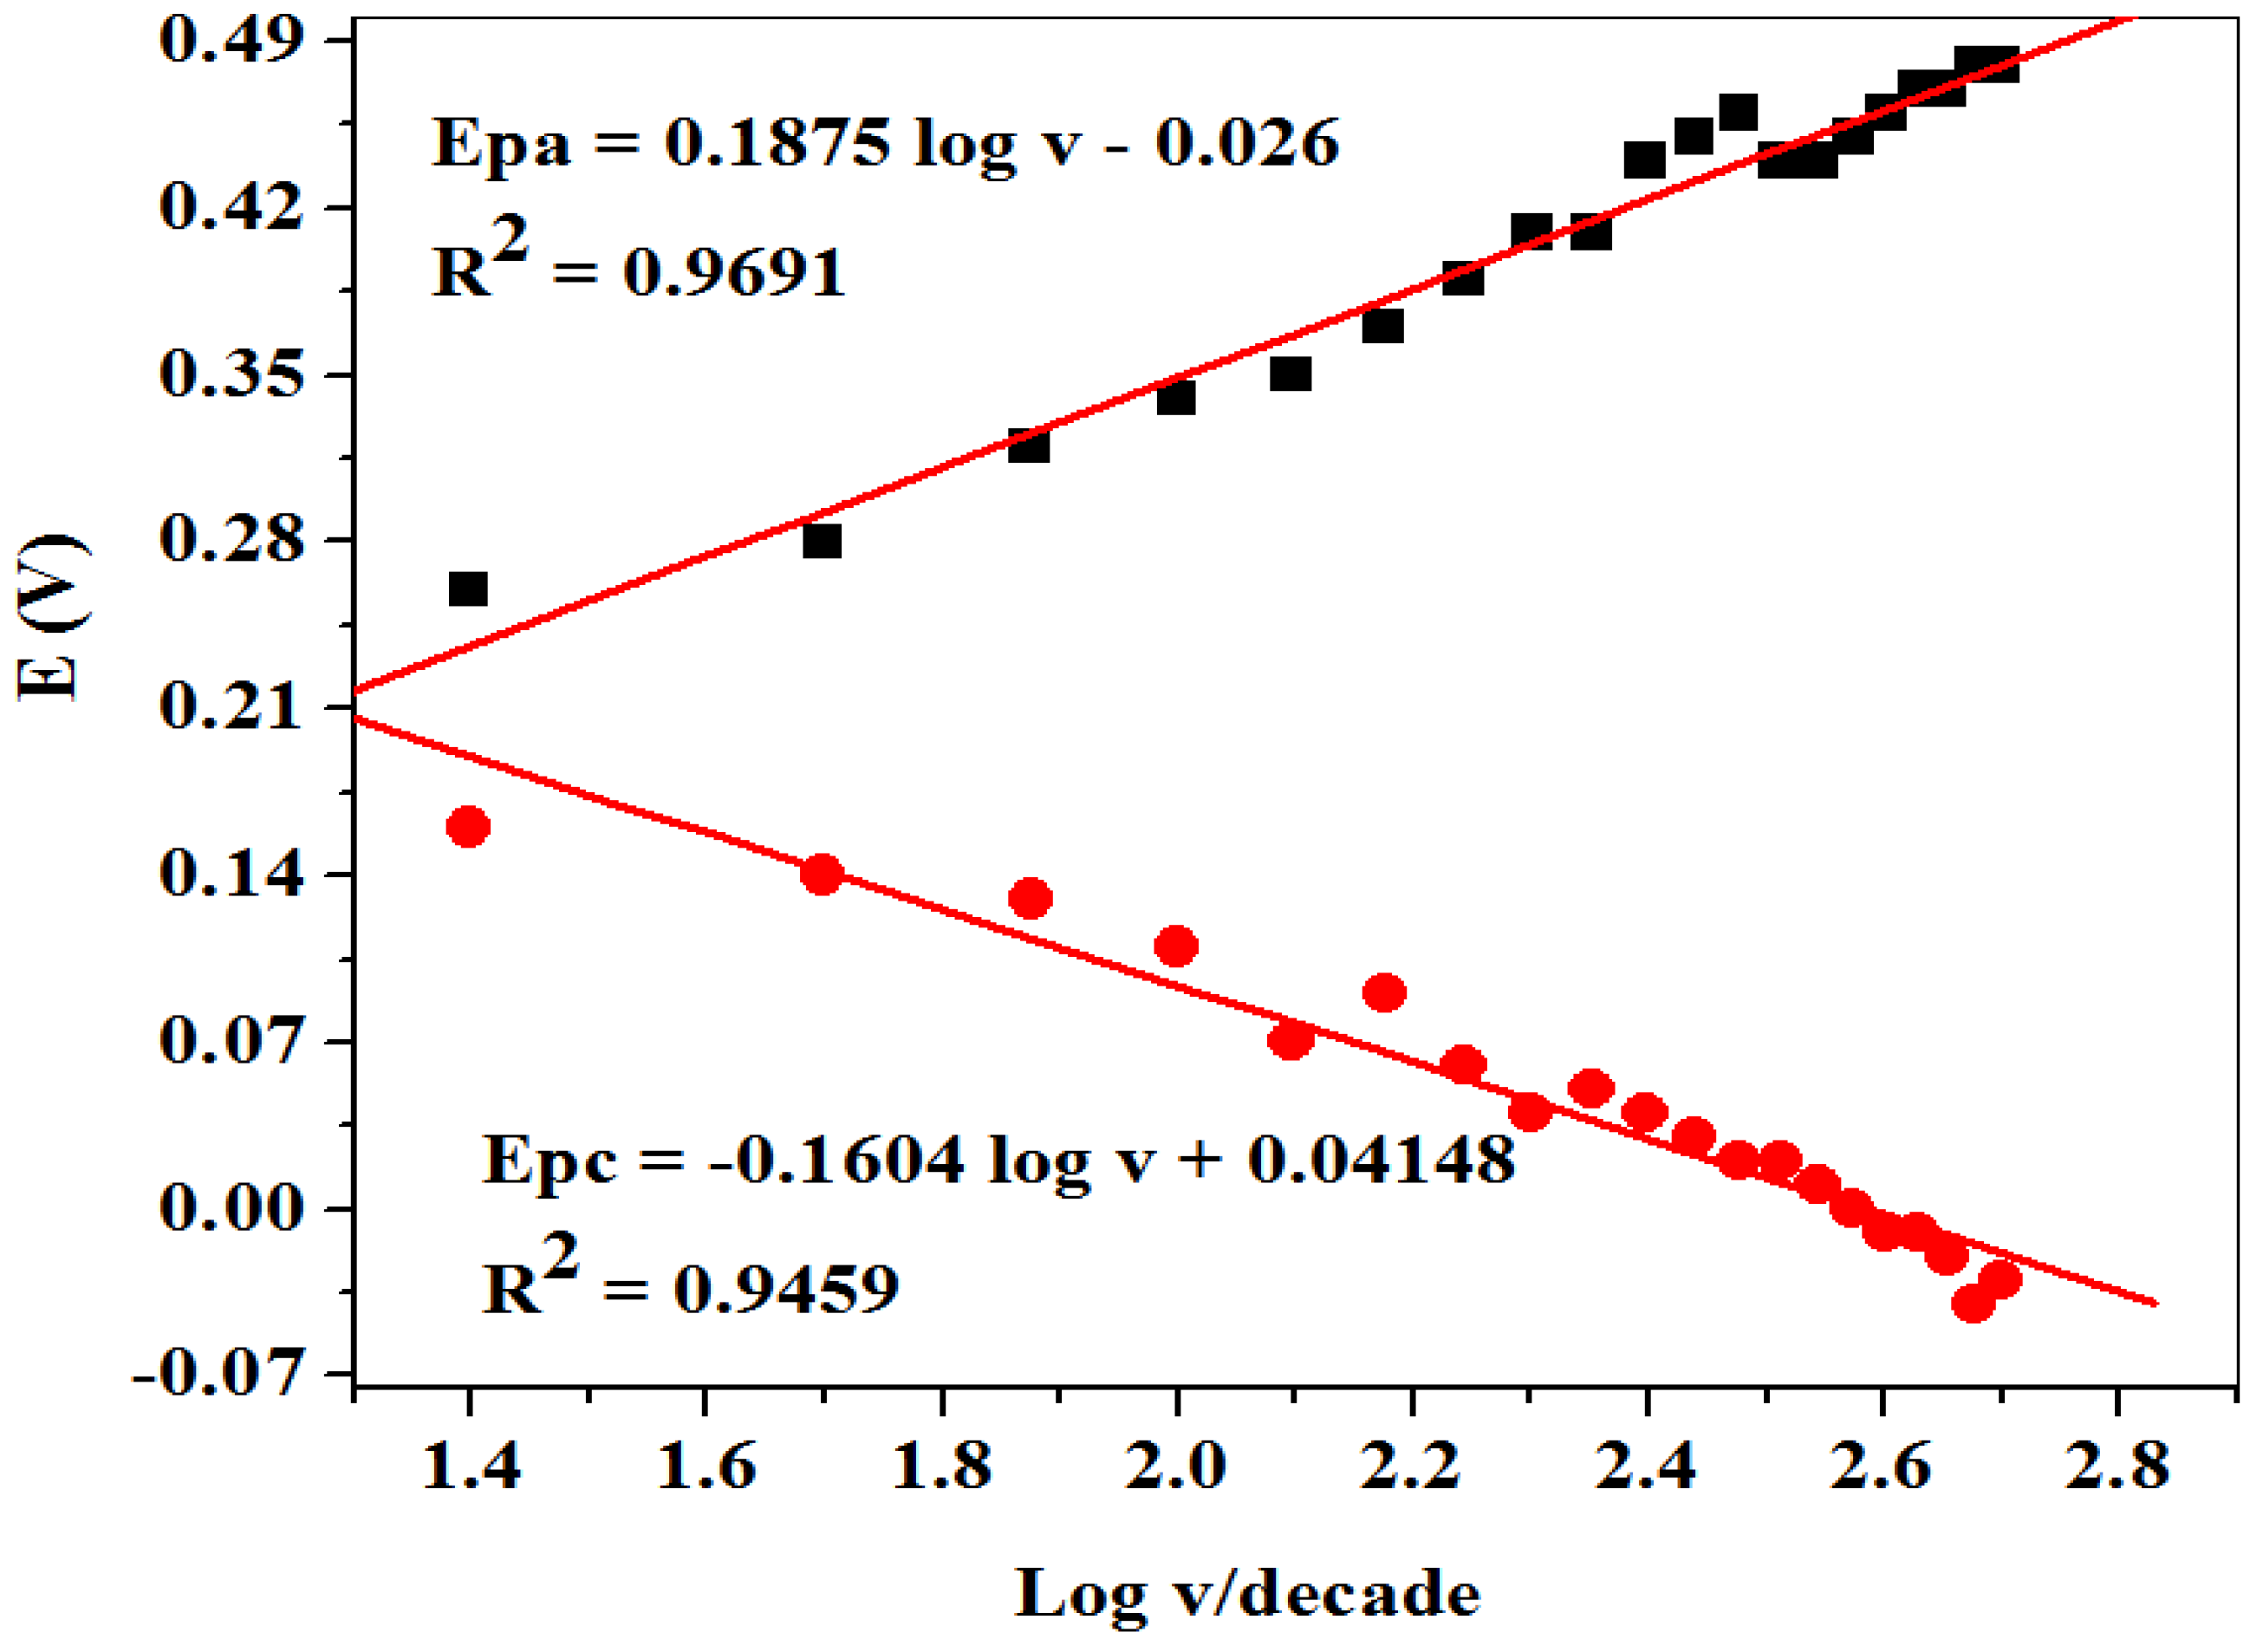
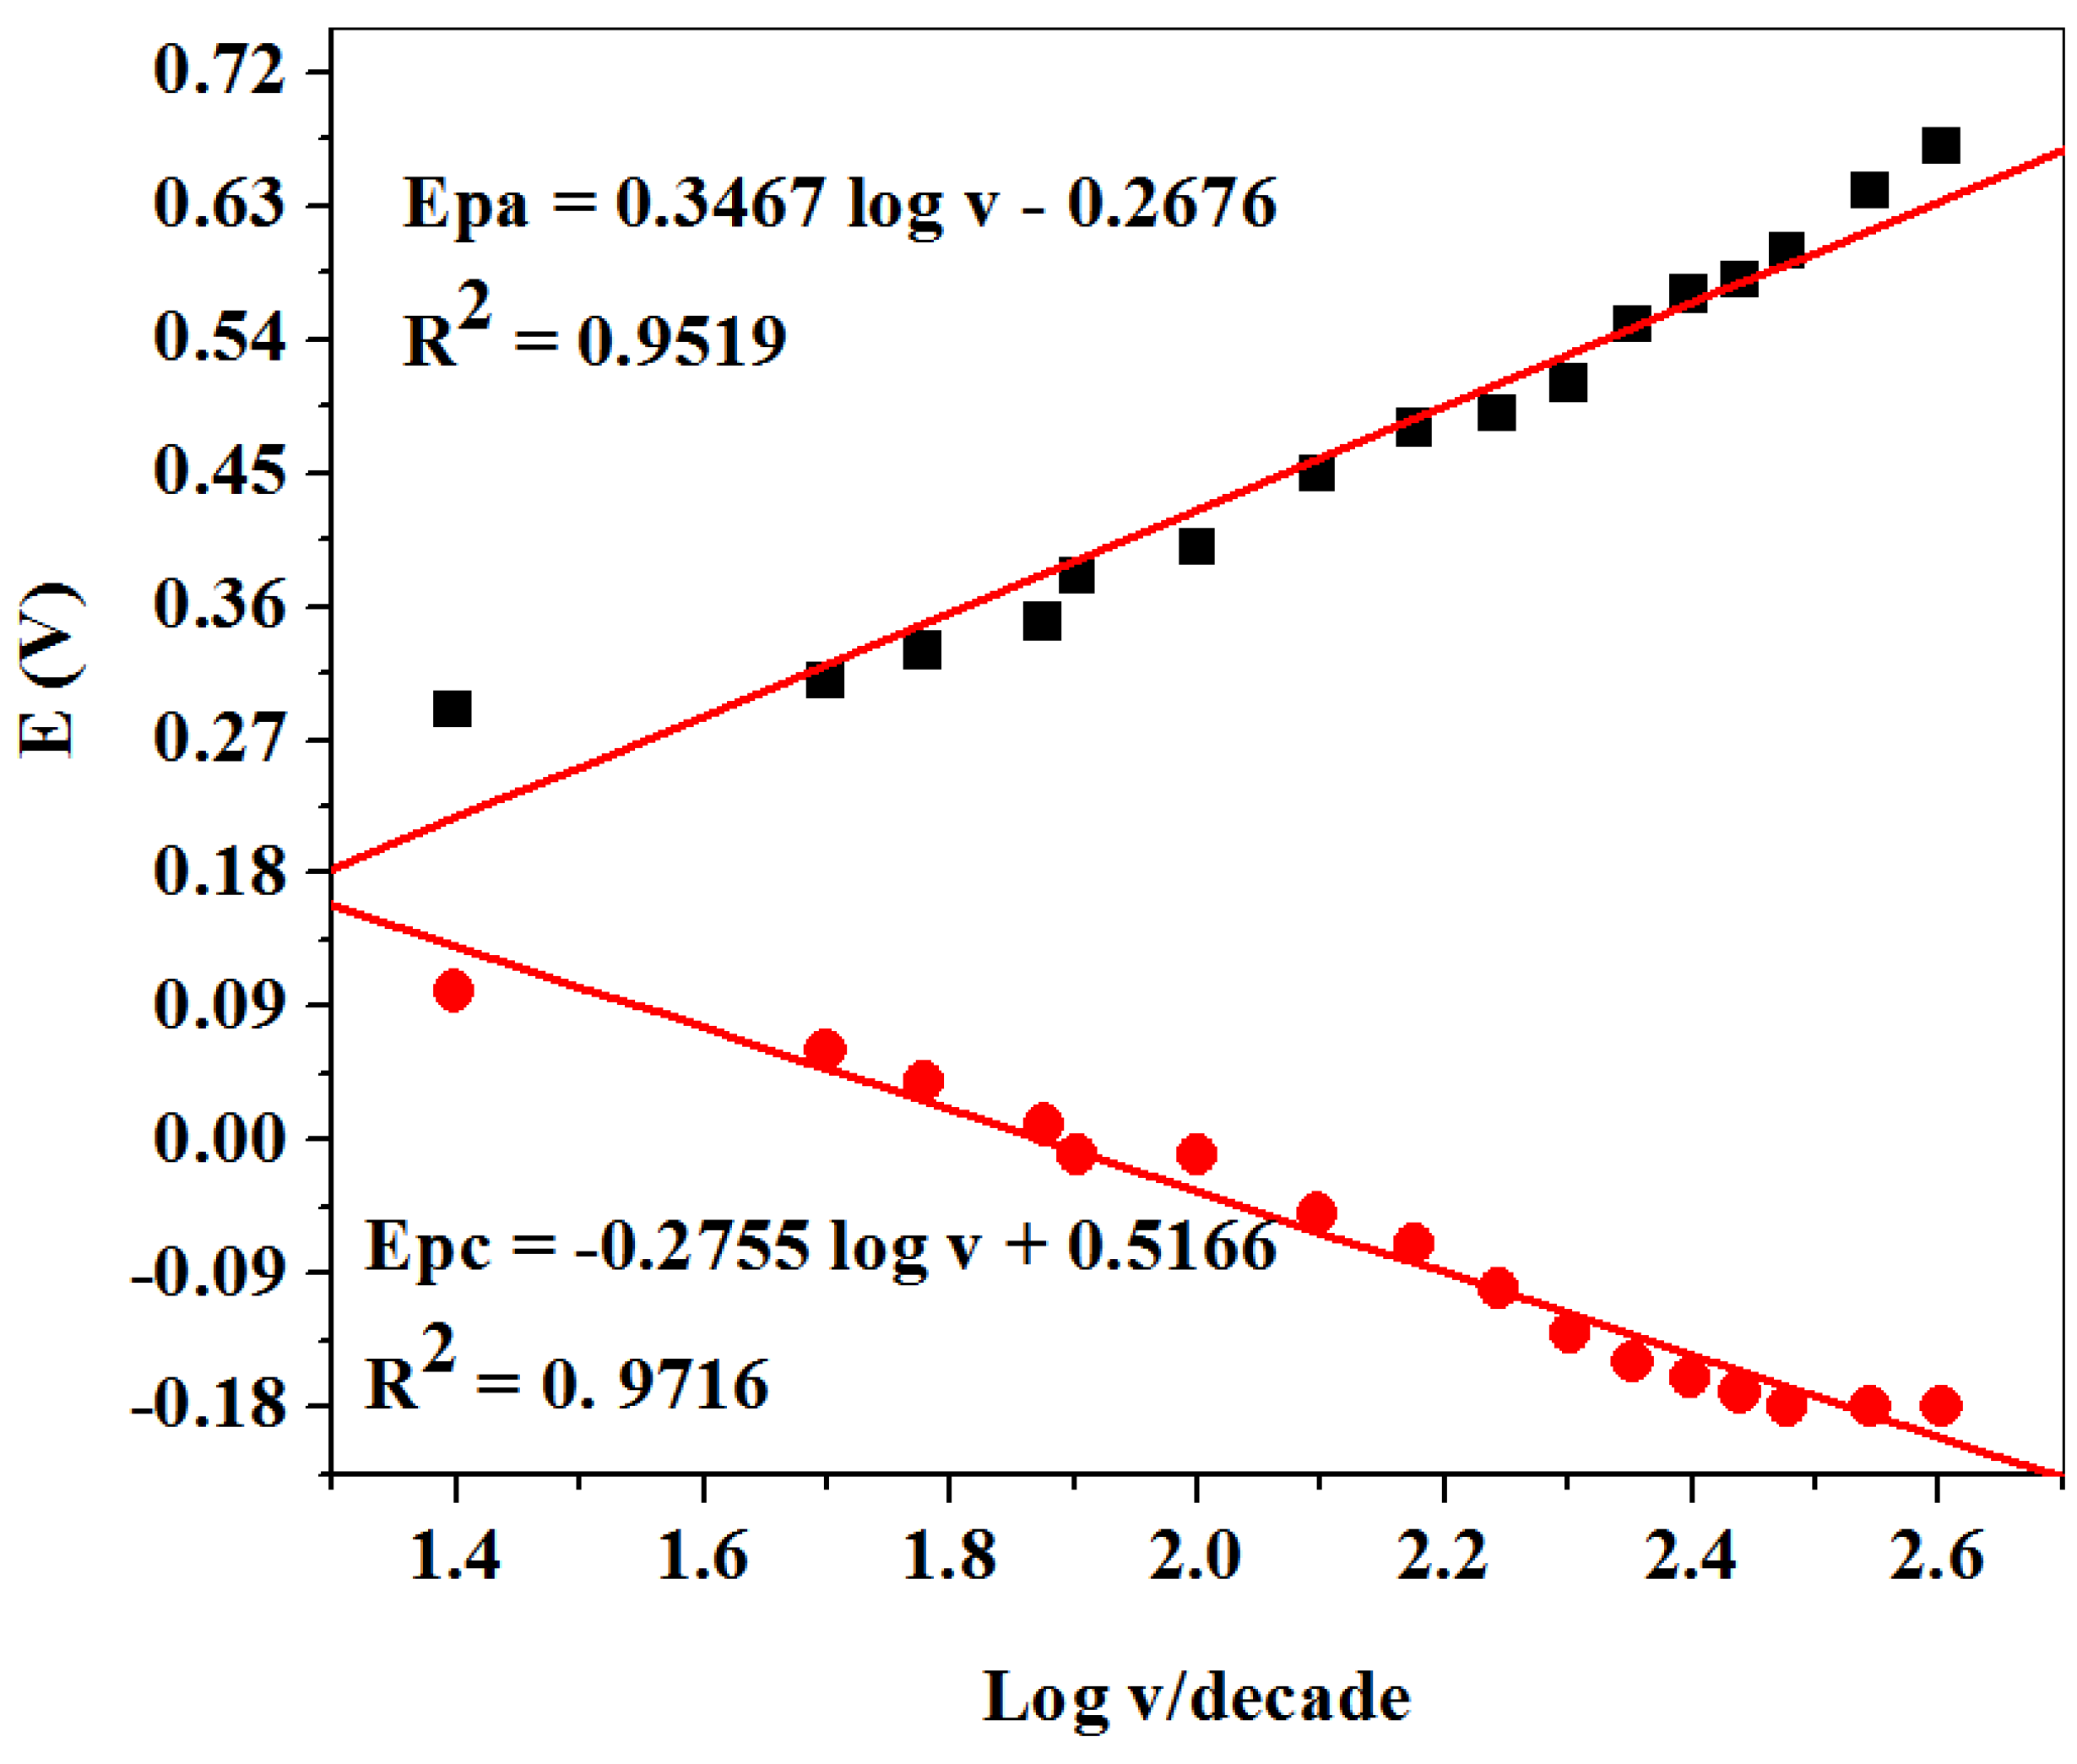
From the cyclic voltammetric measurement in Figure 6a, a linear plot of potential peaks (Epa/Epc) versus the log of scan rate (Figure 7) gave two straight lines with slopes of equal Equations (3) and (4):
E pa = 2.303 RT (   1   α ) nF   log   v
E pc = 2.303 RT α nF   log   v
According to Laviron’s Equations (3) and (4), the number of electron transfer (n) and charge transfers coefficient (α) were calculated to be 1 and 0.53, respectively. Additionally, the Tafel value (b) was found to be 0.375 Vdec−1 using Equation (5) which is higher than the theoretical value (0.118 Vdec−1), suggesting adsorption on the electrode surface by reactants:
E p = ( b 2 )   logv + constant

2.2.3. Electrocatalysis of Dopamine

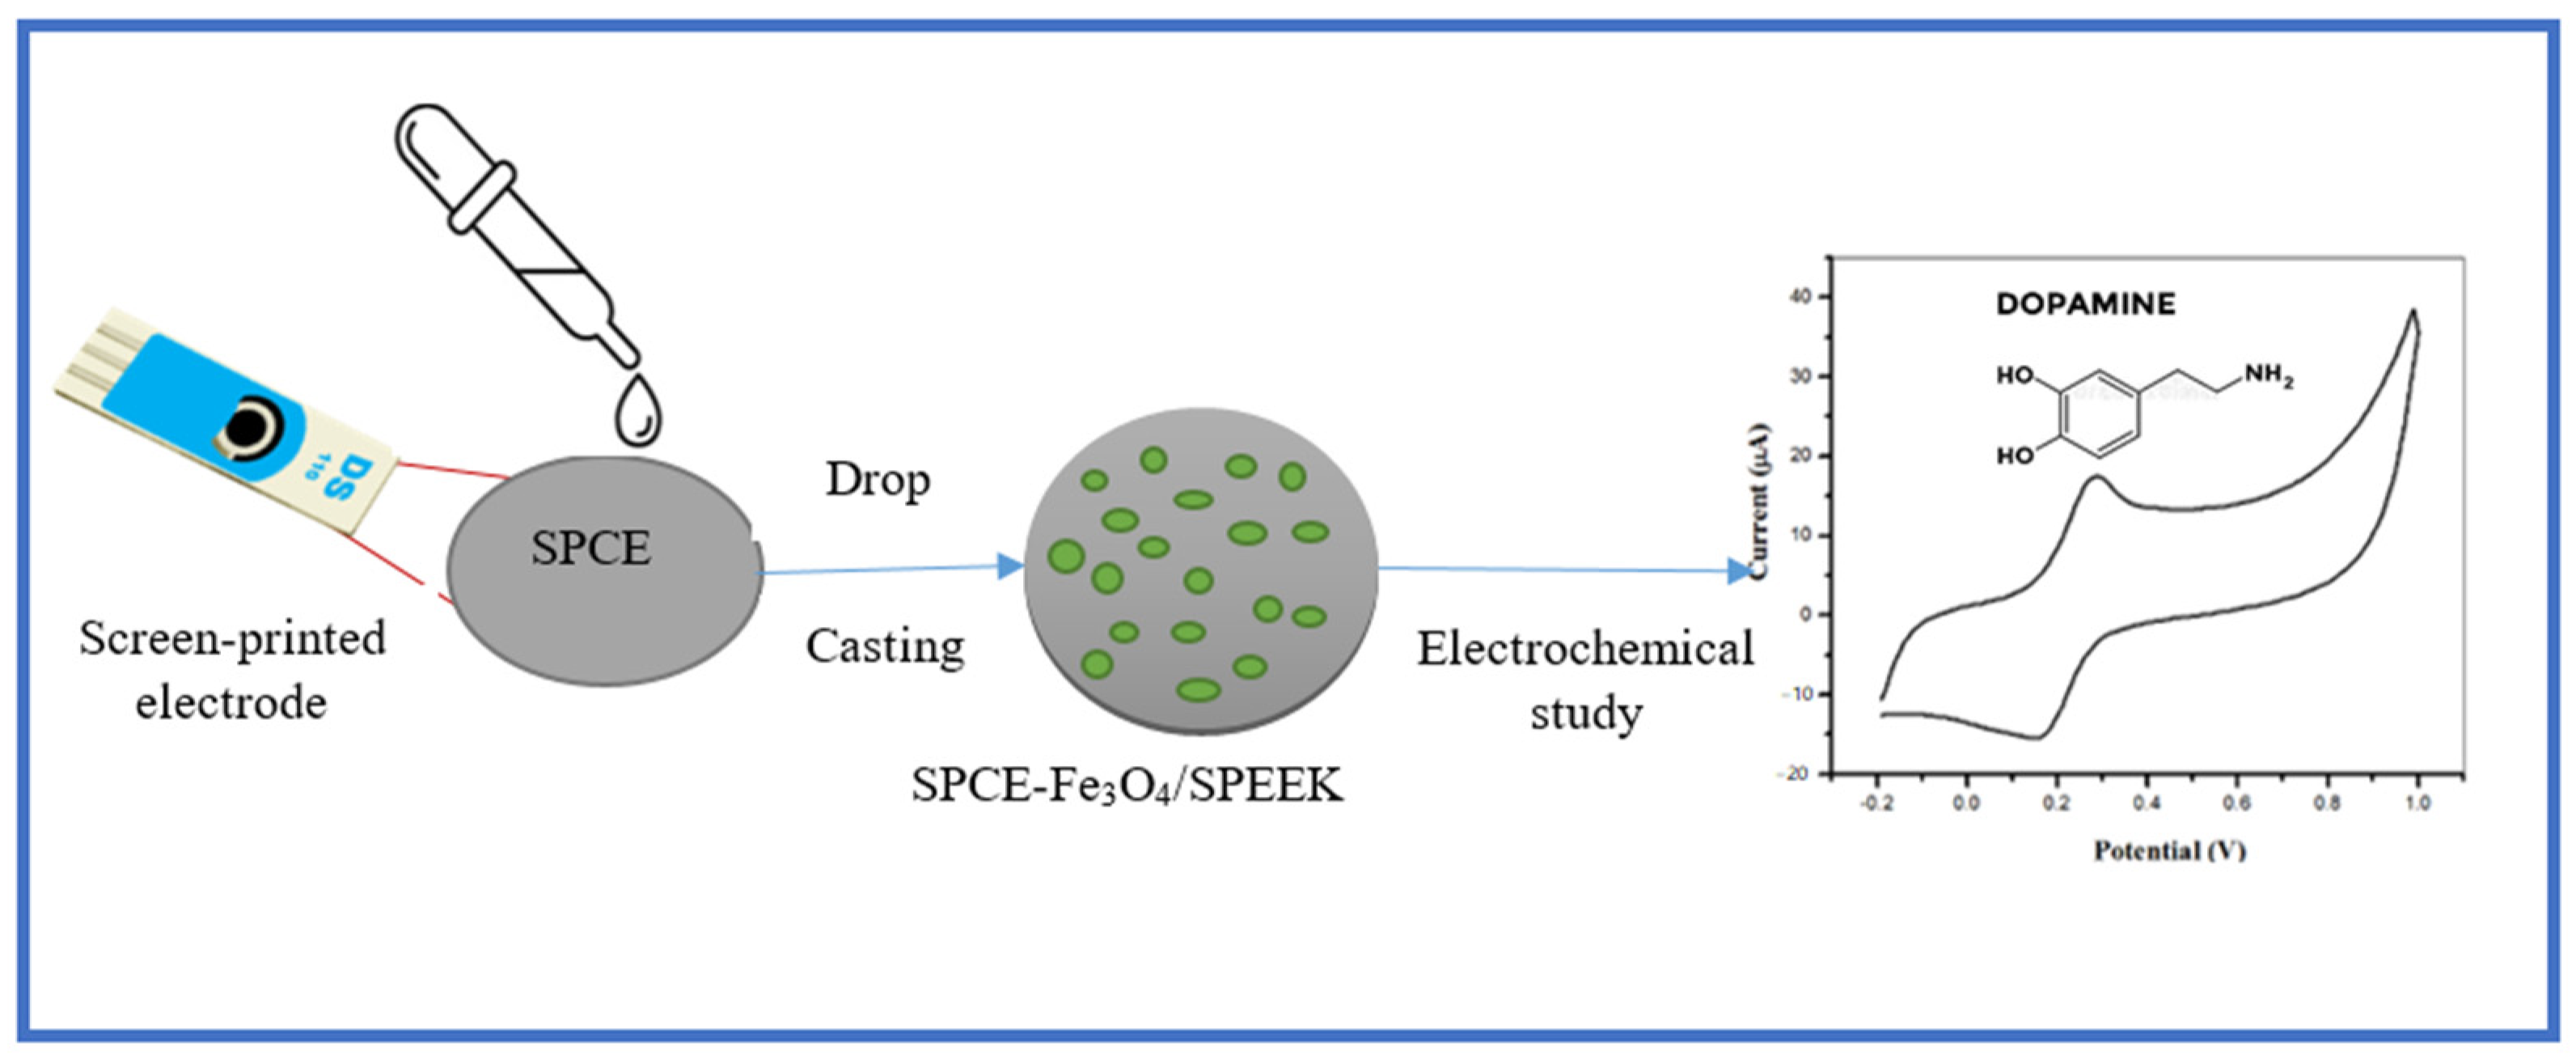
Figure 8 shows the schematic diagram summarizing the electrode chemical modification of the electrode and the response detection of the electrochemical on the Fe3O4/SPEEK electrode in dopamine prepared in 0.1 M PBS of pH 7.4.
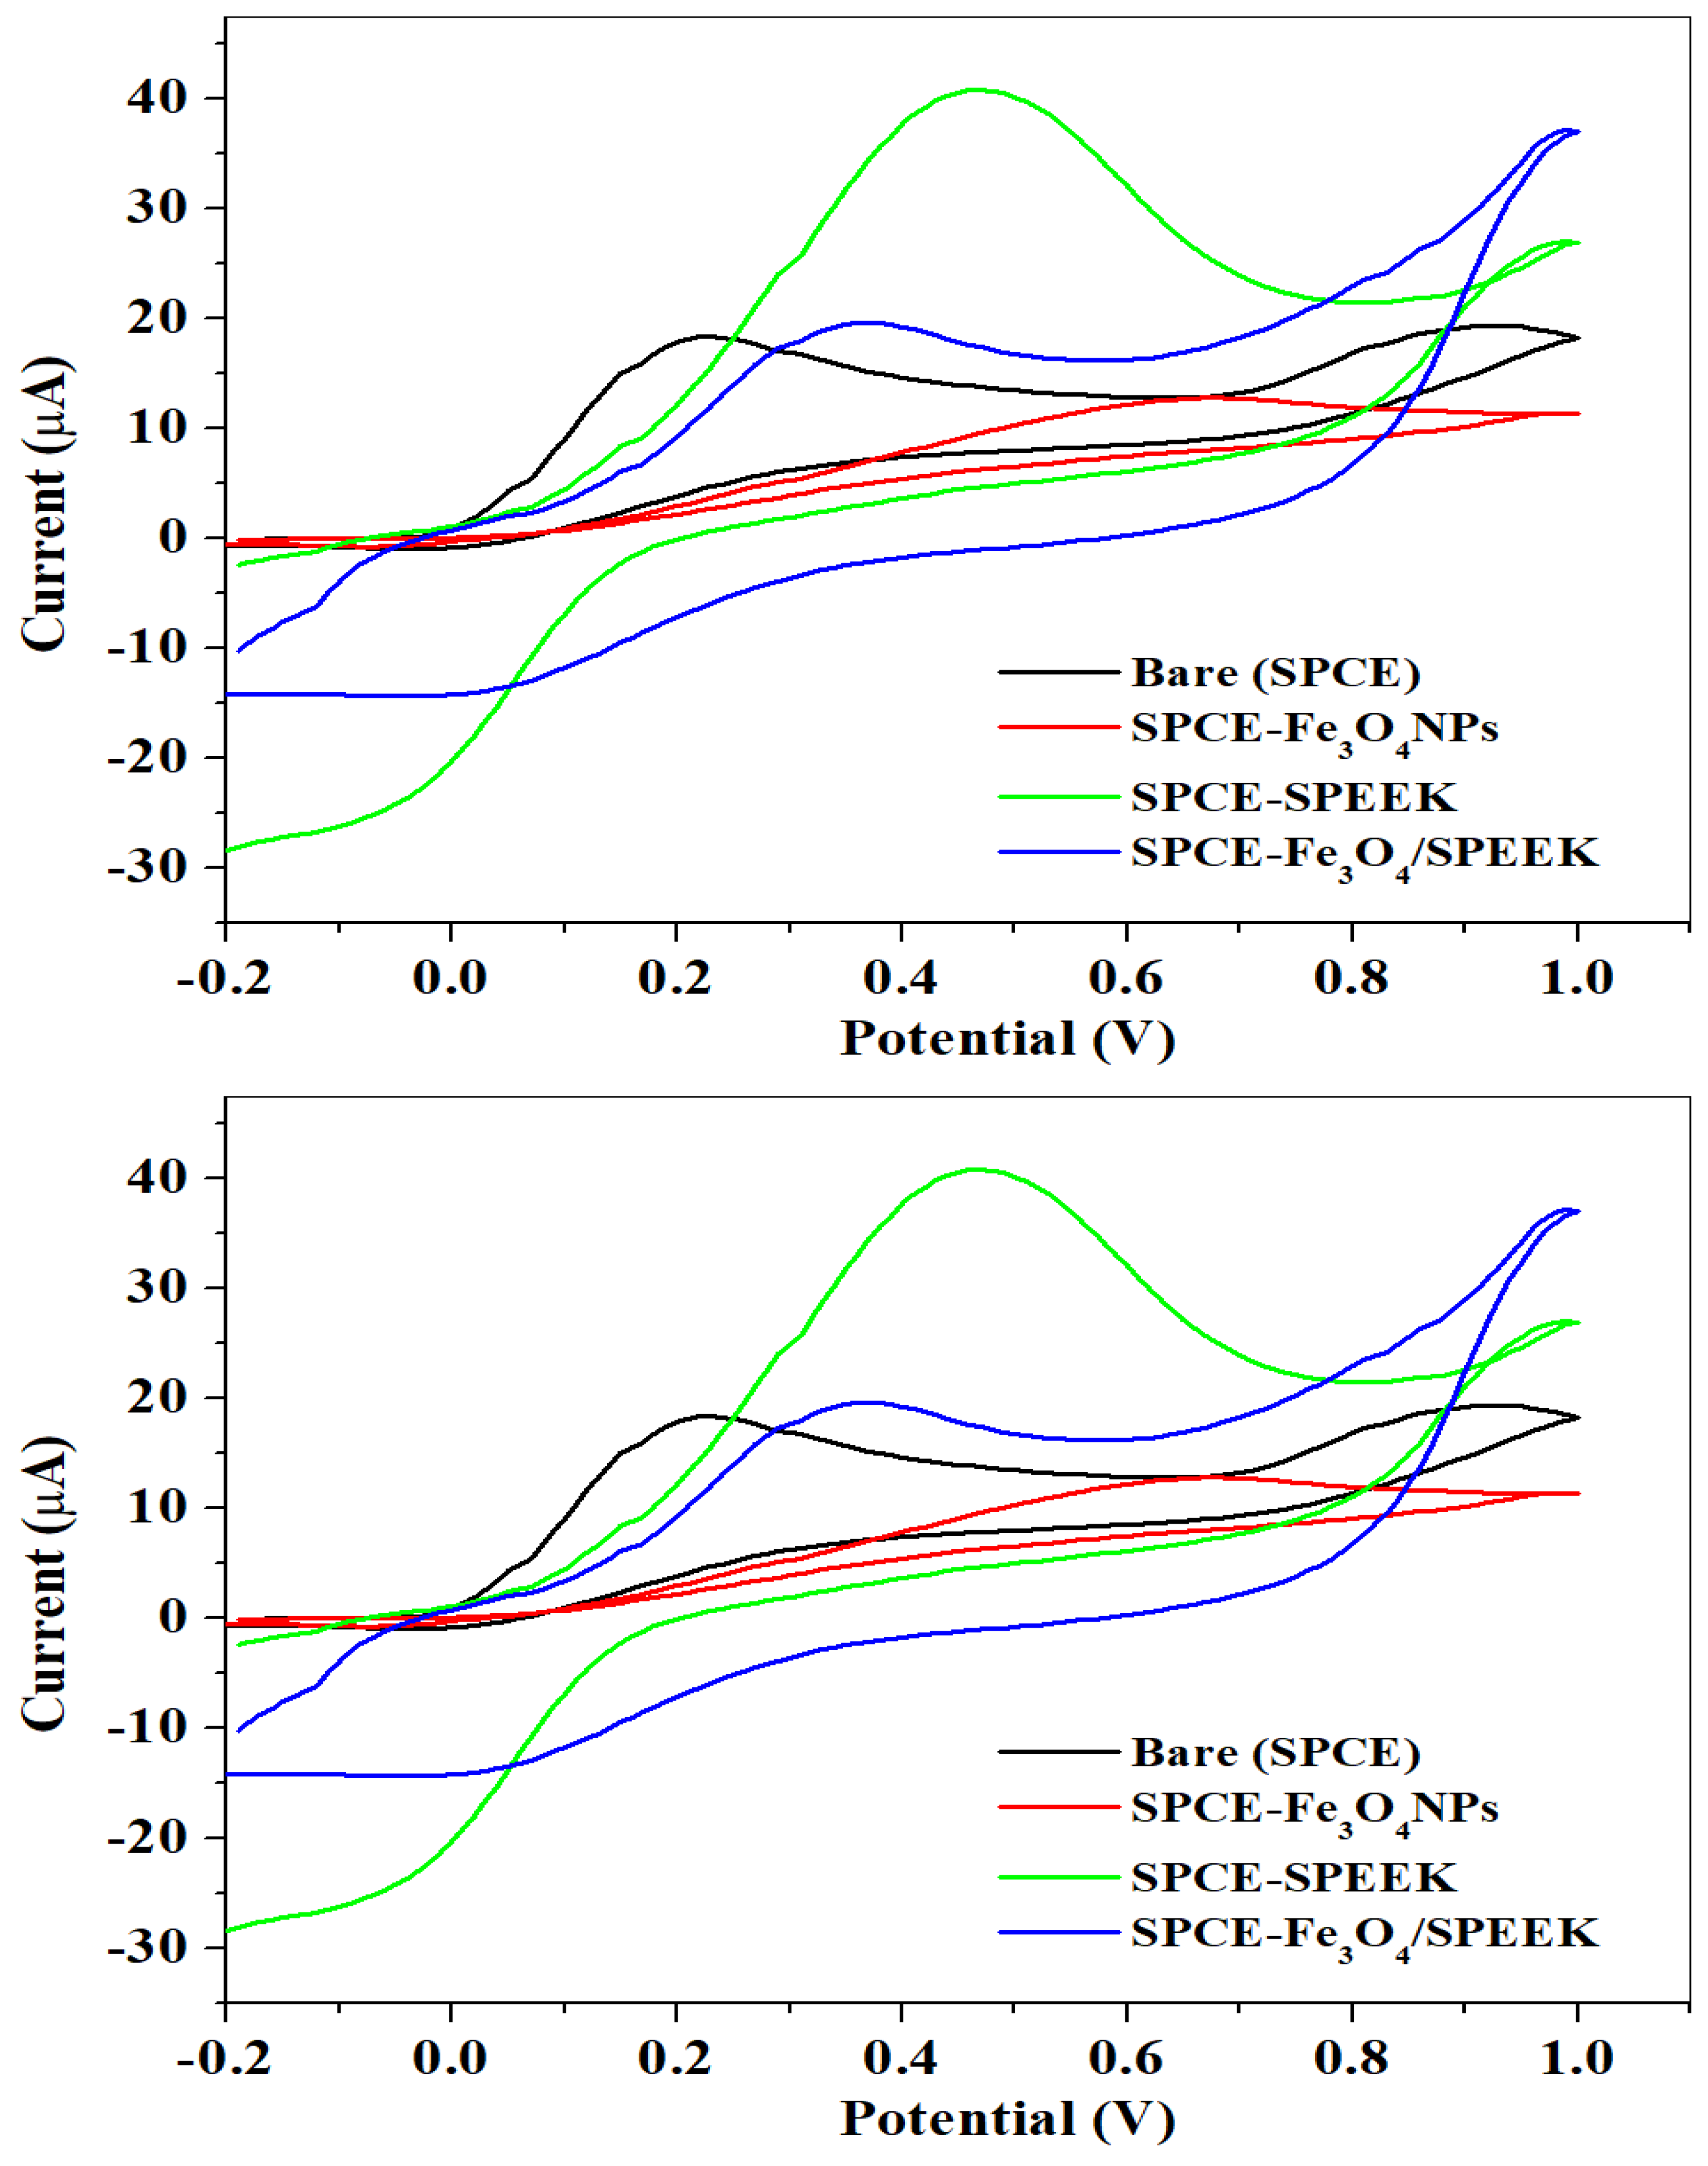
The behaviour of DA on bare and modified screen-printed electrodes (bare-SPCE, SPCE-Fe3O4NPs, SPCE-SPEEK, and SPCE-Fe3O4/SPEEK) was studied using cyclic voltammetry at a 25 mV/s scan rate as shown in Figure 9. Redox peaks were observed in all the electrodes. The oxidation peak current of the SPCE-Fe3O4/SPEEK electrode was slightly higher than the bare, which could be due to the presence of SPEEK ascribed to its good electrical conductivity, but smaller than the SPCE-SPEEK electrode. However, obtained oxidation potential for DA at the SPCE-Fe3O4/SPEEK electrode was nearer to 0.25 V expected for DA. The high peak current observed on the SPCE/SPEEK electrode, compared with SPCE-Fe3O4/SPEEK, could be due to the excellent electronic conductivity property of SPEEK, which enhanced the reactivity of Fe3O4. The Fe3O4 nanoparticles-modified electrode showed a lower redox peak current than the bare-SPCE on the DA probe, due to the quick assembling of nanoparticles that conduct to larger particles of Fe3O4, which may crucially reduce the electrochemical properties of the electrode and, thus, be electro-inactive [45,46]. Parameters determined in cyclic voltammetric detection of DA on bare and modified electrodes are shown in Table 2.

2.2.4. Scan Rate Study on Dopamine

In Figure 10a, the electrochemical impact of varying scan rates in the range from 25–400 mV/s on the anodic peak currents of the nanocomposite-modified SPCE-Fe3O4/SPEEK toward 0.1 mM DA oxidation was investigated using cyclic voltammetry. An increase in the scan rate resulted in shifts of peak potentials to the more positive, and an increase of peak currents, suggesting a diffusion-controlled process. Figure 10b shows the linear plot of peak currents against the square root of scan rate (v1/2) with 0.98 regression values for both anodic and cathodic lines (Ipa and Ipc), confirming a diffusion-controlled process for DA oxidation.
Figure 11 represents the linear plot of peak potentials (Epa/Epc) against the logarithm of scan rate (v). The Tafel slope value was found to be 0.693 V/dec for DA from the slope value of Figure 11 by applying Equation (5). Obtained values were higher than the expected theoretical value of 0.118 V/dec, suggesting adsorption of the reactant on the electrode surface.

2.3. Electro-Analysis of DA

Concentration Study of DA

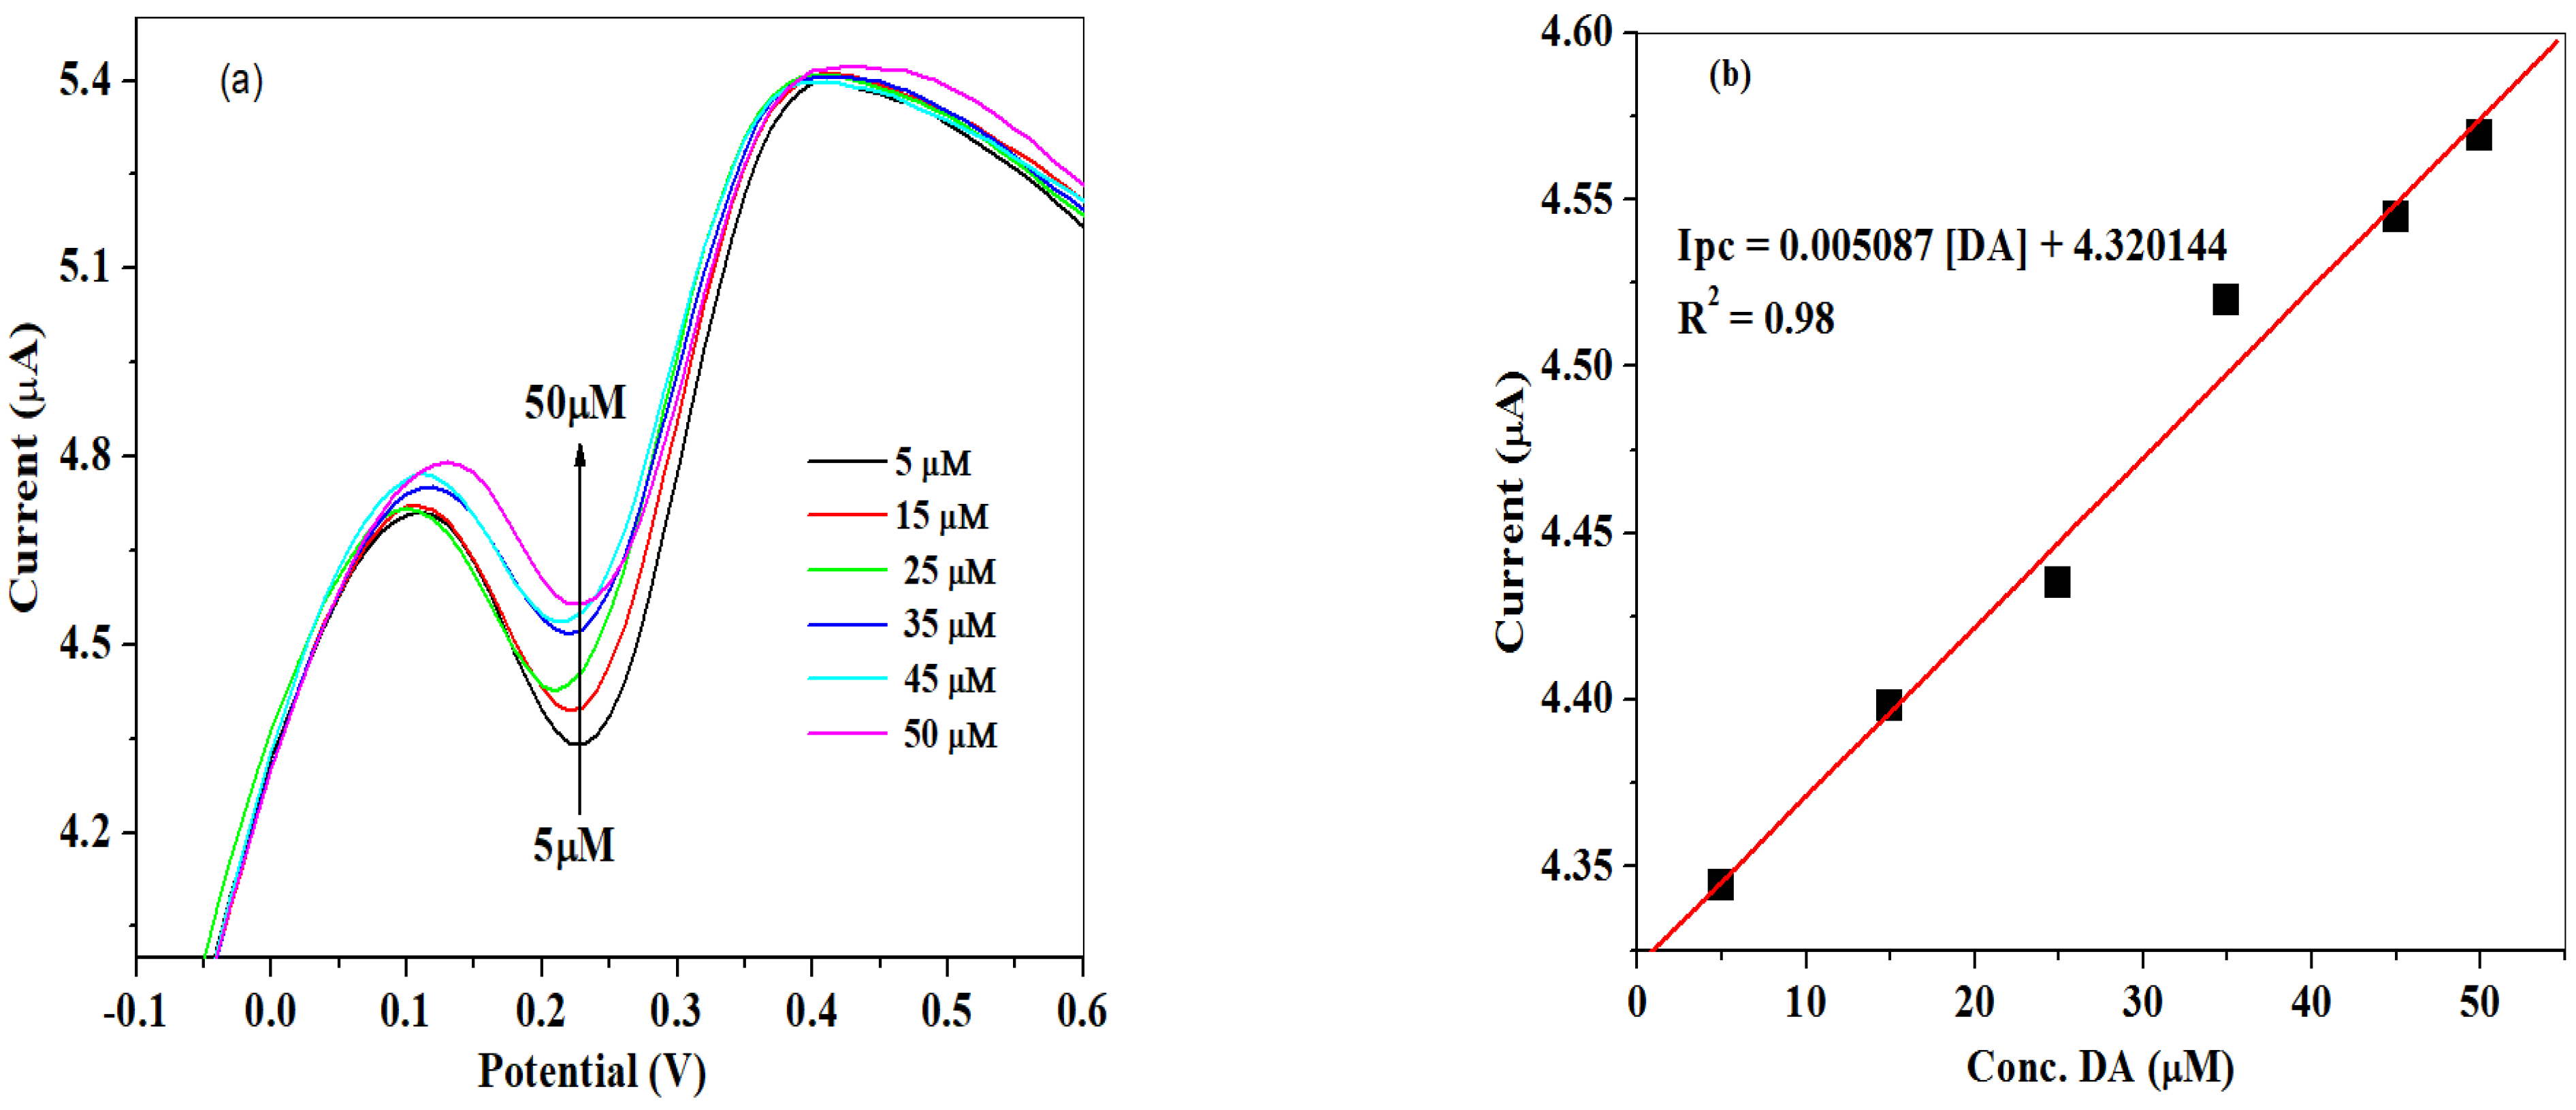
The impact of different concentrations on the DA current response was studied using square wave voltammetry as shown in Figure 12a under the optimal parameters of 0.01 V potential step, 0.001 V amplitude, deposition time of 10 s, and frequency of 25 Hz. The result obtained shows the dependence of reduction peak currents of dopamine on increasing DA concentrations (5 to 50 μM). The poorly defined reduction peak current could be due to the nature of the electrode modifiers. The linear relationship between peak currents and DA concentrations (Figure 12b) yielded a linear regression equation of Ipc = 0.005087 [DA] + 4.320144, and regression value of 0.98. The detection limit was calculated to be 7.2 μM by applying Equation (6). The LoD competes well with previous works investigated in the literature (Table 3):
LoD = 3.3 ×   SD Slope  
SD stands for the standard deviation of the peak current, over the slope of the calibrated plot.
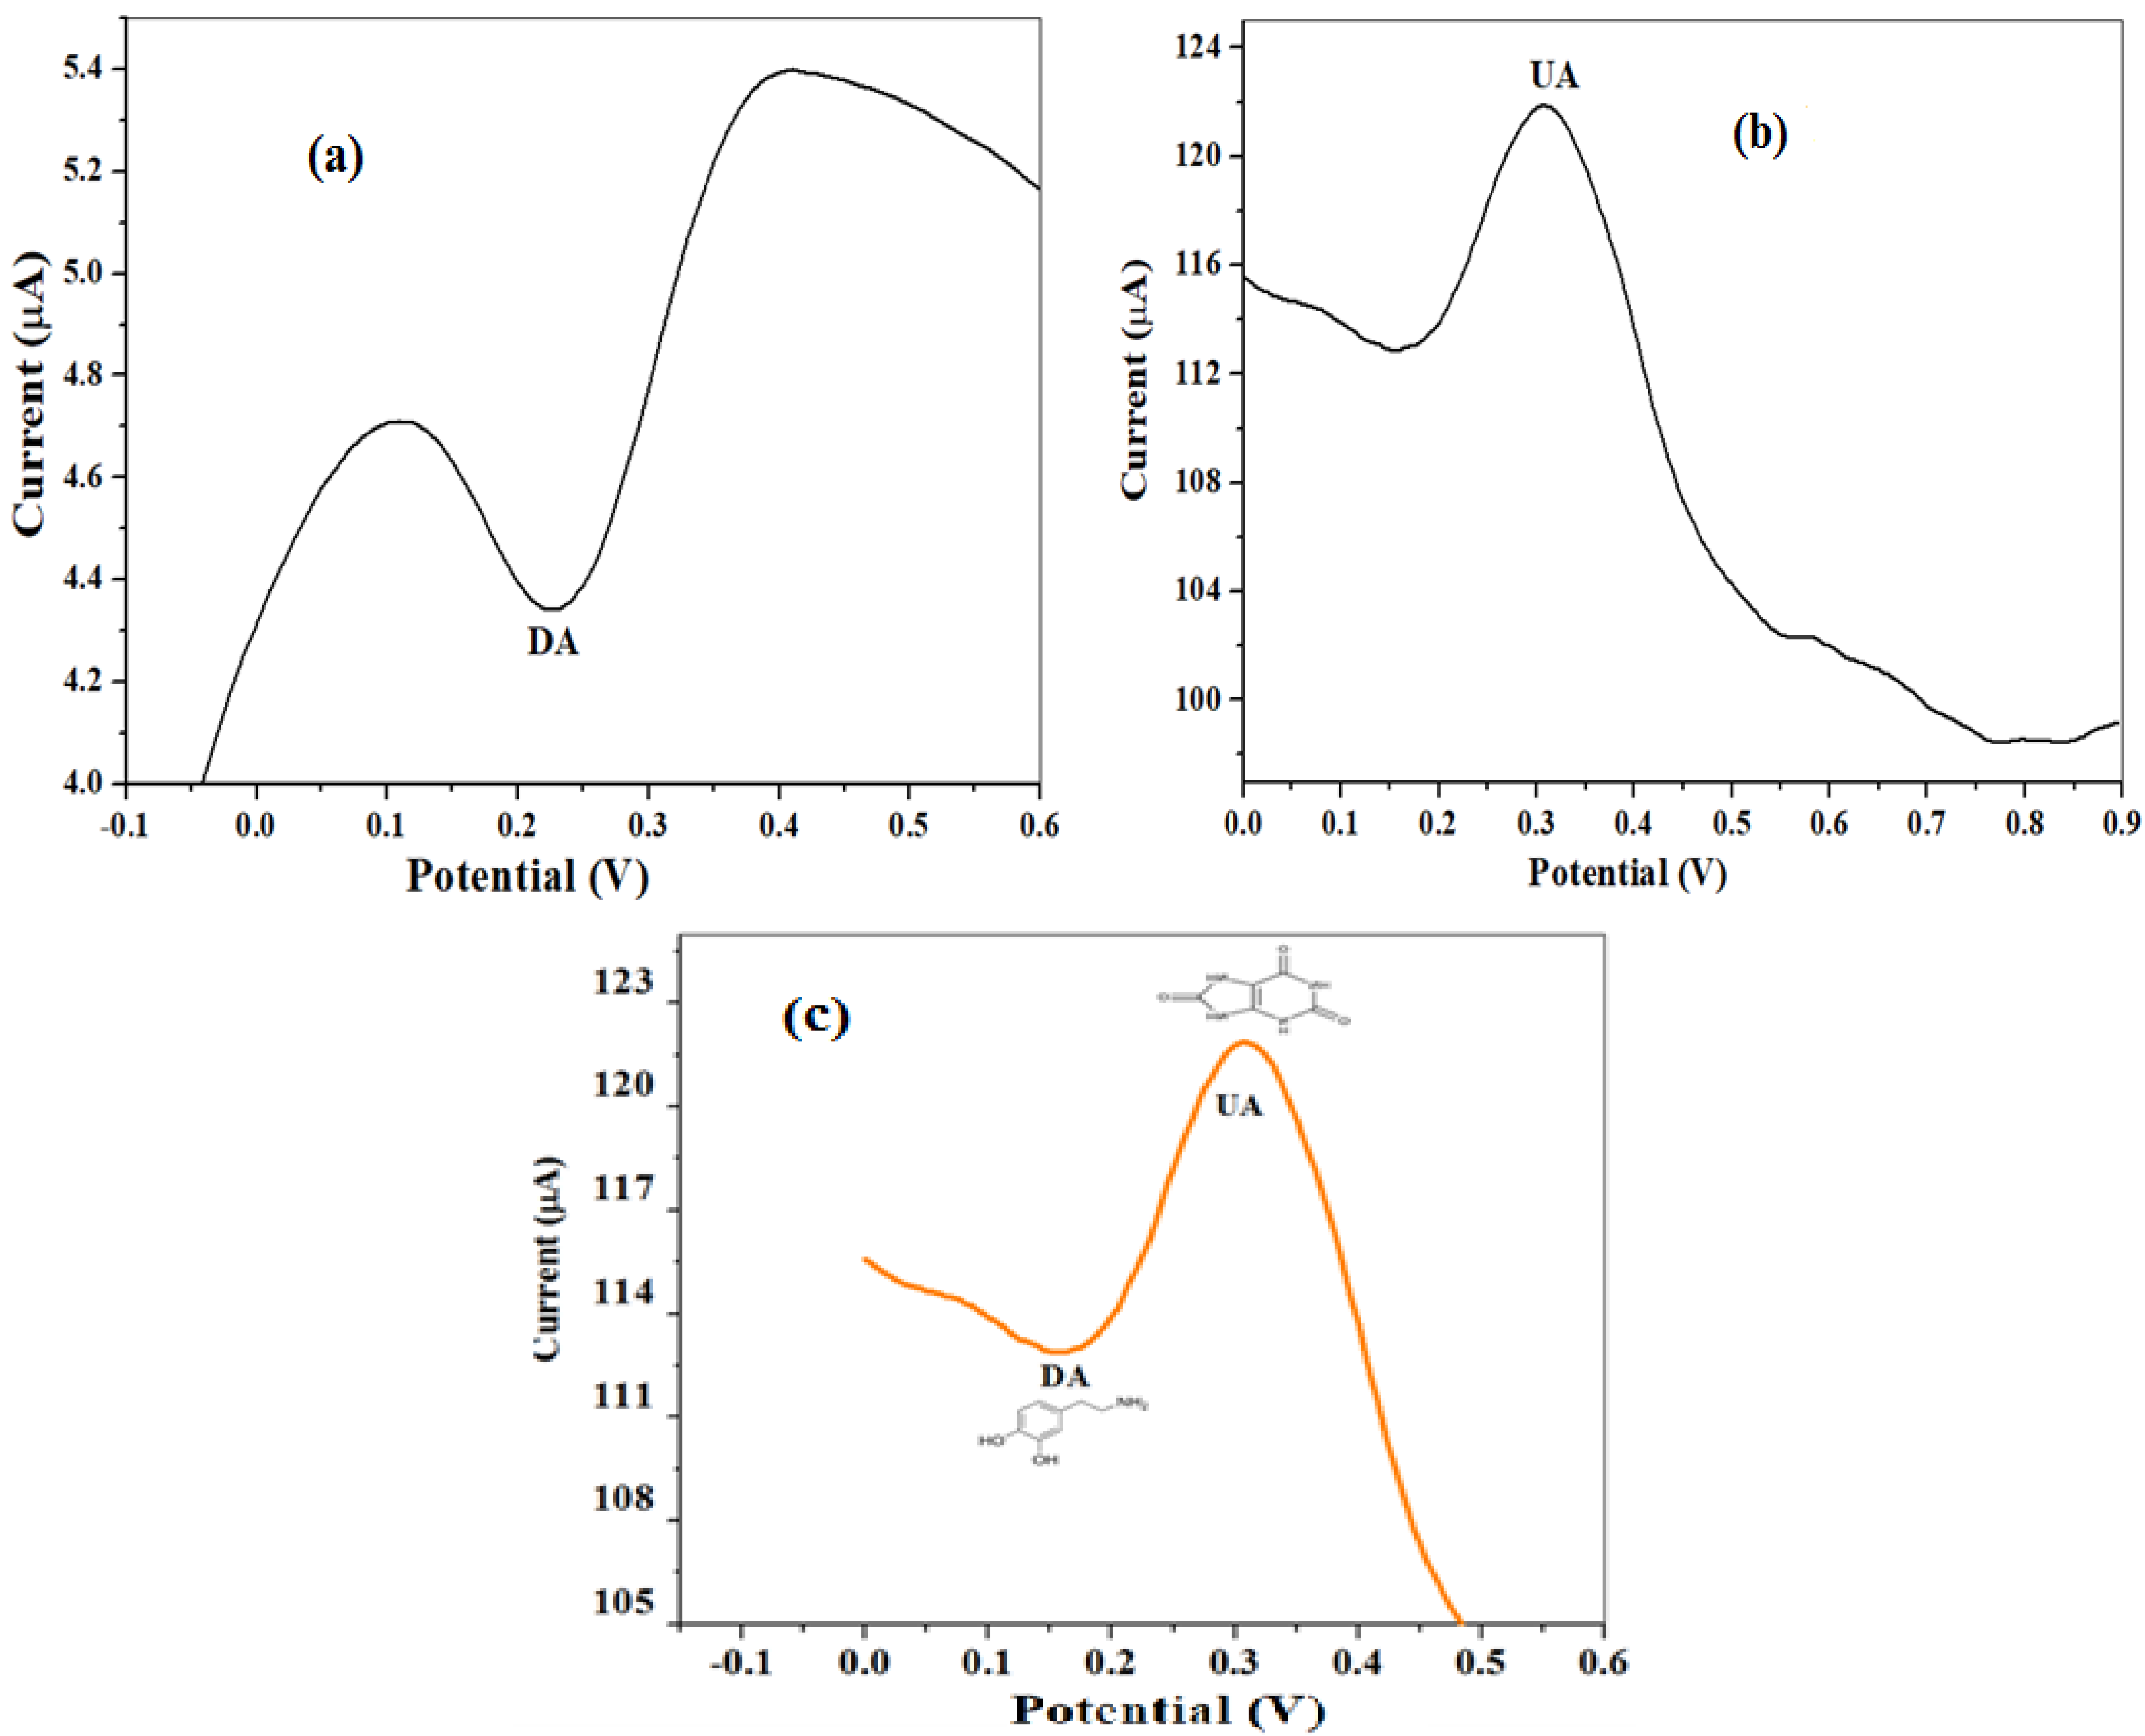
Figure 13a,b show the SW voltammogram of DA and UA accordingly with peak potential observed at 0.23 and 0.36 V for the respective analyte. Figure 13c represents the simultaneous detection of DA and UA of the same concentration with potentials noticed at 0.16 V (DA) and 0.31 V (UA). The shifts in the peak potentials and the peak separation (0.15 V) between DA and UA indicate non-interference of the UA signal with that of DA, successful detection of DA in the presence of UA at the designed electrode, and selectivity of the electrode.

2.4. Analytical Application of the Proposed Sensor for Determination of DA in Pharmaceutical Sample

The practical applicability of the designed sensor for DA determination was investigated using a diluted DA hydrochloride injection (dopamine HCl-Fresenius 200 mg/5 mL) sample, spiked with different concentrations of DA standards in accordance with well-established standard addition procedure. The results recorded from the SWV measurements under optimum conditions (0.01 potential step, 0.001 amplitude, deposition time 10 s, and frequency of 25 Hz) are summarized in Table 4. Satisfactory recoveries in the range from 99.9% to 100% were obtained with good relative standard deviations (RSDs), illustrating the promising application of the SPCE-Fe3O4/SPEEK electrode for the determination of DA in real samples.

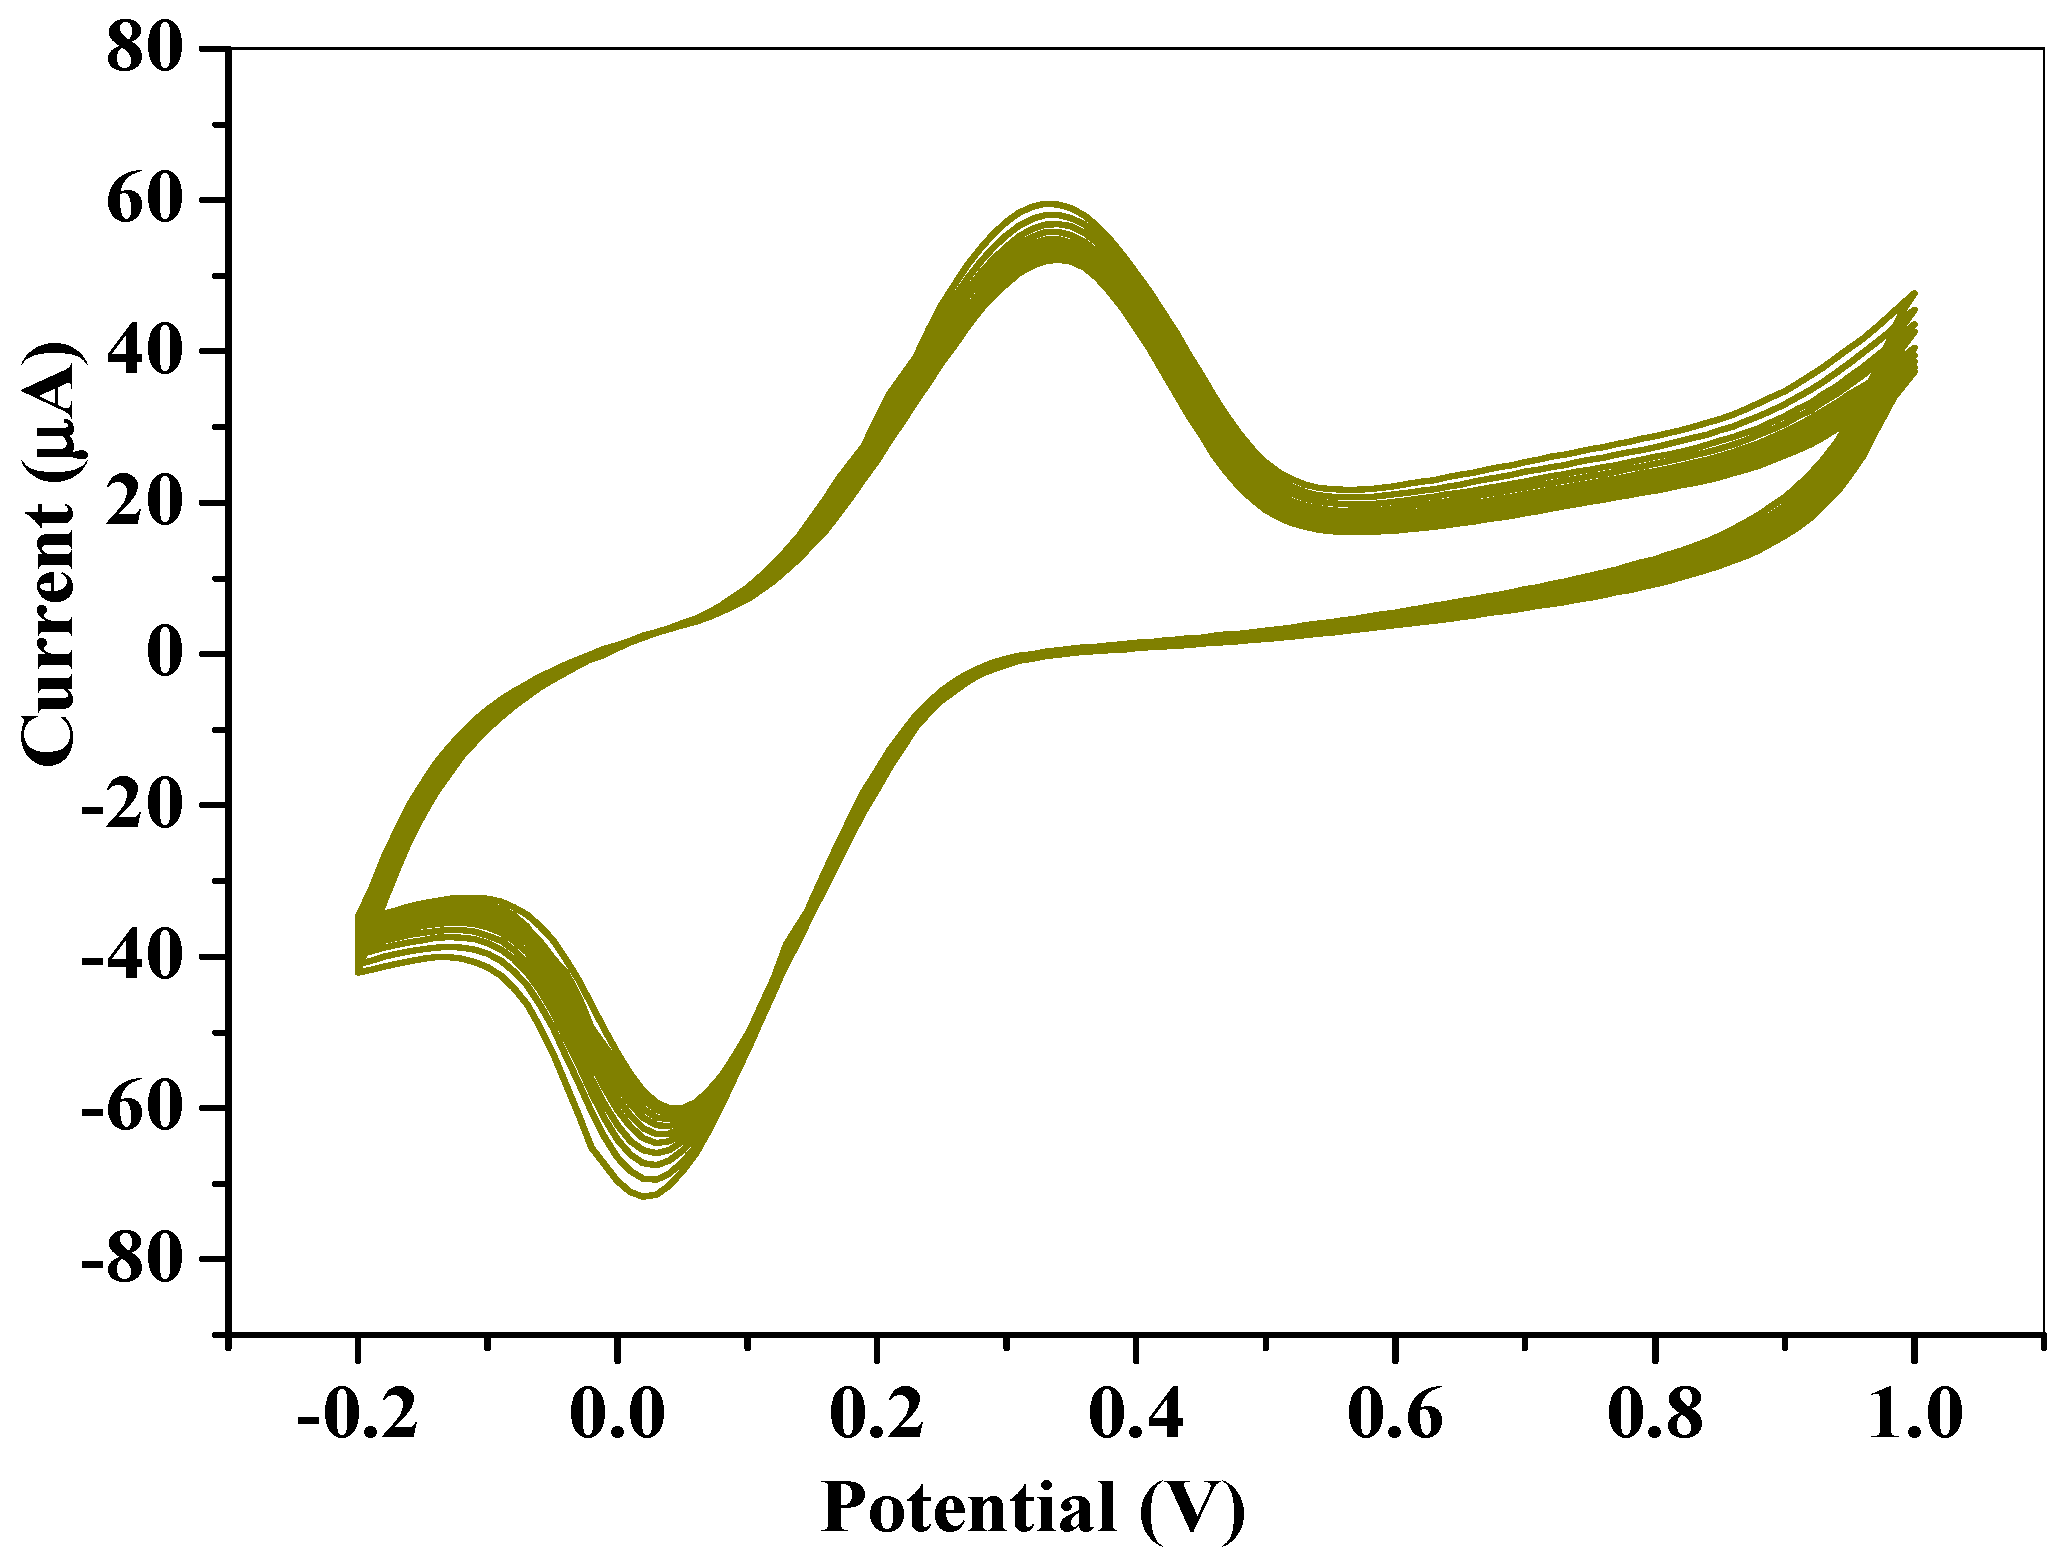
2.5. Repeatability and Stability Study for Fe3O4/SPEEK

The repeatability study of the SPCE-Fe3O4/SPEEK modified electrode was conducted using cyclic voltammetry at a 25 mVs−1 scan rate, for 10 repetitive scans in 0.1 mM DA (Figure 14). Relative standard deviations of 0.75 and 2.45% were obtained for oxidation peak potential and peak current, accordingly, suggesting acceptable repeatability, stability, and reproducibility of the electrochemical sensor. Peak current was monitored for 28 days at an interval of 5 days, and the electrode was stored in the refrigerator when not in use. A 45% increase of the initial peak current was observed which could be attributed to increased assimilation of the nanocomposite (SPCE-Fe3O4/SPEEK) onto the electrode surface over time.

3. Materials and Methods

The L. serica plant was collected from Kwa-Zulu Natal province. Iron (II) chloride tetrahydrate (FeSO4·4H2O) and iron (III) chloride hexahydrate (FeCl3·6H2O) are products from BDH and LABCHEM, South Africa. Sodium phosphate salts (Na2HPO4 and NaH2PO4) products of LABCHEM and GlassWorld, South Africa, were used in the preparation of 0.1 M phosphate buffer solution (PBS) of pH 7.4. Potassium ferricyanide (III) (K3[Fe(CN)6]) and dopamine hydrochloride were purchased from Sigma–Aldrich (St. Louis, MO, USA). Dimethyl formamide (DMF), sodium hydroxide (NaOH), and distilled water was produced by Emplura® Merck (The Chemical Center from Maharashtra, India). All chemicals used were of analytical grade.

3.1. Preparation of Plant Leaf Extract

Approximately 10 g of ground fine powdered leaves of the L. serica plant was weighed and transferred into a conical flask followed by the addition of 200 mL of distilled water and heated for several minutes at 60 °C until a change in colour (dark green-brown solution) was observed. Leaf extract was filtered using Whatman No. 1 filter paper and a Buchner flask [51].

3.2. Synthesis of Iron Oxide Nanoparticles

The green meditation of Fe3O4NPs derived from L. serica leaf extract following the prescribed method with a few minor changes [52,53]. 2:1 M volume ratio of iron (II) chloride tetrahydrate and iron (III) chloride tetrahydrate solution was added to the L. serica extract with a resultant black-coloured precipitate, indicating the formation of precipitates (iron oxide nanoparticle). The pH of the mixture was adjusted to 11 by the addition (drop-wise) of 1.0 M of NaOH solution under continuous stirring. The solution was thereafter stirred for 1 h to complete the reaction homogeneity, filtered using vacuum filtered precipitates (Fe3O4NPs) washed several times with distilled water, and air-dried in the fume wood overnight. The dried sample was stored in an airtight container for further characterization.

3.3. Preparation of SPEEK Polymer

Details on SPEEK preparation (sulphonation of polyether ether ketone) have been reported in our previous work [54].

3.4. Synthesis of Iron Oxide/SPEEK Nanocomposites

20 mg of SPEEK and 40 mg of iron oxide nanoparticles were dissolved in N, N-dimethylformamide solution, sonicated for 48 h at room temperature, and stored for further characterization.

3.5. Characterization of Nanomaterials Synthesized

The successful synthesis of the Fe3O4NPs and nanocomposite (SPEEK/Fe3O4) were confirmed through characterizing techniques by using Carry 300, UV–Vis Spectrophotometer, Agilent Technologies, Waldbronn, Germany, spectroquant Prove300, Merck KGaA, (Darmstadt, Germany), and UV–Vis Uviline 9400 (Sl Analytics, Hattenbergstr.10, D-55122 Mainz, Germany) in the investigation of the Nanomaterials optical properties of the nanomaterial fabricated. FTIR (Opus Alpha-P, Brucker Corporation, Billerica, MA, USA). Quanta FEG 250 ESEM, (ThermoFisher Scientific, Waltham, MA, USA) operating on an acceleration voltage of 15.0 kV was employed to describe the surface structure of the nanomaterials prepared. X-ray diffraction spectroscopy (XRD) from Bruker company, Karlsruhe, Germany, and scanning electron microscopy (SEM) from JEOL company, Dearborn, Peabody, MA, USA).

3.6. Electrode Modification and Electrochemical Studies

Separate suspensions of Fe3O4NPs (20 mg), SPEEK (20 mg), and Fe3O4/SPEEK (20 mg each) were dispersed in DMF and ultra-sonicated for 48 h to form a paste prior to electrode modification. Formed pastes were dropped on SPCE and air-dried to give SPCE-SPEEK, SPCE-Fe3O4NP, and SPCE-Fe3O4/SPEEK. Electrochemical studies were conducted on the screen-printed carbon electrode (DropSens 110) of 4 mm in diameter, which consists of working, reference (A/AgCl), and a counter electrode adapted into a Dropview 200 potentiostat powered by Dropview 200 software obtained from Metrohm. Electrochemical techniques employed were cyclic voltammetry (CV) and square wave voltammetry (SWV).

3.7. Preparation of Real Sample for Analysis

A dopamine hydrochloride injection (the mL taken) was diluted with distilled water in a 100 mL flask and 2 mL each of the diluted solution was transferred into six 50 mL volumetric flasks. Five of the flasks were spiked with different concentrations of DA stock solution while the sixth flask was held as a control. The flasks were made to the mark using 0.1 M PBS of pH 7.4, and analyzed using SWV in triplicate.

4. Conclusions

In this study, the synthesis of Fe3O4NPs from the L. serica plant and the fabrication of nanocomposite-modified SPCE (SPCE/SPEEK/Fe3O4) for DA detection is reported. The amplified SPCE-Fe3O4/SPEEK peak current, in contrast to Fe3O4NPs, could be attributed to the presence of SPEEK. The plot of peak currents versus the square root of scan rate gave a 0.98 regression value, suggesting the occurrence of a diffusion-controlled electrochemical process. The calculated detection limit competes well with previous studies investigated. In addition, the proposed sensor was selective to DA in the presence of uric acid (UA) and yielded good recovery with excellent RSDs in real sample sensing of DA. The results suggest the potential application of the designed sensor for DA monitoring in the pharmaceutical sample.

Author Contributions

Conceptualization, O.E.F.; Data curation, M.N.R. and O.E.F.; Formal analysis, M.N.R. and O.E.F.; Investigation, M.N.R., G.E.U. and O.E.F.; Methodology, M.N.R. and G.E.U.; Project administration, O.E.F.; Resources, O.E.F.; Software, M.N.R., G.E.U. and O.E.F.; Supervision, O.E.F.; Validation, G.E.U. and O.E.F.; Writing—original draft, M.N.R. and G.E.U.; Writing—review & editing, O.E.F. All authors have read and agreed to the published version of the manuscript.

Funding

This research was funded partly by the National Research Foundation of South Africa (Grant UID Number 129084), and Thutuka (Grant UID 117709), together with North-West University research funds.

Institutional Review Board Statement

Not applicable.

Informed Consent Statement

Not applicable.

Data Availability Statement

The data presented in this study are available on request from the corresponding author.

Acknowledgments

Authors acknowledge the assistance of MASIIM of the North-West University. O.E.F. acknowledged the NRF-Thutuka grant (UID: 117009) and the Higher Degree of North-West University. Mafikeng Campus are also acknowledged. M.N.R. acknowledges NRF for the student bursary.

Conflicts of Interest

Authors confirm that they have no conflict of interest.

Sample Availability

Samples of the compounds are not available from the authors.

References

  1. Kim, B.; Song, H.S.; Jin, H.J.; Park, E.J.; Lee, S.H.; Lee, B.Y.; Park, T.H.; Hong, S. Highly selective and sensitive detection of neurotransmitters using receptor-modified single-walled carbon nanotube sensors. Nanotechnology 2013, 24, 285501. [Google Scholar] [CrossRef]
  2. Palanisamy, S. Simultaneous electrochemical detection of dopamine and uric acid over ceria supported three dimensional gold nanoclusters. Mater. Res. Express 2014, 1, 045020. [Google Scholar] [CrossRef]
  3. Howell, L.L.; Cunningham, K.A. Serotonin 5-HT2 receptor interactions with dopamine function: Implications for therapeutics in cocaine use disorder. Pharmacol. Rev. 2015, 67, 176–197. [Google Scholar] [CrossRef] [Green Version]
  4. Kaya, C.; Block, E.R.; Sorkin, A.; Faeder, J.R.; Bahar, I. Multi-scale spatial simulations reveal the effect of dopamine transporter localization on dopamine neurotransmission. Biophys. J. 2016, 110, 632a. [Google Scholar] [CrossRef] [Green Version]
  5. Meyyappan, M. Nano biosensors for neurochemical monitoring. Nano Converg. 2015, 2, 18. [Google Scholar] [CrossRef] [Green Version]
  6. Sangamithirai, D.; Munusamy, S.; Narayanan, V.; Stephen, A. Fabrication of neurotransmitter dopamine electrochemical sensor based on poly(o-anisidine)/CNTs nanocomposite. Surf. Interfaces 2016, 4, 27–34. [Google Scholar] [CrossRef]
  7. Dhanasekaran, T.; Padmanaban, A.; Gnanamoorthy, G.; Manigandan, R.; Sivakumar, P.K.; Stephen, A.; Narayanan, V. Recent advances in polymer supporting layered double hydroxides nanocomposite for electrochemical biosensors. Mater. Res. Express 2018, 5, 014011. [Google Scholar] [CrossRef]
  8. Buddhala, C.; Loftin, S.K.; Kuley, B.M.; Cairns, N.J.; Campbell, M.; Perlmutter, J.S.; Kotzbauer, P.T. Dopaminergic, serotonergic, and noradrenergic deficits in Parkinson disease. Ann. Clin. Transl. Neurol. 2015, 2, 949–959. [Google Scholar] [CrossRef] [PubMed]
  9. Howes, O.D.; McCutcheon, R.; Owen, M.J.; Murray, R. The role of genes, stress, and dopamine in the development of schizophrenia. Biol. Psychiatry 2017, 81, 9–20. [Google Scholar] [CrossRef] [PubMed] [Green Version]
  10. Schulz-Schaeffer, W.J. Is cell death primary or secondary in the pathophysiology of idiopathic Parkinson’s disease? Biomolecules 2015, 5, 1467–1479. [Google Scholar] [CrossRef] [PubMed] [Green Version]
  11. Petzinger, G.; Holschneider, D.; Fisher, B.; McEwen, S.; Kintz, N.; Halliday, M.; Toy, W.; Walsh, J.; Beeler, J.; Jakowec, M. The effects of exercise on dopamine neurotransmission in Parkinson’s disease: Targeting neuroplasticity to modulate basal ganglia circuitry. Brain Plast. 2015, 1, 29–39. [Google Scholar] [CrossRef] [PubMed] [Green Version]
  12. Sitte, H.H.; Pifl, C.; Rajput, A.H.; Hörtnagl, H.; Tong, J.; Lloyd, G.K.; Kish, S.J.; Hornykiewicz, O. Dopamine and noradrenaline, but not serotonin, in the human claustrum are greatly reduced in patients with Parkinson’s disease: Possible functional implications. Eur. J. Neurosci. 2017, 45, 192–197. [Google Scholar] [CrossRef] [PubMed]
  13. Choi, W.-S.; Kim, H.-W.; Tronche, F.; Palmiter, R.D.; Storm, D.R.; Xia, Z. Conditional deletion of Ndufs4 in dopaminergic neurons promotes Parkinson’s disease-like non-motor symptoms without loss of dopamine neurons. Sci. Rep. 2017, 7, 44989. [Google Scholar] [CrossRef]
  14. Yi, X.; Wu, Y.; Tan, G.; Yu, P.; Zhou, L.; Zhou, Z.; Chen, J.; Wang, Z.; Pang, J.; Ning, C. Palladium nanoparticles entrapped in a self-supporting nanoporous gold wire as sensitive dopamine biosensor. Sci. Rep. 2017, 7, 7941. [Google Scholar] [CrossRef] [PubMed] [Green Version]
  15. Gaudry, D.; Carlsen, S.; Khemani, L.; Miotto, J.; Alkalay, D. Determination of the dopamine agonist CGS 15855A in human plasma by gas chromatography/mass spectrometry. Anal. Lett. 1989, 22, 2307–2321. [Google Scholar] [CrossRef]
  16. Li, N.; Guo, J.; Liu, B.; Yu, Y.; Cui, H.; Mao, L.; Lin, Y. Determination of monoamine neurotransmitters and their metabolites in a mouse brain microdialysate by coupling high-performance liquid chromatography with gold nanoparticle-initiated chemiluminescence. Anal. Chim. Acta 2009, 645, 48–55. [Google Scholar] [CrossRef]
  17. Gao, W.; Qi, L.; Liu, Z.; Majeed, S.; Kitte, S.A.; Xu, G. Efficient lucigenin/thiourea dioxide chemiluminescence system and its application for selective and sensitive dopamine detection. Sens. Actuators B Chem. 2017, 238, 468–472. [Google Scholar] [CrossRef]
  18. Zhang, X.; Zhu, Y.; Li, X.; Guo, X.; Zhang, B.; Jia, X.; Dai, B. A simple, fast and low-cost turn-on fluorescence method for dopamine detection using in situ reaction. Anal. Chim. Acta 2016, 944, 51–56. [Google Scholar] [CrossRef]
  19. Fayemi, O.E.; Adekunle, A.; Swamy, B.; Ebenso, E.E. Electrochemical sensor for the detection of dopamine in real samples using polyaniline/NiO, ZnO, and Fe3O4 nanocomposites on glassy carbon electrode. J. Electroanal. Chem. 2018, 818, 236–249. [Google Scholar] [CrossRef]
  20. Fayemi, O.E.; Baskar, R.; Adekunle, A.S.; Sherif, E.M.; Ebenso, E.E. SPEEK/ZnO Nanocomposite modified gold electrode for electrochemical detection of dopamine. Electroanalysis 2020, 32, 2713–2722. [Google Scholar] [CrossRef]
  21. Manbohi, A.; Ahmadi, S.H. Sensitive and selective detection of dopamine using electrochemical microfluidic paper-based analytical nanosensor. Sens. Bio-Sens. Res. 2019, 23, 100270. [Google Scholar] [CrossRef]
  22. Zablocka, I.; Wysocka-Zolopa, M.; Winkler, K. Electrochemical detection of dopamine at a gold electrode modified with a polypyrrole–mesoporous silica molecular sieves (MCM-48) film. Int. J. Mol. Sci. 2019, 20, 111. [Google Scholar] [CrossRef] [PubMed] [Green Version]
  23. Patra, J.K.; Baek, K.-H. Green biosynthesis of magnetic iron oxide (Fe3O4) nanoparticles using the aqueous extracts of food processing wastes under photo-catalyzed condition and investigation of their antimicrobial and antioxidant activity. J. Photochem. Photobiol. B Biol. 2017, 173, 291–300. [Google Scholar] [CrossRef]
  24. Ramesh, A.V.; Devi, D.R.; Botsa, S.M.; Basavaiah, K. Facile green synthesis of Fe3O4 nanoparticles using aqueous leaf extract of Zanthoxylum armatum DC. For efficient adsorption of methylene blue. J. Asian Ceram. Soc. 2018, 6, 145–155. [Google Scholar] [CrossRef] [Green Version]
  25. Zhou, Z.H.; Wang, J.; Liu, X.; Chan, H.S.O. Synthesis of Fe3O4 nanoparticles from emulsions. J. Mater. Chem. 2001, 11, 1704–1709. [Google Scholar] [CrossRef]
  26. Wang, W.-W.; Zhu, Y.-J.; Ruan, M.-L. Microwave-assisted synthesis and magnetic property of magnetite and hematite nanoparticles. J. Nanopart. Res. 2007, 9, 419–426. [Google Scholar] [CrossRef]
  27. Zhang, W.; Shen, F.; Hong, R. Solvothermal synthesis of magnetic Fe3O4 microparticles via self-assembly of Fe3O4 nanoparticles. Particuology 2011, 9, 179–186. [Google Scholar] [CrossRef]
  28. Salarizadeh, P.; Javanbakht, M.; Pourmahdian, S. Enhancing the performance of SPEEK polymer electrolyte membranes using functionalized TiO2 nanoparticles with proton hopping sites. RSC Adv. 2017, 7, 8303–8313. [Google Scholar] [CrossRef] [Green Version]
  29. Uwaya, G.E.; Fayemi, O.E. Electrochemical detection of serotonin in banana at green mediated PPy/Fe3O4NPs nanocomposites modified electrodes. Sens. Bio-Sens. Res. 2020, 28, 100338. [Google Scholar] [CrossRef]
  30. Jain, R.; Tiwari, D.C.; Shrivastava, S. Polyaniline-bismuth oxide nanocomposite sensor for quantification of anti-parkinson drug pramipexole in solubilized system. Mater. Sci. Eng. B 2014, 185, 53–59. [Google Scholar] [CrossRef]
  31. Ghanbari, K.; Babaei, Z. Fabrication and characterization of non-enzymatic glucose sensor based on ternary NiO/CuO/polyaniline nanocomposite. Anal. Biochem. 2016, 498, 37–46. [Google Scholar] [CrossRef] [PubMed]
  32. Su, P.-G.; Peng, Y.-T. Fabrication of a room-temperature H2S gas sensor based on PPy/WO3 nanocomposite films by in-situ photopolymerization. Sens. Actuators B Chem. 2014, 193, 637–643. [Google Scholar] [CrossRef]
  33. Ngaboyamahina, E.; Cachet, H.; Pailleret, A.; Sutter, E. Photo-assisted electrodeposition of an electrochemically active polypyrrole layer on anatase type titanium dioxide nanotube arrays. Electrochim. Acta 2014, 129, 211–221. [Google Scholar] [CrossRef] [Green Version]
  34. Vicentini, F.C.; Raymundo-Pereira, P.A.; Janegitz, B.C.; Machado, S.A.; Fatibello-Filho, O. Nanostructured carbon black for simultaneous sensing in biological fluids. Sens. Actuators B Chem. 2016, 227, 610–618. [Google Scholar] [CrossRef]
  35. Thenmozhi, B.; Suryakiran, S.; Sudha, R.; Revath, B. Green synthesis and comparative study of silver and iron nanoparticle from leaf extract. Int. J. Inst. Pharm. Life Sci. 2014, 4, 5–12. [Google Scholar]
  36. Chen, W.; Yi, P.; Zhang, Y.; Zhang, L.; Deng, Z.; Zhang, Z. Composites of aminodextran-coated Fe3O4 nanoparticles and graphene oxide for cellular magnetic resonance imaging. ACS Appl. Mater. Interfaces 2011, 3, 4085–4091. [Google Scholar] [CrossRef] [PubMed]
  37. Izadiyan, Z.; Shameli, K.; Miyake, M.; Hara, H.; Mohamad, S.E.B.; Kalantari, K.; Taib, S.H.M.; Rasouli, E. Cytotoxicity assay of plant-mediated synthesized iron oxide nanoparticles using Juglans regia green husk extract. Arab. J. Chem. 2020, 13, 2011–2023. [Google Scholar] [CrossRef]
  38. Qin, H.; Wang, C.; Dong, Q.; Zhang, L.; Zhang, X.; Ma, Z.; Han, Q. Preparation and characterization of magnetic Fe3O4–chitosan nanoparticles loaded with isoniazid. J. Magn. Magn. Mater. 2015, 381, 120–126. [Google Scholar] [CrossRef]
  39. Cai, Y.; Shen, Y.; Xie, A.; Li, S.; Wang, X. Green synthesis of soya bean sprouts-mediated superparamagnetic Fe3O4 nanoparticles. J. Magn. Magn. Mater. 2010, 322, 2938–2943. [Google Scholar] [CrossRef]
  40. Quadri, T.W.; Olasunkanmi, L.O.; Fayemi, O.E.; Solomon, M.M.; Ebenso, E.E. Zinc oxide nanocomposites of selected polymers: Synthesis, characterization, and corrosion inhibition studies on mild steel in HCL solution. ACS Omega 2017, 2, 8421–8437. [Google Scholar] [CrossRef] [Green Version]
  41. Kim, D.-S.; Kang, E.-S.; Baek, S.; Choo, S.-S.; Chu, S.S.; Lee, D.; Min, J.; Kim, T.-H. Electrochemical detection of dopamine using periodic cylindrical gold nanoelectrode arrays. Sci. Rep. 2018, 8, 14049. [Google Scholar] [CrossRef] [Green Version]
  42. Pallela, P.N.V.K.; Ummey, S.; Ruddaraju, L.K.; Gadi, S.; Cherukuri, C.S.; Barla, S.; Pammi, S. Antibacterial efficacy of green synthesized α-Fe2O3 nanoparticles using Sida cordifolia plant extract. Heliyon 2019, 5, e02765. [Google Scholar] [CrossRef]
  43. Kim, D.K.; Mikhaylova, M.; Zhang, Y.; Muhammed, M. Protective coating of superparamagnetic iron oxide nanoparticles. Chem. Mater. 2003, 15, 1617–1627. [Google Scholar] [CrossRef]
  44. Hou, S.; Kasner, M.L.; Su, S.; Patel, K.; Cuellari, R. Highly sensitive and selective dopamine biosensor fabricated with silanized graphene. J. Phys. Chem. C 2010, 114, 14915–14921. [Google Scholar] [CrossRef]
  45. Abdel-Hamid, R.; Rabia, M.K.; Newair, E. Electrochemical behaviour of antioxidants: Part 2. Electrochemical oxidation mechanism of quercetin at glassy carbon electrode modified with multi-wall carbon nanotubes. Arab. J. Chem. 2016, 9, 350–356. [Google Scholar] [CrossRef] [Green Version]
  46. Lian, P.; Zhu, X.; Xiang, H.; Li, Z.; Yang, W.; Wang, H. Enhanced cycling performance of Fe3O4–graphene nanocomposite as an anode material for lithium-ion batteries. Electrochim. Acta 2010, 56, 834–840. [Google Scholar] [CrossRef]
  47. Raoof, J.B.; Ojani, R.; Rashid-Nadimi, S. Voltammetric determination of ascorbic acid and dopamine in the same sample at the surface of a carbon paste electrode modified with polypyrrole/ferrocyanide films. Electrochim. Acta 2005, 50, 4694–4698. [Google Scholar] [CrossRef]
  48. Feng, X.; Huang, H.; Ye, Q.; Zhu, A.J.-J.; Hou, W. Ag/Polypyrrole core−shell nanostructures: Interface polymerization, characterization, and modification by gold nanoparticles. J. Phys. Chem. C 2007, 111, 8463–8468. [Google Scholar] [CrossRef]
  49. Doyle, R.; Breslin, C.B.; Rooney, A.D. A simple but highly selective electrochemical sensor for dopamine. Chem. Biochem. Eng. Q. 2009, 23, 93–98. [Google Scholar]
  50. Liu, X.; Zhu, H.; Yang, X. An electrochemical sensor for dopamine based on poly(o-phenylenediamine) functionalized with electrochemically reduced graphene oxide. RSC Adv. 2014, 4, 3743–3749. [Google Scholar] [CrossRef]
  51. Yew, Y.P.; Shameli, K.; Miyake, M.; Kuwano, N.; Khairudin, N.B.B.A.; Mohamad, S.E.B.; Lee, K.X. Green synthesis of magnetite (Fe3O4) nanoparticles using seaweed (Kappaphycus alvarezii) extract. Nanoscale Res. Lett. 2016, 11, 276. [Google Scholar] [CrossRef] [PubMed] [Green Version]
  52. Mirza, A.U.; Kareem, A.; Nami, S.; Khan, M.S.; Rehman, S.; Bhat, S.A.; Mohammad, A.; Nishat, N. Biogenic synthesis of iron oxide nanoparticles using Agrewia optiva and Prunus persica phyto species: Characterization, antibacterial and antioxidant activity. J. Photochem. Photobiol. B Biol. 2018, 185, 262–274. [Google Scholar] [CrossRef] [PubMed]
  53. Muthukumar, H.; Matheswaran, M. Amaranthus spinosus leaf extract mediated FeO nanoparticles: Physicochemical traits, photocatalytic and antioxidant activity. ACS Sustain. Chem. Eng. 2015, 3, 3149–3156. [Google Scholar] [CrossRef]
  54. Ramaganthan, B.; Sivakumar, P.M.; Dharmalingam, S. Synthesis, characterization of novel silicotungstic acid incorporated SPEEK/PVA-co-ethylene-based composite membranes for fuel cell. J. Mater. Sci. 2011, 46, 1741–1748. [Google Scholar] [CrossRef]
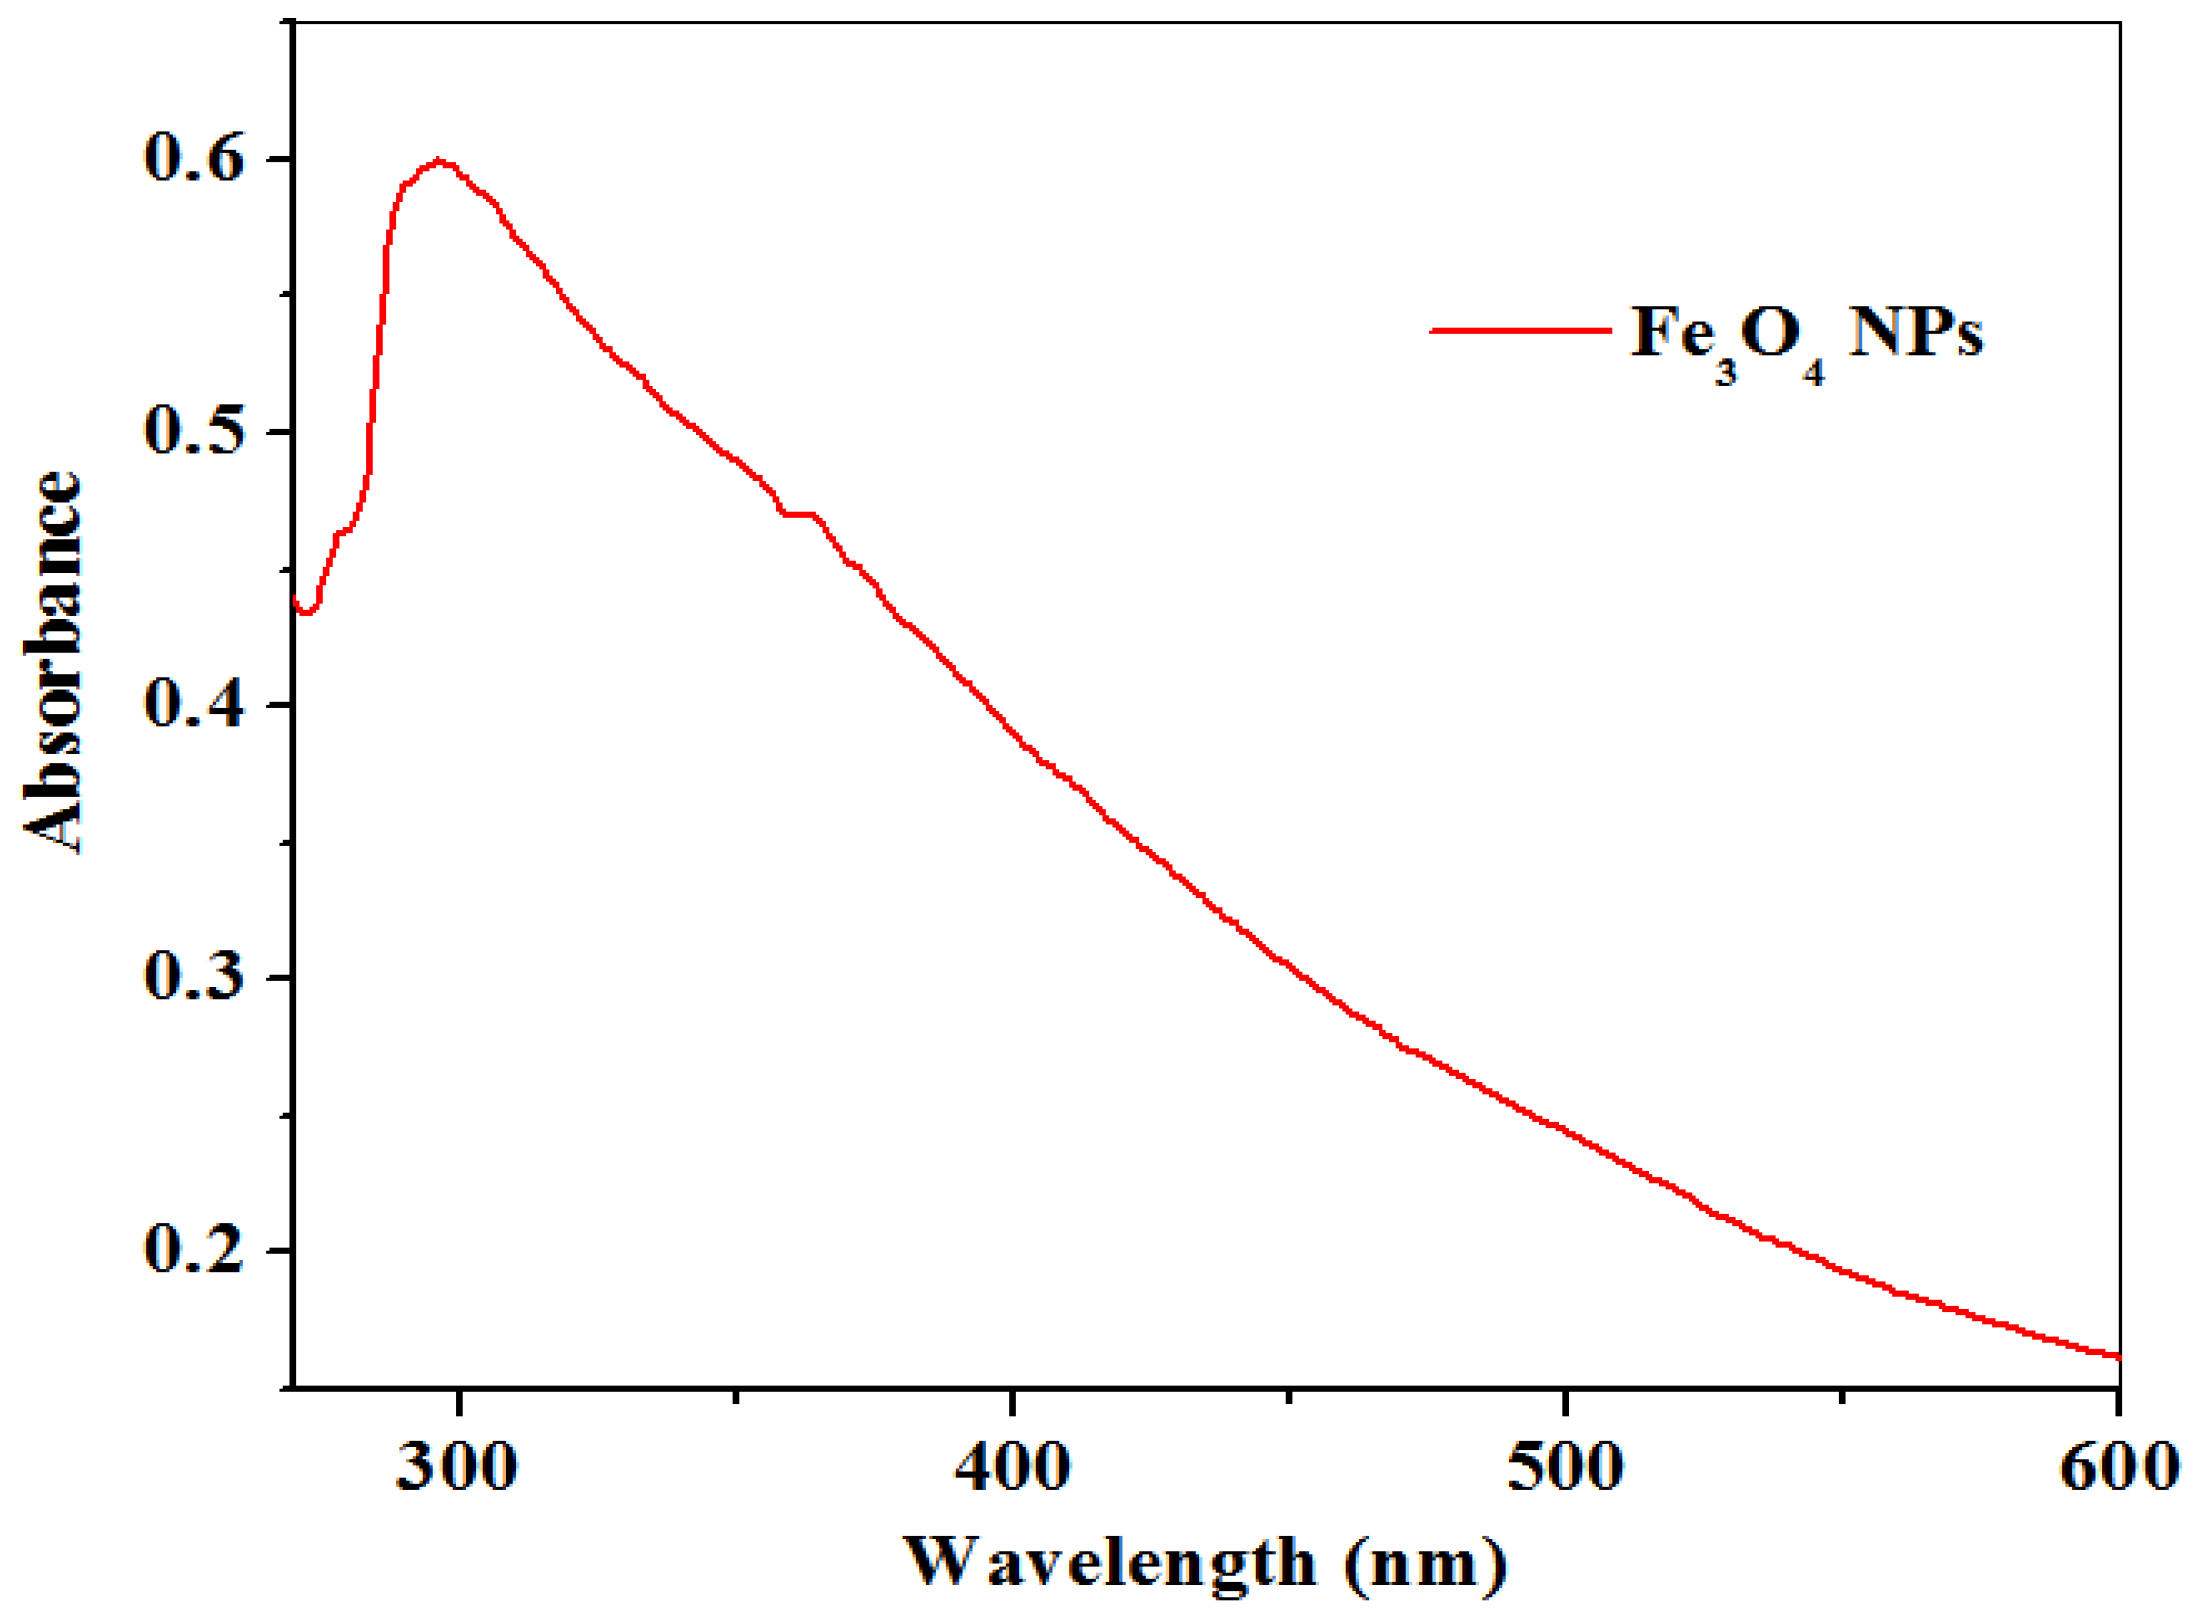
Figure 1. UV–Vis spectra of Fe3O4NPs using L. serica leaf extract.
Molecules 26 05357 g001
Figure 2. FTIR spectra showing mediated Fe3O4NPs, polymer SPEEK and Fe3O4/SPEEK nanocomposites respectively.
Molecules 26 05357 g002
Figure 3. XRD pattern of mediated Fe3O4NPs using L. serica plant species leaf extract.
Molecules 26 05357 g003
Figure 4. SEM micrographs of (a) Fe3O4NPs and (b) nanocomposite (Fe3O4/SPEEK).
Molecules 26 05357 g004
Figure 5. Cyclic voltammogram of the bare and modified electrodes in 5 mM K3[Fe(CN)6] prepared in 0.1 M PBS, pH 7.4.
Molecules 26 05357 g005
Figure 6. (a) Scan rate cyclic voltammograms of SPCE-Fe3O4/SPEEK. (b) Regression plot of peak currents versus square of scan rate in 5 mM K3[Fe(CN)6] prepared in 0.1 M PBS (pH 7.4).
Molecules 26 05357 g006
Figure 7. Linear plot of peak potentials (Epa/Epc) vs. log of scan rate (v/decade) in 0.1 M PBS pH 7.4 containing 5 mM K3[Fe(CN)6].
Molecules 26 05357 g007
Figure 8. Schematic diagram of electrode modification procedure and the electrochemical response of dopamine at the electrode.
Molecules 26 05357 g008
Figure 9. Comparative cyclic voltammogram of bare SPCE and modified electrodes in 0.1 M PBS (pH 7.4) containing 0.1 mM DA.
Molecules 26 05357 g009
Figure 10. Scan rate cyclic voltammograms at SPCE-Fe3O4/SPEEK for (a) DA and (b) linear plots of peak currents (μA) versus square of scan rate in 0.1 M PBS (pH 7.4) containing 0.1 mM DA.
Molecules 26 05357 g010
Figure 11. Linear plots of peak potential vs. logarithm of scan rate at SPCE-Fe3O4/SPEEK for DA prepared in 0.1 M PBS (pH 7.4).
Molecules 26 05357 g011
Figure 12. (a) Square wave voltammograms recorded at SPCE-Fe3O4/SPEEK electrode over dopamine concentrations range from 5 to 50 μM; (b) linear graph of reduction peak currents versus DA concentrations prepared in 0.1 M of PBS (pH 7.4).
Molecules 26 05357 g012
Figure 13. The SWV voltammogram for (a) 0.1 mM DA, (b) 0.1mM, and (c) mixture of DA and UA detected simultaneously at fixed concentration (0.1 mM).
Molecules 26 05357 g013
Figure 14. 10 repetitive CV scans in 0.1 mM DA at 25 mVs−1 scan rate.
Molecules 26 05357 g014
Table 1. Summary of cyclic voltammetric data recorded at different unmodified and modified electrodes in K3[Fe(CN)6] solution.
Electrode Ipa (μA)Ipc (μA)Ipa/IpcEpa (V)Epc (V)E1/2 (V)ΔEp (V)
Bare-SPCE16.40−16.97−0.260.36−0.160.100.52
SPCE-Fe3O4NPs7.99−40.56−0.110.42−0.140.140.56
SPCE-SPEEK54.48−32.69−1.670.310.220.260.09
SPCE-Fe3O4/SPEEK17.93−15.18−1.180.290.180.220.11
Where Ipa = Anodic peak current, Ipc = Cathodic peak current, Epa = Anodic peak potential, Epc = Cathodic peak potential, E 1 / 2 = E pa + E pc 2 ,   and   ∆Ep = Peak potential separation.
Table 2. Summary of parameters obtained using cyclic voltammetry on bare and modified electrodes in 0.1 mM DA.
DopamineIpa (μA)Ipc (μA)Ipa/IpcEpa (V)Epc (V)E1/2 (V)ΔEp (V)
Bare-SPCE19.78−1.12−17.660.190.020.110.17
SPCE-Fe3O4NPs12.560.5124.630.660.090.370.57
SPCE-SPEEK42.00−25.33−1.660.48−0.040.220.52
SPCE-Fe3O4/SPEEK20.94−14.13−1.480.340.060.200.28
Table 3. Comparison of the designed sensor with previously studied sensors for DA determination.
Modified ElectrodeMethodsLinear Range (μM)AnalyteLoD (μM)R2Ref.
Ppy/Ferro-cyanide/carbon paste electrodeLSV100–1200DA38.60.9984[47]
DPV200–950DA150.9998
Au/Ppy/Ag/GCEAmperometry100–5000DA50 [48]
p-Sulphonatocalix [6]arene/polypyrrole 75–1000DA20 [49]
PoPD/E-RGO/GCE 10–400DA7.5 [50]
SPCE-Fe3O4/SPEEKSWV5–50DA7.10.9831This work
Abbreviations: Ppy = Polypyrrole; Au = Gold; Ag = Silver; E-RGO = Electrochemically-reduced graphene oxide; GCE = Glass carbon electrode, PoPD = poly(o-phenylenediamine).
Table 4. Results of the recovery tests obtained from the DA determination using dopamine HCl-Fresenius 200 mg/5 mL injection.
SampleAdded (μM)Detected
(μM)
Recovery
(%)
RSD
Dopamine HCl-Fresenius 200 mg/5 mL injection4039.9799.93.90
8080.011000.05
120119.499.90.12
Publisher’s Note: MDPI stays neutral with regard to jurisdictional claims in published maps and institutional affiliations.