
ESI-MS/MS Analysis of Phenolic Compounds from Aeonium arboreum Leaf Extracts and Evaluation of their Antioxidant and Antimicrobial Activities


 ,
, 
 and
and
Abstract
:1. Introduction
2. Results and Discussion
2.1. Total Phenolics, Flavonoids, and Condensed Tannins Contents of Various Extracts from A. arboreum Leaves
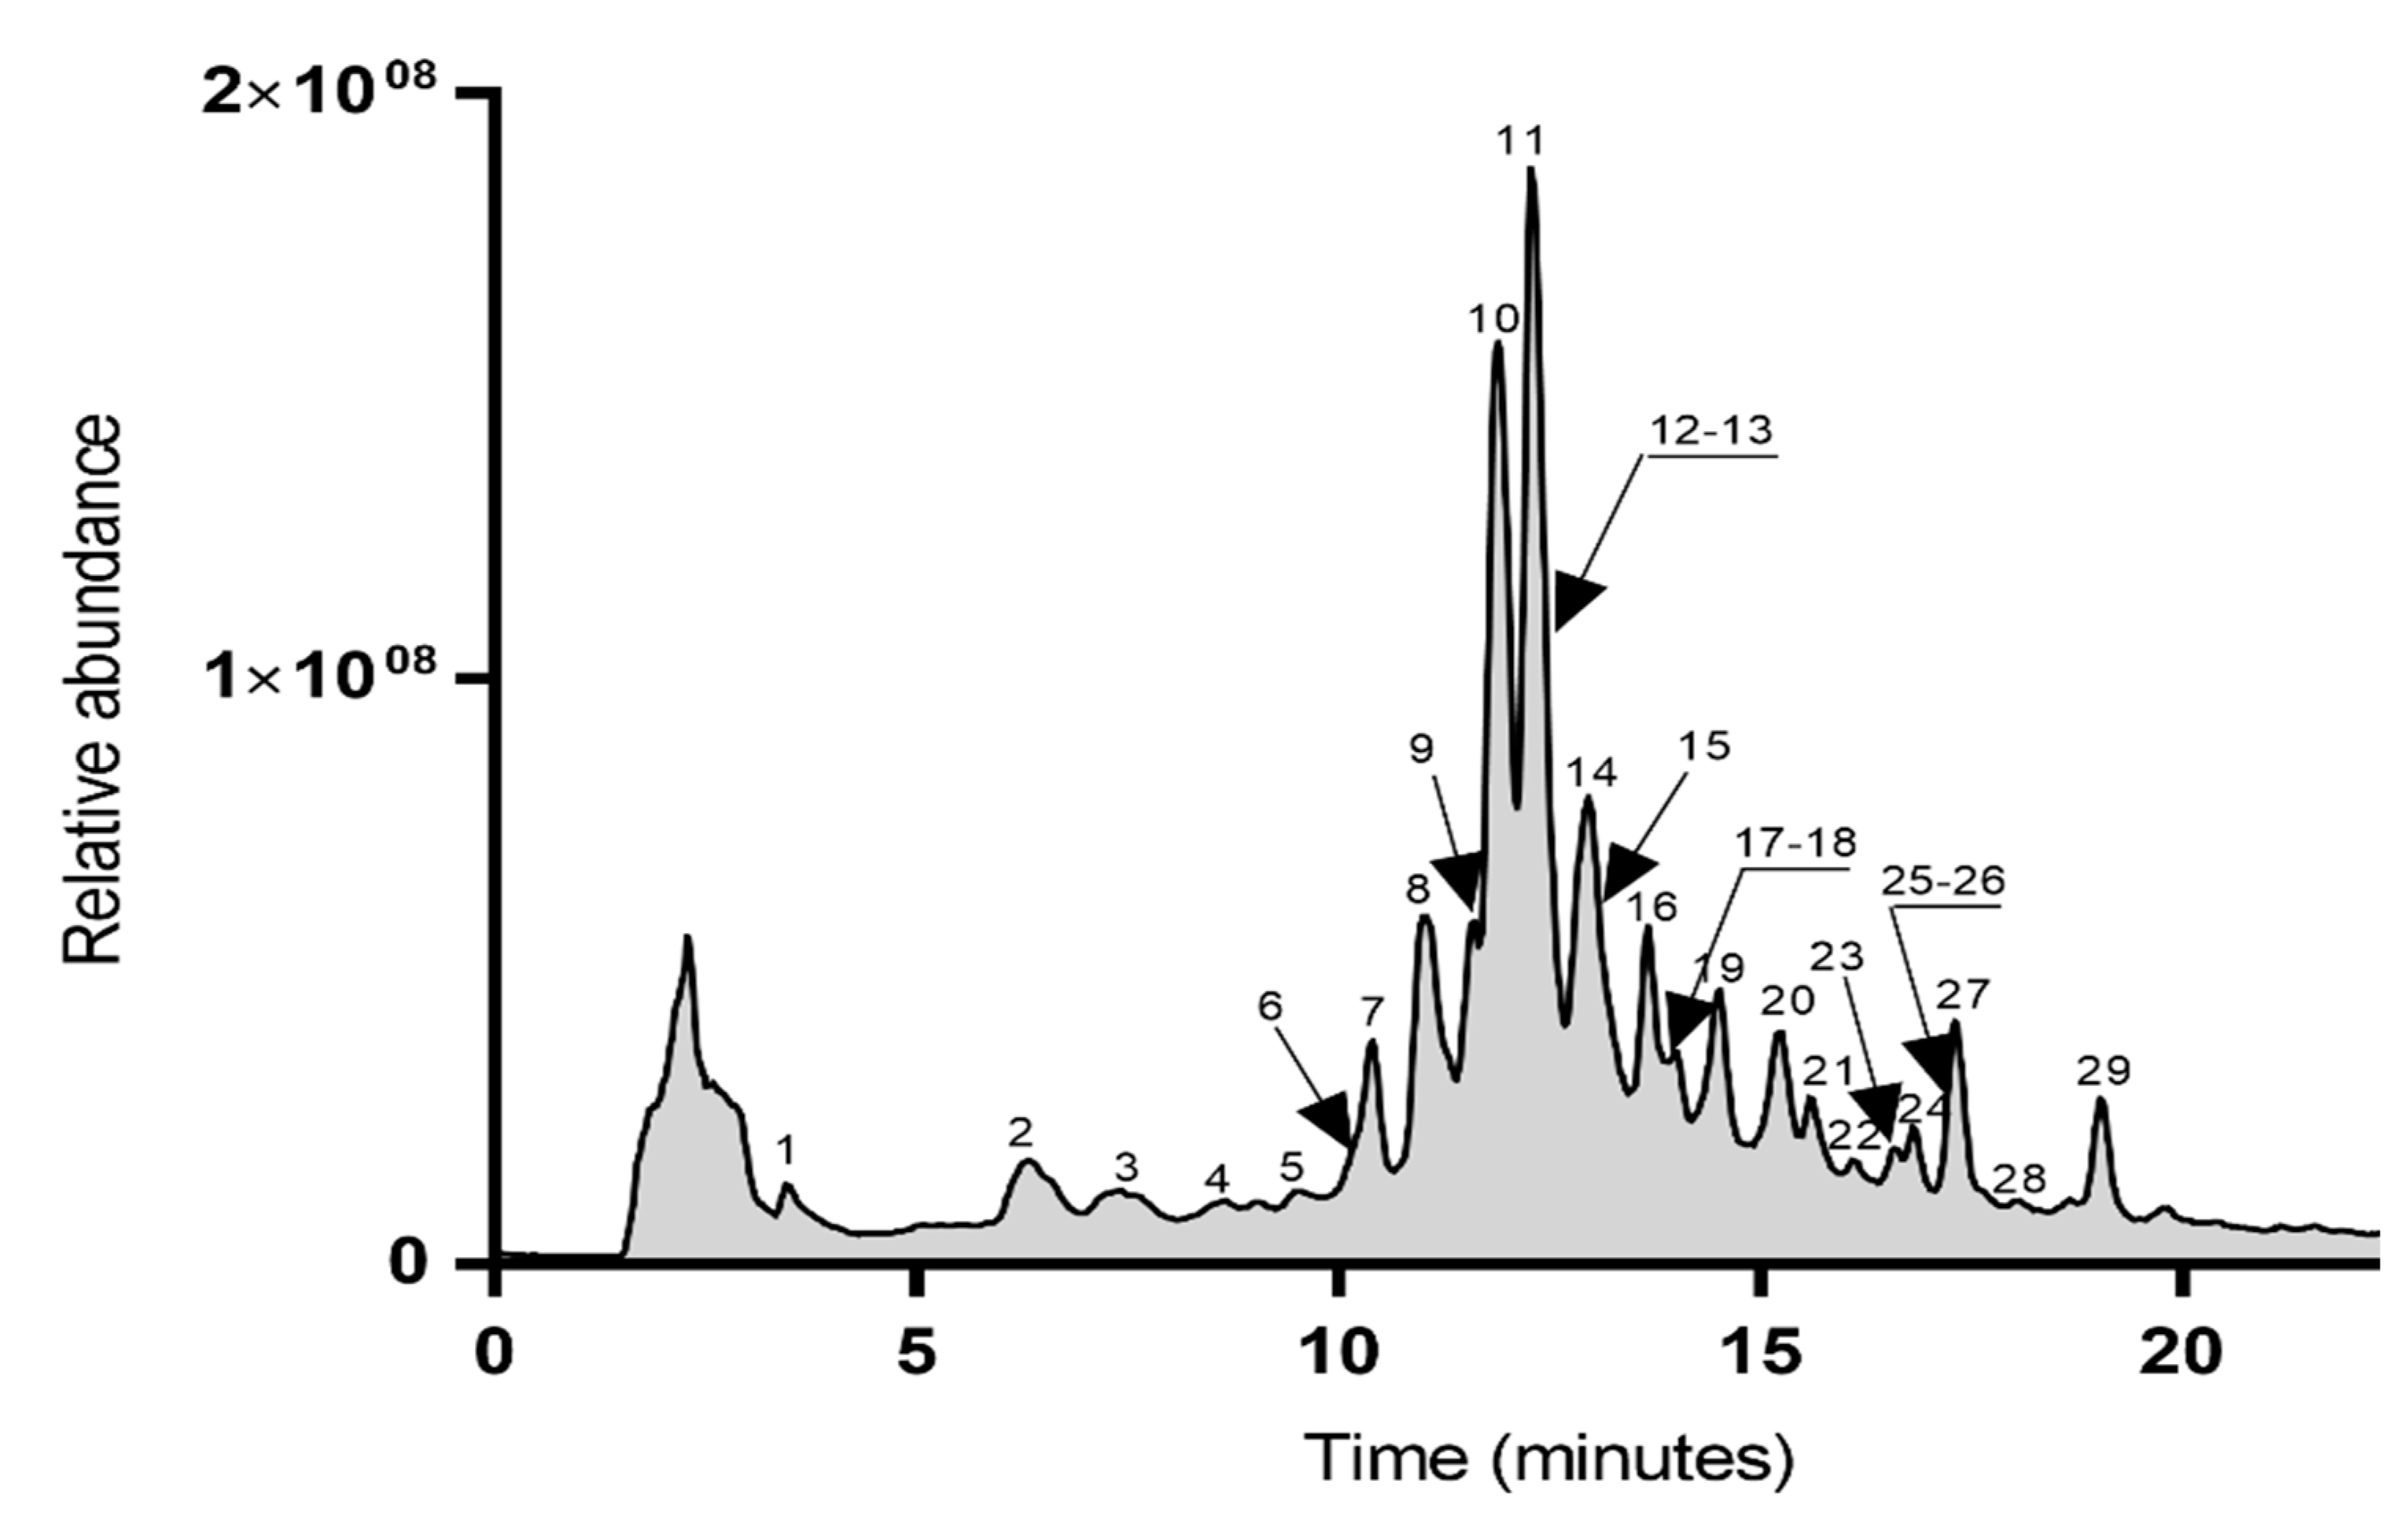
2.2. Phytochemical Constituents
- Peak 1 (TR = 3.44 min) was identified as a mixture of isocitric acid (IA), m/z 191, and malic acid (MA) m/z 133. Mass spectrum of IA showed an ion at m/z 191 [IA-H]− and a fragment at m/z 155, which was the result of an additional structural rearrangement from a two dehydration, which was then decarboxylated (−44 Da) in an ultimate ion at m/z 111 [IA-H-2H2O-CO2]−. Therefore, ions at m/z 155 and 111 were characteristic of IA conjugates [15]. Similarly, for MA, the molecular ion at m/z 133 was dehydrated (−18 Da) to give a single and characteristic ion at m/z 115 [MA-H-H2O]−.
- Peak 2 (TR = 6.32 min) was identified as 1,1,2-ethanetricarboxylic acid (ETA), giving a molecular ion [M-H]− at m/z 161 and two fragment ions at m/z 143 and m/z 115 [15]. Dehydration and cyclization of this parent ion resulted in a characteristic ion at m/z 143 [ETA-H-H2O]−, which then underwent the loss of CO (−28 Da) to form another single product ion at m/z 115 [ETA-H-H2O-CO]−.
- Peak 3 was identified as propane-1,1,2,3-tetracarboxylic acid, giving a molecular ion at m/z 219, undergoing the loss of HCOOH to give an ion at m/z 173. This product ion was then dehydrated (−18 Da) to produce an ion at m/z 155, which underwent decarboxylation (−44 Da) to produce an ion at m/z 111.
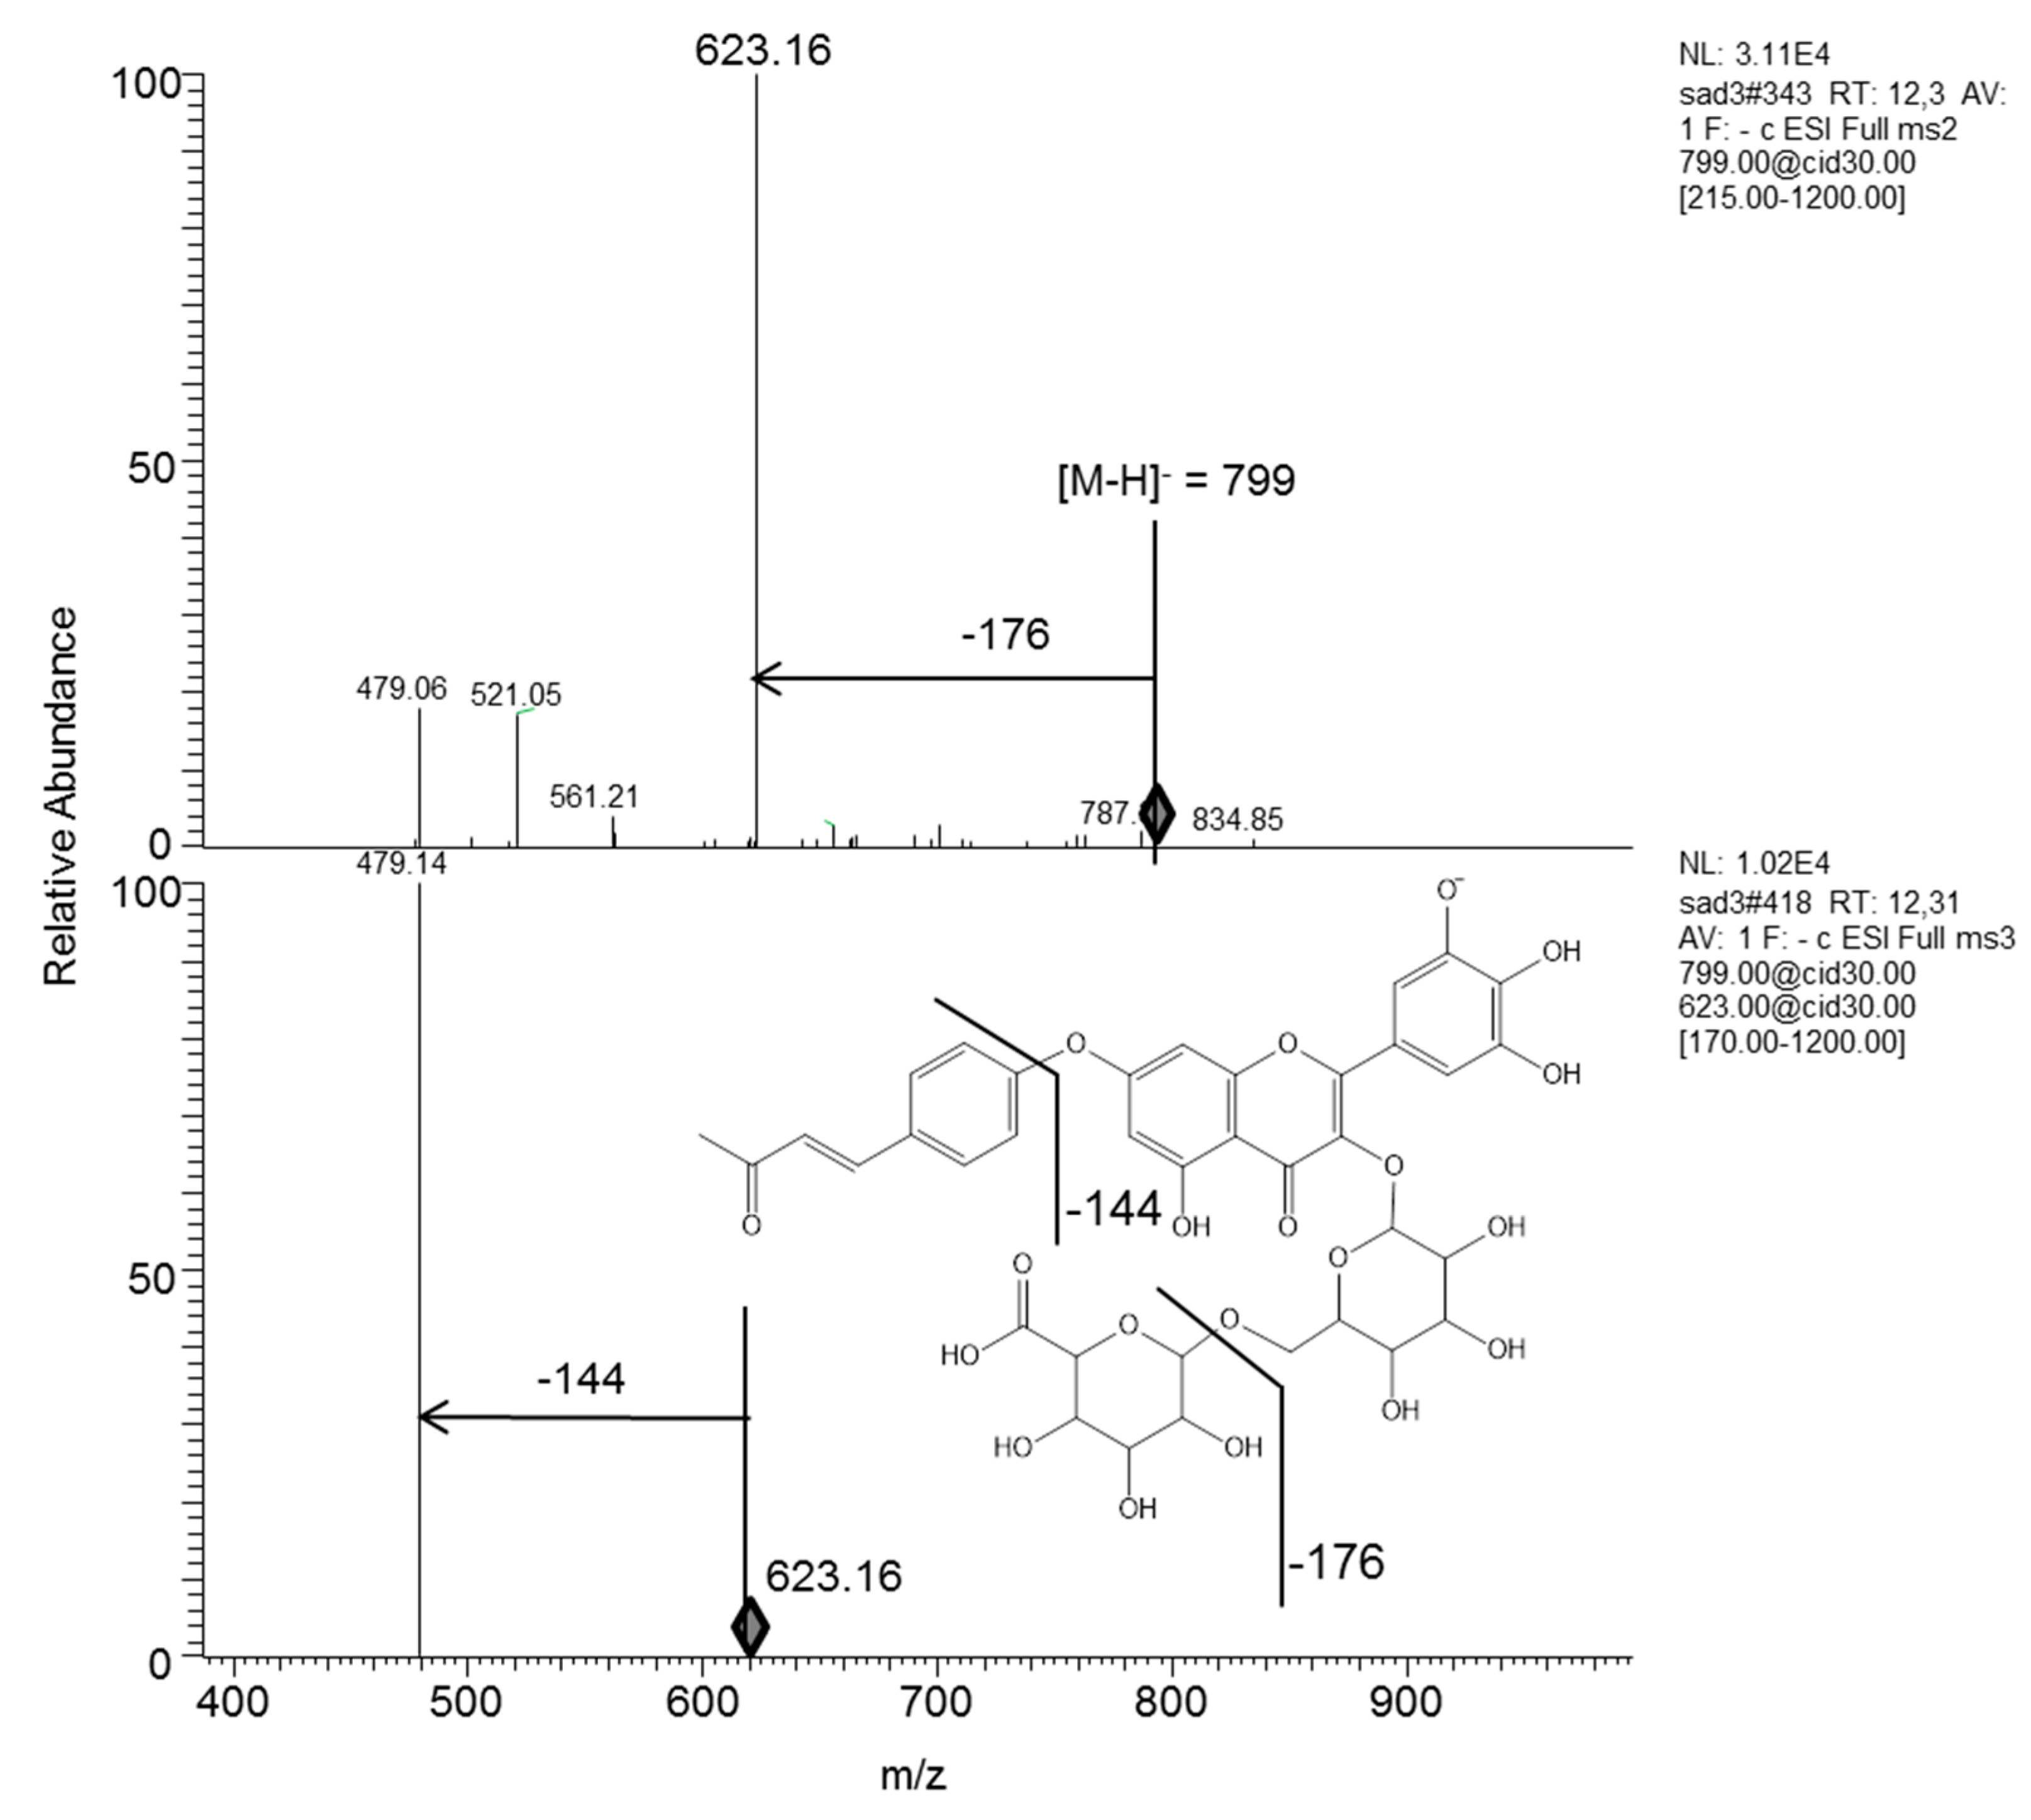
- Peaks 4, 9, 11, 13, 15, 16, 20a, 22, 25, 27, 28, and 29 showed myricetin 3-O-glucoside as aglycone monosaccharide for these ionic products. For example, the peak 4 at TR = 8.72 min corresponds to a molecular ion at m/z 479 [M-H]− with a fragment at m/z 317 resulting from the loss of a glucose group (162) indicates myricetin-3-O-glucoside. The peak 9 at TR = 11.6 min corresponding to a molecular ion at m/z 655 was assumed to be myricetin-3-O-glucoside-5-O-glucuronic acid by its MS2 fragment ion at m/z 479, corresponding to the loss of glucuronic acid. The major peak 11 at TR = 12.29 min indicates a parent ion [M-H]− at m/z 799 with fragments at m/z 623, 479, and 317 (Figure 2). The pseudo molecular ion [M-H-glucuronic acid]− at m/z 623 was identified as myricetin-3-O-glucoside-5-O-p-hydroxybenzal-acetone according to the fragmentation scheme proposed by Han et al. [32]. The loss of p-hydroxybenzalacetone gives a daughter ion at m/z 479 identified as myricetin-3-O-glycoside-O-glucuronic acid 5-O-p-hydroxybenzalacetone. The Peak 13 at TR = 12.98 min showed a molecular ion at m/z 479 and MS2 ion at m/z 316, indicating myricetin-hexoside. Peak 15 at 13.25 min was also assigned to myricetin. The ion at m/z 915 [M-H]− and a fragment ion of 739 validated the loss of glucuronic acid. The peak 20a at TR = 15.22 min presented [M-H]− at 801 with its fragments m/z 625 and 479, which indicates the presence of myricetin-3-O-glucoside. Moreover, the MS2 daughter ion at m/z 625 indicates glucuronic acid (−176 Da). The difference between these two ions (m/z 625 and m/z 479) gives m/z 146, revealing the rhamnose group. Therefore, the m/z 801 compound was identified as myricetin-3-O-glucoside-7-O-rhamnopyranoside-O-glucuronic acid.
- Peaks 7, 8, 14, and 20b at TR = 10.38, 11, 13, and 15.22 min respectively lead to observation of a common ion at m/z 495, which could be attributed to 3,3′,4′,5,7-pentahydroxy-6-methoxyflavanonol-3-O-glucoside. Analysis of the MS2 spectra of peak 7 showed intense ion m/z at 332, corresponding to the loss of glucoside. In contrast, peak 8 consisted of two compounds, which could be characterized with two different mass spectra: Firstly, peak 8a matched with a molecular ion at m/z 787 [M-H]− with MS2 fragment ions at m/z, 611 and 495, arising from the loss of glucuronic acid (m/z 176) and the loss of a dirhamnoside (m/z 292) respectively. Then, we observed in peak 8b, the m/z 671 with a MS2 fragment at m/z 495 following the loss of a glucuronic acid.
- Peak 12 at TR = 12.89 min, with a molecular ion at m/z 783 and its MS2 spectrum, indicates the eupafolin-3,7-di-O-rhamnoside 4′-O-glucuronic acid according to the fragmentation scheme proposed by Chiung-Sheue Liu et al. [23]. Peaks 17 and at TR = 14.01 and 14.3 min respectively were attributed to three quercetin glucosides with different positions of glucoside. In fact, they revealed the same MS3 ion at m/z 301 corresponding to quercetin aglycone arising from the loss of glucoside. Analysis of peak 21 at TR = 15.61 min showed characteristic ions at m/z 447, attributed to quercetin-7-O-rhamnoside. MS2 fragment at m/z 301 indicates the loss of a rhamnoside unit.
- Peaks 19a and 23 at TR = 14.47 and 16.59 min respectively could be attributed to patuletin 3-O-rhamnopyranosyl-7-O-rhamnopyranoside-4′-O-glucuronic acid and patuletin-7-O-glucoside due to the molecular ions (m/z 827 and m/z 493 respectively) and their MS2 and MS3 spectra.
- Peak 20b at TR = 15.22 min, leads to the observation of a molecular ion at m/z 817 [M-H]− with fragment ions at m/z 641 and 495 indicating the successive losses of glucuronic acid and rhamnose. Therefore, this compound was identified as 3, 3′,4′,5, 7-pentahydroxy-6-methoxyflavonol-3-O-glucoside-5-O-rhamnopyranoside-O-glucuronic acid.
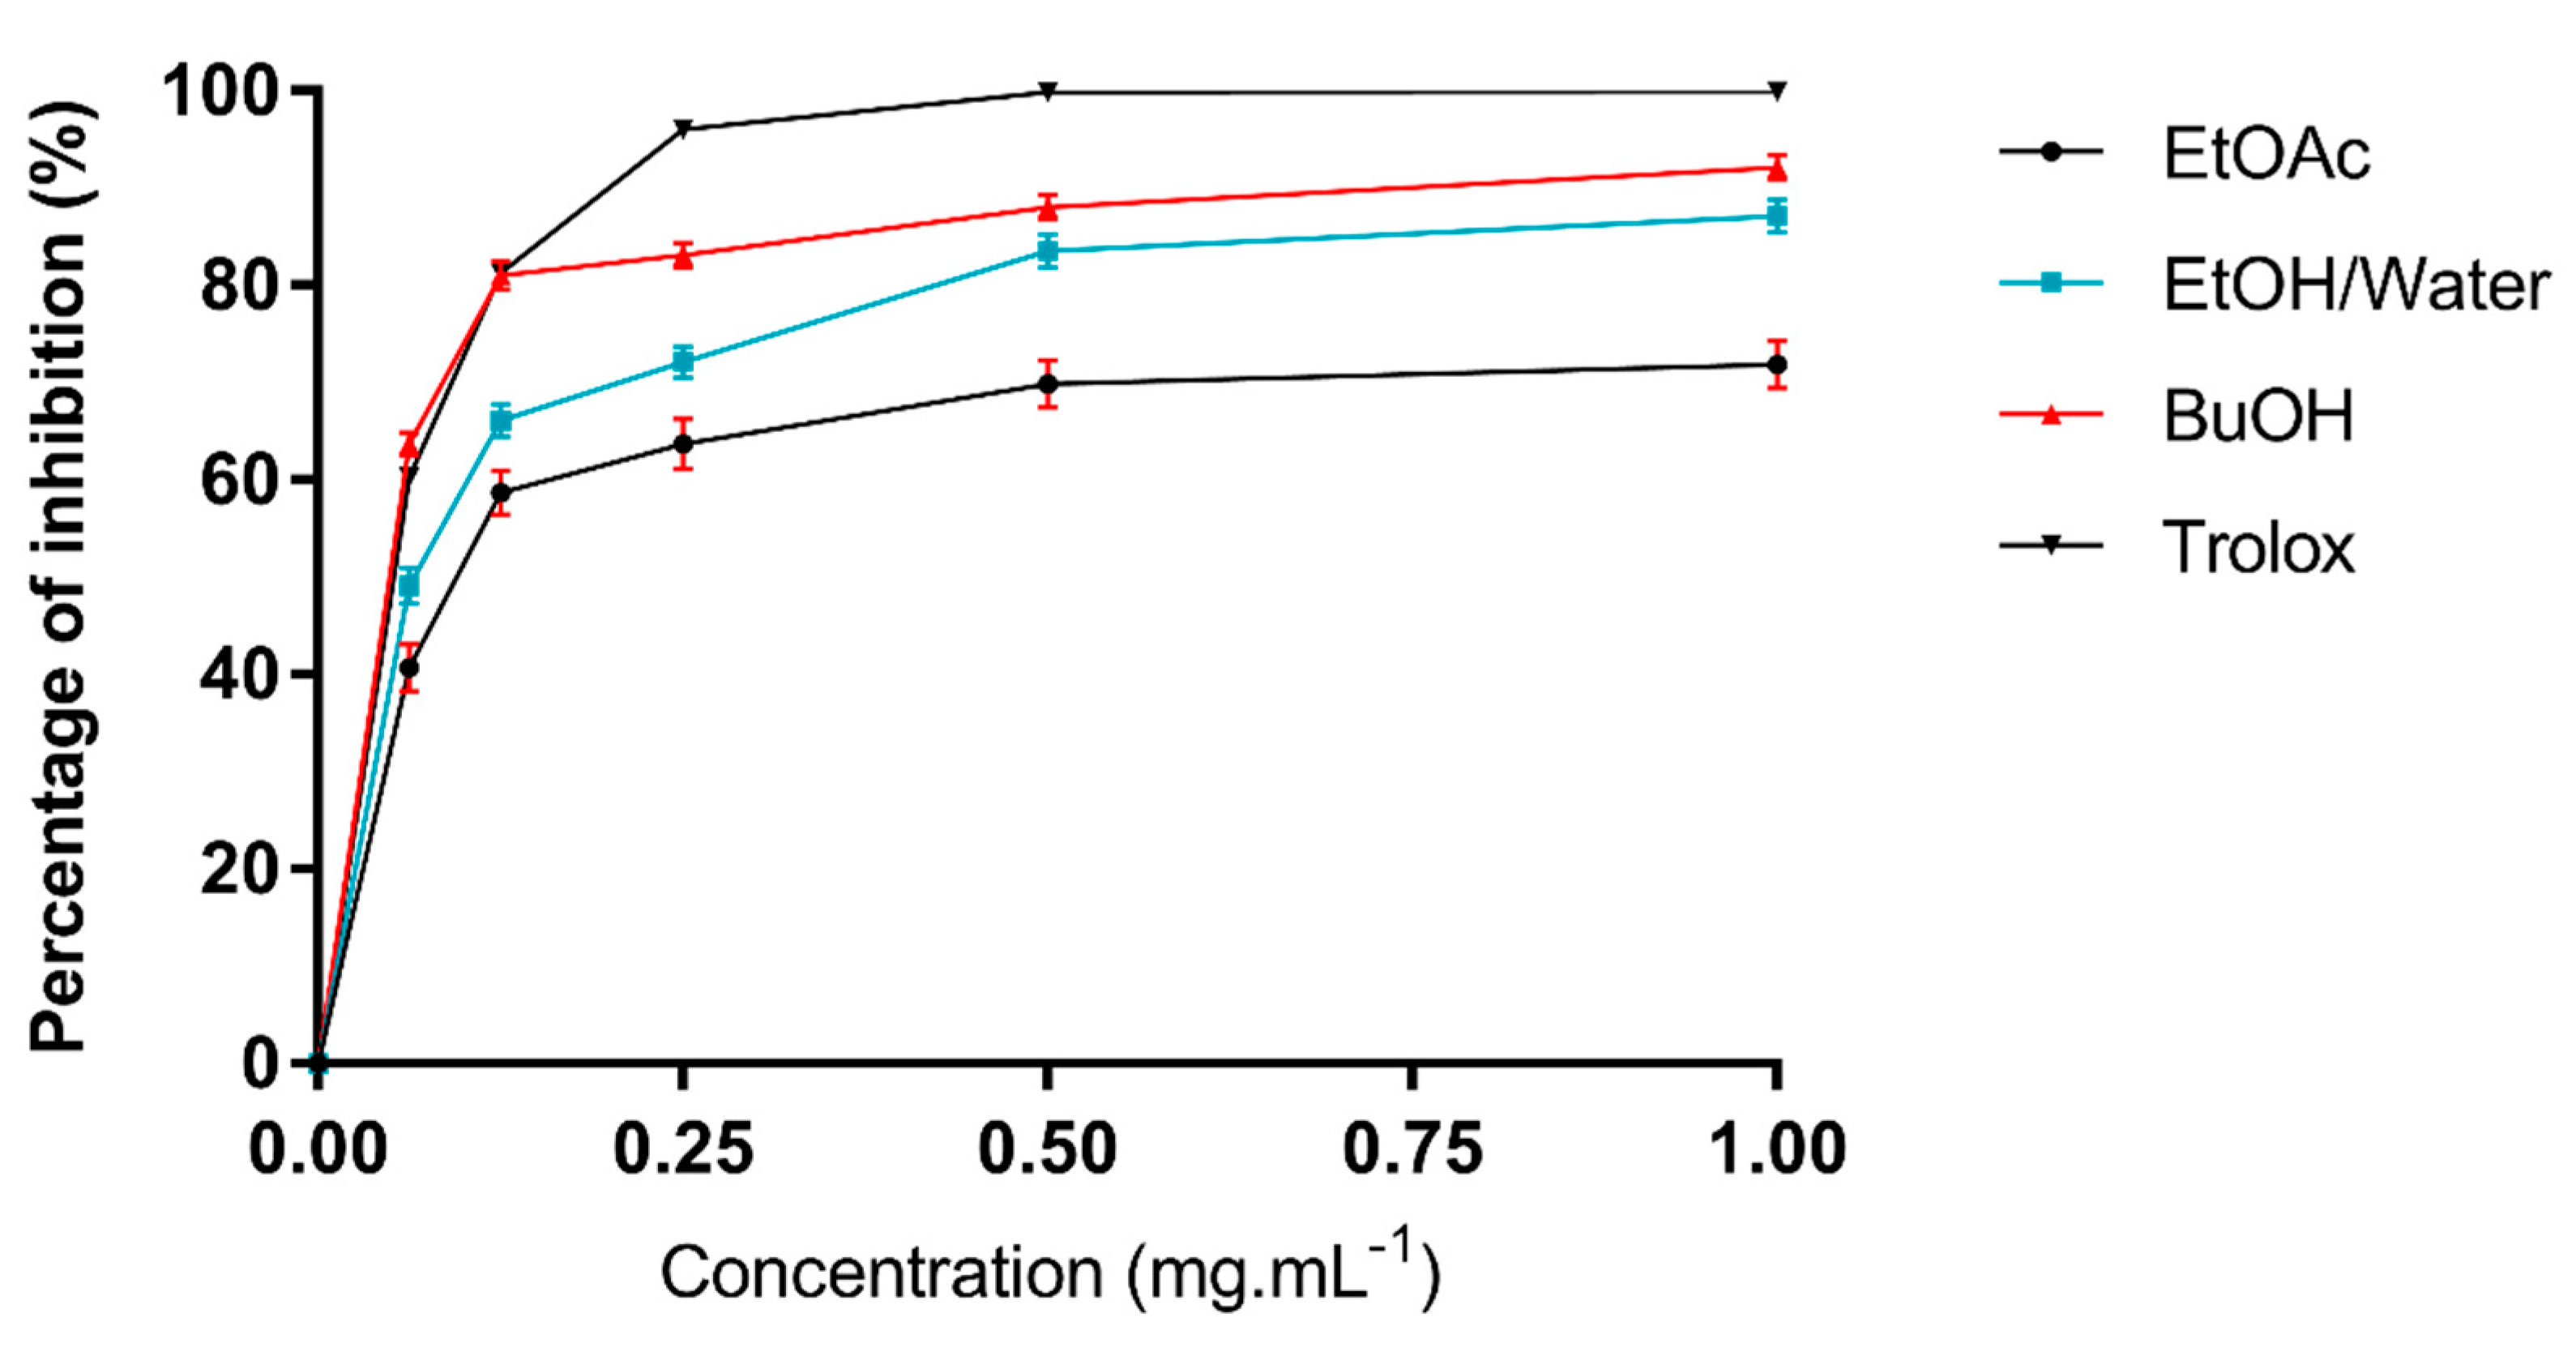
2.3. Antioxidant Activity of Leaf Extracts In Vitro
2.4. Correlations
2.5. Antimicrobial Activity of A. arboreum
3. Materials and Methods
3.1. Extraction
3.2. Determination of Phenolic, Flavonoid, and Condensed Tannins Contents
- Total phenol content (TPC) was determined using the spectrophotometric/colorimetric method described by Mhalla et al. (2017) [34]. This assay quantifies the total hydroxyl groups in the three extracts. A total of 0.5 mL of the Folin–Ciocalteu reagent [36] was added to a solution containing 1 mL of the extract (EtOAc, hydroethanolic, or n-BuOH) with a known concentration (1 mg·mL−1) and 3 mL of distilled water. A total of 0.5 mL of 2% aqueous sodium carbonate (Na2CO3) was added after 5 min. The mixture was then incubated at 25 °C for 90 min and absorbance measured at 760 nm. The assay was performed in triplicate for each extract. The TPC was calculated by a standard gallic acid graph, with TPC expressed in milligrams of gallic acid equivalent per gram of dry weight of extract.
- Total flavonoid content (TFC) was determined using the method described by Akrout et al. [37] and Mhalla et al. [34]. The method is based on the formation of a very stable complex, between aluminum chloride and the oxygen atoms present on carbons 4 and 5 of the flavonoids, which has maximum absorbance at 430 nm. Quercetin was used to make the calibration curve. One milliliter of sample (1 mg·mL−1) was mixed with 1 mL of 2% aluminum trichloride (AlCl3) MeOH solution. After incubation at room temperature for 15 min, the absorbance of the mixture was measured at 430 nm with a Shimadzu UV-mini 1240 UV/VIS spectrophotometer with TFC expressed in milligrams of quercetin equivalent (QE) per gram of extract.
- Condensed tannins (CTs) content was determined using the method described by Mhalla et al. [34]. In this method vanillin and HCl react with the flavonoid group and form red complexes [9,36] or anthocyanidols [38,39]. A total of 50 μL of each extract was added to 1500 μL of 4% vanillin/methanol solution and mixed vigorously before 750 μL of concentrated hydrochloric acid were added. The mixture was left to react at ambient temperature for 20 min. Absorbance was measured at 550 nm against a blank. Different concentrations (between 0 and 1000 µg·mL−1) prepared from a stock solution of catechin allowed the calibration curve to be drawn.
3.3. RP-HPLC Fractionation and LC–MS Analysis
3.4. Biochemical Assays
3.5. In Vitro Evaluation of Antimicrobial Activity
- 1 < MBC/MIC < 4: bactericidal action;
- 4 < MBC/MIC < 16: bacteriostatic action;
- 1 < MFC/MIC < 4: fungicidal action;
- 4 < MFC/MIC < 16: fungistatic action.
3.6. Statistical Analysis
4. Conclusions
Supplementary Materials
Author Contributions
Funding
Institutional Review Board Statement
Informed Consent Statement
Acknowledgments
Conflicts of Interest
References
- Hambaba, L.; Boudjellal, K.; Abdeddaim, M.; Aberkane, M.C.; Boudiaf, K. In vitro investigation of antimicrobial and antioxidant activities of Elaeagnus angustifolia L. fruit’s extracts. Phytothérapie 2012, 10, 350–356. [Google Scholar] [CrossRef]
- Takhtajan, A.L. Outline of the classification of flowering plants (Magnoliophyta). Bot. Rev. 1980, 46, 225–359. [Google Scholar] [CrossRef]
- Stevens, J.F.; Hart, H.; Wollenweber, E. The systematic and evolutionary significance of exudate flavonoids in Aeonium. Phytochemistry 1995, 39, 805–813. [Google Scholar] [CrossRef]
- Salman, A.; Muhammad Mohtasheemul, H.; Zafar Alam, M. Antiurolithiatic plants: Multidimensional pharmacology. J. Pharmacogn. Phytochem. 2016, 5, 4–24. [Google Scholar]
- Darias, V.; Bravo, L.; Rabanal, R.; Sanchez Mateo, C.; Gonzalez, L.R.M.; Hernandez Perez, A.M. New Contribution to the ethnopharmacological study of the Canary Islands. J. Ethnopharmacol. 1989, 25, 77–92. [Google Scholar] [CrossRef]
- Darias, V.; Bravo, L.; Barquin, E.; Martin Herrera, D.; Fraile, C. Contribution to the ethnopharmacological study of the Canary Islands. J. Ethnopharmacol. 1986, 15, 169–193. [Google Scholar] [CrossRef]
- Staub, P.O.; Casu, L.; Leonti, M. Back to the roots: A quantitative survey of herbal drugs in Dioscorides’ De Materia Medica (ex Matthioli, 1568). Phytomedicine 2016, 23, 1043–1052. [Google Scholar] [CrossRef]
- Mendoza Soto, R. Efecto Antihipertensivo del Extracto Hidroalcohólico de las Hojas de Aeonium arboreum (L) Webb. & Berth “Rosa Verde” Ayacucho-2015. Thesis (Ayacucho-PERÚ). 2015. Available online: http://repositorio.unsch.edu.pe/handle/UNSCH/2519 (accessed on 8 June 2021).
- Mhalla, D.; Zouari Bouassida, K.; Chawech, R.; Bouaziz, A.; Makni, S.; Jlaiel, L.; Tounsi, S.; Jarraya, R.M.; Trigui, M. Antioxidant, hepatoprotective, and antidepression effects of Rumex tingitanus extracts and identification of a novel bioactive compound. Biomed Res. Int. 2018, 10. [Google Scholar] [CrossRef] [Green Version]
- Mhiri, R.; Koubaa, I.; Chawech, R.; Auberon, F.; Allouche, N.; Michel, T. New Isoflavones with Antioxidant Activity Isolated from Cornulaca monacantha. Chem. Biodivers. 2020, 17. [Google Scholar] [CrossRef]
- Epure, A.; Pârvu, A.E.; Vlase, L.; Benedec, D.; Hanganu, D.; Gheldiu, A.M.; Toma, V.A.; Oniga, I. Phytochemical profile, antioxidant, cardioprotective and nephroprotective activity of Romanian chicory extract. Plants 2021, 10, 64. [Google Scholar] [CrossRef]
- Lopez-Angulo, G.; Montes-Avila, J.; Paz Dıaz-Camacho, S.; Vega-Avina, R.; Ahumada-Santos, P.Y.; Delgado-Vargas, F. Chemical composition and antioxidant, α-glucosidase inhibitory and antibacterial activities of three Echeveria DC. species from Mexico. Arab. J. Chem. 2019, 12, 1964–1973. [Google Scholar] [CrossRef] [Green Version]
- Ablajan, K.; Abliz, Z.; Shang, X.; He, J.; Zhang, R.; Shi, J. Structural characterization of flavonol 3,7-di-O-glycosides and determination of the glycosylation position by using negative ion electrospray ionization tandem mass spectrometry. J. Mass Spectrom. 2006, 41, 352–360. [Google Scholar] [CrossRef]
- Masike, K.; Mhlongo, M.I.; Mudau, M.P.; Nobela, O.; Ncube, E.N.; Tugizimana, F.; George, M.J.; Madala, N.E. Highlighting mass spectrometric fragmentation differences and similarities between hydroxycinnamoyl-quinic acids and hydroxycinnamoyl-isocitric acids. Chem. Cent. J. 2017, 11, 1–7. [Google Scholar] [CrossRef]
- Bylund, D.; Norstrom, S.N.; Essen, S.A.; Lundstrom, U.S. Analysis of low molecular mass organic acids in natural waters by ion exclusion chromatography tandem mass spectrometry. J. Chromatogr. A 2007, 1176, 89–93. [Google Scholar] [CrossRef]
- Milad, R.; El-Ahmady, S.; Nasser Singab, A. Genus Kalanchoe (Crassulaceae): A review of its ethnomedicinal, botanical, chemical and pharmacological properties. European J. Med. Plants 2014, 4, 86–104. [Google Scholar] [CrossRef]
- Bensouici, C.; Kabouche, A.; Karioti, A.; Öztürk, M.; Emin Duru, M.; Bilia, A.R.; Kabouche, Z. Compounds from Sedum caeruleum with antioxidant, anticholinesterase, and antibacterial activities. Pharm. Biol. 2016, 54, 174–179. [Google Scholar] [CrossRef]
- Justesen, U. Collision-induced fragmentation of deprotonated methoxylated flavonoids, obtained by electrospray ionization mass spectrometry. J. Mass Spectrom. 2001, 36, 169–178. [Google Scholar] [CrossRef] [PubMed]
- Fang, Z.; Zhang, M.; Wang, L. HPLC-DAD-ESIMS analysis of phenolic compounds in bayberries (Myrica rubra Sieb. et Zucc.). Food Chem. 2007, 100, 845–852. [Google Scholar] [CrossRef]
- Parejo, I.; Jauregui, O.; Viladomat, F.; Bastida, J.; Codina, C. Characterization of acylated flavonoid-O-glycosides and methoxylated flavonoids from Tagetes maxima by liquid chromatography coupled to electrospray ionization tandem mass spectrometry. Rapid Commun. Mass Spectrom. 2004, 18, 2801–2810. [Google Scholar] [CrossRef] [PubMed]
- Khanam, U.K.S.; Oba, S.; Yanase, E.; Murakami, Y. Phenolic acids, flavonoids and total antioxidant capacity of selected leafy vegetables. J. Funct. Foods 2012, 4, 979–987. [Google Scholar] [CrossRef]
- Nielsen, A.H.; Olsen, C.E.; Lindberg Møller, B. Flavonoids in flowers of 16 Kalanchoë blossfeldiana varieties. Phytochemistry 2005, 66, 2829–2835. [Google Scholar] [CrossRef] [PubMed]
- Chiung-Sheue Liu, K.; Yang, S.; Roberts, M.F.; Phillipson, J.D. Eupafolin rhamnosides from Kalanchoe gracilis. J. Nat. Prod. 1989, 52, 970–974. [Google Scholar] [CrossRef]
- Gaind, K.N.; Singla, A.K.; Wallace, J.W. Flavonoid glycosides of Kalanchoe spathulata. Phytochemistry 1981, 20, 530–531. [Google Scholar] [CrossRef]
- Cheng, R.; Yang, M.; Wu, Z.; Wang, Y.; Zeng, F.; Wu, W.; Guan, S.; Guo, D. Fragmentation pathways of oxygenated tetracyclic triterpenoids and their application in the qualitative analysis of Ganoderma lucidum by multistage tandem mass spectrometry. Rapid Commun. Mass Spectrom. 2011, 25, 1323–1335. [Google Scholar] [CrossRef] [PubMed]
- Costa, S.S.; Jossang, A.; Bodo, B.; Souza, M.L.M.; Moraes, V.L.G. Patuletin acetylrhamnosides from Kalanchoe brasiliensis as inhibitors of human lymphocyte proliferative activity. J. Nat. Prod. 1994, 57, 1503–1510. [Google Scholar] [CrossRef] [PubMed]
- Barbosa da Luz, B.; Flávia de Oliveira, A.; Maria Ferreira, D.; Luiz Dallazen, J.; Ricardo Cipriani, T.; Mera de Souza, L.; Fernanda de Paula, W.M. Chemical composition, antioxidant and gastrointestinal properties of Sedum dendroideum Moc & Sessé ex DC leaves tea infusion. J. Ethnopharmacol. 2019, 231, 141–151. [Google Scholar] [CrossRef]
- Ben Abdallah Kolsi, R.; Ben Salah, H.; Abdelkader Saidi, S.; Allouche, N.; Belghith, R.; Belghith, K. Evaluation of nutritional value, characteristics, functional properties of Cymodocea nodosa and its benefits on health diseases. Lipids Health Dis. 2017, 16, 1–13. [Google Scholar] [CrossRef] [Green Version]
- Ben Salah, H.; Kchaou, M.; Ben Abdallah Kolsi, R.; Abdennabi, R.; Ayedi, M.; Gharsallah, N.; Allouche, N. Chemical composition, characteristics profiles and bioactivities of Tunisian Phalaris canariensis seed: A potential source of ω-6 and ω-9 fatty acids. J. Food Nutr. Res. 2017, 5, 708–716. [Google Scholar] [CrossRef]
- Mavi, A.; Terzi, Z.; Ozgen, U.; Yildirim, A.; Coskun, M. Antioxidant properties of some medicinal plants: Prangos ferulacea (Apiaceae), Sedum sempervivoides (Crassulaceae), Malva neglecta (Malvaceae), Cruciata taurica (Rubiaceae), Rosa pimpinellifolia (Rosaceae), Galium verum subsp. verum (Rubiaceae), Urtica dioica (Urticaceae). Biol. Pharm. Bull. 2004, 27, 702–705. [Google Scholar] [CrossRef] [Green Version]
- Bors, W.; Heller, W.; Michel, C.; Saran, M. Flavonoids as antioxidants: Determination of radical-scavenging efficiencies. Methods Enzymol. 1990, 186, 343–355. [Google Scholar] [CrossRef]
- Han, J.; Ye, M.; Xu, M.; Qiao, X.; Chen, H.; Wang, B.; Zheng, J.; Guo, D. Comparison of phenolic compounds of rhubarbs in the section deserticola with Rheum palmatum by HPLC-DAD-ESI-MSn. Planta Med. 2008, 74, 873–879. [Google Scholar] [CrossRef] [Green Version]
- Grzesik, M.; Naparło, K.; Bartosz, G.; Sadowska-Bartosz, I. Antioxidant properties of catechins: Comparison with other antioxidants. Food Chem. 2018, 241, 480–492. [Google Scholar] [CrossRef]
- Mhalla, D.; Bouaziz, A.; Ennouri, K.; Chawech, R.; Smaoui, S.; Jarraya, R.; Tounsi, S.; Trigui, M. Antimicrobial activity and bioguided fractionation of Rumex tingitanus extracts for meat preservation. Meat Sci. 2017, 125, 1–32. [Google Scholar] [CrossRef]
- Ben Younes, A.; Ben Salem, M.; El Abed, H.; Jarraya, R. Phytochemical screening and antidiabetic, antihyperlipidemic, and antioxidant properties of Anthyllis henoniana (Coss.) flowers extracts in an alloxan-induced rats model of diabetes. Evidence-based Complement. Altern. Med. 2018, 2018, 1–15. [Google Scholar] [CrossRef] [Green Version]
- Terpinc, P.; Ceh, B.; Poklar Ulrih, N.; Abramovic, H. Studies of the correlation between antioxidant properties and the total phenolic content of different oil cake extracts. Ind. Crops Prod. 2012, 39, 210–217. [Google Scholar] [CrossRef]
- Akrout, A.; Alarcon Gonzalez, L.; El Jani, H.; Madrid, P.C. Antioxidant and antitumor activities of Artemisia campestris and Thymelaea hirsuta from southern Tunisia. Food Chem. Toxicol. 2011, 49, 342–347. [Google Scholar] [CrossRef] [PubMed]
- Olounladé, P.A.; Azando, E.V.B.; Attakpa, E.Y.; Gbenou, J.D.; Tchétan, E.; Dansou, C.C.; Hounzangbé-Adoté, M.S.; Gbaguidi, F.; Moudachirou, M.; Hoste, H.; et al. In vitro study on the role of the tannins of Newbouldia laevis and Zanthoxylum zanthoxyloides on infective larvae of Trichostrongyus colubriformis. African J. Agric. Res. 2017, 12, 3513–3519. [Google Scholar] [CrossRef]
- Schofield, P.; Mbugua, D.M.; Pell, A.N. Analysis of condensed tannins: A review. Anim. Feed Sci. Technol. 2001, 91, 21–40. [Google Scholar] [CrossRef]
- Re, R.; Pellegrini, N.; Proteggente, A.; Pannala, A.; Yang, M.; Rice-Evans, C. Development and characterisation of carbon nanotube-reinforced polyurethane foams. Free Radic. Biol. Med. 1998, 26, 51. [Google Scholar] [CrossRef]
- Ben Salem, M.; Affes, H.; Athmouni, K.; Ksouda, K.; Dhouibi, R.; Sahnoun, Z.; Hammami, S.; Zeghal, K.M. Chemicals compositions, antioxidant and anti-inflammatory activity of Cynara scolymus leaves extracts, and analysis of major bioactive polyphenols by HPLC. Evidence-based Complement. Altern. Med. 2017, 14, 1–15. [Google Scholar] [CrossRef] [PubMed] [Green Version]
- Barros, L.; Calhelha, R.C.; Vaz, J.A.; Ferreira, I.C.F.R.; Baptista, P.; Estevinho, L.M. Antimicrobial activity and bioactive compounds of Portuguese wild edible mushrooms methanolic extracts. Eur. Food Res. Technol. 2007, 225, 151–156. [Google Scholar] [CrossRef]
- Bassole, I.H.N.; Ouattara, A.S.; Nebie, R.; Ouattara, C.A.T.; Kabore, Z.I.; Traore, S.A. Chemical composition and antibacterial activities of the essential oils of Lippia chevalieri and Lippia multiflora from Burkina Faso. Phytochemistry 2003, 62, 209–212. [Google Scholar] [CrossRef]
- Boshir Ahmed, M.; Bouallagui, Z.; Kallel, M.; Maalej, S.; Zhou, J.; Ayadi, H. Box-Behnken design for extraction optimization of crude polysaccharides from Tunisian Phormidium versicolor cyanobacteria (NCC 466): Partial characterization, in vitro antioxidant and antimicrobial activities. Int. J. Biol. Macromol. 2017, 105, 1501–1510. [Google Scholar] [CrossRef]


| Extracts | TPC (mg GAE/g) | TFC (mg QE/g) | CT(mg CE/g) |
|---|---|---|---|
| EtOAc | 67.654 ± 0.034 b | 60.382 ± 0.000 b | 18.640 ± 0.000 b |
| EtOH/Water (70-30, v/v) | 100.988 ± 0.046 a | 94.811 ± 0.001 a | 9.320 ± 0.000 c |
| n-BuOH | 64.938 ± 0.002 c | 38.136 ± 0.000 c | 34.950 ± 0.000 a |
| Compound | TR (min) | UV (nm) | Relative Abundance (%) | [M-H]− m/z | LC/ESI-MS2 m/z (%) | MS3 | MS4 | Attribution | Ref |
|---|---|---|---|---|---|---|---|---|---|
| 1a | 3.44 | 257 | 0.656 | 191 | 111,173, 155 | Isocitric acid | [14] | ||
| 1b | 3.44 | 257 | 133 | 115 (100) | Malic acid | [15] | |||
| 2 | 6.32 | 0.943 | 161 | 115, 143 (100) | 1,1,2-Ethanetricarboxylic acid | [15] | |||
| 3 | 7.49 | 263 | 1.978 | 219 | 111, 155, 173 (100) | Propane-1,1,2,3-tetracarboxylic acid | [14] | ||
| 4 | 8.72 | 274–304 | 0.314 | 479 | 271, 299 (100), 316, 317 | Myricetin-hexoside | [16,17] | ||
| 5 | 9.48 | 285 | 0.183 | 597 | 480, 551 (100) | Unidentified | |||
| 6 | 10.2 | 281 | 0.539 | 447 | 401 (100) | 161,131, 269 (100) | Unidentified | ||
| 7 | 10.38 | 275–342 | 1.489 | 495 | 287, 332 (100), 333, 479 | 3,3′,4′,5,7-pentahydroxy-6-methoxyflavanonol-3-O-glucoside | [18] | ||
| 8a | 11 | 261–363 | 0.327 | 787 | 495, 611(100), 671 | 3,3′,4′,5,7-pentahydroxy-6-methoxyflavanonol-3-O-glucosyl -5,4′-O-dirhamnoside | [18] | ||
| 8b | 11 | 261–363 | 0.270 | 671 | 495 (100) | 265, 271, 304, 333 (100), | 3,3′,4′,5,7-pentahydroxy-6-methoxyflavanonol-3-O-glucoside-5-O-glucuronic acid | [18] | |
| 9 | 11.6 | 260–359 | 5.831 | 655 | 479 (100) | Myricetin-3-O-glucoside-7-O-glucuronic acid | [19] | ||
| 10 | 11.87 | 261–363 | 29.001 | 815 | 495, 537, 577, 639 (100) | 495(100), 537, 577 | 287, 332 (100), 494 | Unidentified | |
| 11 | 12.29 | 261–359 | 33.961 | 799 | 479, 521, 561, 623 (100), | 317, 479(100), 521,561 | 255, 317 (100) | Myricetin-3-O-glucoside glucuronic acid -7-O- p-hydroxybenzalacetone | [20,21] |
| 12 | 12.89 | 267–354 | 3.247 | 783 | 463, 505, 545, 607 (100), 639 | Eupafolin-3-7 di-O-rhamnopyranoside-4′-O-glucuronic acid | [22,23] | ||
| 13 | 12.98 | 267–354 | 4.864 | 479 | 316 (100), 317, 461 | Myricetin-hexoside | [16,23,24] | ||
| 14 | 13 | 270 | 1.645 | 843 | 495, 537, 577, 639 (100), 699, 741 | 315, 495 (100), 537, 577 | Unidentified | ||
| 15 | 13.25 | 261–359 | 0.213 | 915 | 479, 623, 739, 799 (100) | Myricetin-3-O-glucoside di-O-rhamnopyranoside-7-O-p-hydroxybenzalacetone | [21,23] | ||
| 16a | 13.64 | 271–357 | 2.187 | 827 | 479, 521, 561, 623 (100), 683 | 317, 479 (100) | Unidentified | ||
| 16b | 13.64 | 265–348 | 0.792 | 597 | 387, 417, 447 (100), 459 | Unidentified | |||
| 17 | 14.01 | 265–348 | 0.752 | 463 | 301 (100), 317 | Quercetin-O-glucoside | [13,25] | ||
| 18 | 14.3 | 267–353 | 0.265 | 463 | 301 (100), 300 | Quercetin-O-glucoside | [13] | ||
| 19a | 14.47 | 272–333 | 2.135 | 827 | 479, 521, 651 (100) | Patuletin-3-O-(4′′-O-acetyl-rhamno pyranosyl)-7-O-(2′′′-O-acetyl-α-L rhamnopyranoside)-4′-O-glucuronic acid | [26] | ||
| 19b | 14.47 | 272–333 | 1.509 | 843 | 495, 667 (100) | 332, 495 (100), 537, 577 | 195, 332(100) | Unidentified | |
| 20a | 15.22 | 271–365 | 0.938 | 801 | 479, 625 (100) | Myricetin-3-O-glucoside-7-O-rhamnopyranoside-O-glucuronic acid | [16] | ||
| 20b | 15.22 | 271–365 | 0.938 | 817 | 495, 641 (100) | 3,3′,4′,5,7-pentahydroxy-6-methoxyflavanonol-3-O-glucoside-5-O-rhamnopyranosyl-O- glucuronic acid | [27] | ||
| 21 | 15.61 | 263–348 | 0.906 | 447 | 179, 301 (100) | Quercetin-7-O-rhamnoside | [28,29,30] | ||
| 22 | 16.1 | 273 | 0.464 | 869 | 421, 479, 623, 637,781 (100), | Unidentified | |||
| 23 | 16.59 | 272–370 | 0.616 | 493 | 317 (100) | Patuletin-7-O-glucoside | [23] | ||
| 24 | 16.83 | 272–368 | 0.872 | 467 | 421 (100) | Triterpenoid acid 7-oxo-11-H derivatives | [31] | ||
| 25 | 16.83 | 272–368 | 0.872 | 725 | 479 (100) | Unidentified | |||
| 26 | 17 | 272–333 | 0.371 | 885 | 495, 537, 577, 639 (100), | 495 (100), 537, 577 | Unidentified | ||
| 27 | 17.32 | 272 | 4.536 | 869 | 479, 521, 561, 623 (100) | 317, 479 (100), 521,561 | Unidentified | ||
| 28 | 18.61 | 274 | 0.207 | 739 | 317, 479 (100) | 317 (100) | Unidentified | ||
| 29 | 19 | 272 | 2.239 | 883 | 479, 521, 561, 623 (100) | 479(100) | 317 (100) | Unidentified |
| Extracts/Standard | TAC (mg GAE/g Extract) | DPPH• IC50 (mg·mL−1) | ABTS•+ IC50 (mg·mL−1) |
|---|---|---|---|
| EtOAc | 315.865 ± 0.001 c | 0.043 ± 0.009 c | 0.09 ± 0.017 c |
| EtOH/Water (70/30, v/v) | 597.934 ± 0.002 b | 0.037 ± 0.018 b | 0.062 ± 0.012 b |
| n-BuOH | 661.429 ± 0.001 a | 0.031 ± 0.005 a | 0.048 ± 0.009 a |
| Gallic acid | 433.198 ± 0.002 | -- | -- |
| Vitamin C | -- | 0.025 ± 0.015 | -- |
| Trolox | -- | -- | 0.051 ± 0.001 |
| TPC | TFC | CTs | DPPH• | ABTS•+ | FRAP | CAT | |
|---|---|---|---|---|---|---|---|
| TPC | 1 | - | - | - | - | - | - |
| TFC | 0.962 ** | 1 | - | - | - | - | - |
| CTs | 0.227 ns | −0.008 ns | 1 | - | - | - | - |
| DPPH• | 0.906 ** | 0.786 ** | 0.583 * | 1 | - | - | - |
| ABTS•+ | 0.837 ** | 0.663 * | 0.652 * | 0.929 ** | 1 | - | - |
| FRAP | 0.858 ** | 0.696 * | 0.673 * | 0.977 ** | 0.983 ** | 1 | - |
| CAT | 0.628 * | 0.435 ns | 0.557 ns | 0.667 * | 0.894 ** | 0.798 ** | 1 |
| Strains | Inhibition Zones Diameter (mm) a | |||
|---|---|---|---|---|
| Antibiotic/Antifungal | AcOEt Extract | EtOH-Eau (70/30) Extract | n-BuOH Extract | |
| Gram (+) bacterial strains b | ||||
| Micrococcus luteus LB141110 | 17 ± 0.3 | 16 ± 0.0 | 20 ± 0.8 | 19 ± 0.3 |
| Listeria ivanovii BUG 496 | 22 ± 0.3 | 17 ± 0.3 | 11 ± 0.3 | 16 ± 0.8 |
| Staphylococcus aureus ATCC 6538 | 27 ± 0.8 | 20 ± 0.3 | 20 ± 0.8 | 20 ± 0.3 |
| Gram (−) bacterial strains b | ||||
| Salmonella enterica CIP 8039 | 10 ± 0.3 | 20 ± 0.3 | 14 ± 0.3 | 15 ± 0.3 |
| Escherichia coli ATCC 8739 | 22 ± 0.3 | 16 ± 0.3 | 13 ± 0.3 | 16 ± 0.3 |
| Pseudomonas aeruginosa ATCC 9027 | 11 ± 0.8 | 20 ± 0.3 | 18 ± 0.3 | 16 ± 0.3 |
| Fungal strains c | ||||
| Aspergillus niger GCA_003615085 | NAd | NA | NA | NA |
| Fusarium oxysporum CBS 513.88 | 20 ± 0.3 | 21 ± 0.8 | 22 ± 0.3 | 20 ± 0.3 |
| Yeast strain c | ||||
| Candida albicans ATCC 90028 | 19 ± 0.3 | 20 ±0.3 | 20 ± 0.3 | 18 ± 0.2 |
| Extracts | Ampicillin/ Amphotericin B | EtOAc Extract | Inter. b | EtOH–Water (70/30, v/v) Extract | Inter. b | n-BuOH Extract | Inter. b | |||||||
|---|---|---|---|---|---|---|---|---|---|---|---|---|---|---|
| Strains | MIC (µg·mL−1) | MIC (µg·mL−1) | MBC; MFC (µg·mL−1) | R a | MIC (µg·mL−1) | MBC; MFC (µg·mL−1) | R | MIC (µg·mL−1) | MBC; MFC (µg·mL−1) | R | ||||
| Gram (+) bacterial strains | ||||||||||||||
| Micrococcus luteus | 25 | 25 | 50 | 2 | B | 12.5 | 25 | 2 | B | 12.5 | 25 | 2 | B | |
| Listeria ivanovii | 25 | 12.5 | 25 | 2 | B | 50 | 50 | 1 | B | 50 | 50 | 1 | B | |
| Staphylococcus aureus | 25 | 25 | 50 | 2 | B | 12.5 | 50 | 4 | b | 25 | 50 | 2 | B | |
| Gram (−) bacterial strains | ||||||||||||||
| Salmonella enterica | 12.5 | 12.5 | 25 | 2 | B | 50 | 50 | 1 | B | 50 | 50 | 1 | B | |
| Escherichia coli | 12.5 | 25 | 50 | 2 | B | 50 | 50 | 1 | B | 25 | 50 | 2 | B | |
| Pseudomonas aeruginosa | 12.5 | 25 | 25 | 1 | B | 25 | 50 | 2 | B | 25 | 50 | 2 | B | |
| Fungal strains | ||||||||||||||
| Aspergillus niger | NA | NA | NA | NA | NA | NA | NA | NA | NA | NA | NA | NA | NA | |
| Fusarium oxysporum | NA | 12.5 | 25 | 2 | F | 12.5 | 25 | 2 | F | 25 | 50 | NA | NA | |
| Yeast strain | ||||||||||||||
| Candida albicans | 12.5 | 25 | 50 | 2 | F | 25 | 25 | 1 | F | 25 | 50 | NA | NA | |
Publisher’s Note: MDPI stays neutral with regard to jurisdictional claims in published maps and institutional affiliations. |
© 2021 by the authors. Licensee MDPI, Basel, Switzerland. This article is an open access article distributed under the terms and conditions of the Creative Commons Attribution (CC BY) license (https://creativecommons.org/licenses/by/4.0/).
Share and Cite
Affes, S.; Ben Younes, A.; Frikha, D.; Allouche, N.; Treilhou, M.; Tene, N.; Mezghani-Jarraya, R. ESI-MS/MS Analysis of Phenolic Compounds from Aeonium arboreum Leaf Extracts and Evaluation of their Antioxidant and Antimicrobial Activities. Molecules 2021, 26, 4338. https://doi.org/10.3390/molecules26144338
Affes S, Ben Younes A, Frikha D, Allouche N, Treilhou M, Tene N, Mezghani-Jarraya R. ESI-MS/MS Analysis of Phenolic Compounds from Aeonium arboreum Leaf Extracts and Evaluation of their Antioxidant and Antimicrobial Activities. Molecules. 2021; 26(14):4338. https://doi.org/10.3390/molecules26144338
Chicago/Turabian StyleAffes, Sahar, Amer Ben Younes, Donyez Frikha, Noureddine Allouche, Michel Treilhou, Nathan Tene, and Raoudha Mezghani-Jarraya. 2021. "ESI-MS/MS Analysis of Phenolic Compounds from Aeonium arboreum Leaf Extracts and Evaluation of their Antioxidant and Antimicrobial Activities" Molecules 26, no. 14: 4338. https://doi.org/10.3390/molecules26144338
APA StyleAffes, S., Ben Younes, A., Frikha, D., Allouche, N., Treilhou, M., Tene, N., & Mezghani-Jarraya, R. (2021). ESI-MS/MS Analysis of Phenolic Compounds from Aeonium arboreum Leaf Extracts and Evaluation of their Antioxidant and Antimicrobial Activities. Molecules, 26(14), 4338. https://doi.org/10.3390/molecules26144338