
Seasonal Evaluation of Phlorotannin-Enriched Extracts from Brown Macroalgae Fucus spiralis


 ,
,  , , and
Abstract
:
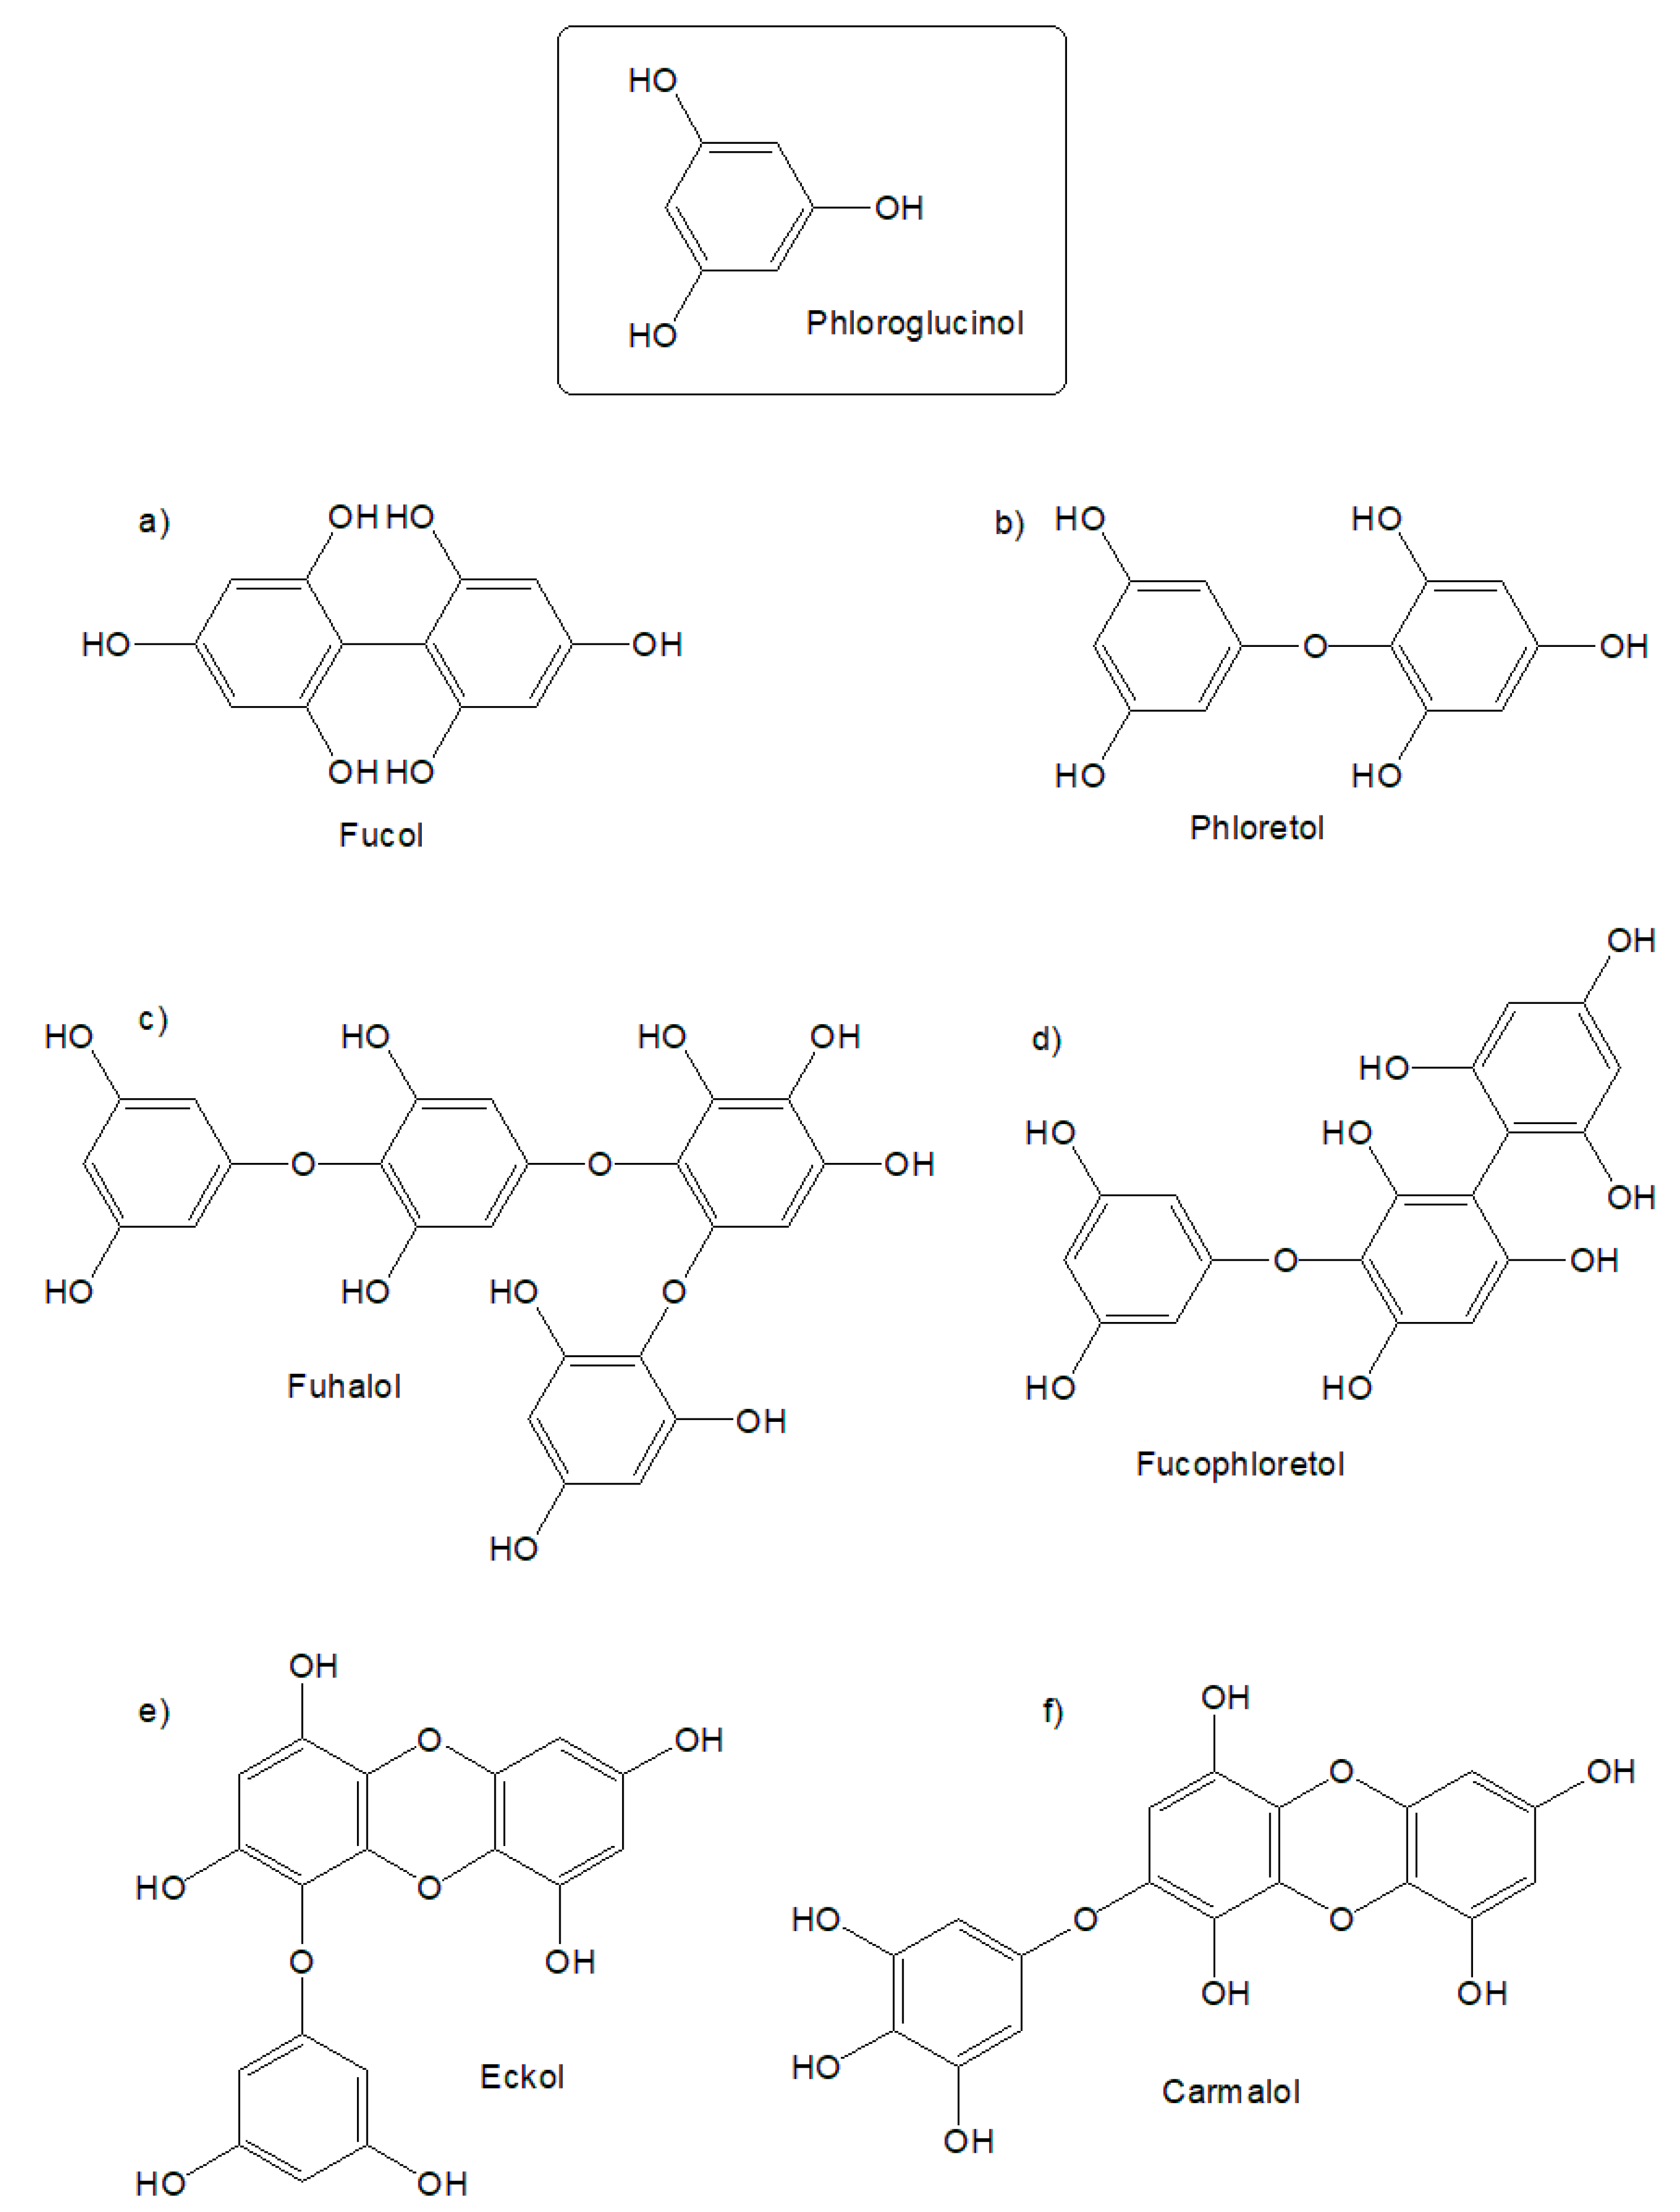
1. Introduction
2. Results and Discussion
2.1. Extraction and Characterization
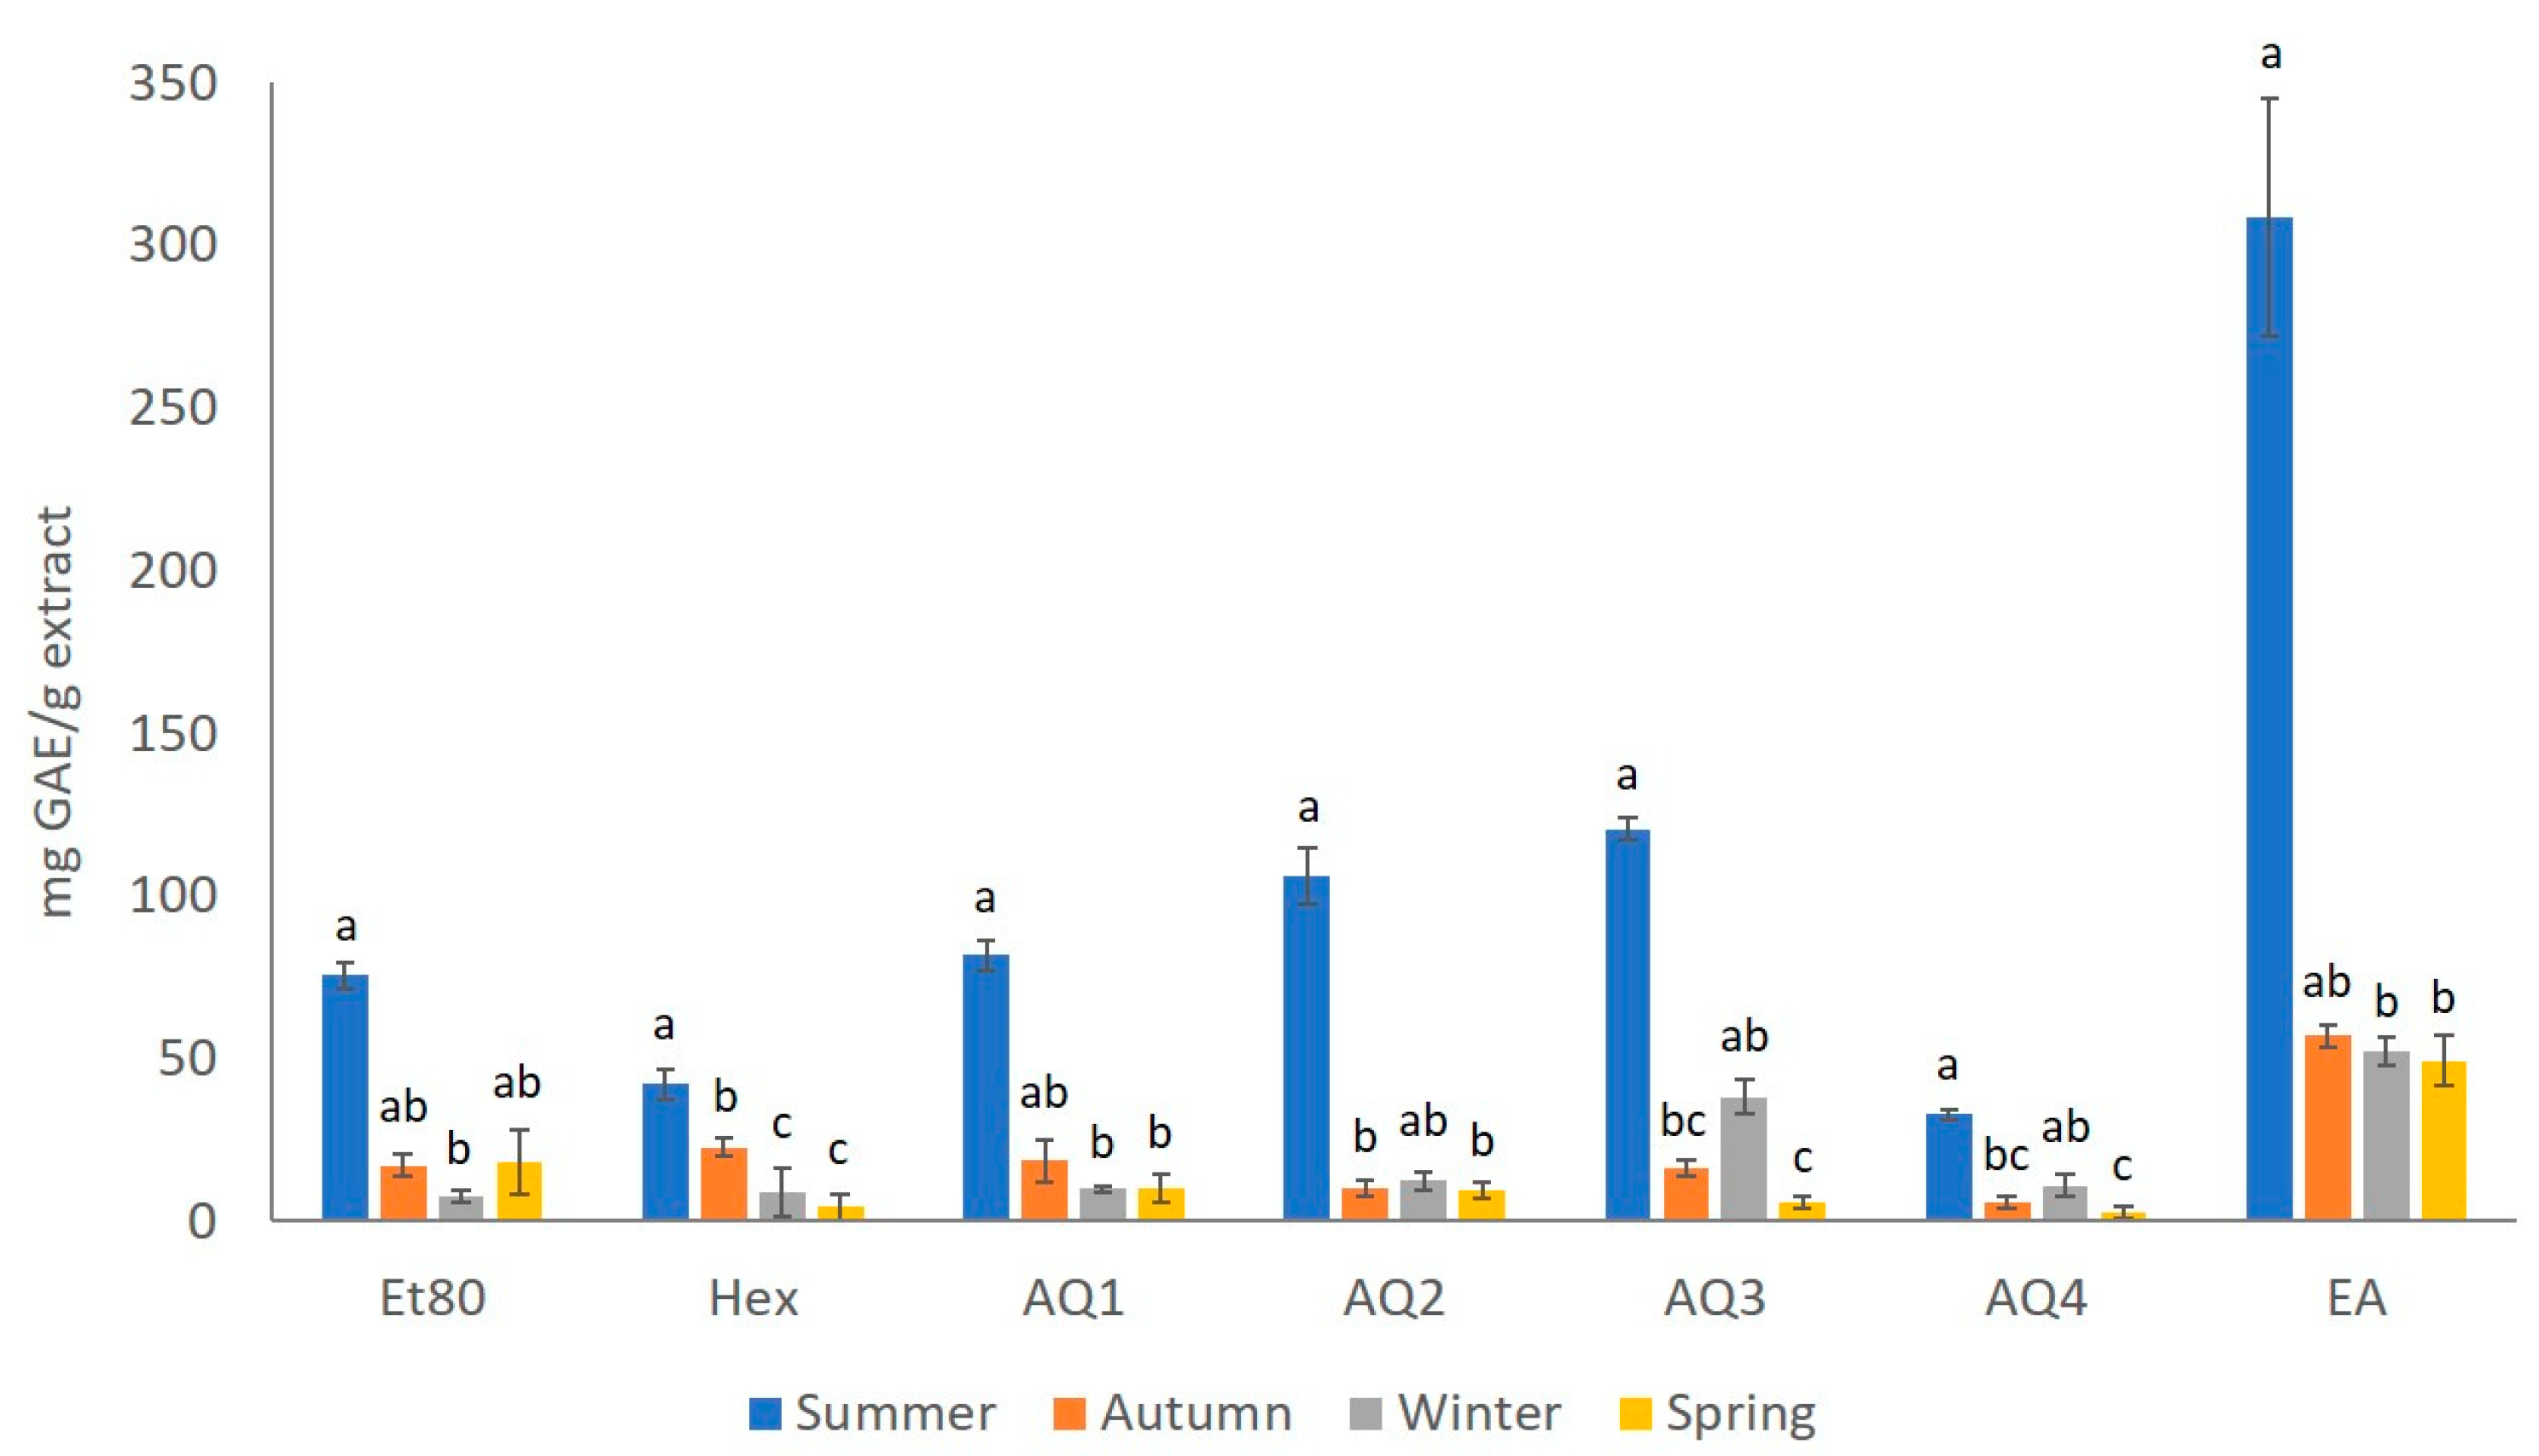
2.1.1. Total Phenolic Content (TPC)
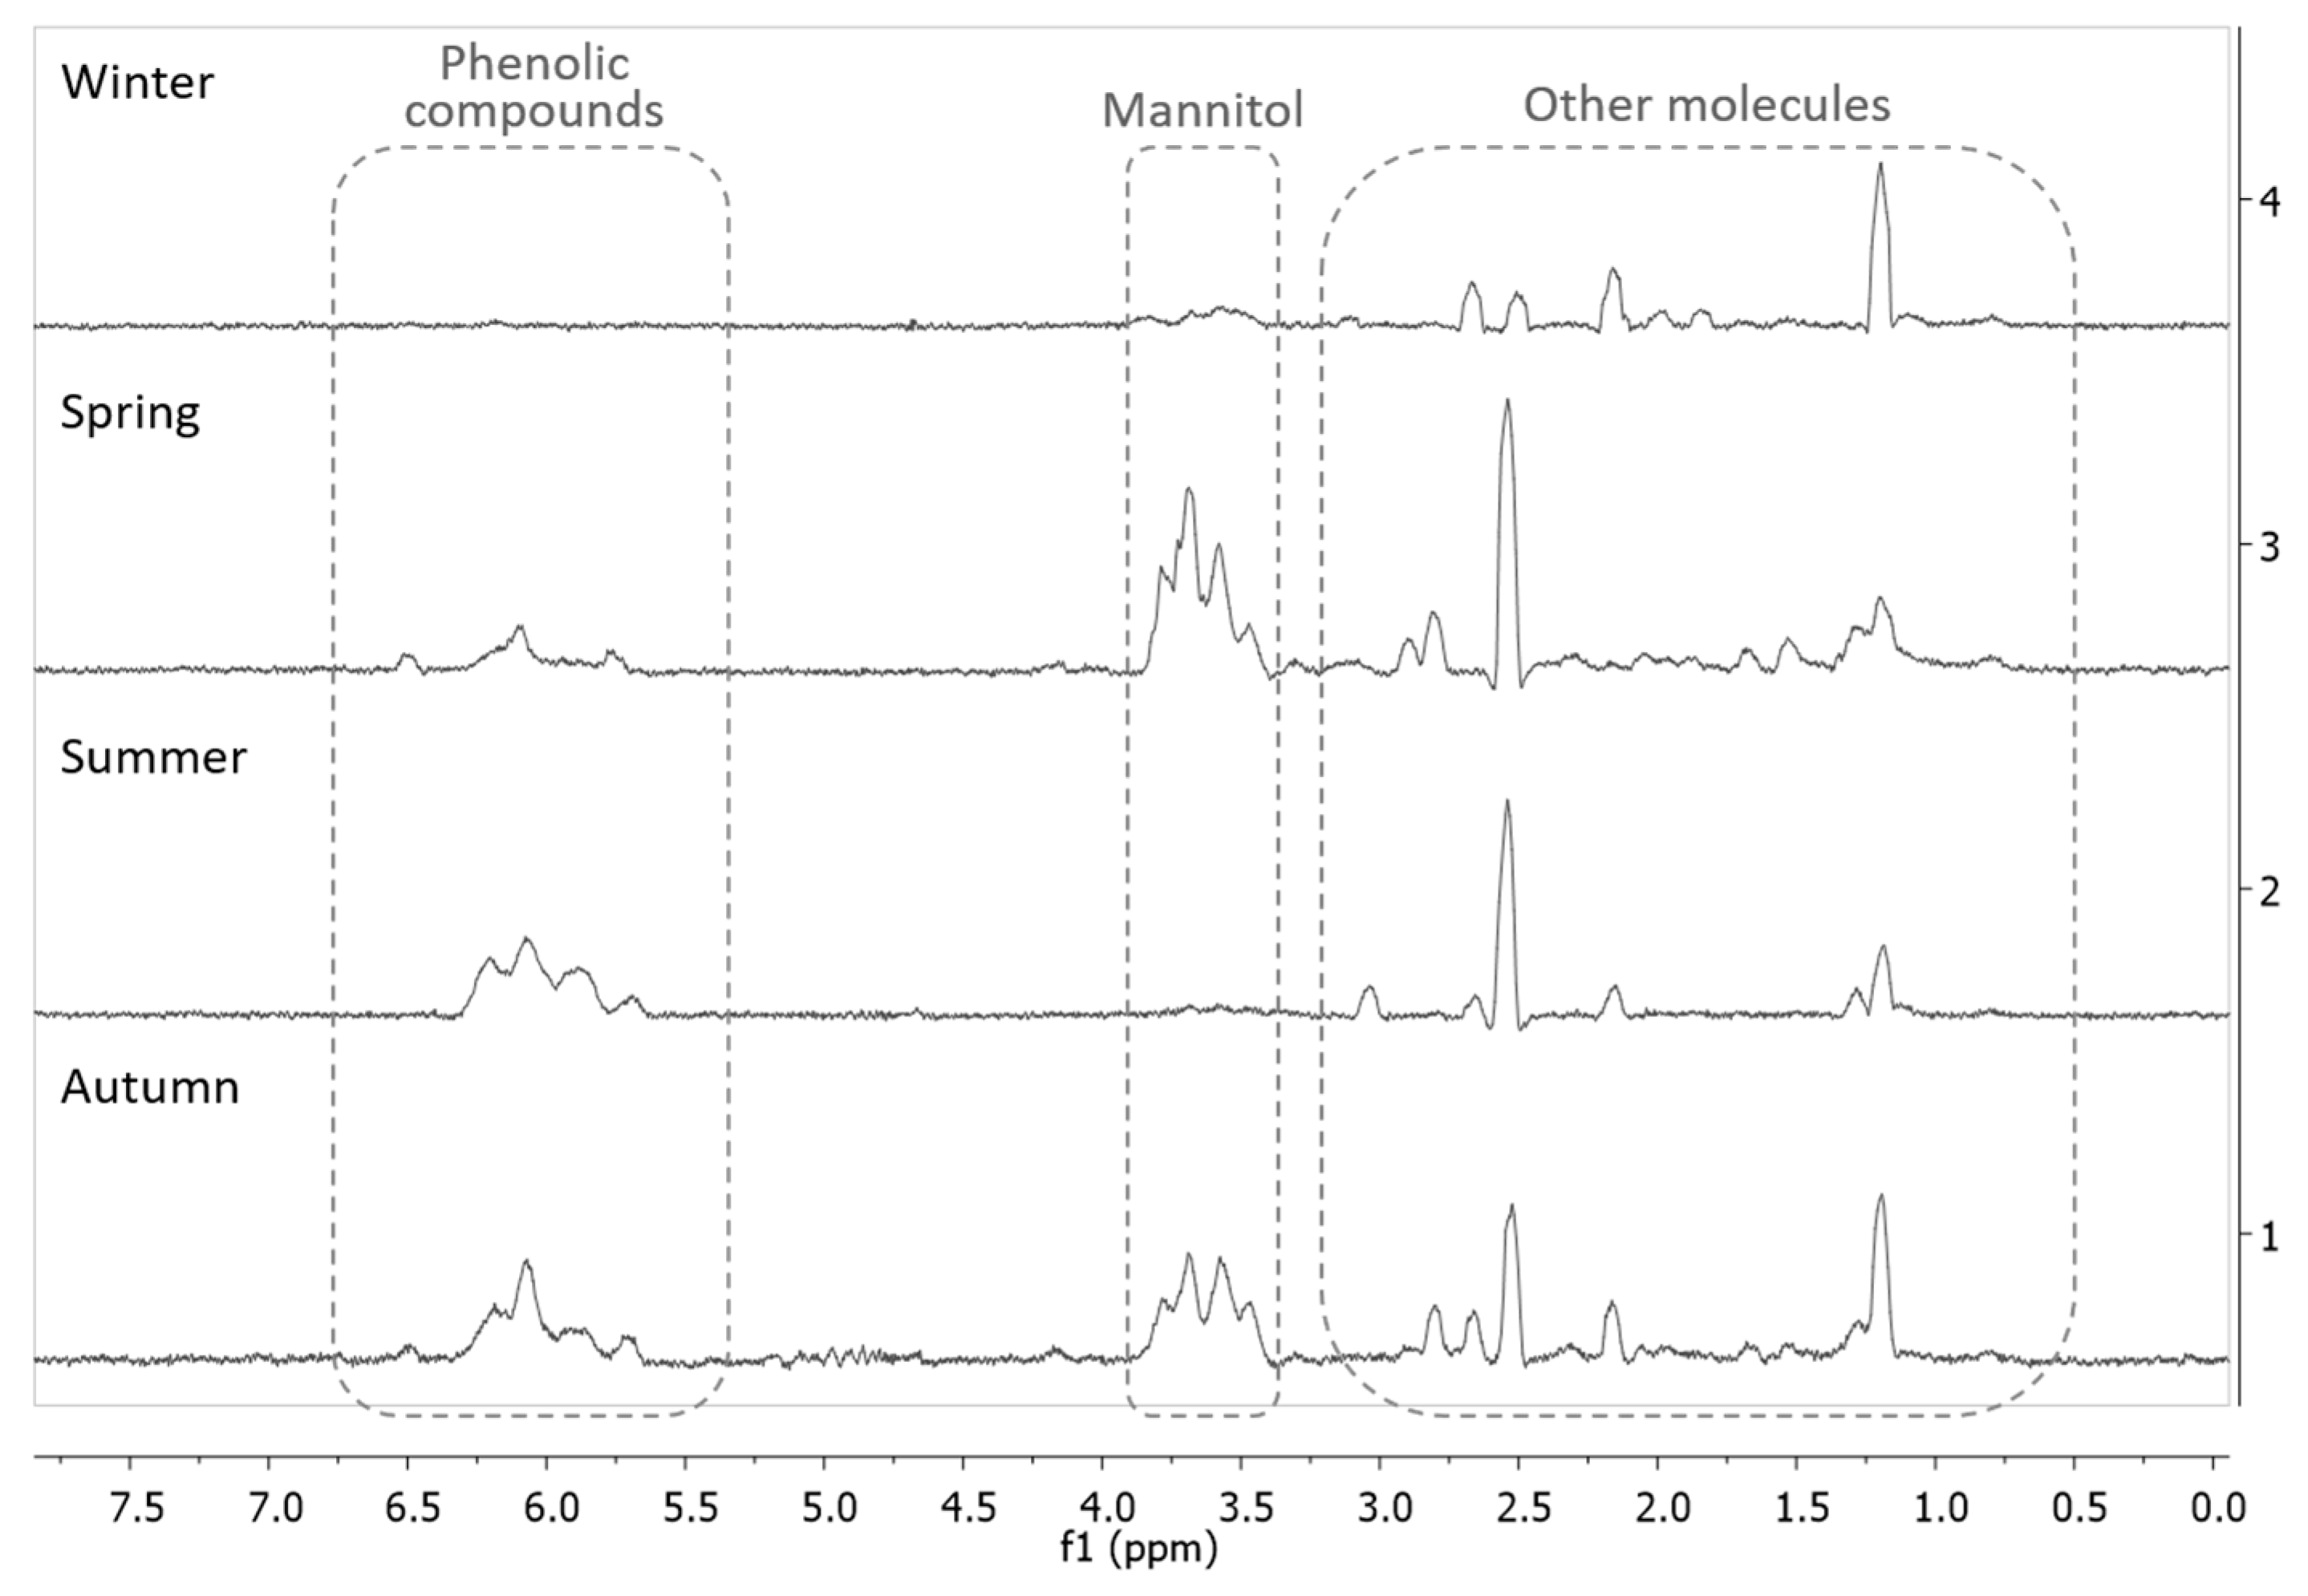
2.1.2. Proton Nuclear Magnetic Resonance (1H NMR) Spectroscopy Analysis
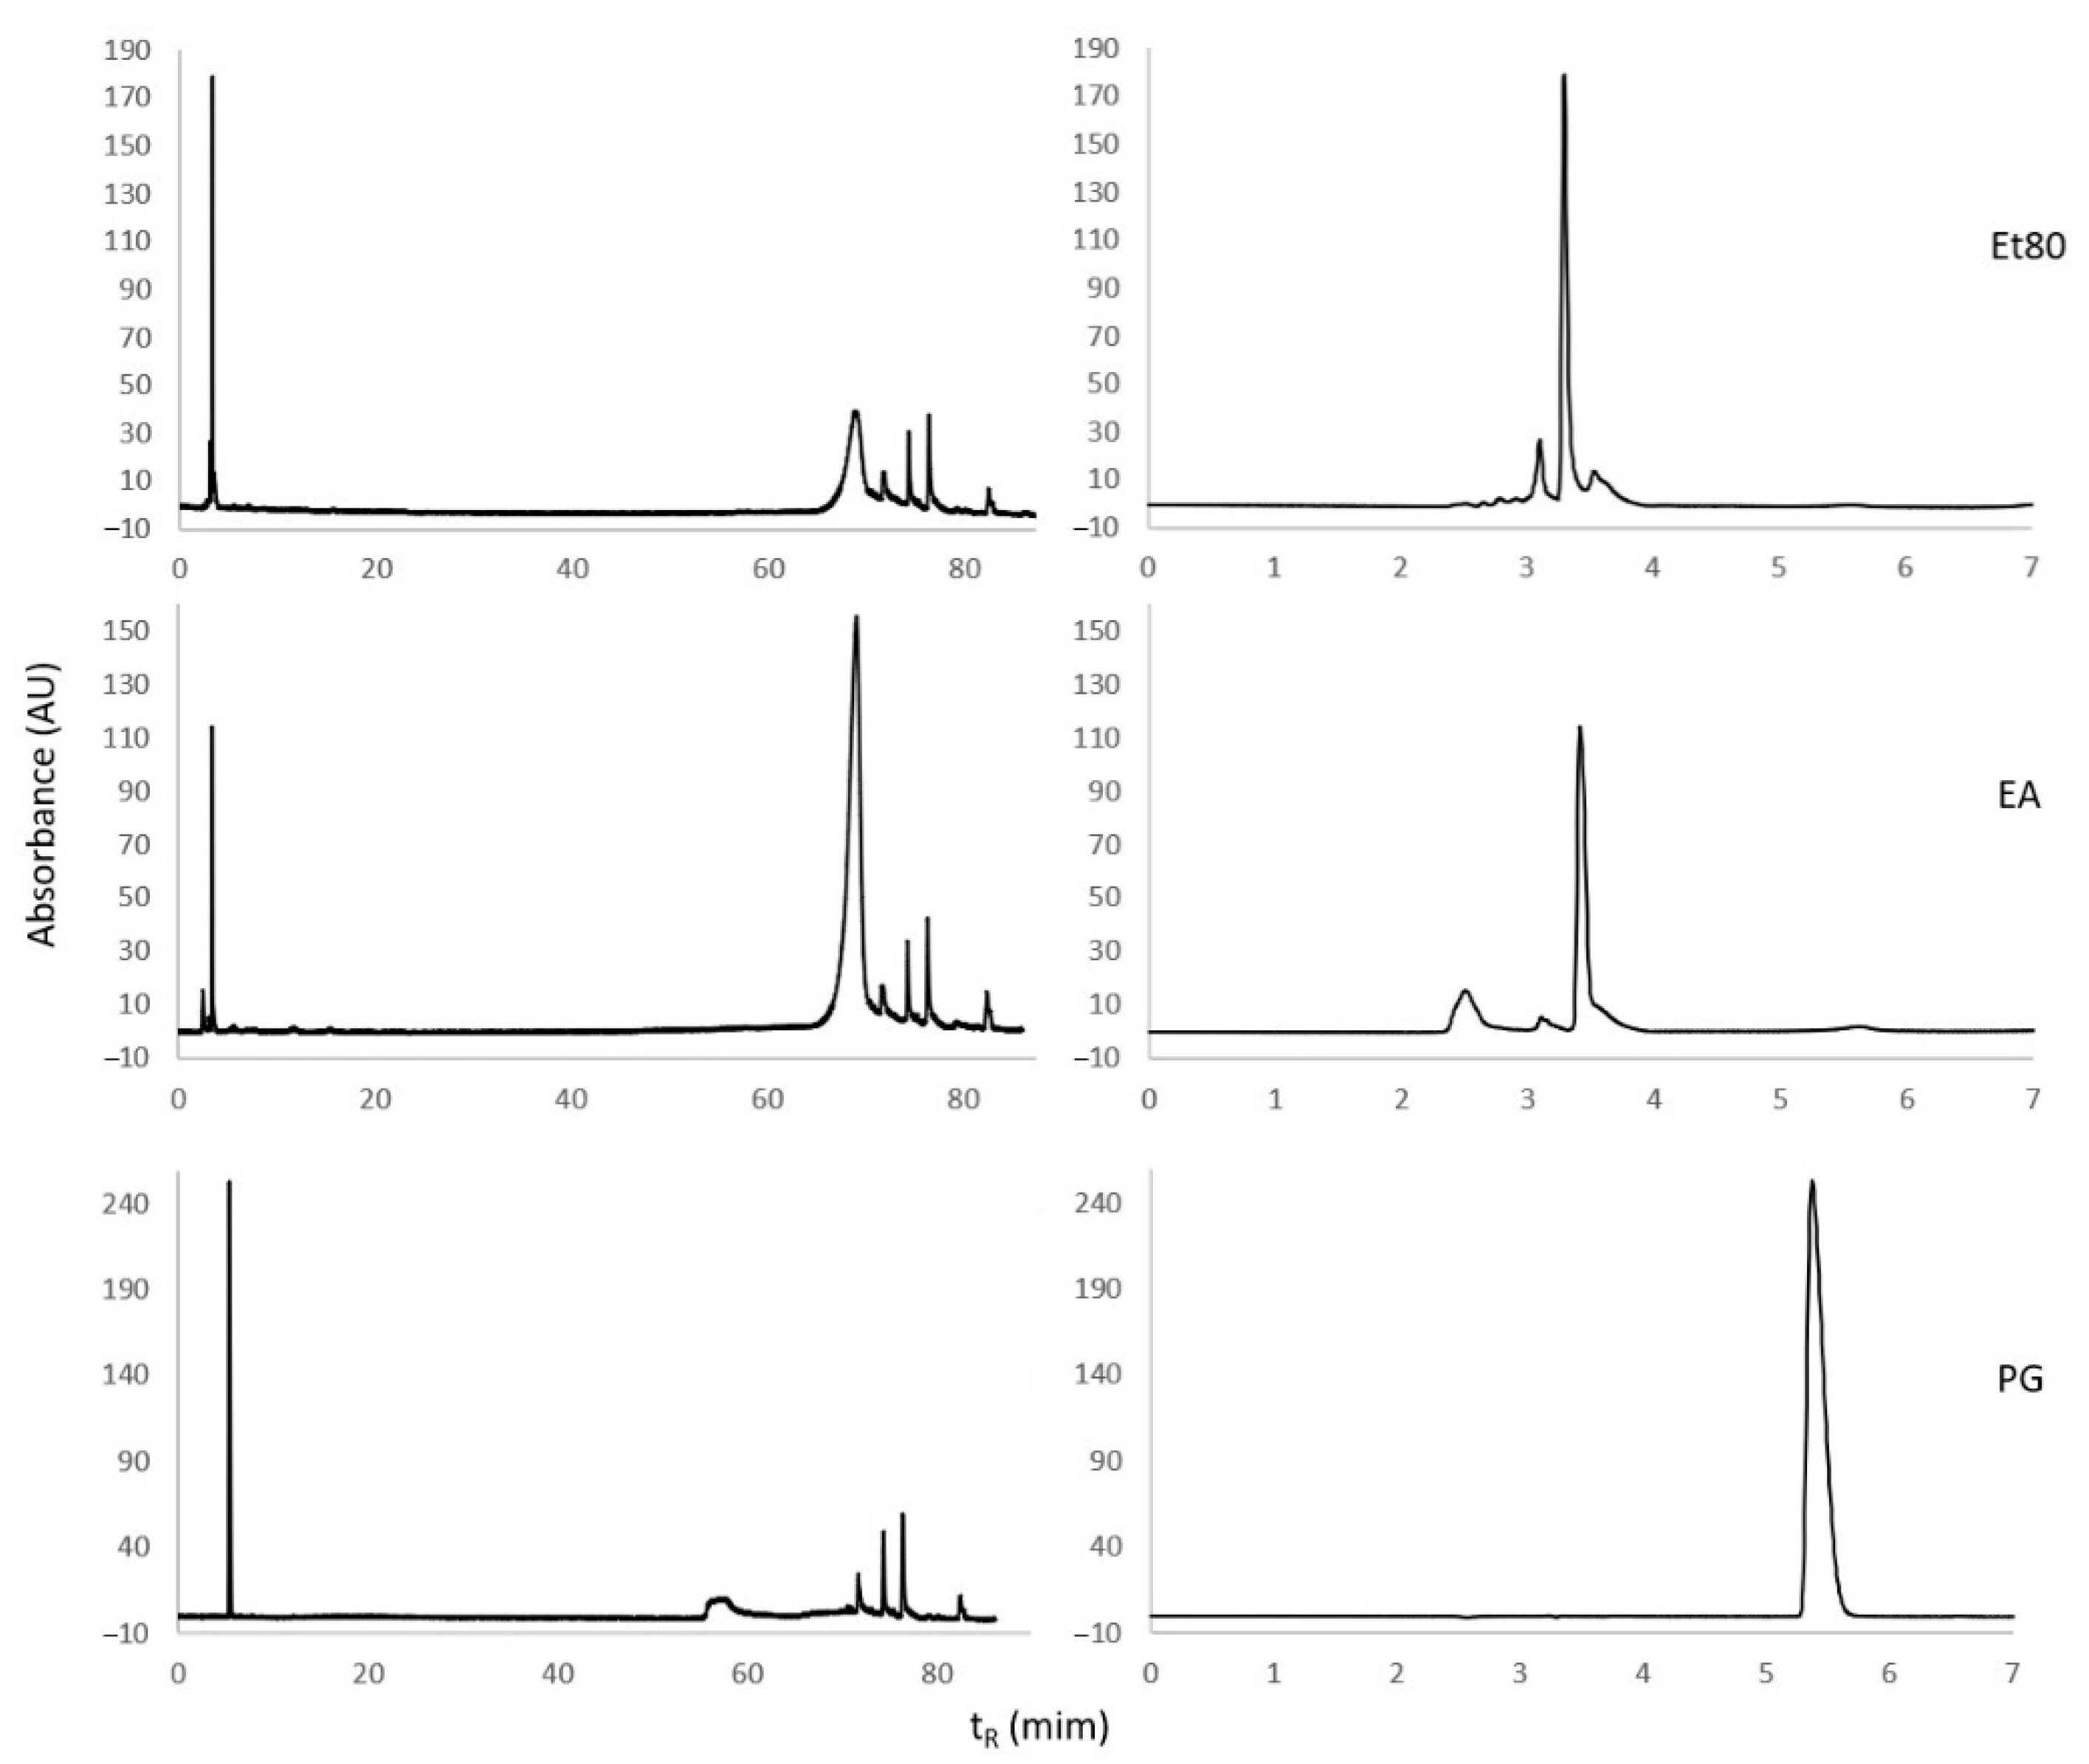
2.1.3. Reversed-Phase High-Performance Liquid Chromatography (RP-HPLC) Analysis
2.2. Antioxidant Capacity of Extracts
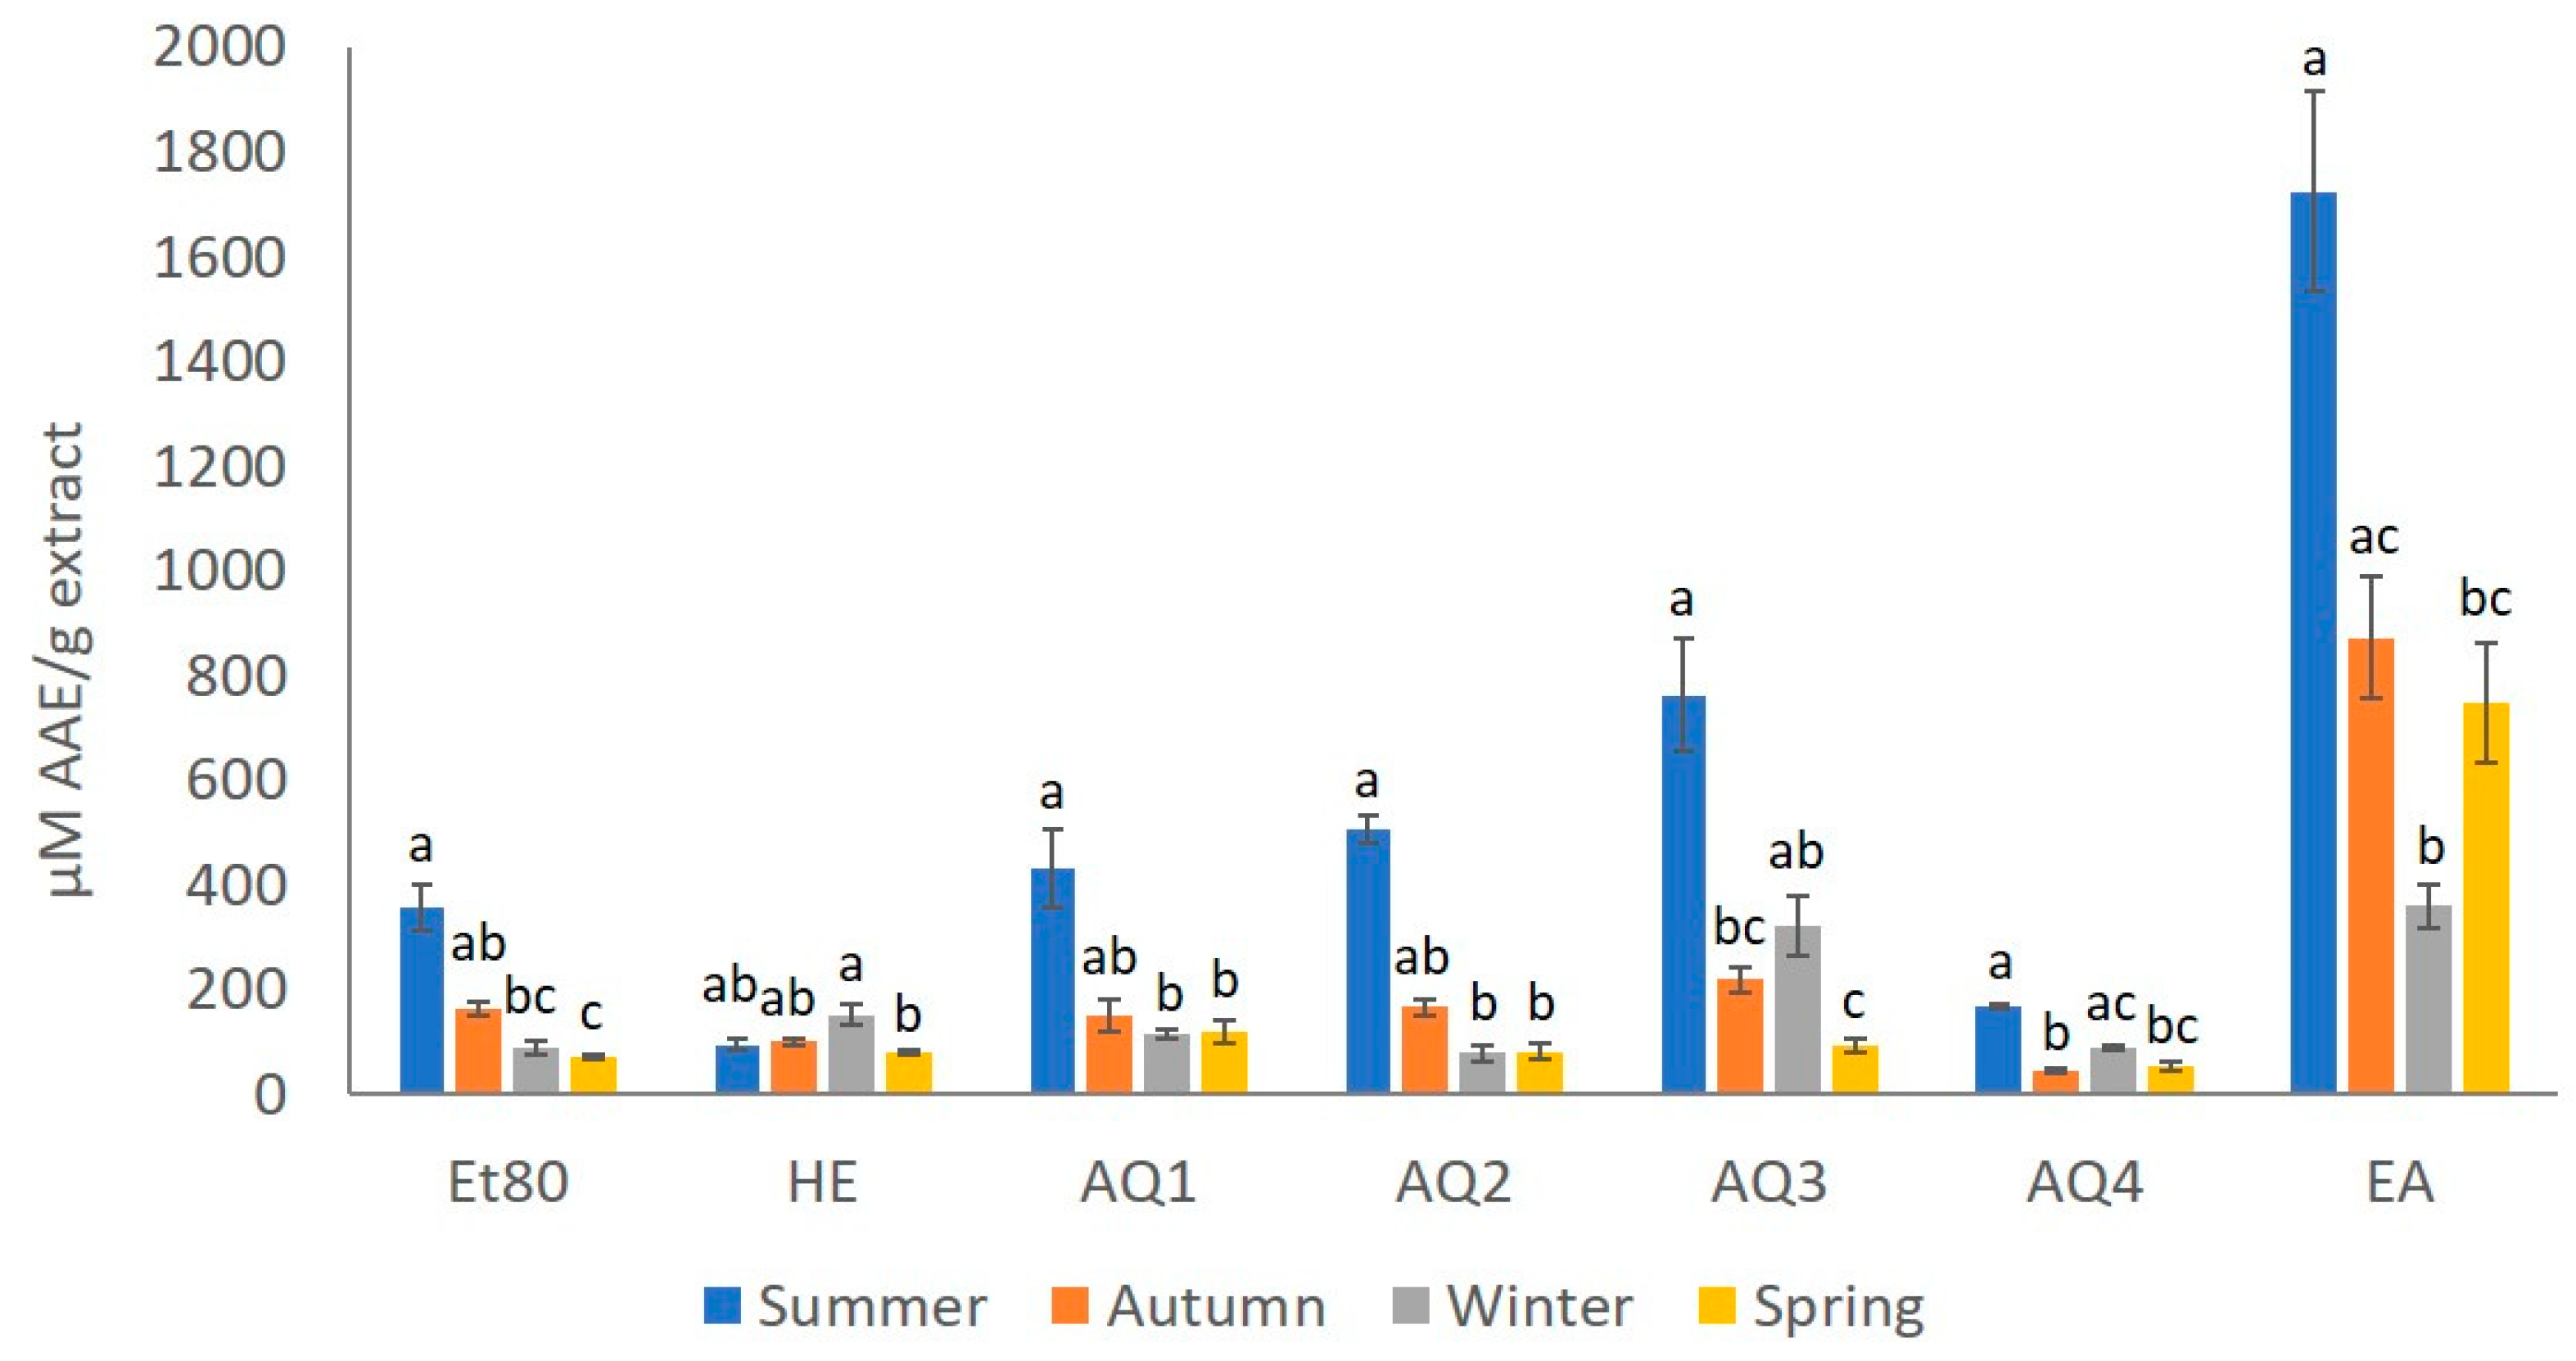
2.2.1. Ferric Reducing Antioxidant Power (FRAP)
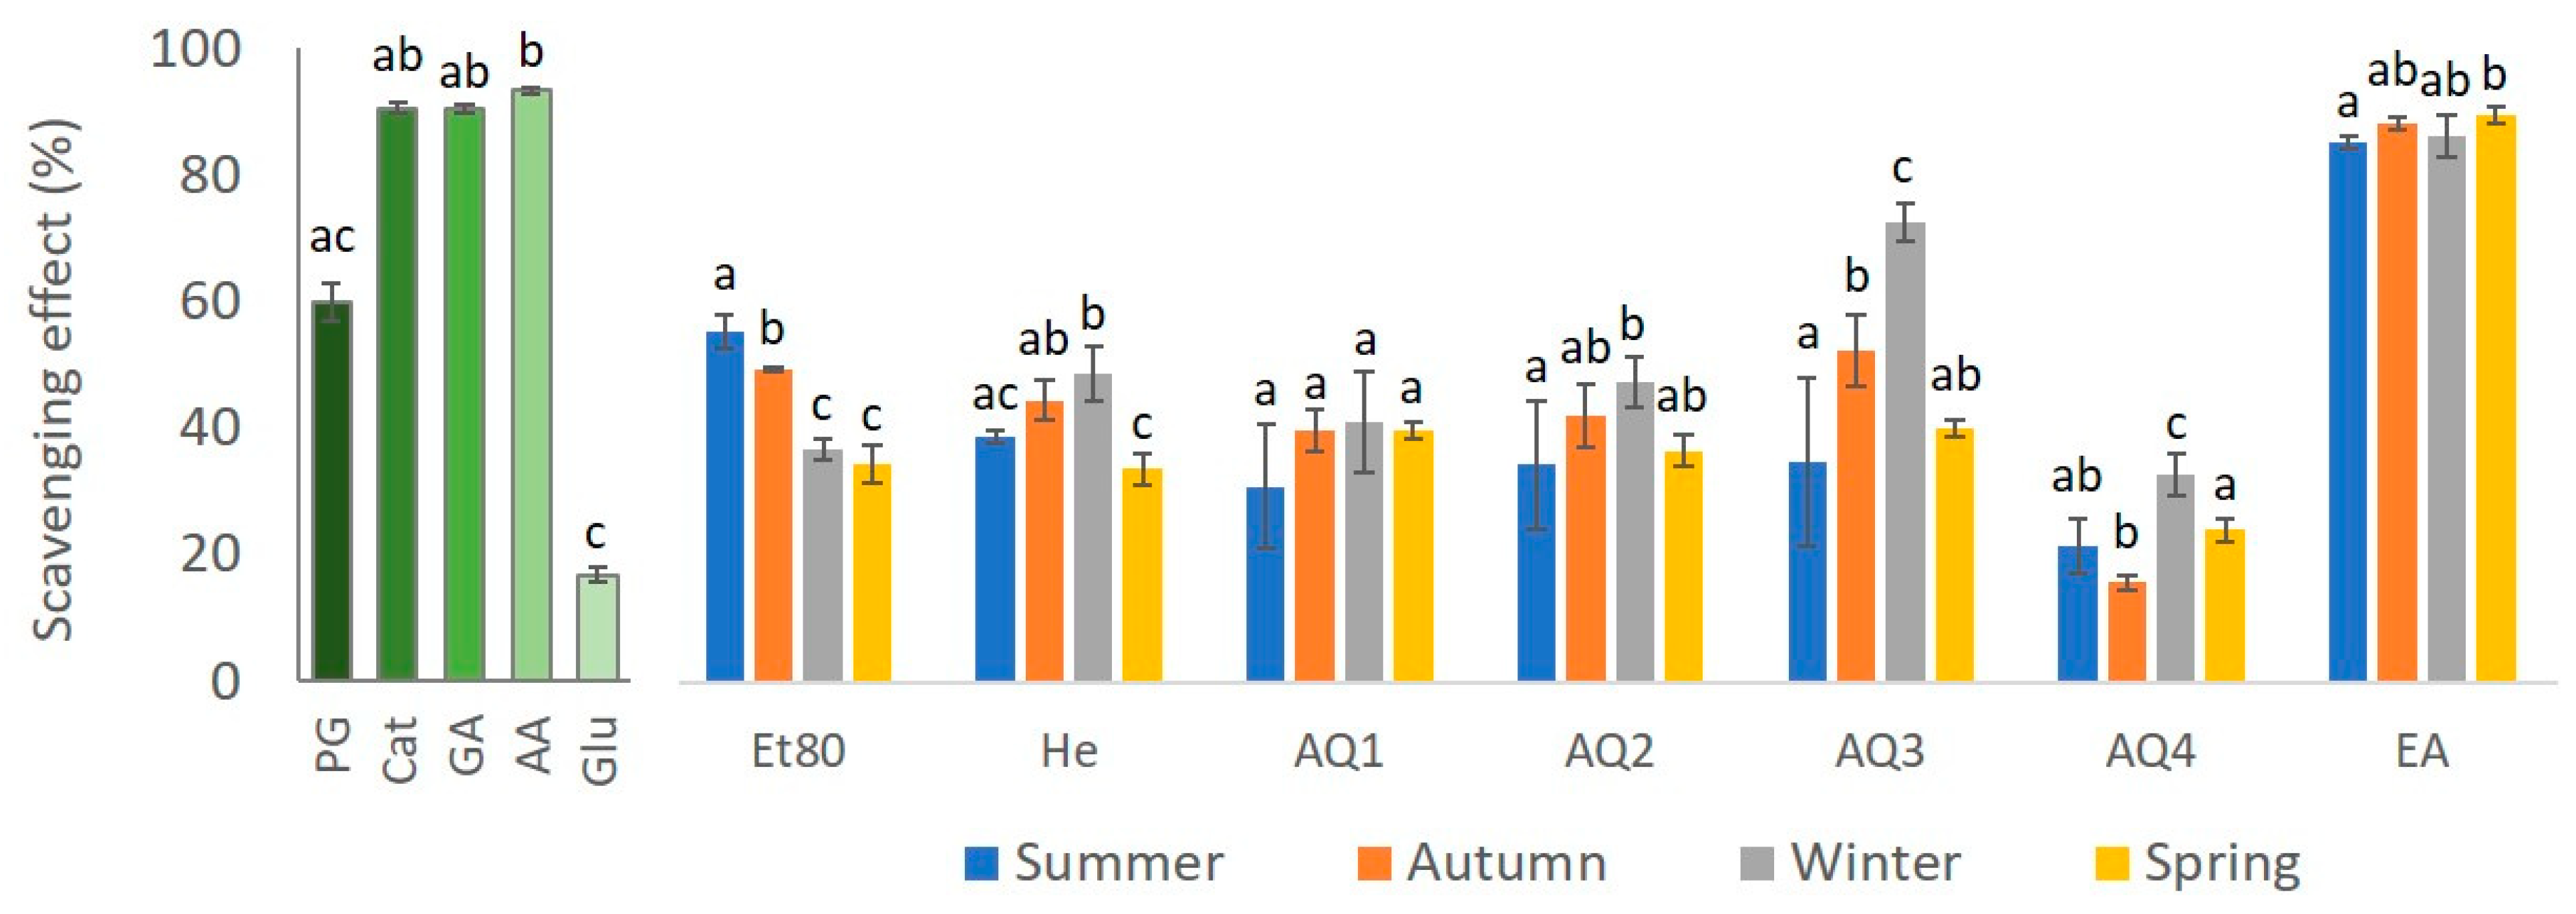
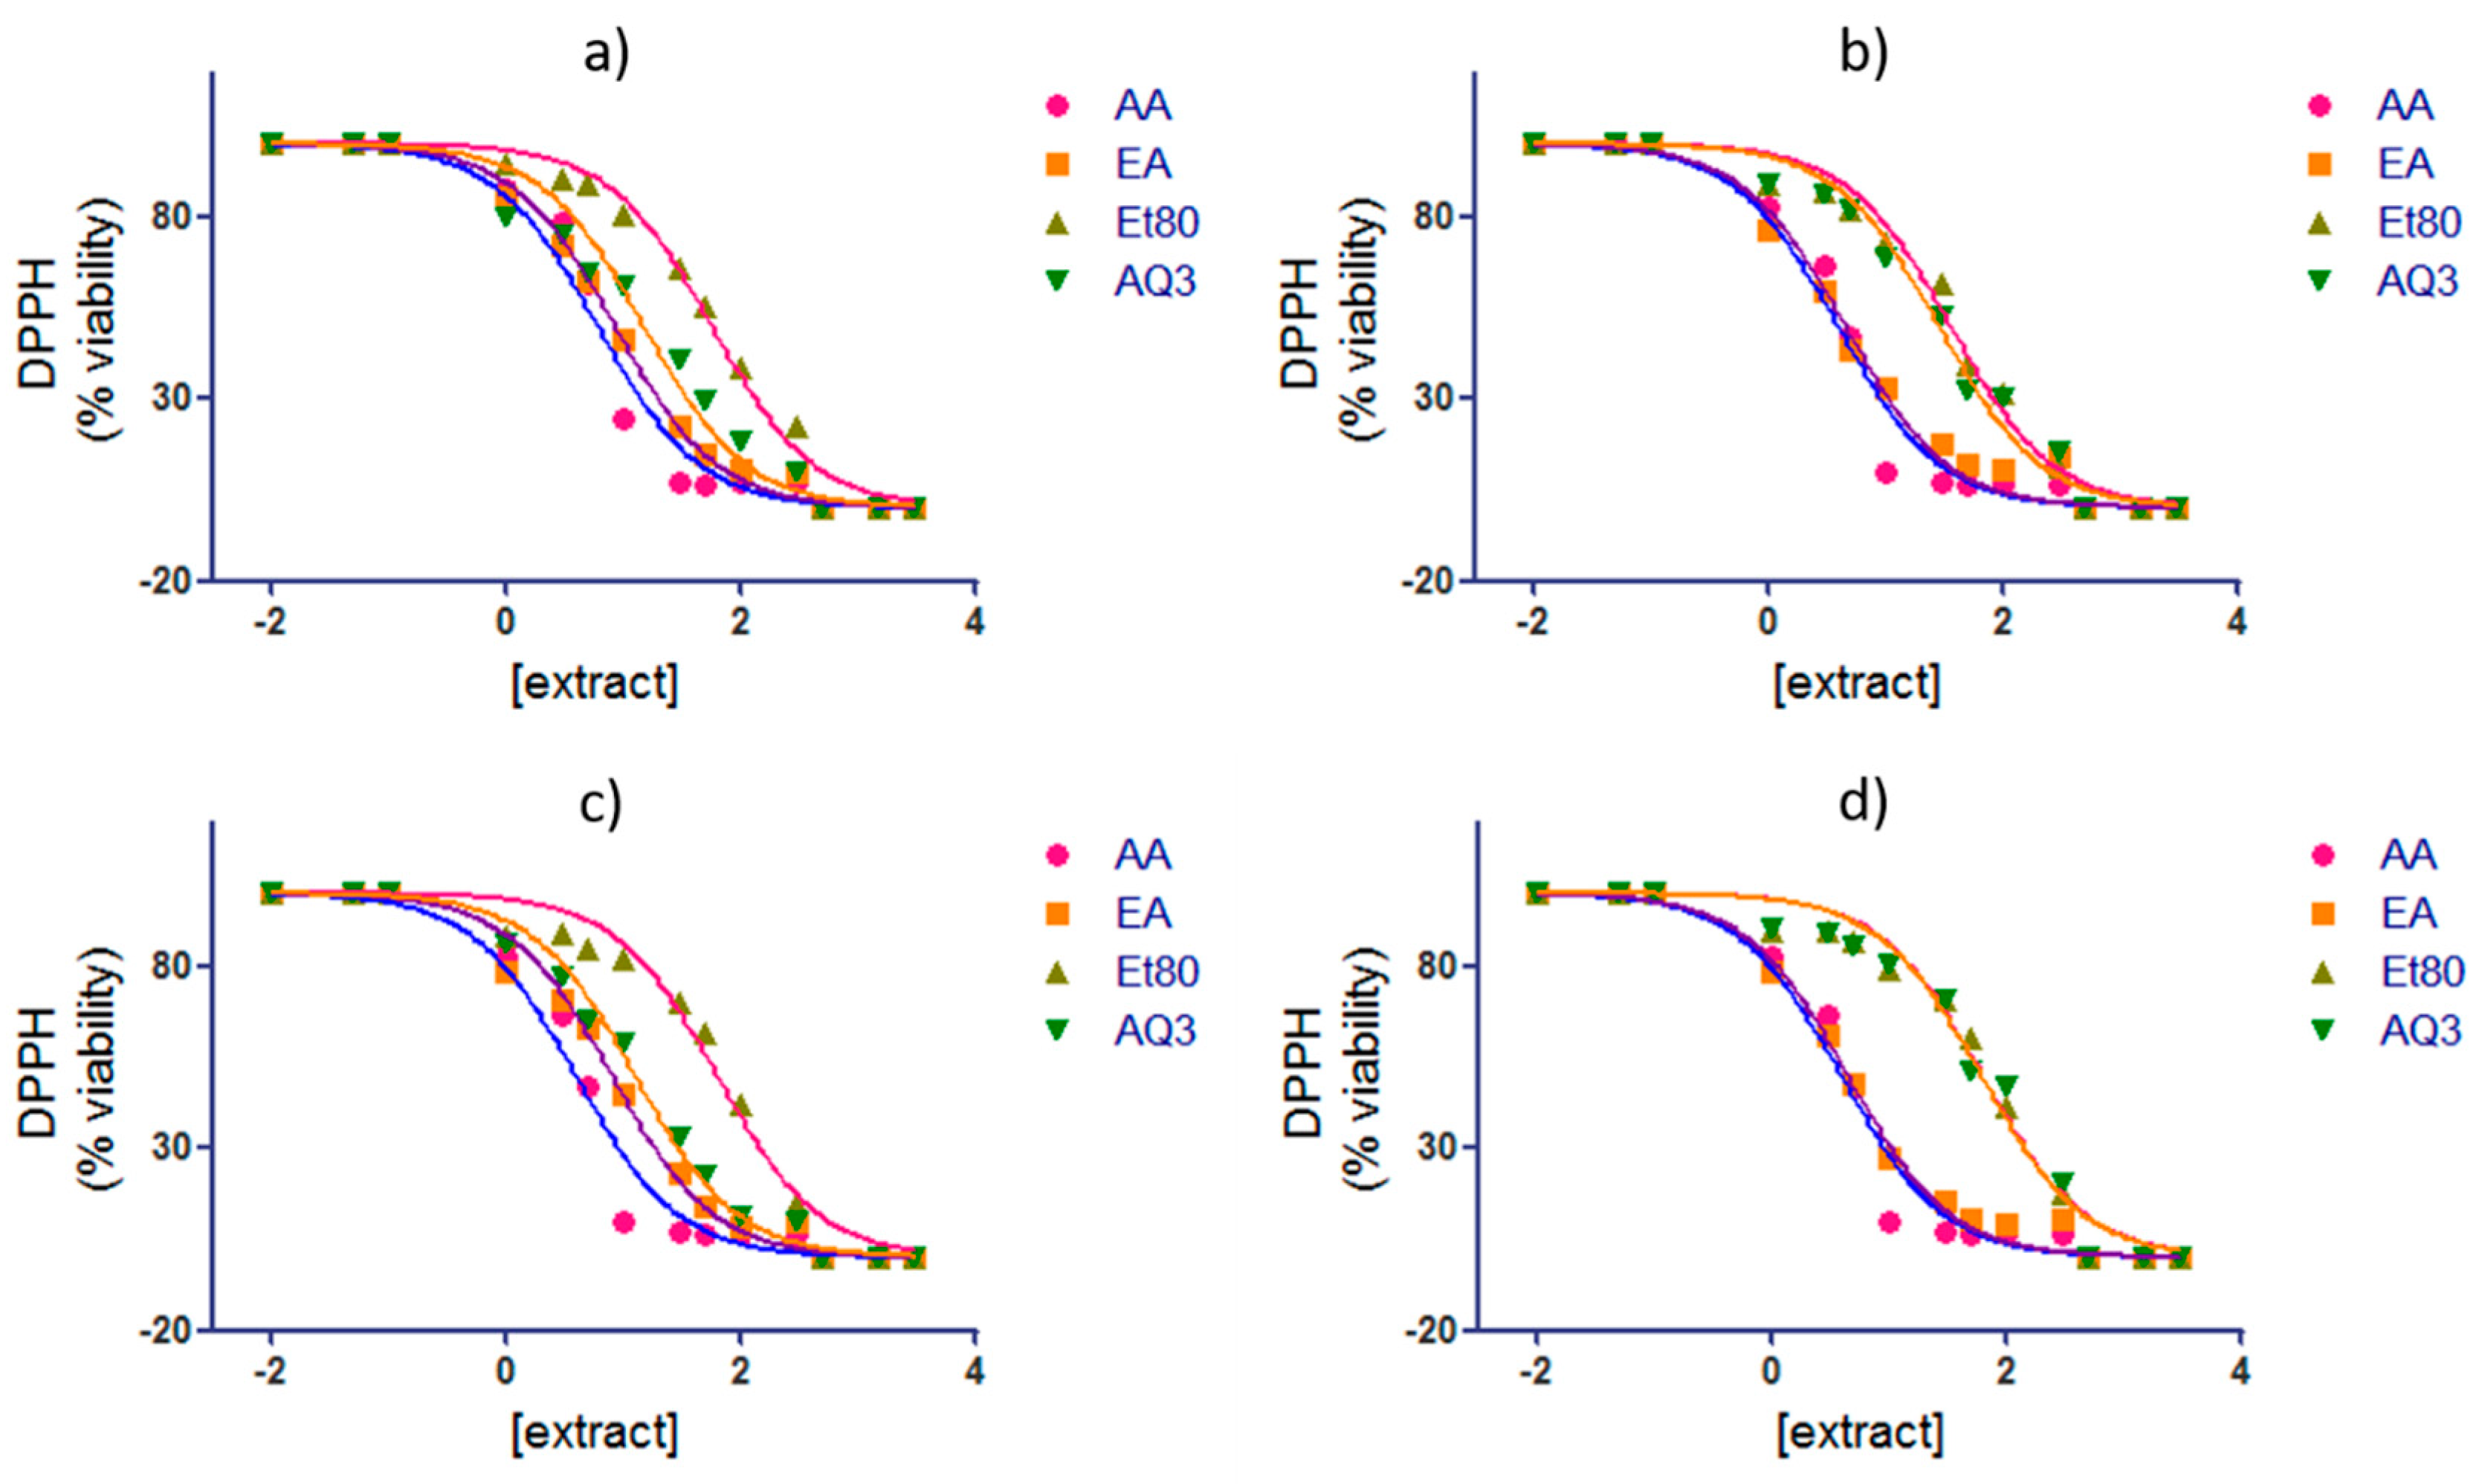
2.2.2. 1,1-Diphenyl-2-picryl-hydrazyl (DPPH) Free Radical Assay
2.3. Relation between Phenolic Compounds Content and Antioxidant Capacity
3. Materials and Methods
3.1. F. spiralis Collection and Preparation
3.2. Chemicals
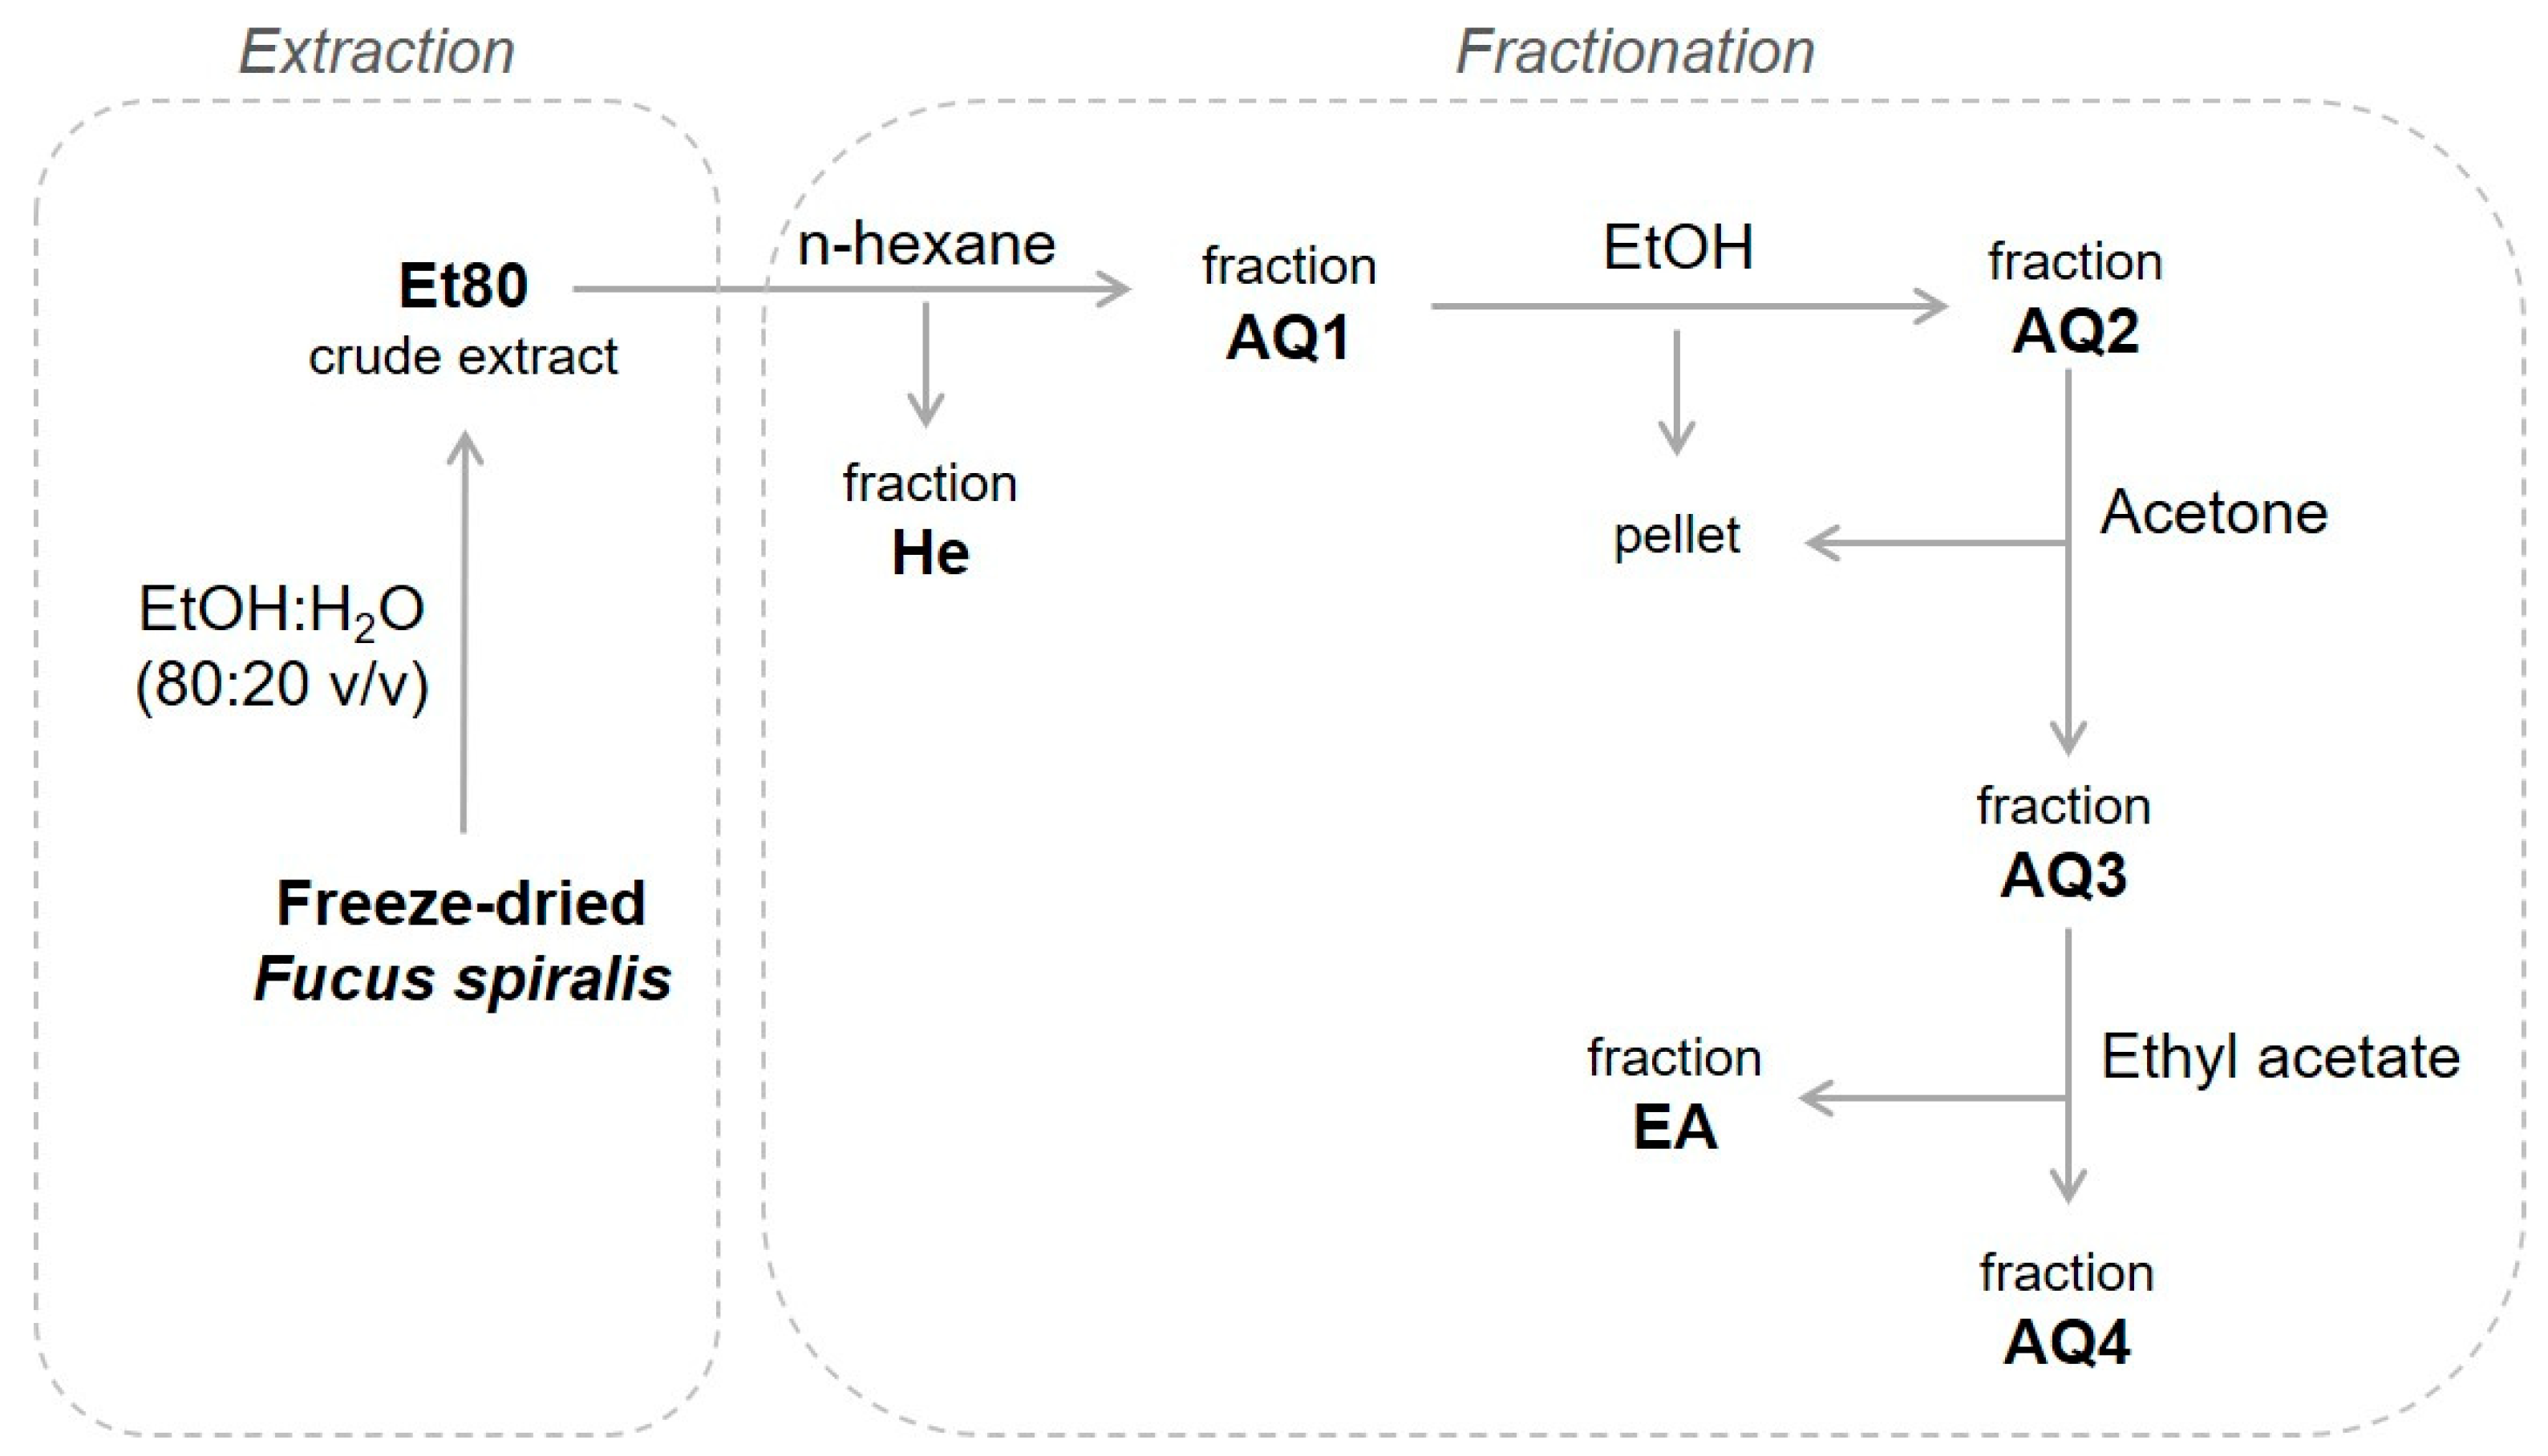
3.3. Extraction Procedure
3.3.1. Crude Ethanolic Extracts
3.3.2. Liquid–Liquid Semi-Purification of the Crude Ethanolic Extracts
3.4. Characterization of the Extracts
3.4.1. Total Phenolic Content (TPC)
3.4.2. Proton Nuclear Magnetic Resonance (1H NMR) Spectroscopy
3.4.3. Reversed-Phase High-Performance Liquid Chromatography (RP-HPLC)
3.5. Evaluation of the Antioxidant Capacity of the Extracts
3.5.1. Ferric Reducing Antioxidant Power (FRAP)
3.5.2. DPPH (2,2-Diphenyl-β-picrylhydrazyl) Radical Scavenging Activity
3.6. Statistical Analysis
4. Conclusions
Author Contributions
Funding
Institutional Review Board Statement
Informed Consent Statement
Data Availability Statement
Conflicts of Interest
Sample Availability
References
- Paiva, L.; Lima, E.; Neto, A.I.; Baptista, J. Seasonal variability of the biochemical composition and antioxidant properties of fucus spiralis at two Azorean Islands. Mar. Drugs 2018, 16, 248. [Google Scholar] [CrossRef] [Green Version]
- Kornprobst, J.-M. Phaeophyceae (Brown Algae). In Encyclopedia of Marine Natural Products; Wiley-VCH Verlag GmbH & Co. KGaA: Weinheim, Germany, 2014; pp. 1–68. [Google Scholar] [CrossRef]
- Imbs, T.I.; Zvyagintseva, T.N. Phlorotannins are Polyphenolic Metabolites of Brown Algae. Russ. J. Mar. Biol. 2018, 44, 263–273. [Google Scholar] [CrossRef]
- Kuda, T.; Nishizawa, M.; Toshima, D.; Matsushima, K.; Yoshida, S.; Takahashi, H.; Kimura, B.; Yamagishi, T. Antioxidant and anti-norovirus properties of aqueous acetic acid macromolecular extracts of edible brown macroalgae. LWT 2021, 141, 110942. [Google Scholar] [CrossRef]
- Javed, A.; Hussain, M.B.; Tahir, A.; Waheed, M.; Anwar, A.; Shariati, M.A.; Plygun, S.; Laishevtcev, A.; Pasalar, M. Pharmacological Applications of Phlorotannins: A Comprehensive Review. Curr. Drug Discov. Technol. 2021, 18, 282–292. [Google Scholar] [CrossRef] [PubMed]
- Honold, P.J.; Jacobsen, C.; Jónsdóttir, R.; Kristinsson, H.G.; Hermund, D.B. Potential seaweed-based food ingredients to inhibit lipid oxidation in fish-oil-enriched mayonnaise. Eur. Food Res. Technol. 2016, 242, 571–584. [Google Scholar] [CrossRef]
- Machu, L.; Misurcova, L.; Ambrozova, J.V.; Orsavova, J.; Mlcek, J.; Sochor, J.; Jurikova, T. Phenolic content and antioxidant capacity in algal food products. Molecules 2015, 20, 1118–1133. [Google Scholar] [CrossRef] [PubMed] [Green Version]
- Puspita, M.; Déniel, M.; Widowati, I.; Radjasa, O.K.; Douzenel, P.; Marty, C.; Vandanjon, L.; Bedoux, G.; Bourgougnon, N. Total phenolic content and biological activities of enzymatic extracts from Sargassum muticum (Yendo) Fensholt. J. Appl. Phycol. 2017, 29, 2521–2537. [Google Scholar] [CrossRef] [PubMed]
- Karadağ, A.; Hermund, D.B.; Jensen, L.H.S.; Andersen, U.; Jónsdóttir, R.; Kristinsson, H.G.; Alasalvar, C.; Jacobsen, C. Oxidative stability and microstructure of 5% fish-oil-enriched granola bars added natural antioxidants derived from brown alga Fucus vesiculosus. Eur. J. Lipid Sci. Technol. 2017, 119, 1500578. [Google Scholar] [CrossRef]
- Miranda, J.M.; Trigo, M.; Barros-Velázquez, J.; Aubourg, S.P. Effect of an icing medium containing the alga Fucus spiralis on the microbiological activity and lipid oxidation in chilled megrim (Lepidorhombus whiffiagonis). Food Control 2016, 59, 290–297. [Google Scholar] [CrossRef] [Green Version]
- Farvin, K.H.S.; Jacobsen, C. Antioxidant activity of seaweed extracts: In Vitro assays, evaluation in 5% fish oil-in-water emulsions and characterization. JAOCS J. Am. Oil Chem. Soc. 2015, 92, 571–587. [Google Scholar] [CrossRef]
- Hermund, D.B. Extraction, Characterization and Application of Antioxidants from the Nordic Brown Alga Fucus vesiculosus. Kgs; National Food Institute, Technical University of Denmark: Lyngby, Denmark, 2016. [Google Scholar]
- Roohinejad, S.; Koubaa, M.; Barba, F.J.; Saljoughian, S.; Amid, M.; Greiner, R. Application of seaweeds to develop new food products with enhanced shelf-life, quality and health-related beneficial properties. Food Res. Int. 2017, 99, 1066–1083. [Google Scholar] [CrossRef]
- Cassani, L.; Gomez-Zavaglia, A.; Jimenez-Lopez, C.; Lourenço-Lopes, C.; Prieto, M.A.; Simal-Gandara, J. Seaweed-based natural ingredients: Stability of phlorotannins during extraction, storage, passage through the gastrointestinal tract and potential incorporation into functional foods. Food Res. Int. 2020, 137, 109676. [Google Scholar] [CrossRef]
- Surendhiran, D.; Cui, H.; Lin, L. Encapsulation of Phlorotannin in Alginate/PEO blended nanofibers to preserve chicken meat from Salmonella contaminations. Food Packag. Shelf Life 2019, 21, 100346. [Google Scholar] [CrossRef]
- Sharifian, S.; Shabanpour, B.; Taheri, A.; Kordjazi, M. Effect of phlorotannins on melanosis and quality changes of Pacific white shrimp (Litopenaeus vannamei) during iced storage. Food Chem. 2019, 298, 124980. [Google Scholar] [CrossRef]
- Ciko, A.M.; Jokić, S.; Šubarić, D.; Jerković, I. Overview on the application of modern methods for the extraction of bioactive compounds from marine macroalgae. Mar. Drugs 2018, 16, 348. [Google Scholar] [CrossRef] [PubMed] [Green Version]
- Mekinić, I.G.; Skroza, D.; Šimat, V.; Hamed, I.; Čagalj, M.; Perković, Z.P. Phenolic content of brown algae (Pheophyceae) species: Extraction, identification, and quantification. Biomolecules 2019, 9, 244. [Google Scholar] [CrossRef] [Green Version]
- Amarante, S.J.; Catarino, M.D.; Marçal, C.; Silva, A.M.S.; Ferreira, R.; Cardoso, S.M. Microwave-Assisted Extraction of Phlorotannins from Fucus vesiculosus. Mar. Drugs 2020, 18, 559. [Google Scholar] [CrossRef]
- Vázquez-Rodríguez, B.; Gutiérrez-Uribe, J.A.; Antunes-Ricardo, M.; Santos-Zea, L.; Cruz-Suárez, L.E. Ultrasound-assisted extraction of phlorotannins and polysaccharides from Silvetia compressa (Phaeophyceae). J. Appl. Phycol. 2020, 32, 1441–1453. [Google Scholar] [CrossRef]
- Gall, E.A.; Lelchat, F.; Hupel, M.; Jégou, C.; Stiger-Pouvreau, V. Extraction and purification of phlorotannins from brown algae. Methods Mol. Biol. 2015, 1308, 131–143. [Google Scholar] [CrossRef] [PubMed]
- Agregán, R.; Munekata, P.E.; Domínguez, R.; Carballo, J.; Franco, D.; Lorenzo, J.M. Proximate composition, phenolic content and in vitro antioxidant activity of aqueous extracts of the seaweeds Ascophyllum nodosum, Bifurcaria bifurcata and Fucus vesiculosus. Effect of addition of the extracts on the oxidative stability of canola oil. Food Res. Int. 2017, 99, 986–994. [Google Scholar] [CrossRef]
- Heffernan, N.; Brunton, N.; FitzGerald, R.; Smyth, T. Profiling of the Molecular Weight and Structural Isomer Abundance of Macroalgae-Derived Phlorotannins. Mar. Drugs 2015, 13, 509–528. [Google Scholar] [CrossRef]
- Pinteus, S.; Silva, J.; Alves, C.; Horta, A.; Thomas, O.P.; Pedrosa, R. Antioxidant and cytoprotective activities of fucus spiralis seaweed on a human cell in vitro model. Int. J. Mol. Sci. 2017, 18, 292. [Google Scholar] [CrossRef] [PubMed] [Green Version]
- Jégou, C.; Kervarec, N.; Cérantola, S.; Bihannic, I.; Stiger-Pouvreau, V. NMR use to quantify phlorotannins: The case of Cystoseira tamariscifolia, a phloroglucinol-producing brown macroalga in Brittany (France). Talanta 2015, 135, 1–6. [Google Scholar] [CrossRef]
- Stiger, V.; Deslandes, E.; Payri, C.E. Phenolic contents of two brown algae, Turbinaria ornata and Sargassum mangarevense on Tahiti (French Polynesia): Interspecific, ontogenic and spatio-temporal variations. Bot. Mar. 2004, 47, 402–409. [Google Scholar] [CrossRef]
- Ragan, M.A.; Jensen, A. Quantitative studies on brown algae phenols. II. Seasonal Variation in polyphenol content of Ascophyllum nodosum (L.) Le Jol. and Fucus vesiculosus (L.). J. Exp. Mar. Biol. Ecol. 1978, 34, 245–258. [Google Scholar] [CrossRef]
- Catarino, M.D.; Silva, A.M.S.; Mateus, N.; Cardoso, S.M. Optimization of phlorotannins extraction from fucus vesiculosus and evaluation of their potential to prevent metabolic disorders. Mar. Drugs 2019, 17, 162. [Google Scholar] [CrossRef] [Green Version]
- Babbar, N.; Oberoi, H.S.; Sandhu, S.K.; Bhargav, V.K. Influence of different solvents in extraction of phenolic compounds from vegetable residues and their evaluation as natural sources of antioxidants. J. Food Sci. Technol. 2014, 51, 2568–2575. [Google Scholar] [CrossRef] [Green Version]
- Li, Y.; Fu, X.; Duan, D.; Liu, X.; Xu, J.; Gao, X. Extraction and Identification of Phlorotannins from the Brown Alga, Sargassum fusiforme (Harvey) Setchell. Mar. Drugs 2017, 15, 49. [Google Scholar] [CrossRef] [Green Version]
- Francisco, J.; Horta, A.; Pedrosa, R.; Afonso, C.; Cardoso, C.; Bandarra, N.M.; Gil, M.M. Bioacessibility of Antioxidants and Fatty Acids from Fucus Spiralis. Foods 2020, 9, 440. [Google Scholar] [CrossRef] [PubMed] [Green Version]
- Gager, L.; Connan, S.; Molla, M.; Couteau, C.; Arbona, J.F.; Coiffard, L.; Cérantola, S.; Stiger-Pouvreau, V. Active phlorotannins from seven brown seaweeds commercially harvested in Brittany (France) detected by 1H NMR and in vitro assays: Temporal variation and potential valorization in cosmetic applications. J. Appl. Phycol. 2020, 32, 2375–2386. [Google Scholar] [CrossRef]
- Ford, L.; Theodoridou, K.; Sheldrake, G.N.; Walsh, P.J. A critical review of analytical methods used for the chemical characterisation and quantification of phlorotannin compounds in brown seaweeds. Phytochem. Anal. 2019, 30, 587–599. [Google Scholar] [CrossRef]
- Koivikko, R.; Loponen, J.; Pihlaja, K.; Jormalainen, V. High-performance liquid chromatographic analysis of phlorotannins from the brown alga Fucus vesiculosus. Phytochem. Anal. 2007, 18, 326–332. [Google Scholar] [CrossRef] [PubMed]
- Olate-Gallegos, C.; Barriga, A.; Vergara, C.; Fredes, C.; García, P.; Giménez, B.; Robert, P. Identification of Polyphenols from Chilean Brown Seaweeds Extracts by LC-DAD-ESI-MS/MS. J. Aquat. Food Prod. Technol. 2019, 28, 375–391. [Google Scholar] [CrossRef]
- Steevensz, A.J.; MacKinnon, S.L.; Hankinson, R.; Craft, C.; Connan, S.; Stengel, D.B.; Melanson, J.E. Profiling phlorotannins in brown macroalgae by liquid chromatography-high resolution mass spectrometry. Phytochem. Anal. 2012, 23, 547–553. [Google Scholar] [CrossRef]
- Melanson, J.E.; Mackinnon, S.L. Characterization of phlorotannins from brown algae by LC-HRMS. Methods Mol. Biol. 2015, 1308, 253–266. [Google Scholar] [CrossRef] [PubMed]
- Wang, T.; Jónsdóttir, R.; Liu, H.; Gu, L.; Kristinsson, H.G.; Raghavan, S.; Ólafsdóttir, G. Antioxidant capacities of phlorotannins extracted from the brown algae Fucus vesiculosus. J. Agric. Food Chem. 2012, 60, 5874–5883. [Google Scholar] [CrossRef] [PubMed]
- Agregán, R.; Munekata, P.; Franco, D.; Carballo, J.; Barba, F.; Lorenzo, J. Antioxidant Potential of Extracts Obtained from Macro- (Ascophyllum nodosum, Fucus vesiculosus and Bifurcaria bifurcata) and Micro-Algae (Chlorella vulgaris and Spirulina platensis) Assisted by Ultrasound. Medicines 2018, 5, 33. [Google Scholar] [CrossRef] [PubMed] [Green Version]
- Tierney, M.S.; Soler-vila, A.; Croft, A.K.; Hayes, M. Antioxidant Activity of the Brown Macroalgae Fucus spiralis Linnaeus Harvested from the West Coast of Ireland. Curr. Res. J. Biol. Sci. 2013, 5, 81–90. [Google Scholar] [CrossRef]
- Hwang, T.-L.; Sung, P.-J.; Liaw, C.-C. Development and Application of Herbal Medicine from Marine Origin; MDPI: Basel, Switzerland, 2019; ISBN 3039212214. [Google Scholar]
- Liu, H.; Gu, L. Phlorotannins from brown algae (Fucus vesiculosus) inhibited the formation of advanced glycation endproducts by scavenging reactive carbonyls. J. Agric. Food Chem. 2012, 60, 1326–1334. [Google Scholar] [CrossRef]
- Wang, T.; Jónsdóttir, R.; Ólafsdóttir, G. Total phenolic compounds, radical scavenging and metal chelation of extracts from Icelandic seaweeds. Food Chem. 2009, 116, 240–248. [Google Scholar] [CrossRef]
- Yen, G.C.; Duh, P.D.; Tsai, H.L. Antioxidant and pro-oxidant properties of ascorbic acid and gallic acid. Food Chem. 2002, 79, 307–313. [Google Scholar] [CrossRef]
- Catarino, M.D.; Silva, A.M.S.; Cardoso, S.M. Fucaceae: A source of bioactive phlorotannins. Int. J. Mol. Sci. 2017, 18, 1327. [Google Scholar] [CrossRef] [PubMed] [Green Version]
- Rajauria, G.; Foley, B.; Abu-Ghannam, N. Identification and characterization of phenolic antioxidant compounds from brown Irish seaweed Himanthalia elongata using LC-DAD–ESI-MS/MS. Innov. Food Sci. Emerg. Technol. 2016, 37, 261–268. [Google Scholar] [CrossRef]
- Rodriguez-Jasso, R.M.; Mussatto, S.I.; Pastrana, L.; Aguilar, C.N.; Teixeira, J.A. Chemical composition and antioxidant activity of sulphated polysaccharides extracted from Fucus vesiculosus using different hydrothermal processes. Chem. Pap. 2014, 68, 203–209. [Google Scholar] [CrossRef] [Green Version]
- Fellah, F.; Louaileche, H.; Dehbi-Zebboudj, A.; Touati, N. Seasonal variations in the phenolic compound content and antioxidant activities of three selected species of seaweeds from Tiskerth islet, Bejaia, Algeria. J. Mater. Environ. Sci. 2017, 8, 4451–4456. [Google Scholar] [CrossRef]
- Mendes, M. Antioxidant Contents of Fucus vesiculosus L., in Response to Environmental Parameters. Master’s Dissertation, University of Algarve, Algarve, Portugal, 2017. Available online: http://hdl.handle.net/10400.1/10605 (accessed on 24 June 2021).
- Mancuso, F.; Messina, C.; Santulli, A.; Laudicella, V.; Giommi, C.; Sarà, G.; Airoldi, L. Influence of ambient temperature on the photosynthetic activity and phenolic content of the intertidal Cystoseira compressa along the Italian coastline. J. Appl. Phycol. 2019, 31, 3069–3076. [Google Scholar] [CrossRef]
- Berger, R.; Malm, T.; Kautsky, L. Two reproductive strategies in baltic Fucus vesiculosus (phaeophyceae). Eur. J. Phycol. 2001, 36, 265–273. [Google Scholar] [CrossRef]
- Vandanjon, L.; Maureen, D.; Maya, P.; Philippe, D.; Valarie, S.-P.; Gilles, B.; Nathalie, B. Seasonal Variation of Sargassum Muticum Biochemical Composition Determined by Fourier Transform Infra-Red Spectroscopy. J. Anal. Bioanal. Sep. Tech. 2017, 2, 75–84. [Google Scholar] [CrossRef]
- Coelho, S.; Rijstenbil, J.W.; Sousa-Pinto, I.; Brown, M.T. Cellular responses to elevated light levels in Fucus spiralis embryos during the first days after fertilization. Plant Cell Environ. 2001, 24, 801–810. [Google Scholar] [CrossRef]
- Cruces, E.; Rojas-Lillo, Y.; Ramirez-Kushel, E.; Atala, E.; López-Alarcón, C.; Lissi, E.; Gómez, I. Comparison of different techniques for the preservation and extraction of phlorotannins in the kelp Lessonia spicata (Phaeophyceae): Assays of DPPH, ORAC-PGR, and ORAC-FL as testing methods. J. Appl. Phycol. 2016, 28, 573–580. [Google Scholar] [CrossRef]
- Zar, J.H. Biostatistical Analysis, 5th ed.; Prentice Hall: Hoboken, NJ, USA, 2010. [Google Scholar]
- Finney, D.J. Probit Analysis, 3rd ed.; Cambridge University Press: Cambridge, UK, 1971. [Google Scholar]
- Dinno, A. Nonparametric pairwise multiple comparisons in independent groups using Dunn’s test. Stata J. 2015, 15, 292–300. [Google Scholar] [CrossRef] [Green Version]

| IC50 (µg/mL) | ||||
|---|---|---|---|---|
| Extract | Summer | Autumn | Winter | Spring |
| AA | 5.999 (5.195–6.928) | 3.881 (3.373–4.465) | 3.881 (3.373–4.465) | 3.881 (3.373–4.465) |
| Et80 | 56.19 (51.11–61.78) | 35.24 (31.62–39.28) | 61.73 (54.39–70.07) | 61.40 (54.69–68.93) |
| EA | 8.414 (7.964–8.890) | 4.486 (3.993–5.040) | 7.872 (7.215–8.588) | 4.450 (4.075–4.860) |
| AQ3 | 14.86 (12.93–17.08) | 27.92 (25.14–31.01) | 12.45 (11.40–13.59) | 59.87 (51.94–69.01) |
Publisher’s Note: MDPI stays neutral with regard to jurisdictional claims in published maps and institutional affiliations. |
© 2021 by the authors. Licensee MDPI, Basel, Switzerland. This article is an open access article distributed under the terms and conditions of the Creative Commons Attribution (CC BY) license (https://creativecommons.org/licenses/by/4.0/).
Share and Cite
Almeida, B.; Barroso, S.; Ferreira, A.S.D.; Adão, P.; Mendes, S.; Gil, M.M. Seasonal Evaluation of Phlorotannin-Enriched Extracts from Brown Macroalgae Fucus spiralis. Molecules 2021, 26, 4287. https://doi.org/10.3390/molecules26144287
Almeida B, Barroso S, Ferreira ASD, Adão P, Mendes S, Gil MM. Seasonal Evaluation of Phlorotannin-Enriched Extracts from Brown Macroalgae Fucus spiralis. Molecules. 2021; 26(14):4287. https://doi.org/10.3390/molecules26144287
Chicago/Turabian StyleAlmeida, Belén, Sónia Barroso, Ana S. D. Ferreira, Pedro Adão, Susana Mendes, and Maria M. Gil. 2021. "Seasonal Evaluation of Phlorotannin-Enriched Extracts from Brown Macroalgae Fucus spiralis" Molecules 26, no. 14: 4287. https://doi.org/10.3390/molecules26144287
APA StyleAlmeida, B., Barroso, S., Ferreira, A. S. D., Adão, P., Mendes, S., & Gil, M. M. (2021). Seasonal Evaluation of Phlorotannin-Enriched Extracts from Brown Macroalgae Fucus spiralis. Molecules, 26(14), 4287. https://doi.org/10.3390/molecules26144287