1. Introduction
Cadmium (Cd) is a relatively scarce heavy metal found in the earth’s crust and the inevitable product of the extraction of zinc, lead, and copper. In the environment, Cd only exists in one oxidation state (+2), dissolving easily in polluted waters with low pH levels and typically transported to freshwaters used for human consumption [
1,
2]. One of the main sources of Cd contamination is poorly treated domestic, industrial and agricultural wastewater which usually contains high concentrations of heavy metals [
1]. The concentrations of this element in wastewater have been reported to vary from 0 to 1000 mg/L, depending on the discharge source [
3]. This is a major environmental and health concern because the established maximum level of this pollutant according to the U.S. Environmental Protection Agency (US EPA) is 0.005 mg/L for drinking water [
4] and, according to the International Agency for Research on Cancer (IARC), Cd is linked to kidney damage, chronic renal failure, osteoporosis, and cancer, mainly due to its marked tendency for bioaccumulation [
1,
5,
6]. Thus, Cd traces must be effectively removed before the discharge of wastewater into the environment [
7,
8].
Several Cd removal methods have been studied and implemented on an industrial scale, including chemical precipitation [
3], solvent extraction [
9,
10], flocculation [
11], electrochemical treatment [
12], membrane filtration [
13] and adsorption. Among them, adsorption-based processes are considered simple, cost-effective, and sustainable alternatives for heavy metal removal. For this, some of the preferred adsorbents include different variations of activated carbon [
14], carbon nanotubes [
15,
16], various nanoparticles [
17,
18,
19,
20] and agricultural waste by-products such as rice husk, fly ash [
21], sunflower waste [
22,
23] and chitosan [
24,
25]. The attractiveness of these materials as adsorbents stems from the fact that they exhibit a high surface area, high adsorption capacity, mechanical stability, and ease of recovery. Despite their potential, many of these substrates show insufficient superficial active sites and their specificity towards the effective removal of metal ions is highly limited. To overcome this issue, recent nanotechnology approaches have provided novel surface modification routes to introduce functional groups that show a higher affinity for Cd chelation and consequently, are capable of considerably increasing the sorption capacity of these materials [
26,
27,
28]. The Hosain et al. study on magnetic nanoparticles cross-linked succinic anhydride reported a maximum removal efficiency of Cd from wastewater samples of 57.6% [
29] and Chen et al. [
30] a removal of 96% using functionalized Fe
3O
4 nanoparticles. For nanomaterials based on alumina (Al
2O
3), the maximum removal efficiencies reported are between 31% and 99% [
31,
32]. These, however, rarely include the recovery studies and toxicity analysis to determine the viability of using the related components on a larger scale.
Despite the ample number of emerging treatments, much work is still needed to ensure effective water treatment processes that are also economically feasible and sustainable in the long run. Hence, the purpose of this work is to evaluate the efficiency of nanocomposite materials as practical treatment options. In this work, two inorganic substrates, Al2O3 spheres and Fe3O4 nanoparticles (NPs) with four different surfaces modifications are proposed for Cd adsorption. Here, we evaluated the effect of pH, contact time, and substrate dose on Cd removal. Additionally, one of the adsorbents was analyzed for recyclability, as well as for the environmental repercussions of their use.
2. Results
The study of the removal of Cd from water was carried out using two distinct inorganic surfaces, commercial Al2O3 spheres of 600–800 µm diameter and produced Fe3O4 NPs. These substrates were selected as they both can be easily retrieved from liquid environments which makes them ideal materials for large scale heavy metal treatment processes. Additionally, different surface functionalizations were prepared to evaluate their effect on the Cd removal efficiency. The substrates were functionalized by silanization with two different organo-silane molecules, APTES and CAS, then further functionalized with L-Cysteine (Cys). The final evaluated substrates were the original materials and the adsorbents modified with CAS, CAS@Cys, APTES, and APTES@Cys. The adsorbent with the best recovery and removal results was then further evaluated at different pH values, contact time and adsorbent dose. Two kinetic and isotherm models of this adsorbent were also fitted to the obtained data.
2.1. Characteristics of the Adsorbents
2.1.1. Dynamic Light Scattering (DLS) of Fe3O4 NPs
The size distribution of the synthesized Fe
3O
4 NPs was measured using DLS.
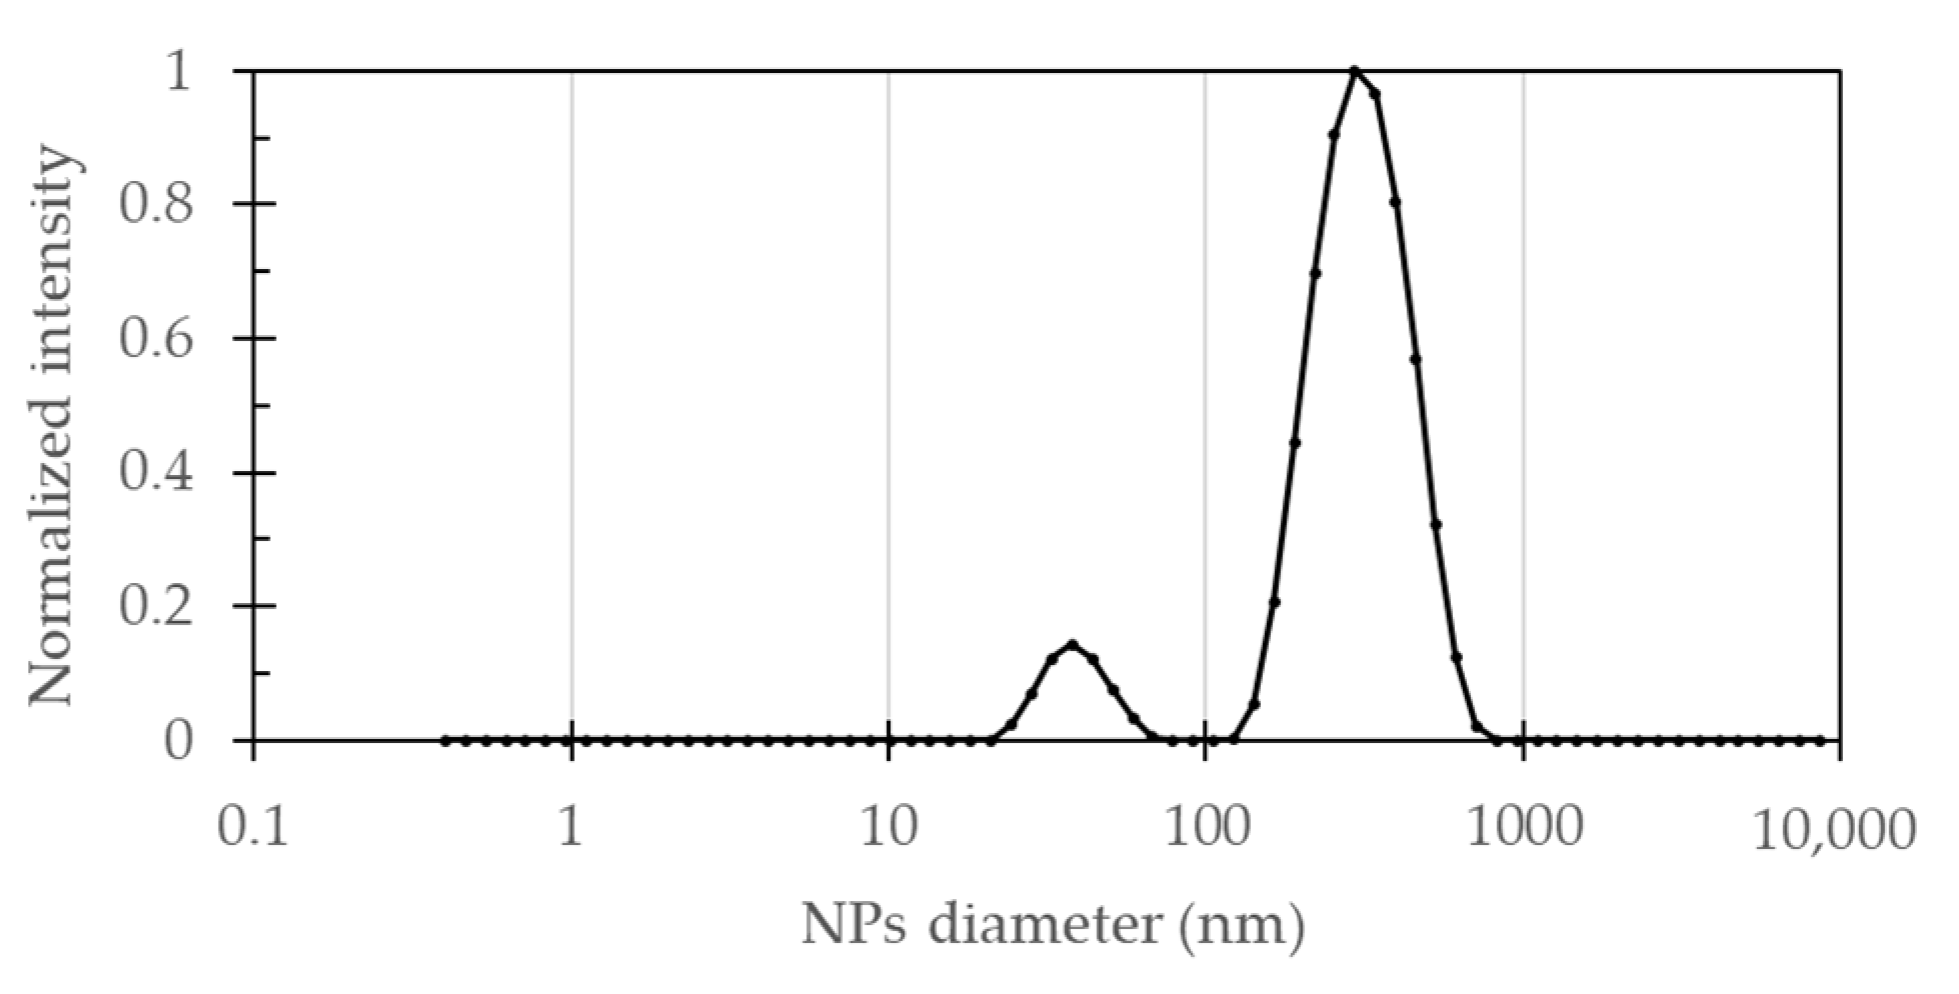
Figure 1 shows that the particle size distribution of bare Fe
3O
4 NPs solution presented two main peaks centered at 39.4 ± 9.1 nm (8.9%) and 323.6 ± 107.2 nm (91.1%). A polydispersity index (PDI) of 0.329 indicated that the synthesized particles exhibited uniform sizes. Most of the NPs exhibited a size somewhat larger than expected for this synthesis method, which was attributed to particle agglomeration processes. This can also be inferred from the standard deviation of largest peak that was significantly wider than expected for a monodisperse sample.
2.1.2. Focused Ion Beam-Scanning Electron Microscopy (FIB-SEM) with EDX Analysis
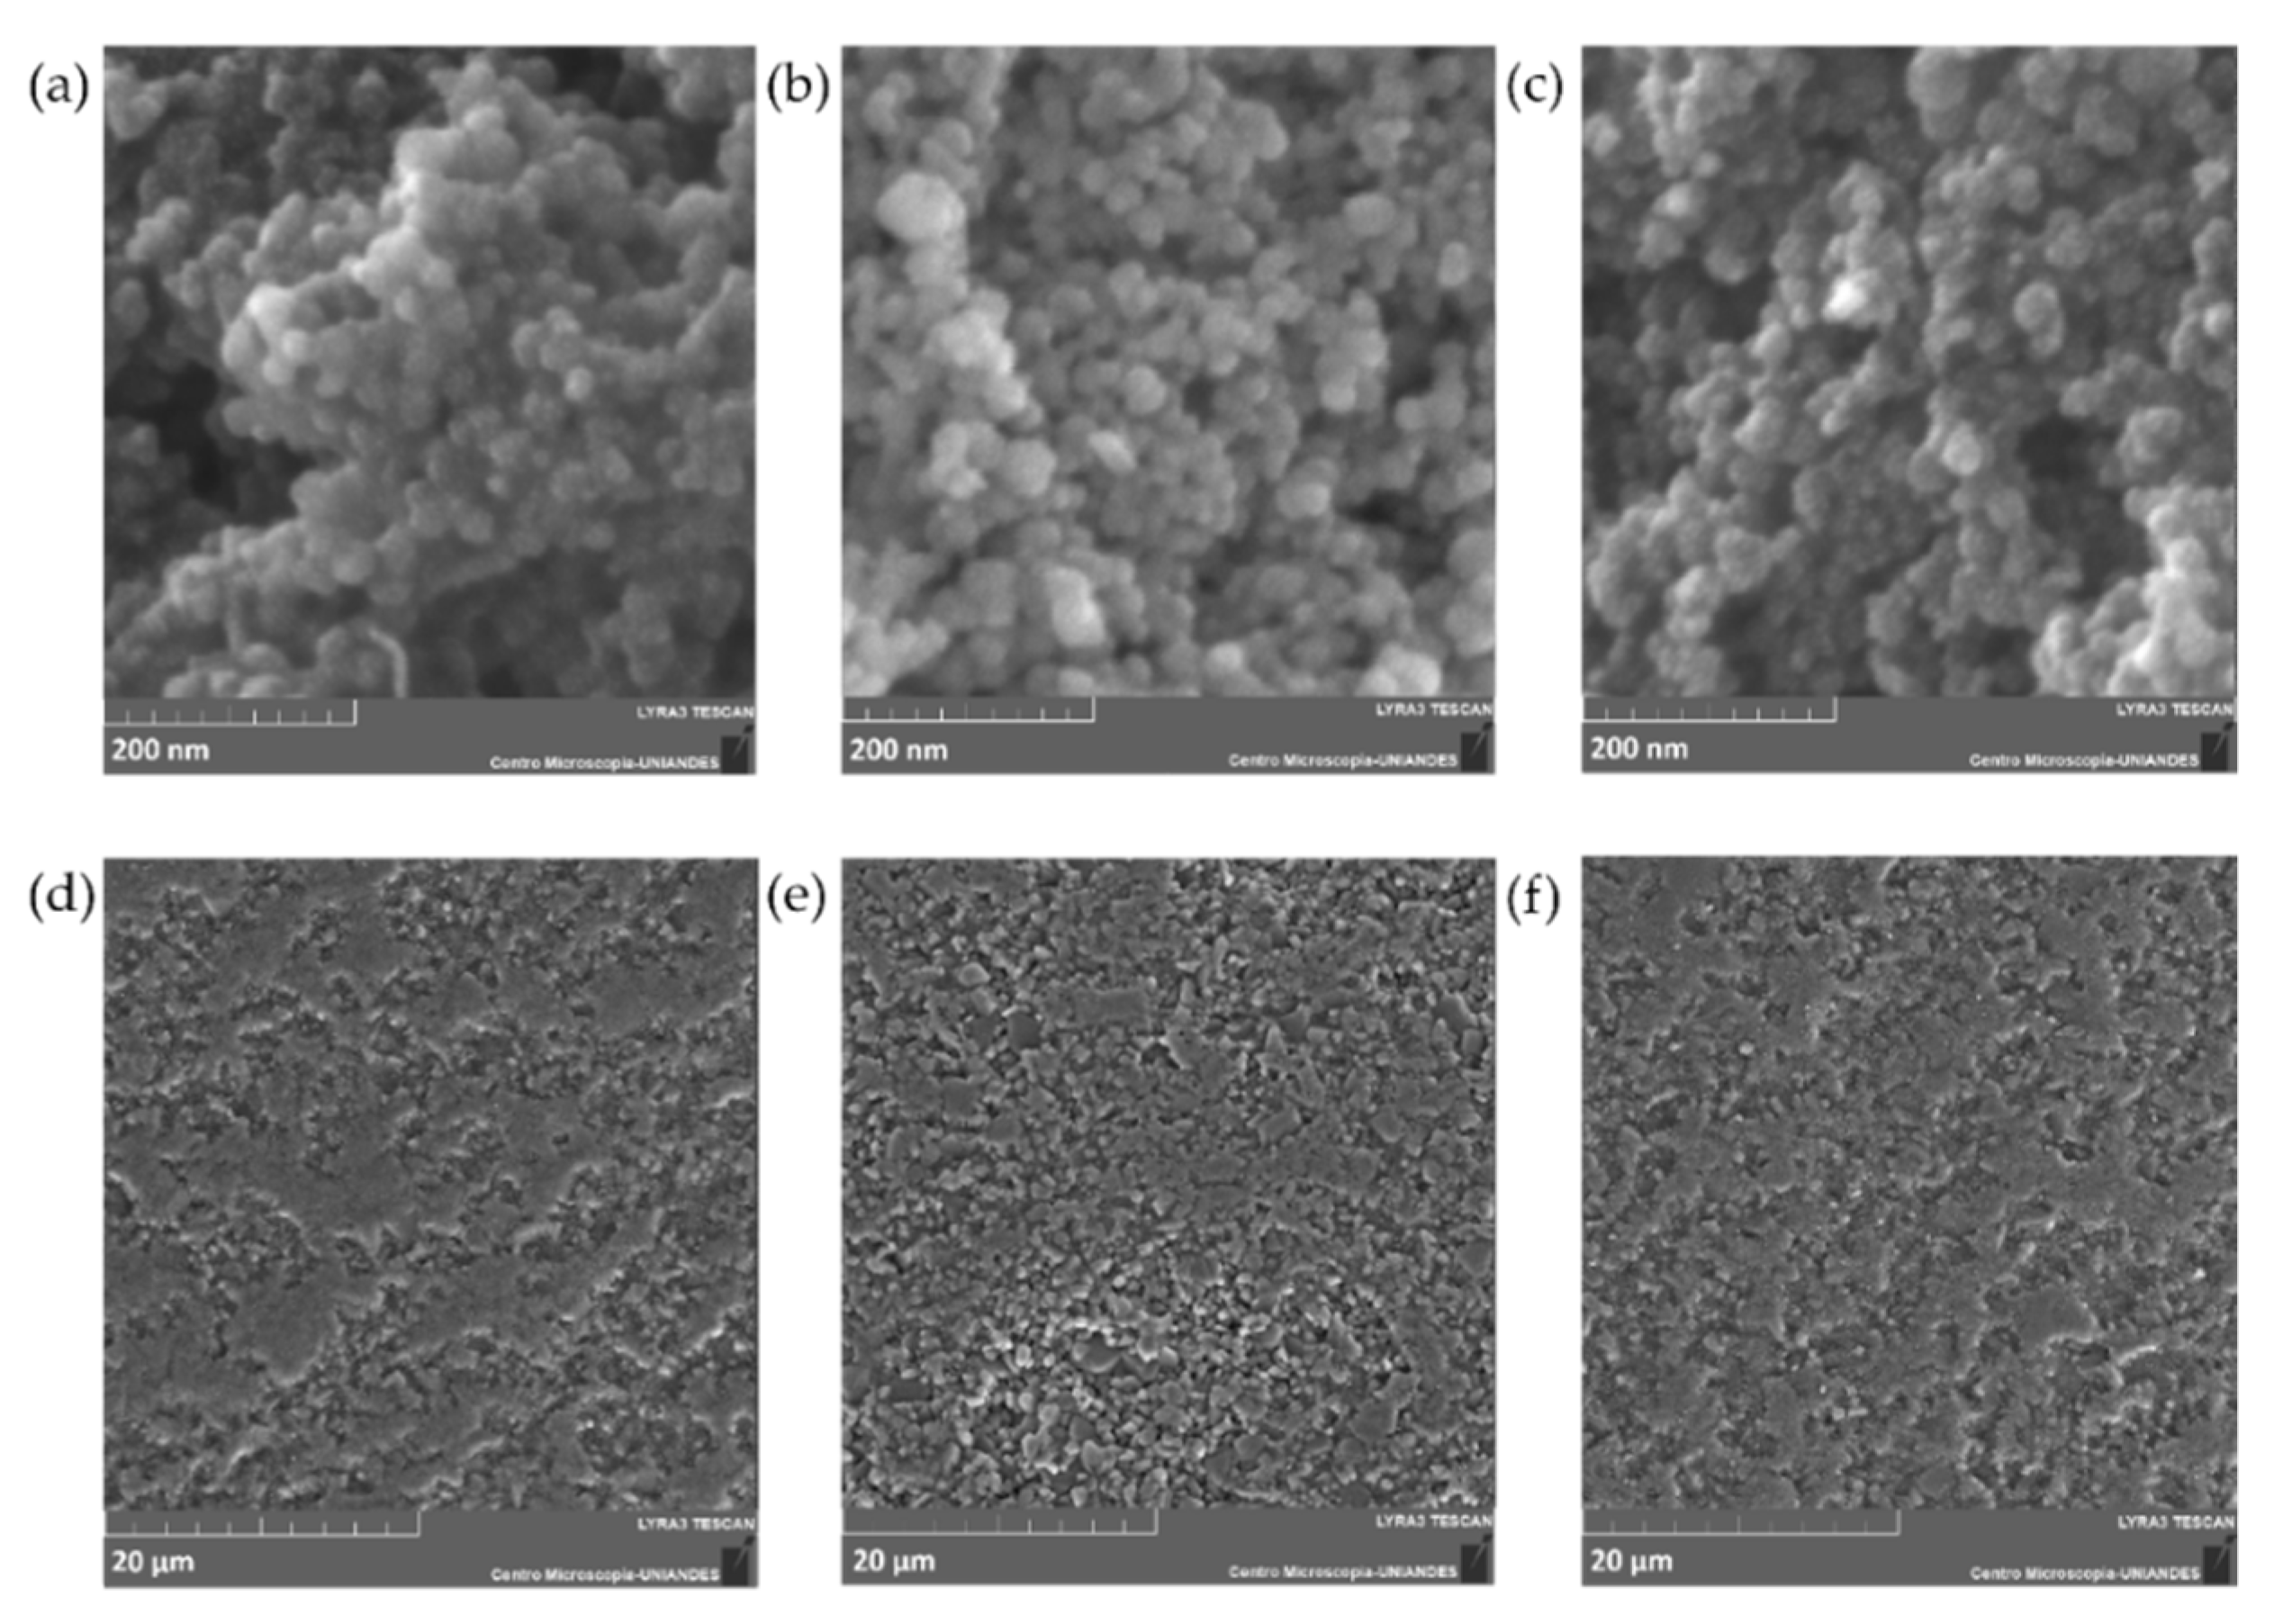
The morphology and size of the adsorbents before and after Cd removal experiments were studied via FIB-SEM.
Figure 2 shows the corresponding micrographs for the adsorbents prior and after modification with (3-Aminopropyl) triethoxysilane (APTES), and after Cd removal. The micrographs for the bare Fe
3O
4 NPs (
Figure 2a,b) show a typical spherical and monodispersed morphology, however, unfunctionalized particles appear to have higher agglomeration in contrast with the APTES-modified NPs (
Figure 2a–c). The mean size of bare Fe
3O
4 NPs is approximately 10–30 nm, which agrees with one of the peaks found with the DLS analysis. No apparent change in the NPs diameter was observed after Cd removal experiments.
Figure 2d–f show a rough surface for the 600–800 µm Al
2O
3 spheres, which is usually observed for high superficial area and superficially porous materials [
33,
34]. However, a closer inspection of the surface revealed a highly dense material with low porosity, which most likely indicates that the spheres have a much lower surface-active area for functionalization than the NPs counterparts.
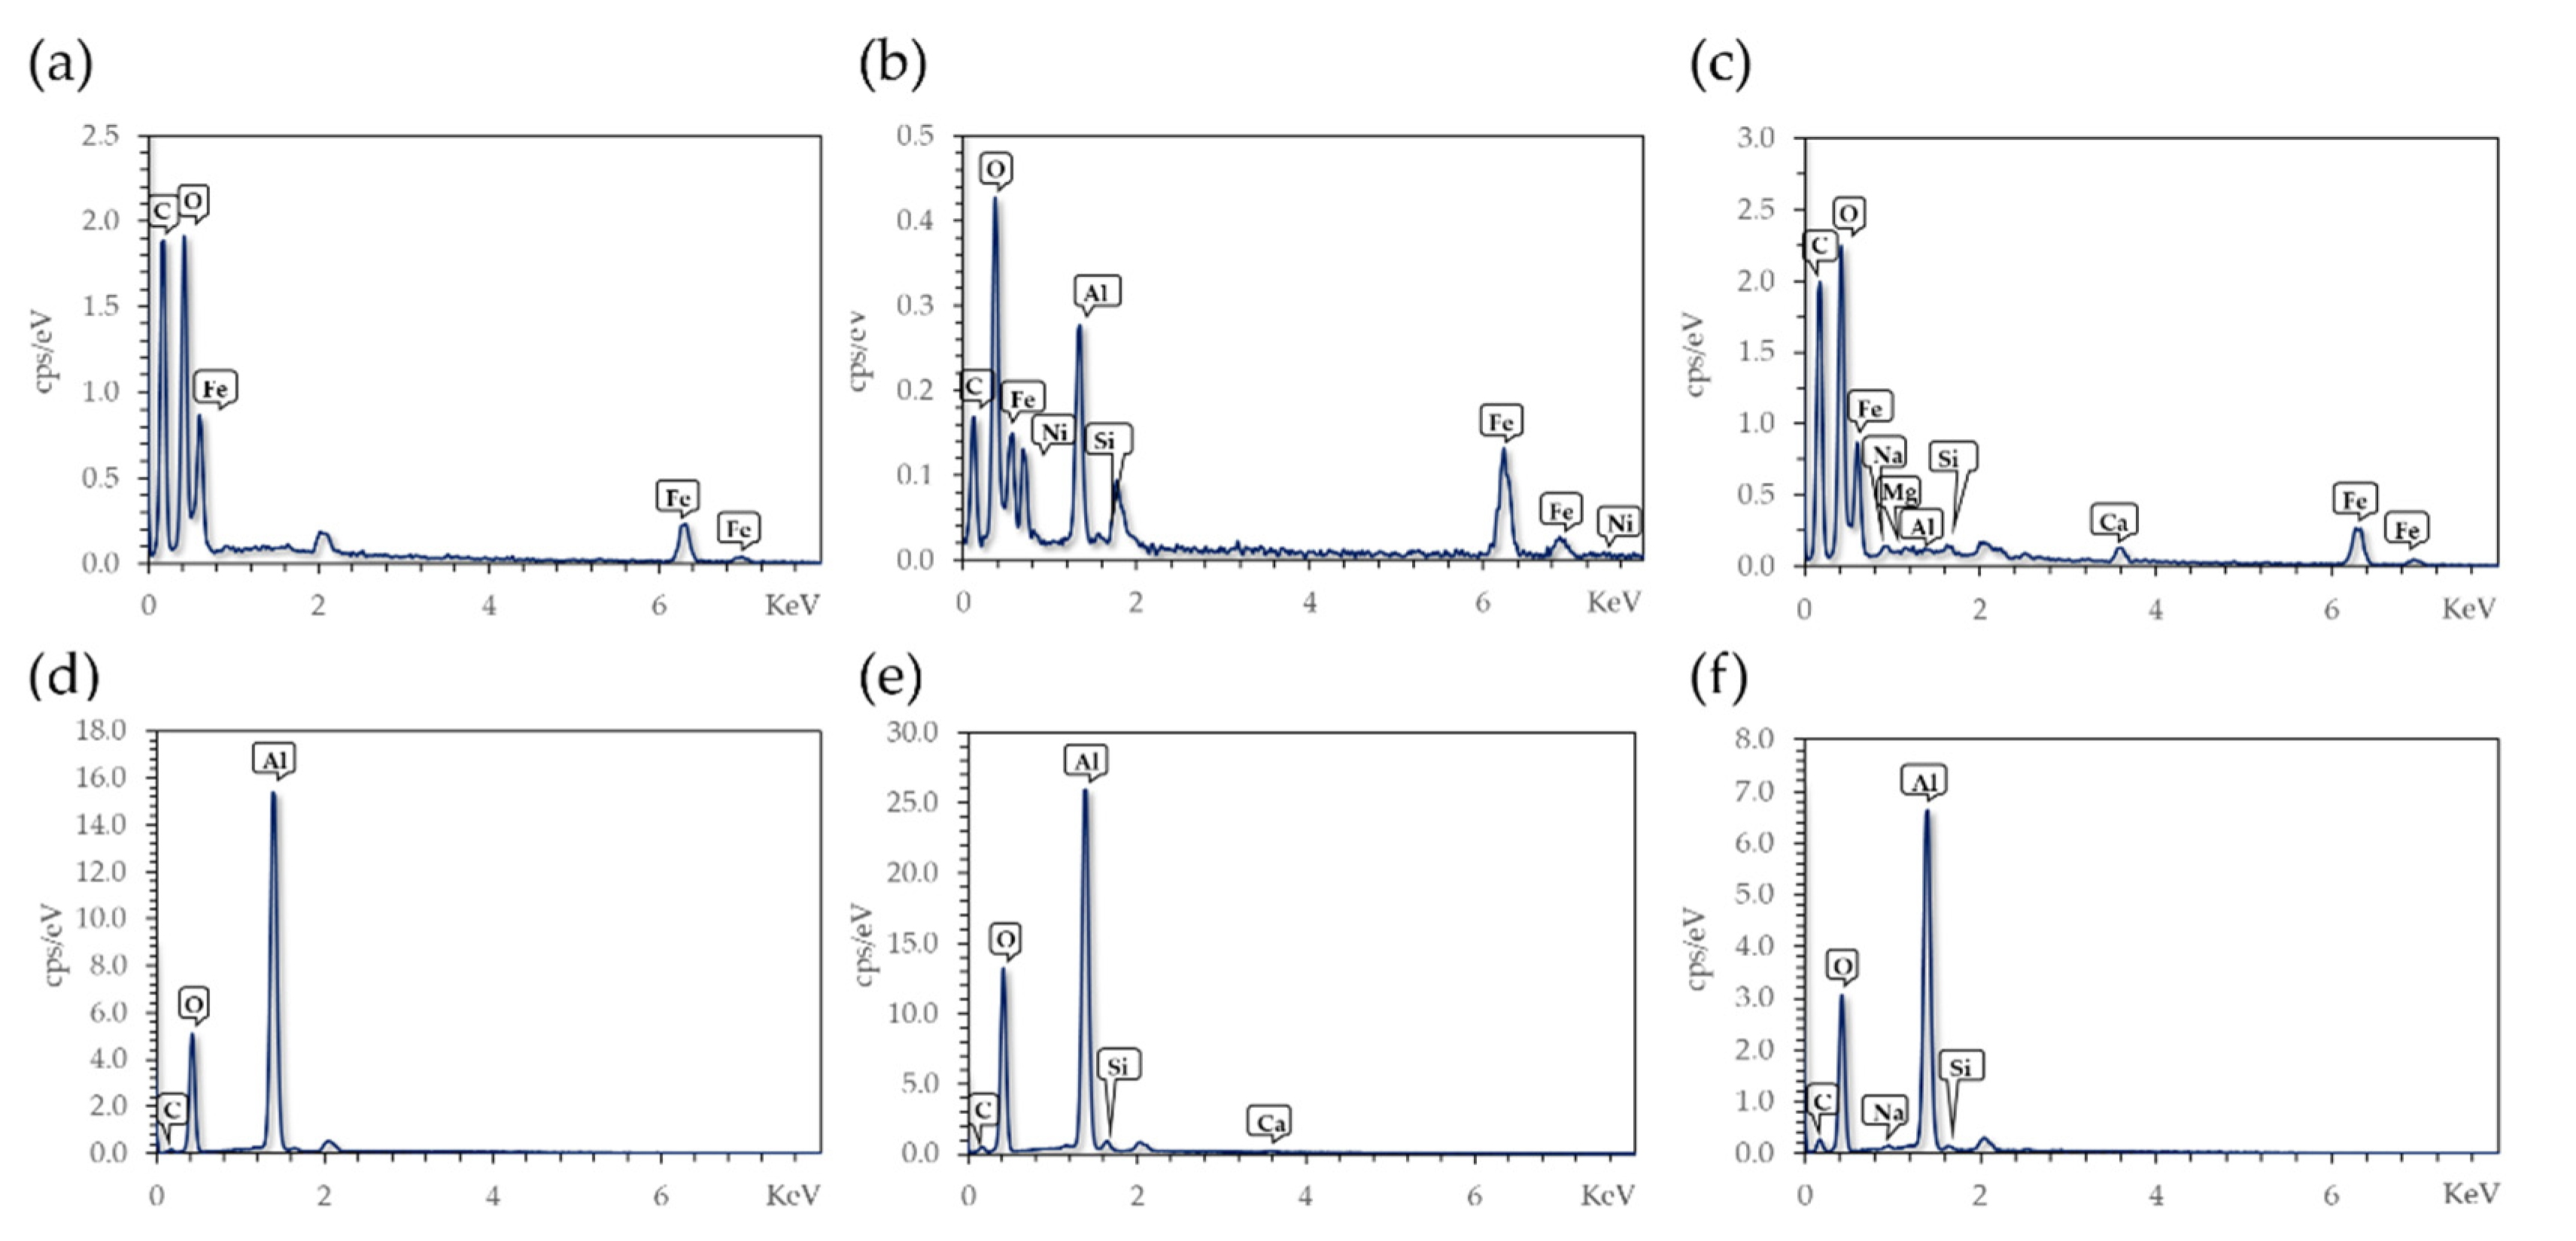
The EDX results shown in
Figure 3 confirmed the modification with the organo-silanes, APTES and 3-(triethoxysilyl) propylsuccinic anhydride (CAS) on Fe
3O
4 NPs and Al
2O
3 spheres. The presence of silicon (Si) in the spectrum after modification strongly indicates a correct functionalization with the organosilane molecules; however, in the case of Al
2O
3 spheres, the presence of Si is frequently related to initial traces of silicon on the material. However, in the control sample there was no evidence of a Si peak, which is why the Si in the modified material can be related to surface functionalization, not the original sample composition.
Samples after Cd treatment were also evaluated via EDX (
Figure 3c,f). There were no traces of Cd in any of the studied substrates. The initial concentration of Cd for the adsorption experiments was 0.1 mg/L, and consequently, the adsorbed amount by the materials was expected to be lower than 1% on weight basis. This poses a difficulty in the detection of adsorbed Cd, as the resolution of this method is inadequate for this limit.
2.1.3. Fourier Transform Infrared Spectroscopy (FTIR) Analysis
FTIR analysis was performed to corroborate the effective surface modifications for the Al
2O
3 spheres and Fe
3O
4 NPs.
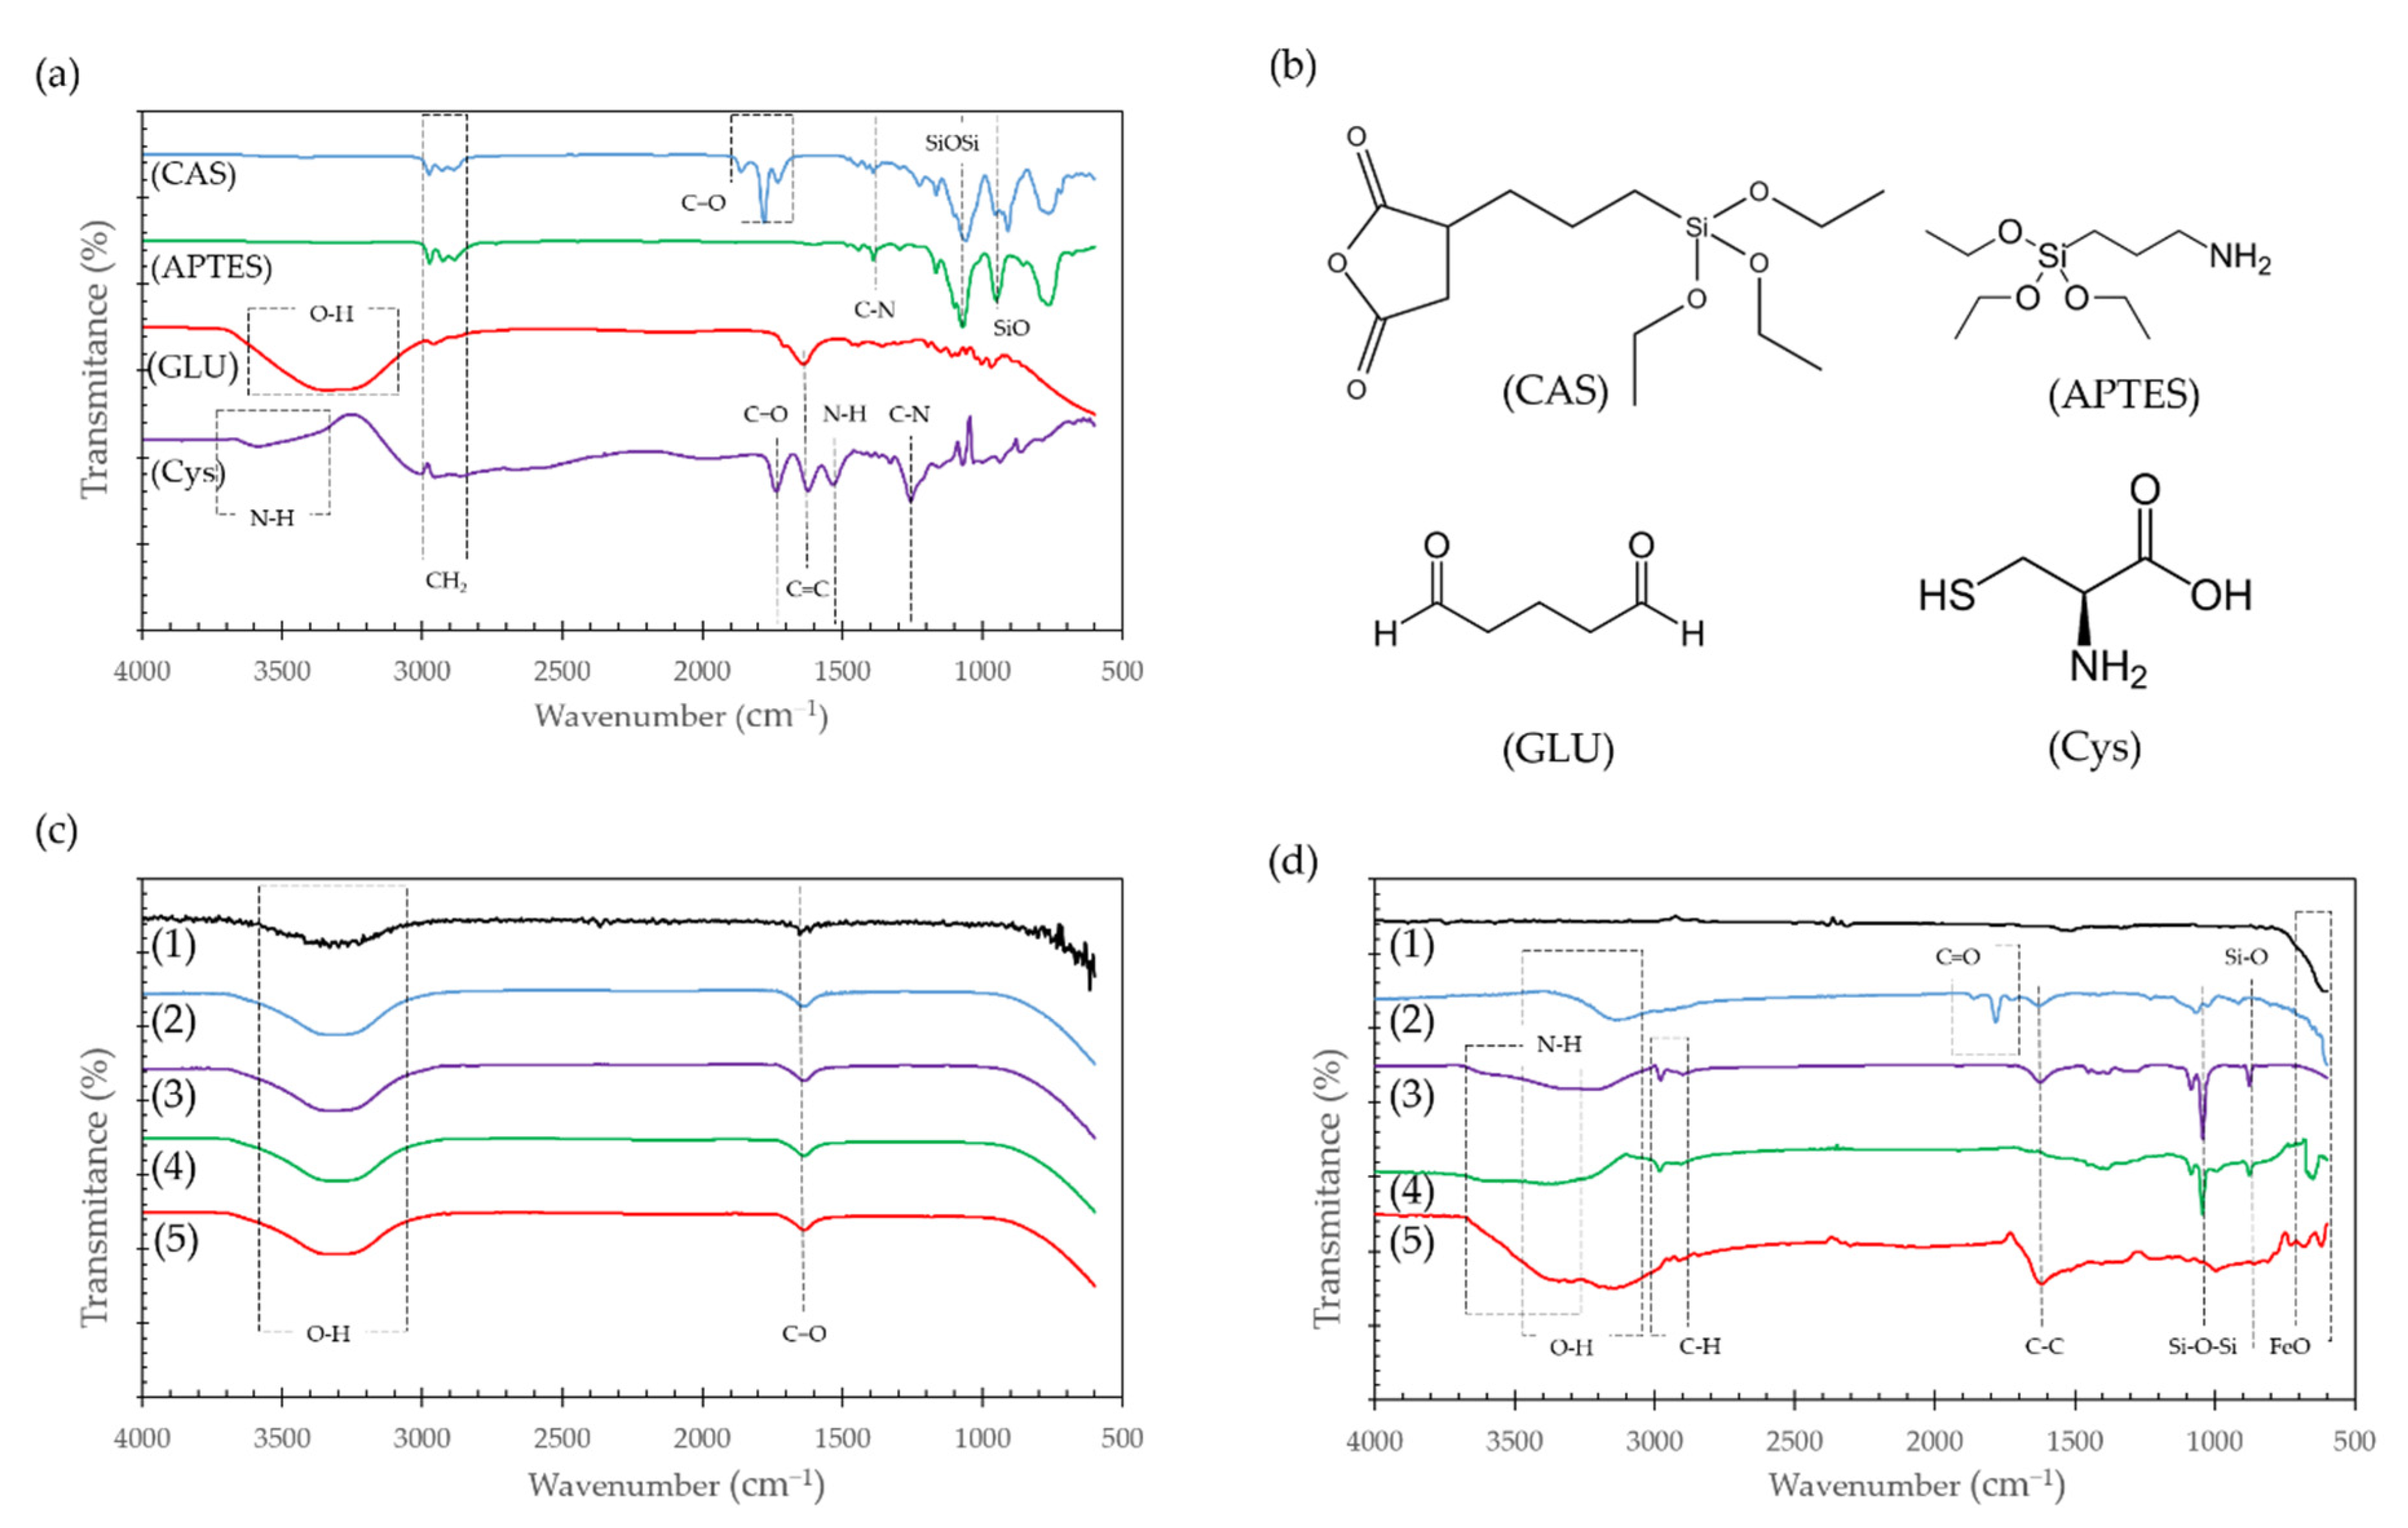
Figure 4a,b show the IR spectra and chemical structure of the pure molecules used for the surface modification, while
Figure 4c,d show the IR spectra of the substrates before and after their conjugation on the adsorbents.
The strong peaks near 1100 and 800 cm
−1 found in pure APTES and CAS spectra (
Figure 4a), are attributed to Si-O-Si and Si-O stretching vibrations, respectively [
35,
36]. These bands were also found in the modified Fe
3O
4 NPs as shown in
Figure 4d and provided further evidence of the correct silanization of the surface. Peaks around 1800 cm
−1 in pure CAS (
Figure 4a) are due to C=O stretching of the anhydride group, that can also be seen on Fe
3O
4 NPs modified with CAS in
Figure 4d. After the second modification with Cys to form the Fe
3O
4 NPs@CAS@Cys nanocompounds, these bands disappear when the anhydride group opens to covalently bind the Cys. In contrast, none of the modifications of Al
2O
3 spheres with the organo-silanes was confirmed by this method as the corresponding bands were absent in the spectra (
Figure 4c).
A broad peak at around 3500–3000 cm
−1 can be related to the O-H stretching vibration of the carboxyl group and the strong peaks close to 1620 cm
−1 to the strong stretching vibration of C=C, which can also be found in the modified Fe
3O
4 NPs (
Figure 4d). Of particular interest is the N-H stretching vibration present in APTES and Cys because it can be associated with the free amine groups of both molecules that have been thought to improve Cd adsorption.
Figure 4d exhibited a broad absorption band at around 3200–3600 cm
−1, which can also be attributed to the free amine groups after conjugation of both molecules on the Fe
3O
4 NPs.
Bare Fe
3O
4 NPs in
Figure 4d exhibited adsorption bands at around 700–600 cm
−1, which can be attributed to the stretching vibration of the Fe-O bond of iron oxide [
37]. The study of Al
2O
3 spheres with FTIR failed to show immobilization of any compound and only showed the C=O and O=H peaks related to surface oxidation, element traces or environmental H
2O (
Figure 4c).
Weak bands at 3000–2700 cm
−1 in the modified Fe
3O
4 NPs spectra (
Figure 4d) were related to the C-H stretching vibration that can be also found in pure APTES, CAS and Cys (
Figure 4a). In the particular case of Cys, this band could be also related to the stretching vibration of the S-H group [
38].
2.2. Effect of Surface Functionalization on Cd Removal
The removal of Cd using the two inorganic surfaces with and without surface modifications was carried out in batch experiments at a 0.1 mg/L concentration of Cd in water. This experiment was intended to evaluate whether a particular surface modification showed a higher affinity for Cd in aqueous solution. The adsorption of the heavy metals is highly related to the properties of the adsorbent and the type of Cd ions species present in solution [
18].
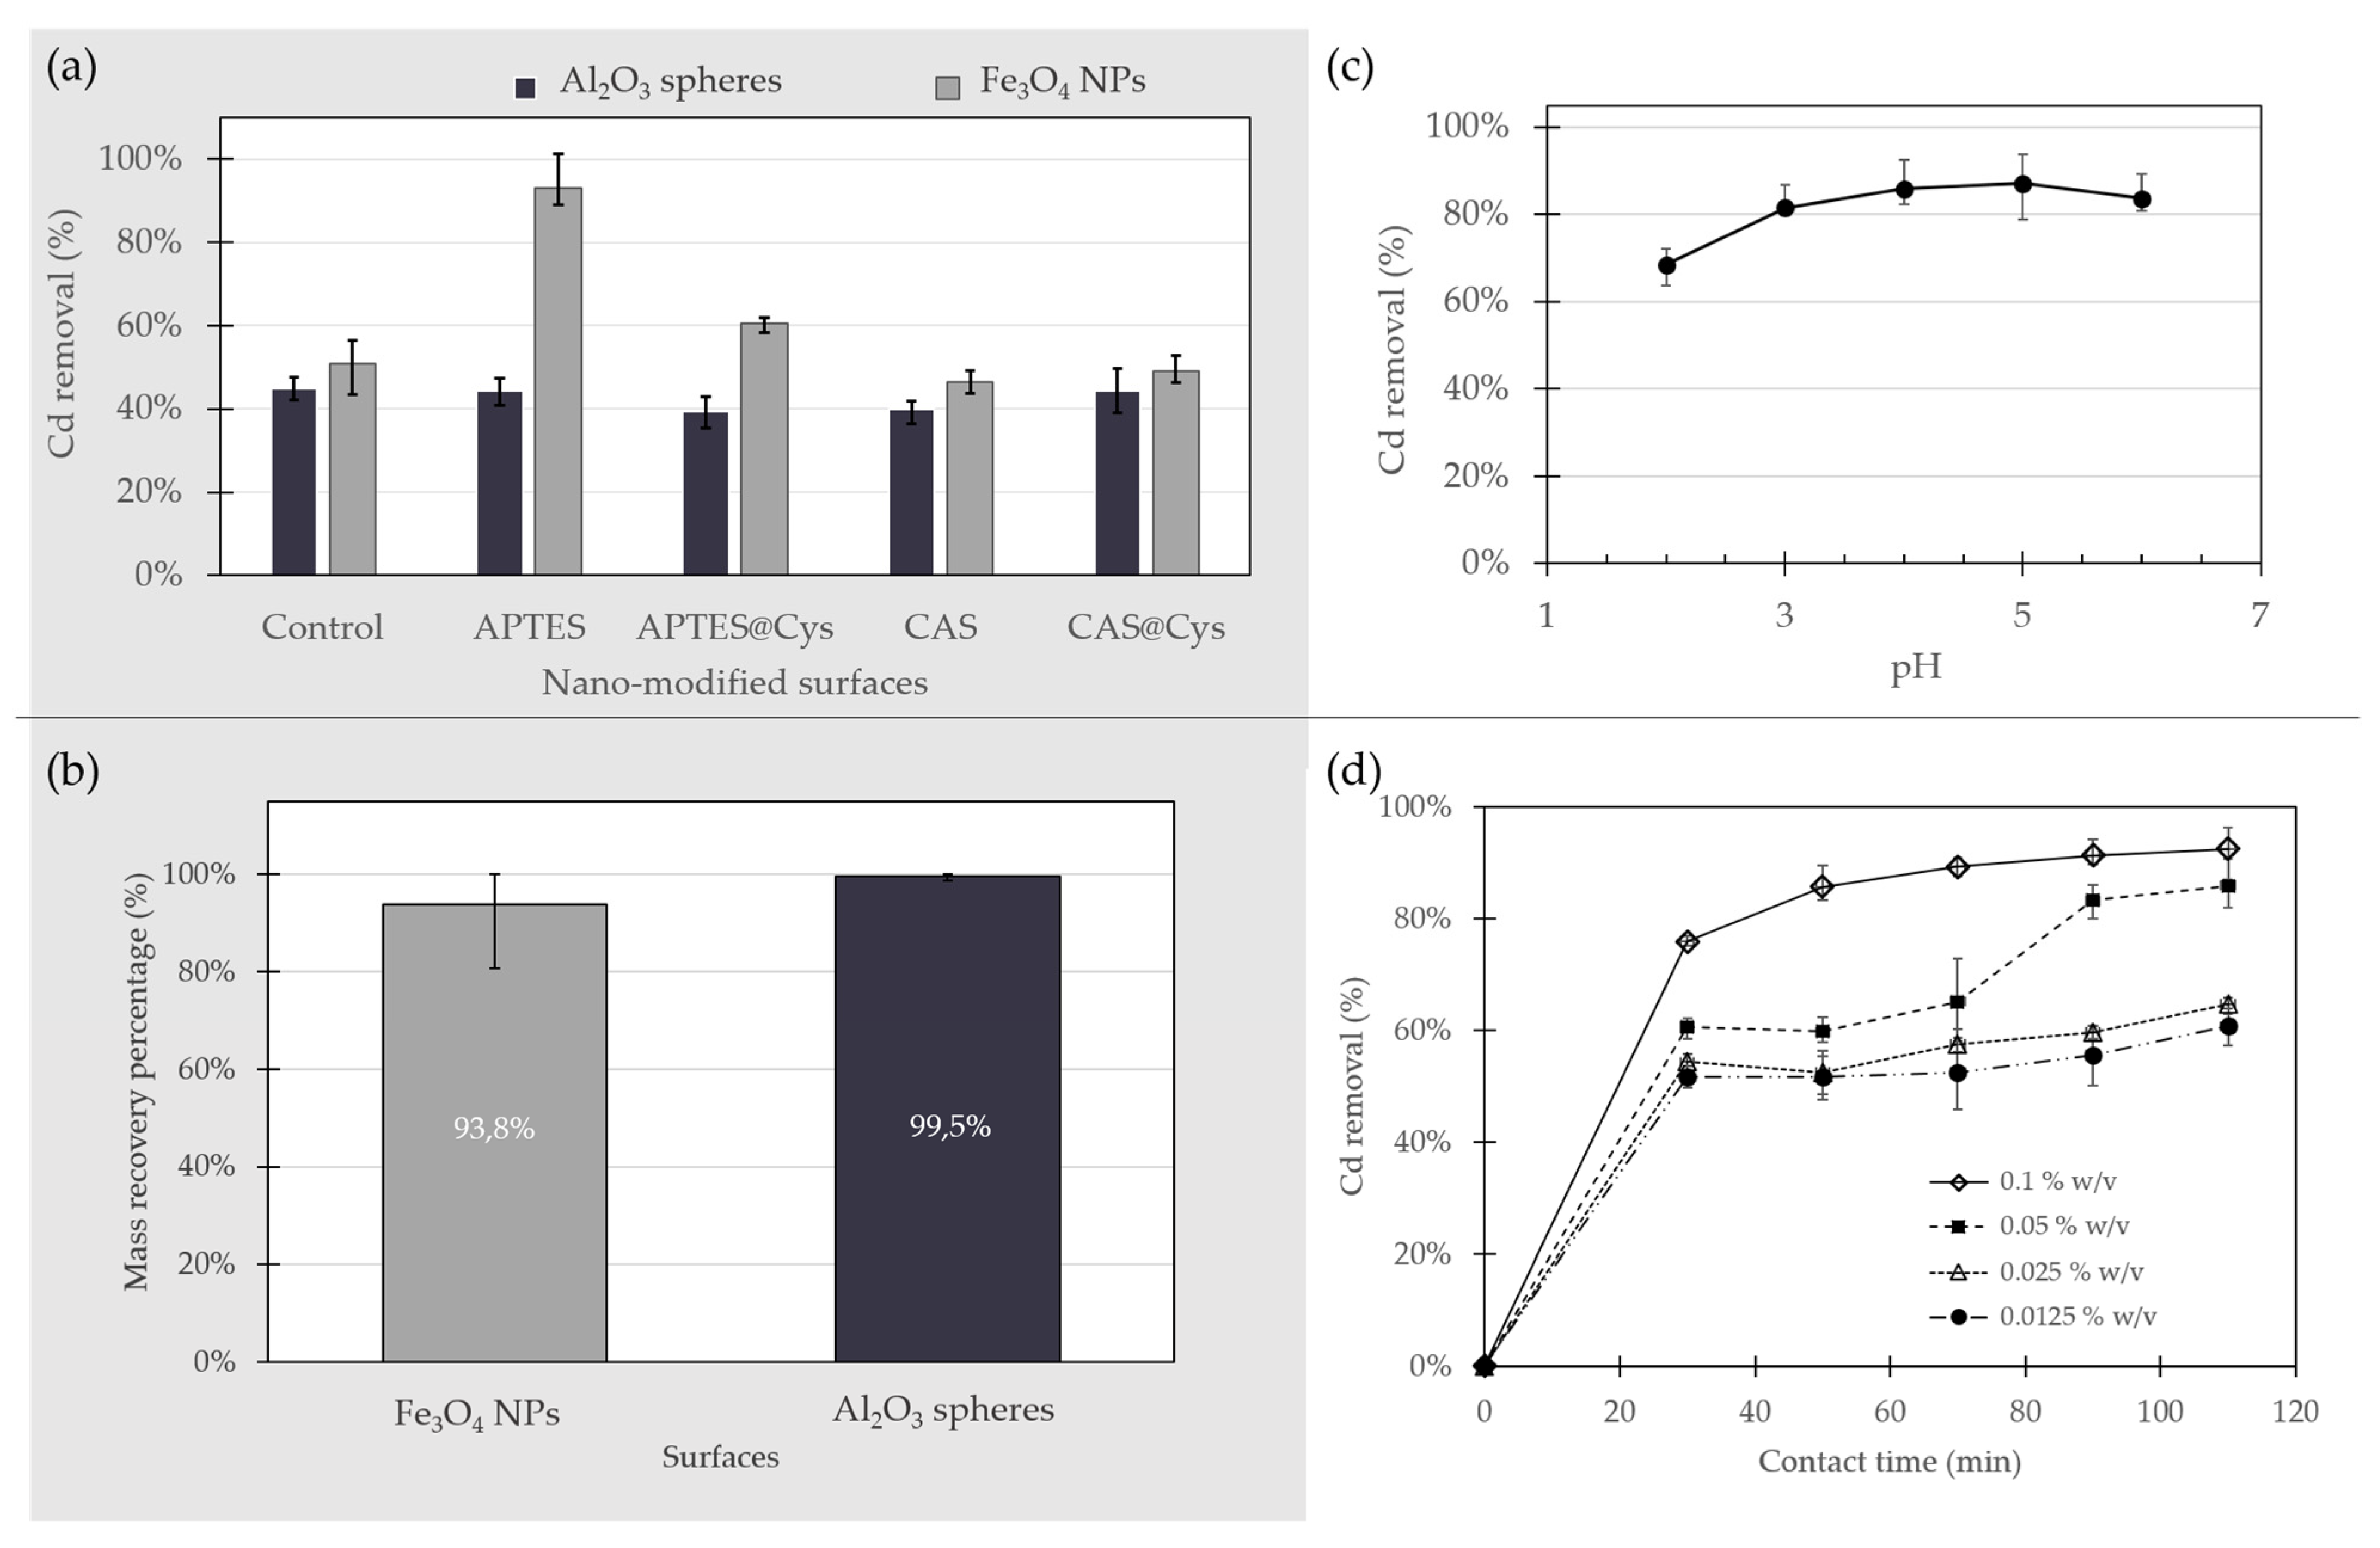
Figure 5a shows the removal efficiency of Cd by each adsorbent. The removal efficiencies of the control substrates without any surface modifications were below 51% in all cases. The best results for both functionalized and bare substrates were obtained for Fe
3O
4 NPs. The highest percentage of Cd removal of all the adsorbents was attained with Fe
3O
4 NPs functionalized with APTES, where Cd removal from aqueous solutions reached 94%.
Al
2O
3 spheres presented low removal efficiencies even after surface modification (
Figure 5a). Bare Al
2O
3 spheres showed a Cd removal percentage of 44.7%, which was higher than any of the modified alumina spheres studied as evidenced by removal efficiencies as low as 39.4%. These results were expected, considering that the FTIR results showed no evidence of surface functionalization for Al
2O
3. Moreover, this substrate exhibited a highly irregular surface with low porosity and therefore lower superficial area for adsorption. As reported elsewhere, a nanoparticulated version of Al
2O
3 has already shown significant potential as an adsorbent for heavy metal removal from water [
39,
40], however, they are different in size, superficial area, and available active sites compared with the bulk counterpart used here. There are alternative possibilities for improving the functionalization by pre-activating the surface via hydrolyzation, spraying of the modifying agents, or by thermal treatments [
41], however, these methodologies were not considered in this work.
There is marked interest from the scientific community in this magnetic nanoadsorbent for its unique properties, such as large surface area, low toxicity, high biocompatibility and simple separation and recovery from aqueous solutions with the aid of relatively low magnetic fields [
18,
36]. Unmodified Fe
3O
4 NPs showed a Cd removal efficiency of 50.8% (
Figure 5a) similar to the 57.6% reported by Hosain et al. [
29] for Fe
3O
4 NPs coated with nanochitosan but lower than the 96% reported by Chen et al. [
30], using functionalized Fe
3O
4 nanoparticles with APTES. This suggests that their intrinsic ability for Cd removal could also be improved by increasing the affinity of the surface for the Cd ions. The already active surface of Fe
3O
4 NPs displays a significant number of hydroxyl groups, thereby it allows an effective functionalization with the organo-silanes to eventually improve the NPs’ capacity to bind Cd. In general, the Cd binding capacity of modified Fe
3O
4 NPs largely depends on the type of surface modification. The Fe
3O
4 NPs modified with APTES showed an improved Cd removal percentage, which is in contrast with CAS functionalization where a reduction was observed. The highest efficiency was 93.2% in ~18 h of exposure for Fe
3O
4 NPs @APTES, which is clearly superior to that achieved with other functionalized NPs.
2.3. Substrate Recovery from Water
An ideal adsorbent should not only have a high adsorption capacity but induce reduced environmental impact. Here, we studied whether the adsorbents can be recovered from the treatment solutions after Cd removal to assess their potential reusability. We also wanted to evaluate if discharging back the recovered adsorbents to the environment might lead to possible environmental impacts. The Fe
3O
4 NPs were recovered by magnetic means while the Al
2O
3 spheres were filtered out from the solutions with a 500 µm pore size metallic filter.
Figure 5b shows the mass percentage recovered after Cd removal tests for Fe
3O
4 NPs and Al
2O
3 spheres. Even though Al
2O
3 had the lowest capacity for Cd removal, they were effectively recovered from the solutions after their use. Al
2O
3 spheres showed the highest mass recovery of 99.5% in comparison with the 93.8% of the magnetic nanoparticles. However, considering the Cd removal results, Fe
3O
4 NPs @APTES was selected as the best material for Cd removal and was further used for additional tests and characterizations. The possible environmental effect of the approximately 6.2% of the non-recovered adsorbent was also evaluated.
2.4. Effect of Solution pH on Cd Removal
The removal of Cd using Fe
3O
4 NPs @APTES was studied for pH values in the range of 2.0–6.0 in experiments that lasted for 18 h. The type of ionized Cd species in solution is one of the most relevant parameters for effective adsorption. As reported by Jain et al. [
23], Cd
2+ is predominant in deionized water if the pH of the aqueous solution is lower than 7.0, and a subsequent increase in pH causes its precipitation as Cd(OH)
2 [
42].
The Cd removal efficiencies of the adsorbent at different pH values are shown in
Figure 5c. Lower Cd removal percentages for Fe
3O
4 NPs @APTES were obtained at low pH values, which suggests that H
+ ions in the aqueous solution are most likely bound to some of binding sites available on the material. Our results show a trend where cadmium removal increased as a function of pH. An increase in pH slightly improved Cd adsorption from 68.5% to 87.2% and reached a maximum at pH 5.0. For this reason, all the remaining experiments were carried out at this pH value. The decreased Cd capture above pH 6.0 could be related to precipitation Cd ions as Cd(OH)
2.
2.5. Effect of Contact Time and Adsorbent Dose on Cd Removal
Adsorption time is important for understanding the adsorption mechanisms of the adsorbate. The effect of time on adsorption of Cd by Fe
3O
4 NPs @APTES is presented in
Figure 5d. The percentage of Cd removal was evaluated for 110 min with four different doses of adsorbent, ranging from 0.0125% (
w/
v) to 0.1% (
w/
v). The removal of Cd increased rapidly in the first 30 min of exposure. The difference in concentration of Cd ions in the solution and the nanoparticles resulted in the fast diffusion of the element to the surface of the absorbent. This was followed by a regime of decreased adsorption for all the different studied doses of Fe
3O
4 NPs @APTES. For this adsorbent, a further increase in contact time had no significant effect on Cd removal after 90 min. The already occupied active sites in the adsorbent surface are charged positively by Cd and repel the free ions in the solution, thereby decreasing the adsorption rate. Cadmium removal at equilibrium increased as the adsorbent dose increased, most likely due to exposure to a higher superficial area with available binding sites for Cd ions [
18,
22]. The time evolution of adsorption was similar for almost all studied doses with the exception of 0.05% (
w/
v). Cd removal reached maxima in the range of 60.7% to 92.5% after 110 min, corresponding to removal ratios ranging from 0.49 to 0.09 mg of Cd per g of NPs, respectively.
2.6. Adsorption Isotherms
To investigate further the adsorption behavior of Fe3O4 NPs @APTES, we fitted the adsorption data to the widely used Langmuir and Freundlich models.
The Langmuir model is frequently used to describe the deposition of a complete monolayer of the metal on the surface of the material via adsorption processes. This model assumes that the Cd ions are adsorbed by forming a homogeneous monolayer on the active sites in the surfaces of the adsorbent and there are no interactions between the adsorbed ions [
32]. This is described by Equation (1) [
43,
44]:
where
is the concentration of adsorbate in the solution at equilibrium;
is the adsorption capacity at equilibrium of the adsorbent surface;
is the Langmuir isotherm constant and
is the monolayer capacity of the adsorbent. According to this equation, the plot of
vs.
should be a straight line with slope
and intercept
. The Langmuir isotherm can be also expressed in terms of the dimensionless factor
, which is defined by Equation (2) [
45]:
The dominant adsorption mechanism can be deduced from the
values, it can be either unfavorable
, linear
, favorable
or irreversible
. Fe
3O
4 NPs adsorption yield a
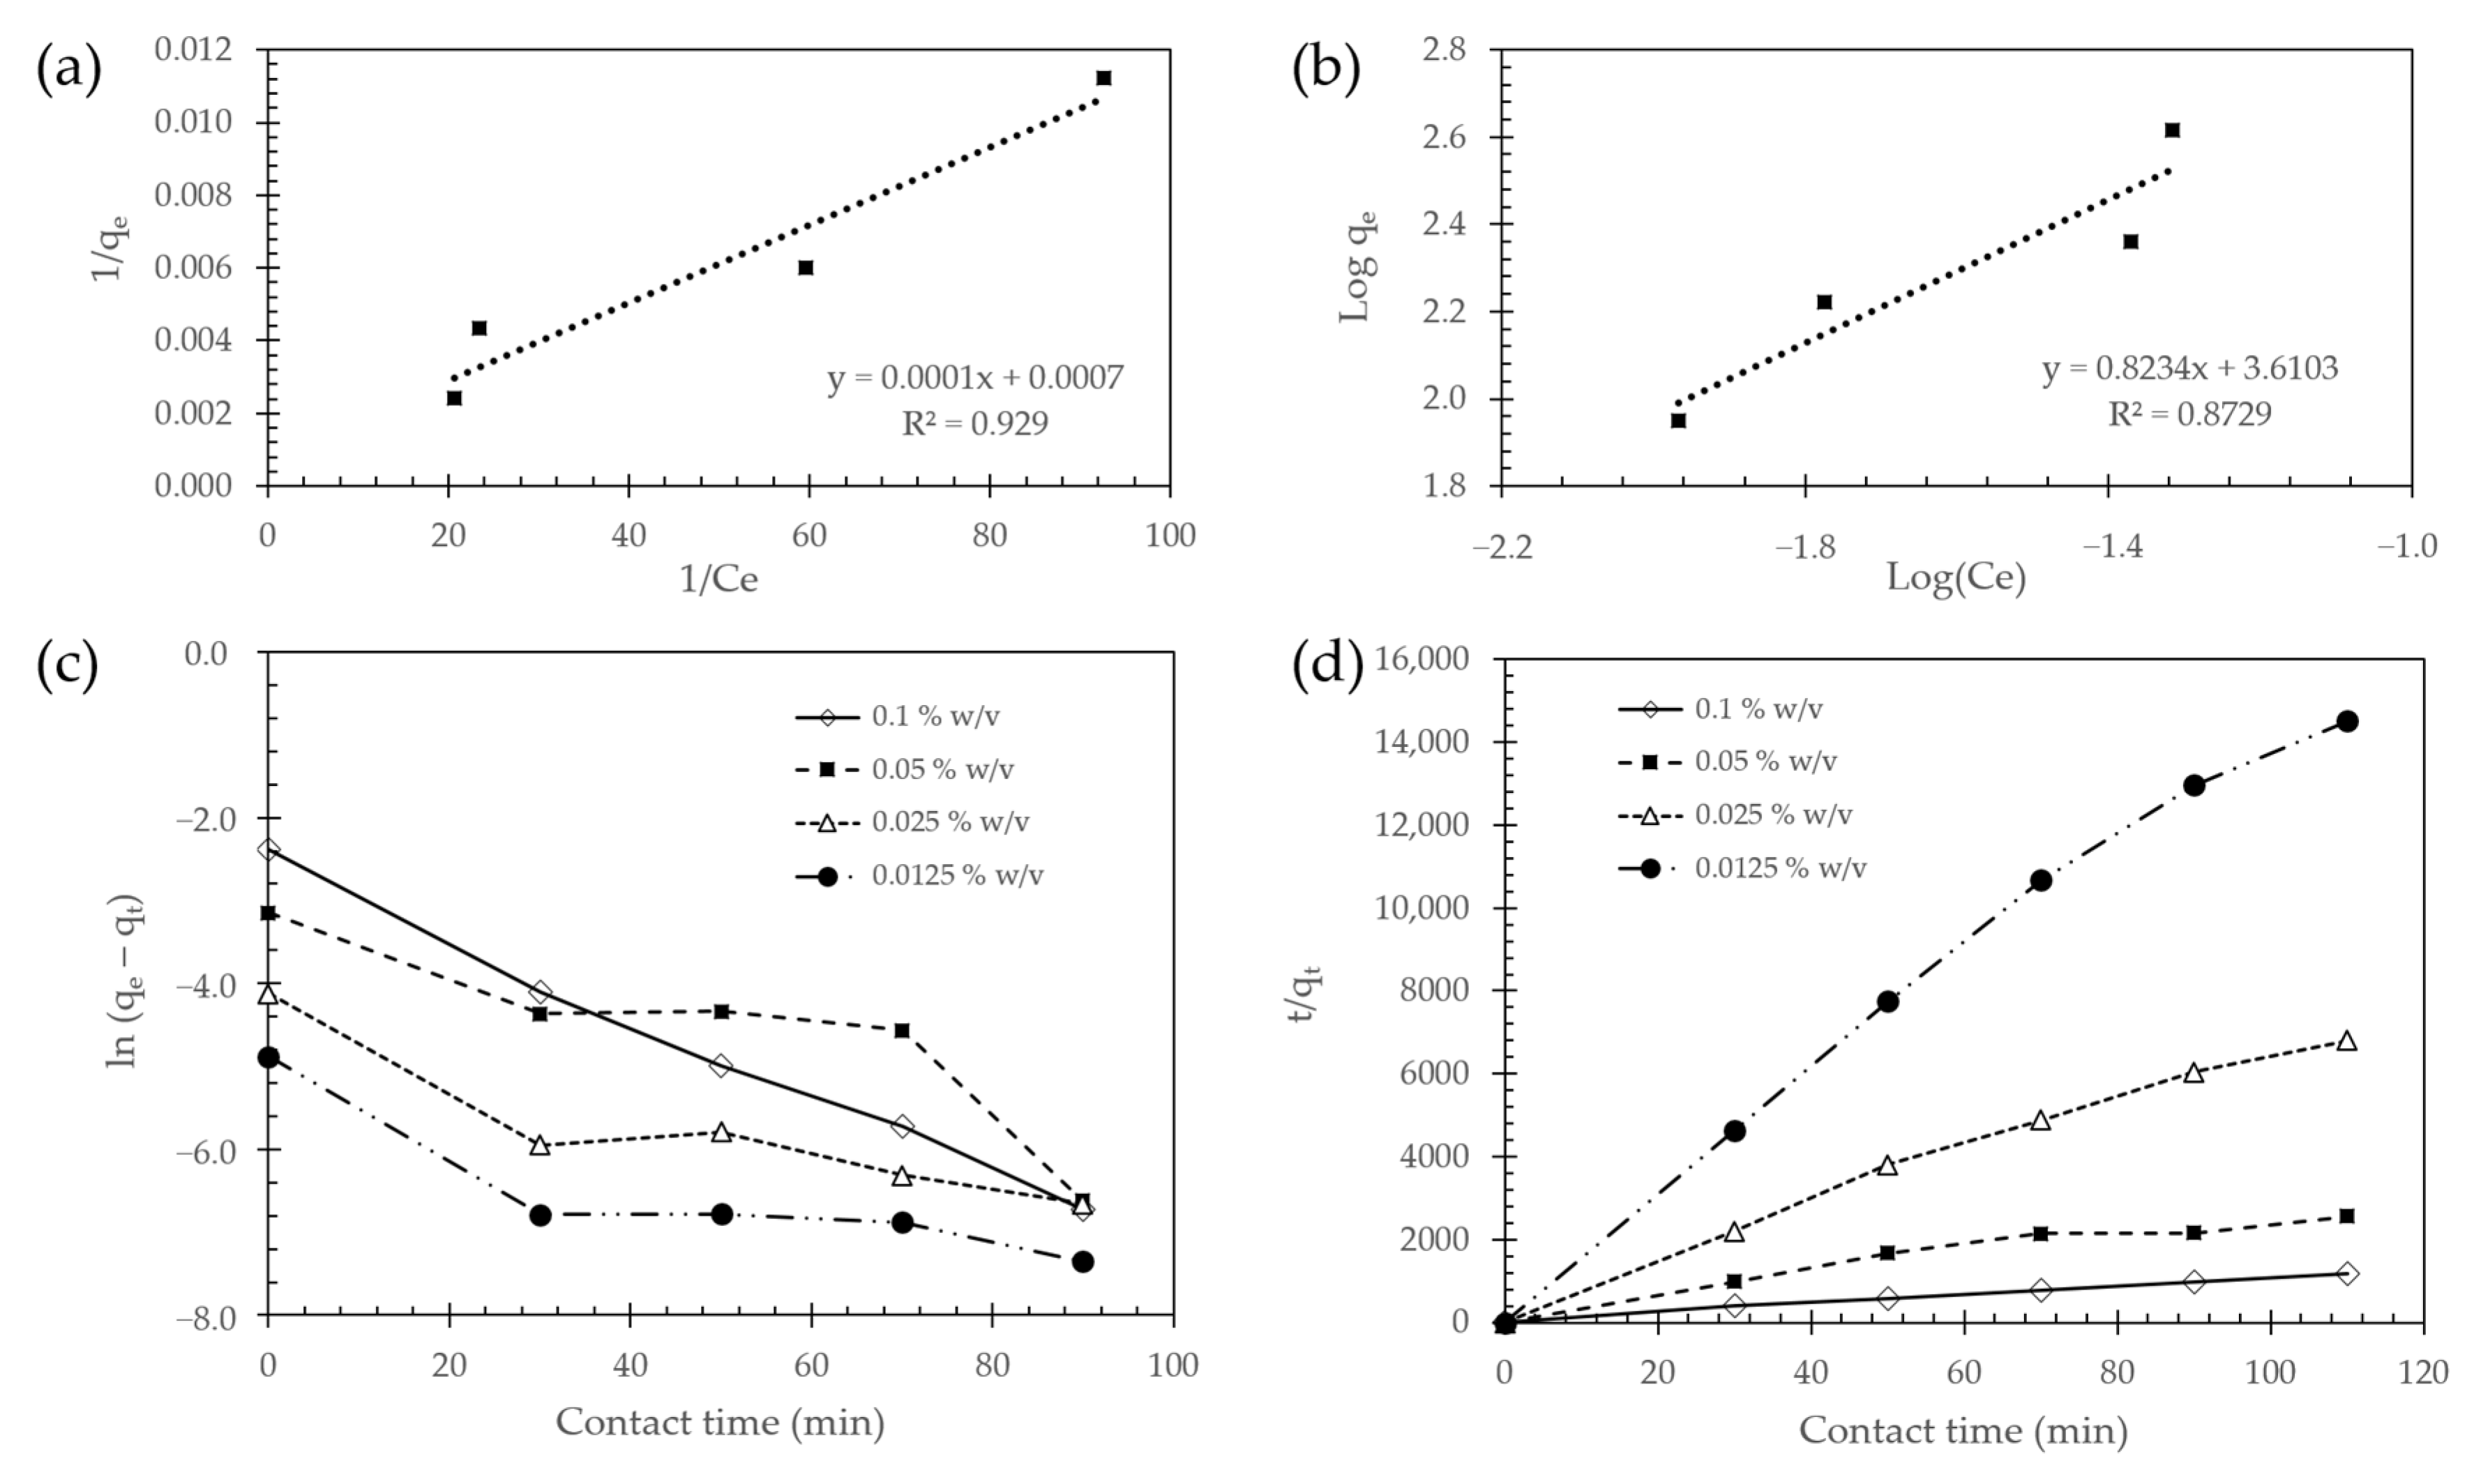
, which indicates a favorable adsorption. The data fitted a linear adsorption process (
Table 1) as evidenced with a correlation coefficient of 0.929 for Fe
3O
4 NPs @APTES. The Langmuir model fits relatively well the adsorption data for Fe
3O
4 NPs, which suggests that the assumption of a monolayer deposition might be correct for this adsorbent (
Figure 6a). The
value of Fe
3O
4 NPs @APTES is 1334.94 mg/g, which is reasonable compared with others reported previously by Javaheri, F. et al. [
46] of 884.906 mg/g for Fe
3O
4@SiO
2@m-SiO
2–NH
2 and 769.2 mg/g for nano zerovalent iron presented by Boparai et al. [
47].
The Freundlich linear model is not restricted to a monolayer formation and includes the heterogeneous interaction between the material surface and the metal ion. This model indicates that the Cd ions are adsorbed on an uneven surface not only forming monolayers in the active sites but also uneven multilayers. Therefore, the energy distribution for the surface-active sites of the adsorbent is uneven in contrast with the Langmuir model [
48]. The expression for Freundlich model is given by Equation (3) [
35,
45]:
where
is the Freundlich constant and
is the constant exponent that describes the intensity of the adsorption process [
35]. According to this equation, the plot of
vs.
should be a straight line with slope
and intercept
.
The deviation from linearity for the Freundlich model can be estimated from n values. In this regard, this parameter can be either unfavorable
, linear
, favorable
or irreversible
. Fe
3O
4 NPs yield a
, which could be associated with a favorable reaction [
45]. The correlation coefficient was 0.873 for Fe
3O
4 NPs @APTES. Consequently, in comparison with the Langmuir model, the Freundlich one appears to describe the adsorption process less accurately for Fe
3O
4 NPs (
Figure 6b).
Despite the fact that the Langmuir correlation coefficient (
= 0.929) is higher than the Freundlich model (
= 0.873), they are relatively low compared with similar reports in literature of 0.9973, 0.9950, 0.99 or 0.98 [
32,
48]. This is usually an indication that none of the constructed curves describes with high accuracy the adsorption behavior and there could be a more complex mechanism that governs the adsorption of Cd on this substrate. Other adsorption models such as the Dubinin−Radeshkevich may be able to provide a better mechanistic description of the process but the study of such a mechanism is beyond the scope of the present contribution.
2.7. Kinetic Studies
To describe the adsorption kinetics, the experimental data was fitted to both the pseudo-first-order (PFO) model and the pseudo-second-order (PSO) model.
The PFO model is described by the following differential equation (Equation (4)) [
49,
50,
51]:
where
and
are the metal ions adsorbed at time
and at equilibrium, respectively, while
is the PFO rate constant. After integration between
to
and
to
the obtained expression is (Equation (5)):
The adsorption kinetics (
Figure 6c and
Table 2) were fitted to the PFO model by plotting
vs
. The calculated parameters showed that the data failed to follow the PFO model for the studied surfaces and concentrations. The mean
was 0.852 for Fe
3O
4 NPs @APTES, which indicates a substantial deviation from linearity. Such deviation becomes quite apparent at 10 min, which is most likely due to a fast initial uptake of metal ions [
52].
The PSO model is described by the following differential equation (Equation (6)) [
20,
51]:
where
and
are the metal ions adsorbed at time
and at equilibrium, respectively, while
is the PSO rate constant. After integration between
to
and
to
the obtained expression is (Equation (7)):
The parameters of the kinetic model were calculated by plotting
vs.
. As shown in
Table 3 and
Figure 6d, the values of the calculated
are similar to those found experimentally. The mean correlation coefficient (
) for Fe
3O
4 NPs @APTES was 0.976. This corroborated a much better fitting of the PSO model compared with the PFO one.
The concentrations used for this experiment were increased from 0.0125% (
w/
v) to 0.1% (
w/
v), which was the one selected to evaluate the other parameters, such as pH, reusability and surface functionalization. The lower concentration of adsorbent possibly explains why the PSO model showed a better data fit than the PFO [
49]. Several reports have shown that by increasing the adsorbent’s initial concentration, the correlation of the experimental data with the PSO kinetics model decreases while it decreases for the PFO model [
49]. The PSO model assumes that the rate of adsorption of metal ions on the surface is directly proportional to the available binding sites on the material. Consequently, for Fe
3O
4 NPs @APTEs, it is very likely that the adsorption process is highly dependent on the amount of Cd in direct contact with the surface of the substrates and the number of available active sites. In this work, the calculated and experimental values for
in both PFO and PSO models are close to 0.007 mg/g, which is particularly small compared with those reported previously of 8.852 mg/g [
48] and 9.13 mg/g [
29]. This result could be explained by two of the initial conditions of the experiment. First, the low initial concentration of the stock Cd solution (0.1 mg/L), which is in some cases three orders of magnitude lower than those reported in other studies [
29,
30,
48]. Second, the studied concentrations of adsorbent. Although our substrate had a removal efficiency of 94%, the maximum evaluated concentration was 0.1 mg/L and the ratio of initial free metal ions and available adsorption sites was relatively low for the studied doses of adsorbent. Subsequently, we suggest that we were most likely operating below the complete adsorption capacity of the material, and in therefore the values for the
could change in higher initial cadmium concentrations.
2.8. Life Cycle and Desorption Studies
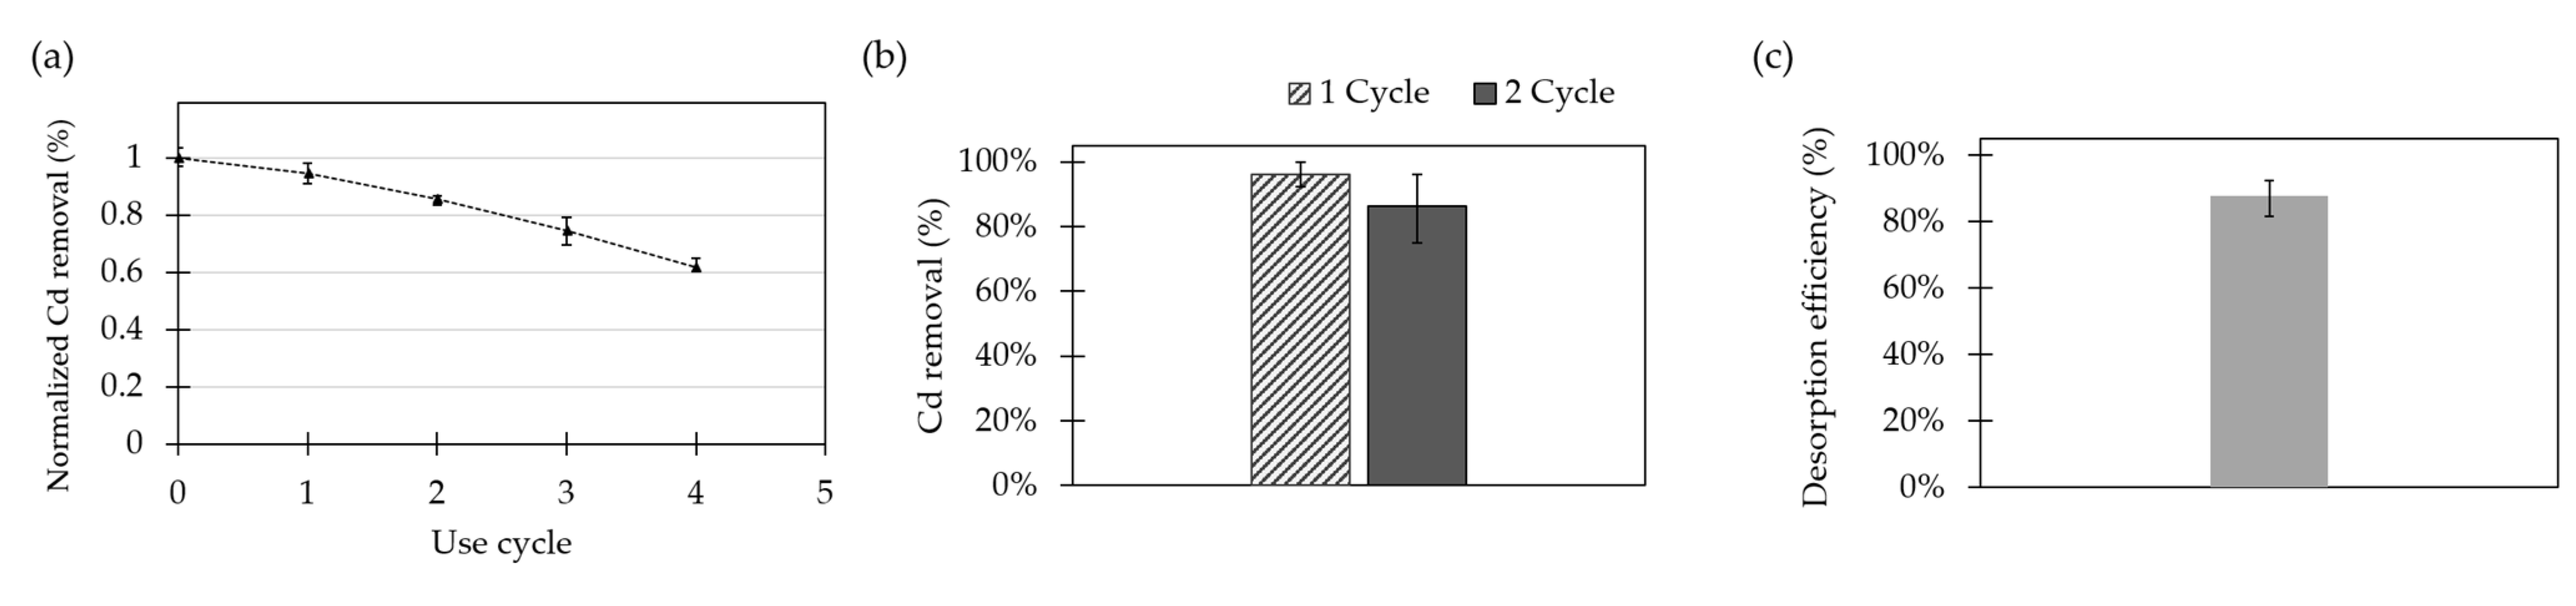
The life cycle capacity of the adsorbent was estimated by conducting four cycles of Cd removal. The Cd removal efficiencies of the modified substrate per cycle without any desorption or recovery process in between cycles are shown in
Figure 7a. The adsorbent showed a linear decreasing capacity for Cd adsorption after each cycle. The limit of reusability was established as an accumulated reduction in the adsorption capacity of 50%. For Fe
3O
4 NPs @APTES, the adsorption capacity was never reached for the conducted experiments; however, by following the linear tendency, it is expected to be close after the fifth cycle.
The ability to regenerate the surface is key for the economic and sustainable application of the developed adsorbents. For this reason, desorption studies were carried out with the aid of a 0.1% (
v/
v) HCl solution as the regenerating agent. The reusability of adsorbents was studied by evaluating the percentage of Cd removal before and after desorption (
Figure 7b). Moreover, the desorption efficiency was calculated for Fe
3O
4 NPs @APTES (
Figure 7c).
As reported by Katarina et al., in an acid medium such as HCl solution, Cd ions bound to chelating functional groups in the material are replaced by H
+ [
18]. For Fe
3O
4 NPs @APTES, the attained desorption efficiency was 87.6 ± 5.4%. Furthermore, on the second use cycle, the Cd adsorption percentage for Fe
3O
4 NPs @APTES decreased from 96.1 ± 3.9% to 86.4 ± 6.8%. In general, this indicates that this nanocompound shows good reusability for cyclical operation at the reported concentrations.
2.9. Environmental Repercussion
2.9.1. Phytotoxicity
A simple, rapid, sensitive, and low-cost method to evaluate NP toxicity is through the study of seed germination and root elongation of plant seeds [
53].
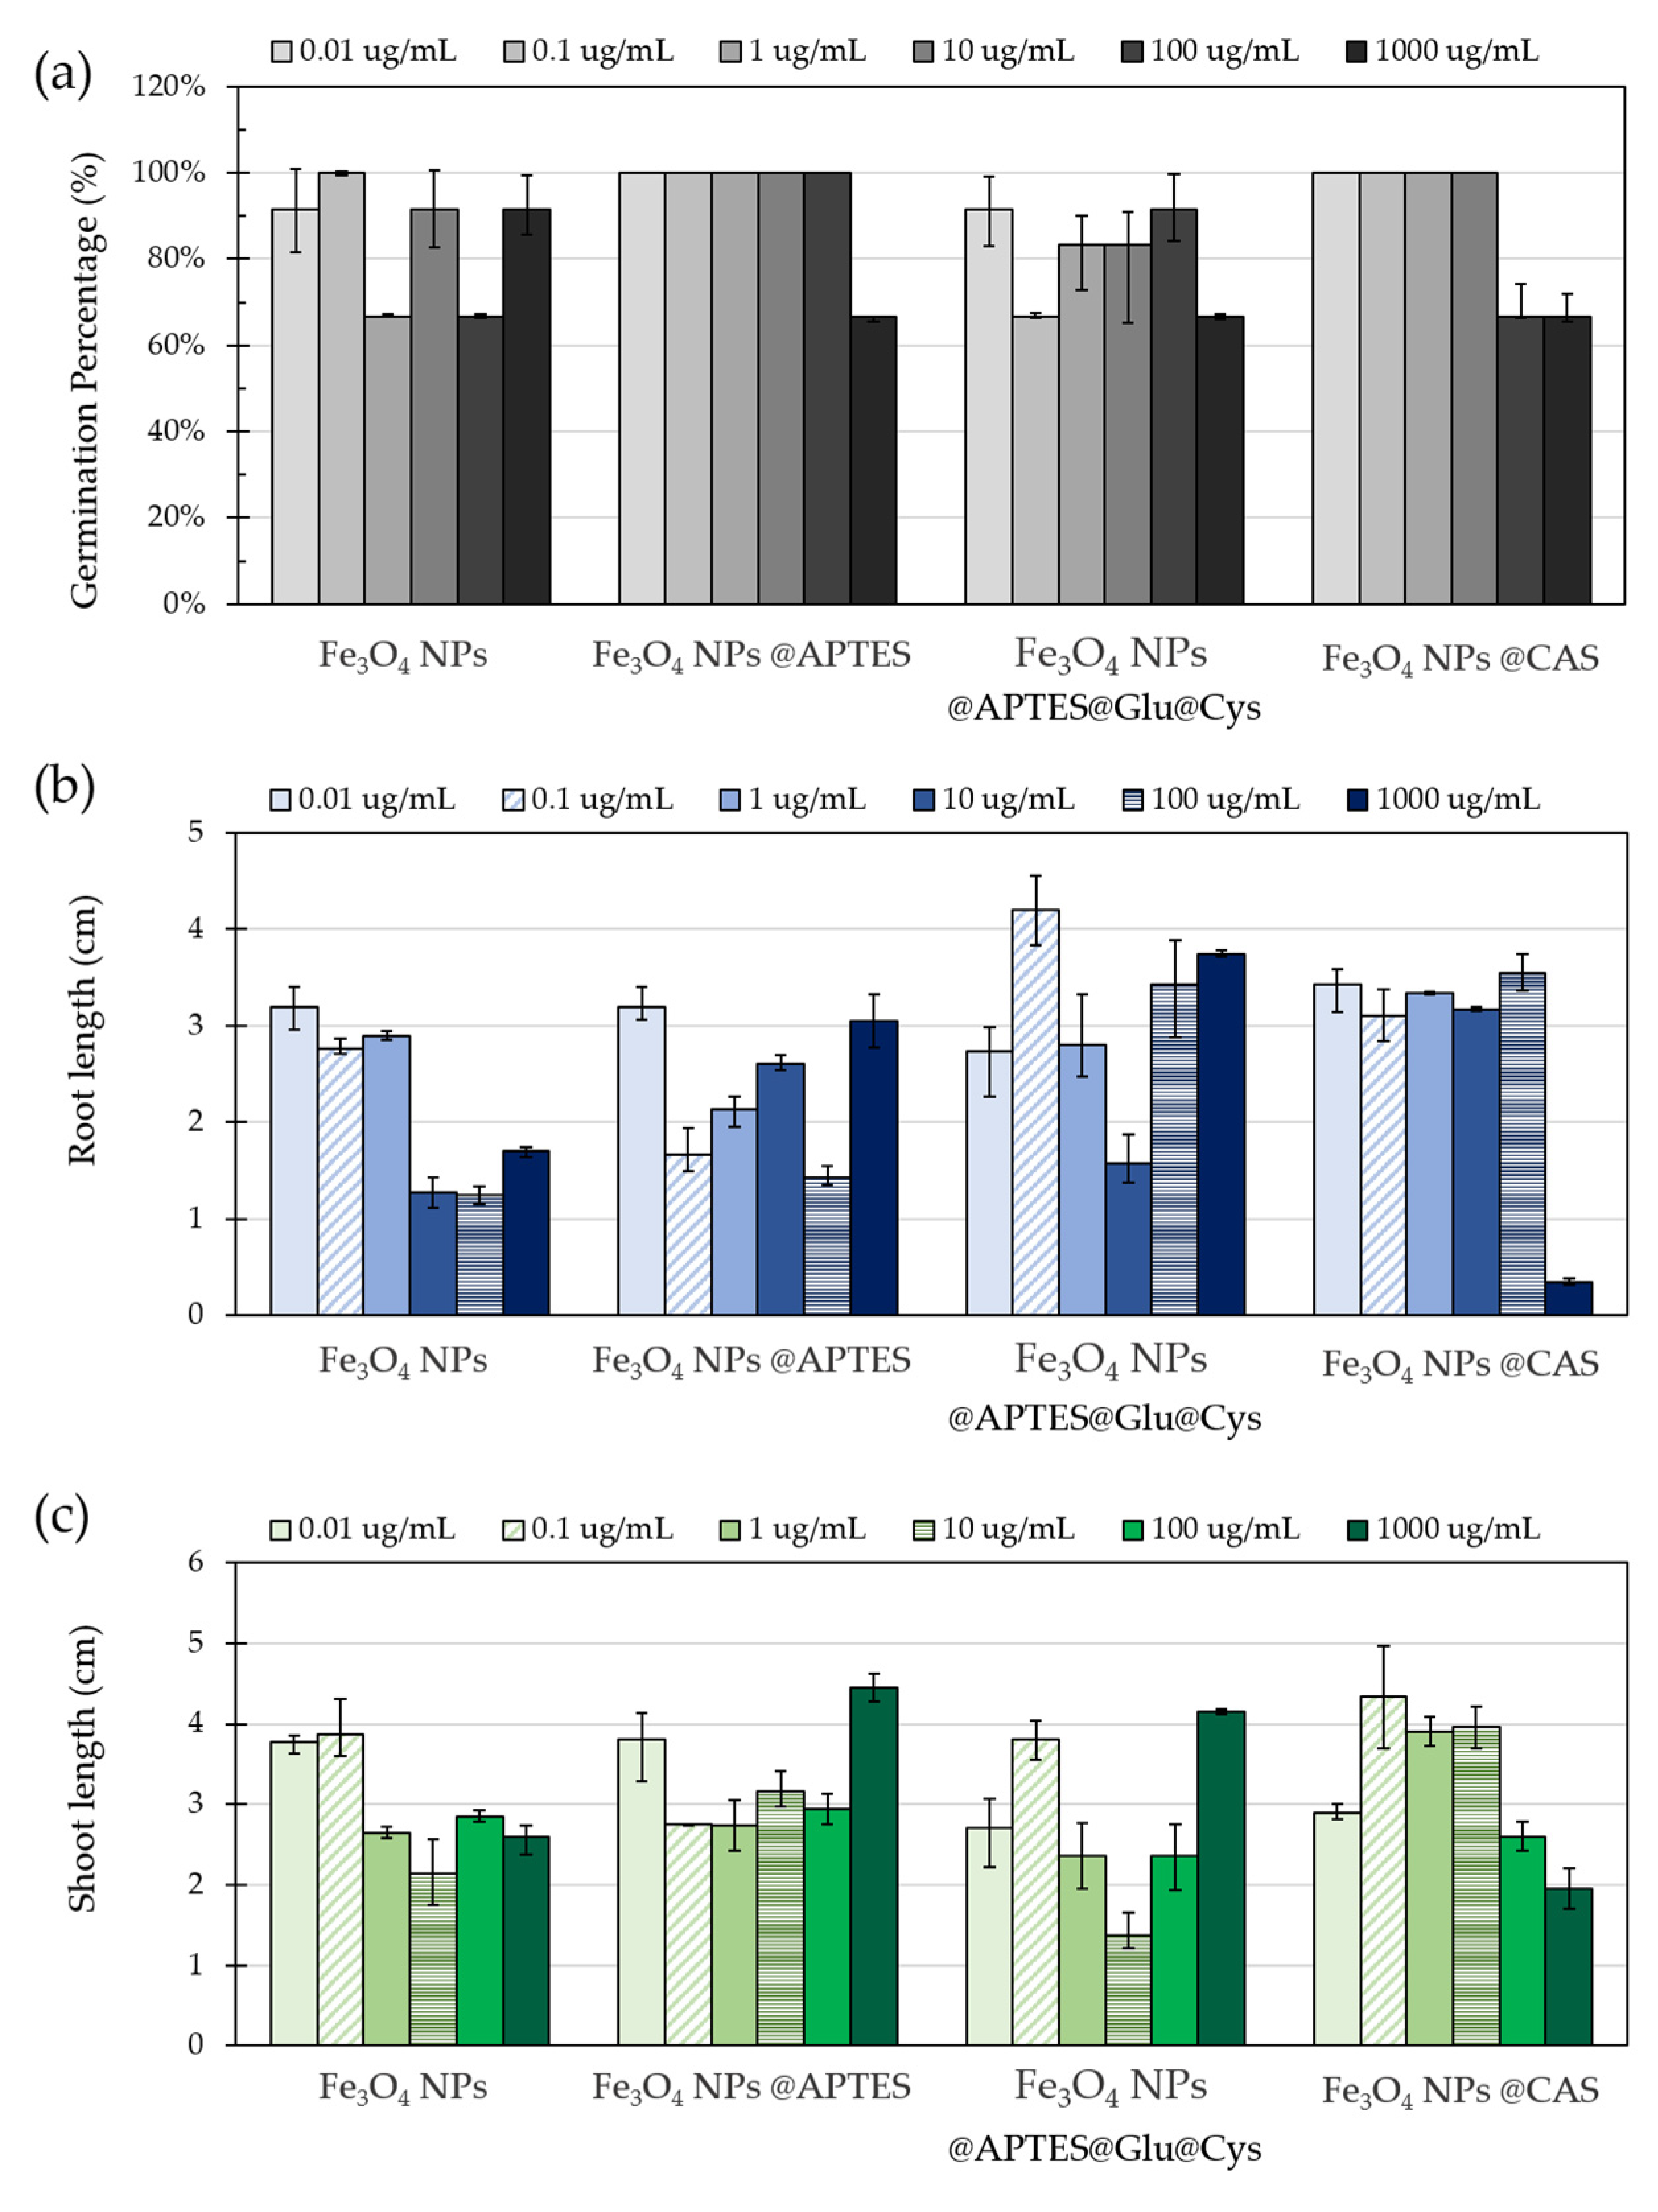
Figure 8 shows the impact on seed germination, root and shoot growth of NPs at six different concentrations in the range of 0.1 to 1000 µg/mL. Seed germination was recorded after the fourth and seventh day of exposure. The results were then used to calculate the percentage of germination for each treatment. Seed germinations appeared largely unaffected by the NPs as evidenced by values above 60% for all evaluated concentrations (
Figure 8a). Although the multiple comparison tests seemed to show no significant differences between the evaluated groups (with
p = 0.198), Levene’s test showed
p = 0.007, thereby suggesting that a least one of the treatments was different, which was corroborated by applying a Tukey test where the Fe
3O
4 NPs @APTES@GLU@Cys treatment was found to be statistically different from the others. The treatment that seemed to affect germination the most was Fe
3O
4 NPs @APTES@GLU@Cys with a value 6.6% below the average (i.e., about 87%). This was followed by Fe
3O
4 NPs with a value 2.4% below the average. In contrast, the remaining treatments showed germination values above the average. Fe
3O
4 NPs @CAS was indeed 1.7% above the average, and finally, Fe
3O
4 NPs @APTES was 7.35% above the average. Concentrations between 0.01 and 10 µg/mL showed no significant differences in germination, but those at 100 µg/mL and above led to germination changes in a concentration dependent manner.
The root and shoot elongation (
Figure 8b,c) were affected differently by each adsorbent. Changes in root elongation were observed in the roots of each seed. Multiple comparisons between treatments for the longest root showed a
p = 0.04, indicating that at least one of them was statistically different. Here, the group of seeds treated with unmodified Fe
3O
4 NPs showed the lowest elongations in its main root with up to 0.39 cm below the average length (i.e., 2.43 cm). Even though for NPs modified with APTES, the root and shoot elongations were not significantly inhibited, the effect of the treatment was still unclear. A slight inhibition of shoot and root growth was observed for Fe
3O
4 NPs @CAS at 10 µg/mL but surprisingly, not at the highest evaluated concentration.
Overall, Fe
3O
4 NPs showed no observable phytotoxicity except for the highest concentration, i.e., 1000 µg/mL. If NPs are to be used for wastewater treatment at a concentration of 0.1% (
w/
v), the approximate concentration of lost NPs in the environment, according to the reported WR%, would be approximately 62 µg/mL. At this concentration, no evident phytotoxicity effects on germination, root length, or shoot elongation were observable, which suggests a potentially low environmental impact. However, large-scale experiments with long-term exposure to realistic concentrations of Fe
3O
4 NPs are still needed to come to a definitive conclusion [
54].
2.9.2. NPs Toxicity in Zebrafish Embryos
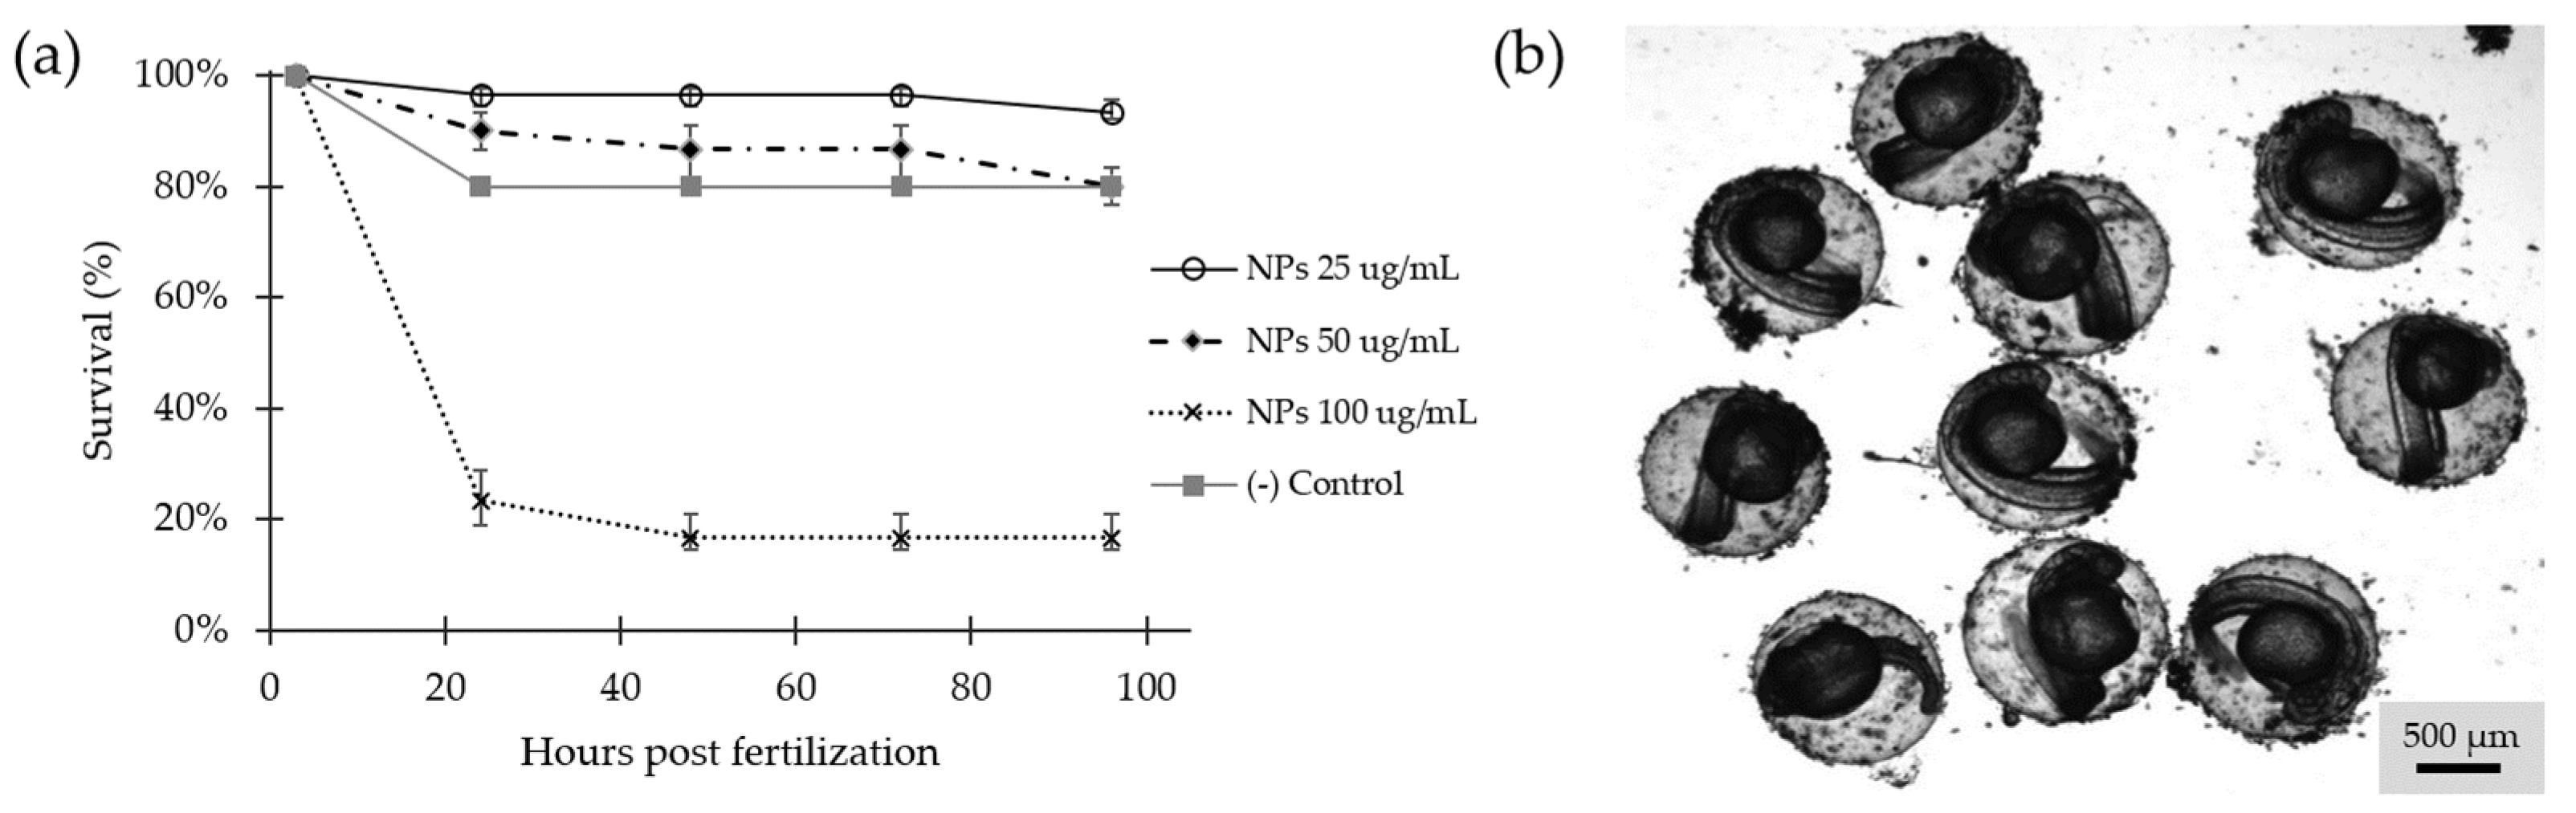
Survival in zebrafish embryos was determined by observation of activity and movement, heart rate, and changes in blood circulation [
55]. Survival was evaluated from 3 to 96 hpf (
Figure 9a) showing statistically significant differences (
p = 3 × 10
−12). Even though the effect of the exposure to the NC was concentration-dependent, the concentration of 25 and 50 µg/mL, showed minimal mortality rates and no evidence of malformations, while exposure to 100 µg/mL was highly lethal. According to the OECD guide, this result suggests that concentrations of 25 and 50 µg/mL present in the water, should not be considered harmful [
56]. During the treatment, accumulation of NPs was observed in the chorion, which became more evident as the concentration increased (
Figure 9b). However, this experiment was insufficient to determine if the observed accumulation led to significant changes in the normal development of the embryos or if hatching was inhibited by blockage of the chorionase activity [
57], the presence of acids in the medium [
58], and/or changes in hypoxia [
59].
3. Materials and Methods
3.1. Materials
Iron (III) chloride hexahydrate (97%) (FeCl3∙6H2O), tetramethylammonium hydroxide (TMAH) (25%), (3-Aminopropyl) triethoxysilane (APTES) (98%) and L-Cysteine (Cys) (97%) were purchased from Sigma-Aldrich (St. Louis, MO, USA). Iron (II) chloride tetrahydrate (98%) (FeCl2∙4H2O), glutaraldehyde (25%) (GLU), Cd standard solution 1000 mg/L and sodium hydroxide (NaOH) (98%) were obtained from PanReac AppliChem (Barcelona, Spain). Additionally, 3-(triethoxysilyl) propylsuccinic anhydride (CAS) (95%) was purchased from Shanghai Kayi Chemical Co. (Shanghai, China). Commercial aluminum oxide spheres (Alumina) between 600–800 µm of diameter were acquired from Torrecid (L’Alcora, Castellón, Spain).
3.2. Manufacture and Functionalization of Surfaces
3.2.1. Synthesis of Fe3O4 NPs
Nanoparticles were synthetized by co-precipitation method, using 2 M FeCl3∙6H2O and 1M FeCl2∙4H2O, diluted in milli-Q water. Solutions were then magnetically stirred and subsequently dripped to a 10 mL solution 8 M of NaOH with a syringe pump 78-8110C Programmable Touch Screen (Cole-Parmer, Vernon Hills, IL, USA) at 0.2 mL/min of infusing flow rate for 60 min. At the same time, the solution was stirred at 1500 rpm and 90 °C in the stirring hot plate. The final solution was left to precipitate with the aid of a neodymium magnet for 12 h. The resulting supernatant was discarded, and the precipitate was re-dispersed and washed adding milli-Q water, until pH 7.0 was reached.
3.2.2. Surface Functionalization of Substrates
Substrates were functionalized by silanization with two different organo-silane molecules, APTES and CAS. Surface hydrolysis was used to promote silane immobilization by exposing overnight the substrates to a pH 11.0 solution. The solution was prepared using milli-Q water and adding drops of 0.5 M NaOH until reaching pH 11.0. For Fe3O4 NPs silanization, 10mL of 0.5% (v/v) APTES or CAS solution was added to 20 mL aqueous suspension of Fe3O4 NPs 0.016 g/mL and sonicated for 10 min. Similarly, 2 g of activated Al2O3 spheres were dispersed in solutions of APTES or CAS 0.2% (v/v). All the reactions were carried out for 24 h at room temperature. Next, the functionalized surfaces were washed several times with abundant milli-Q to remove excess reagents.
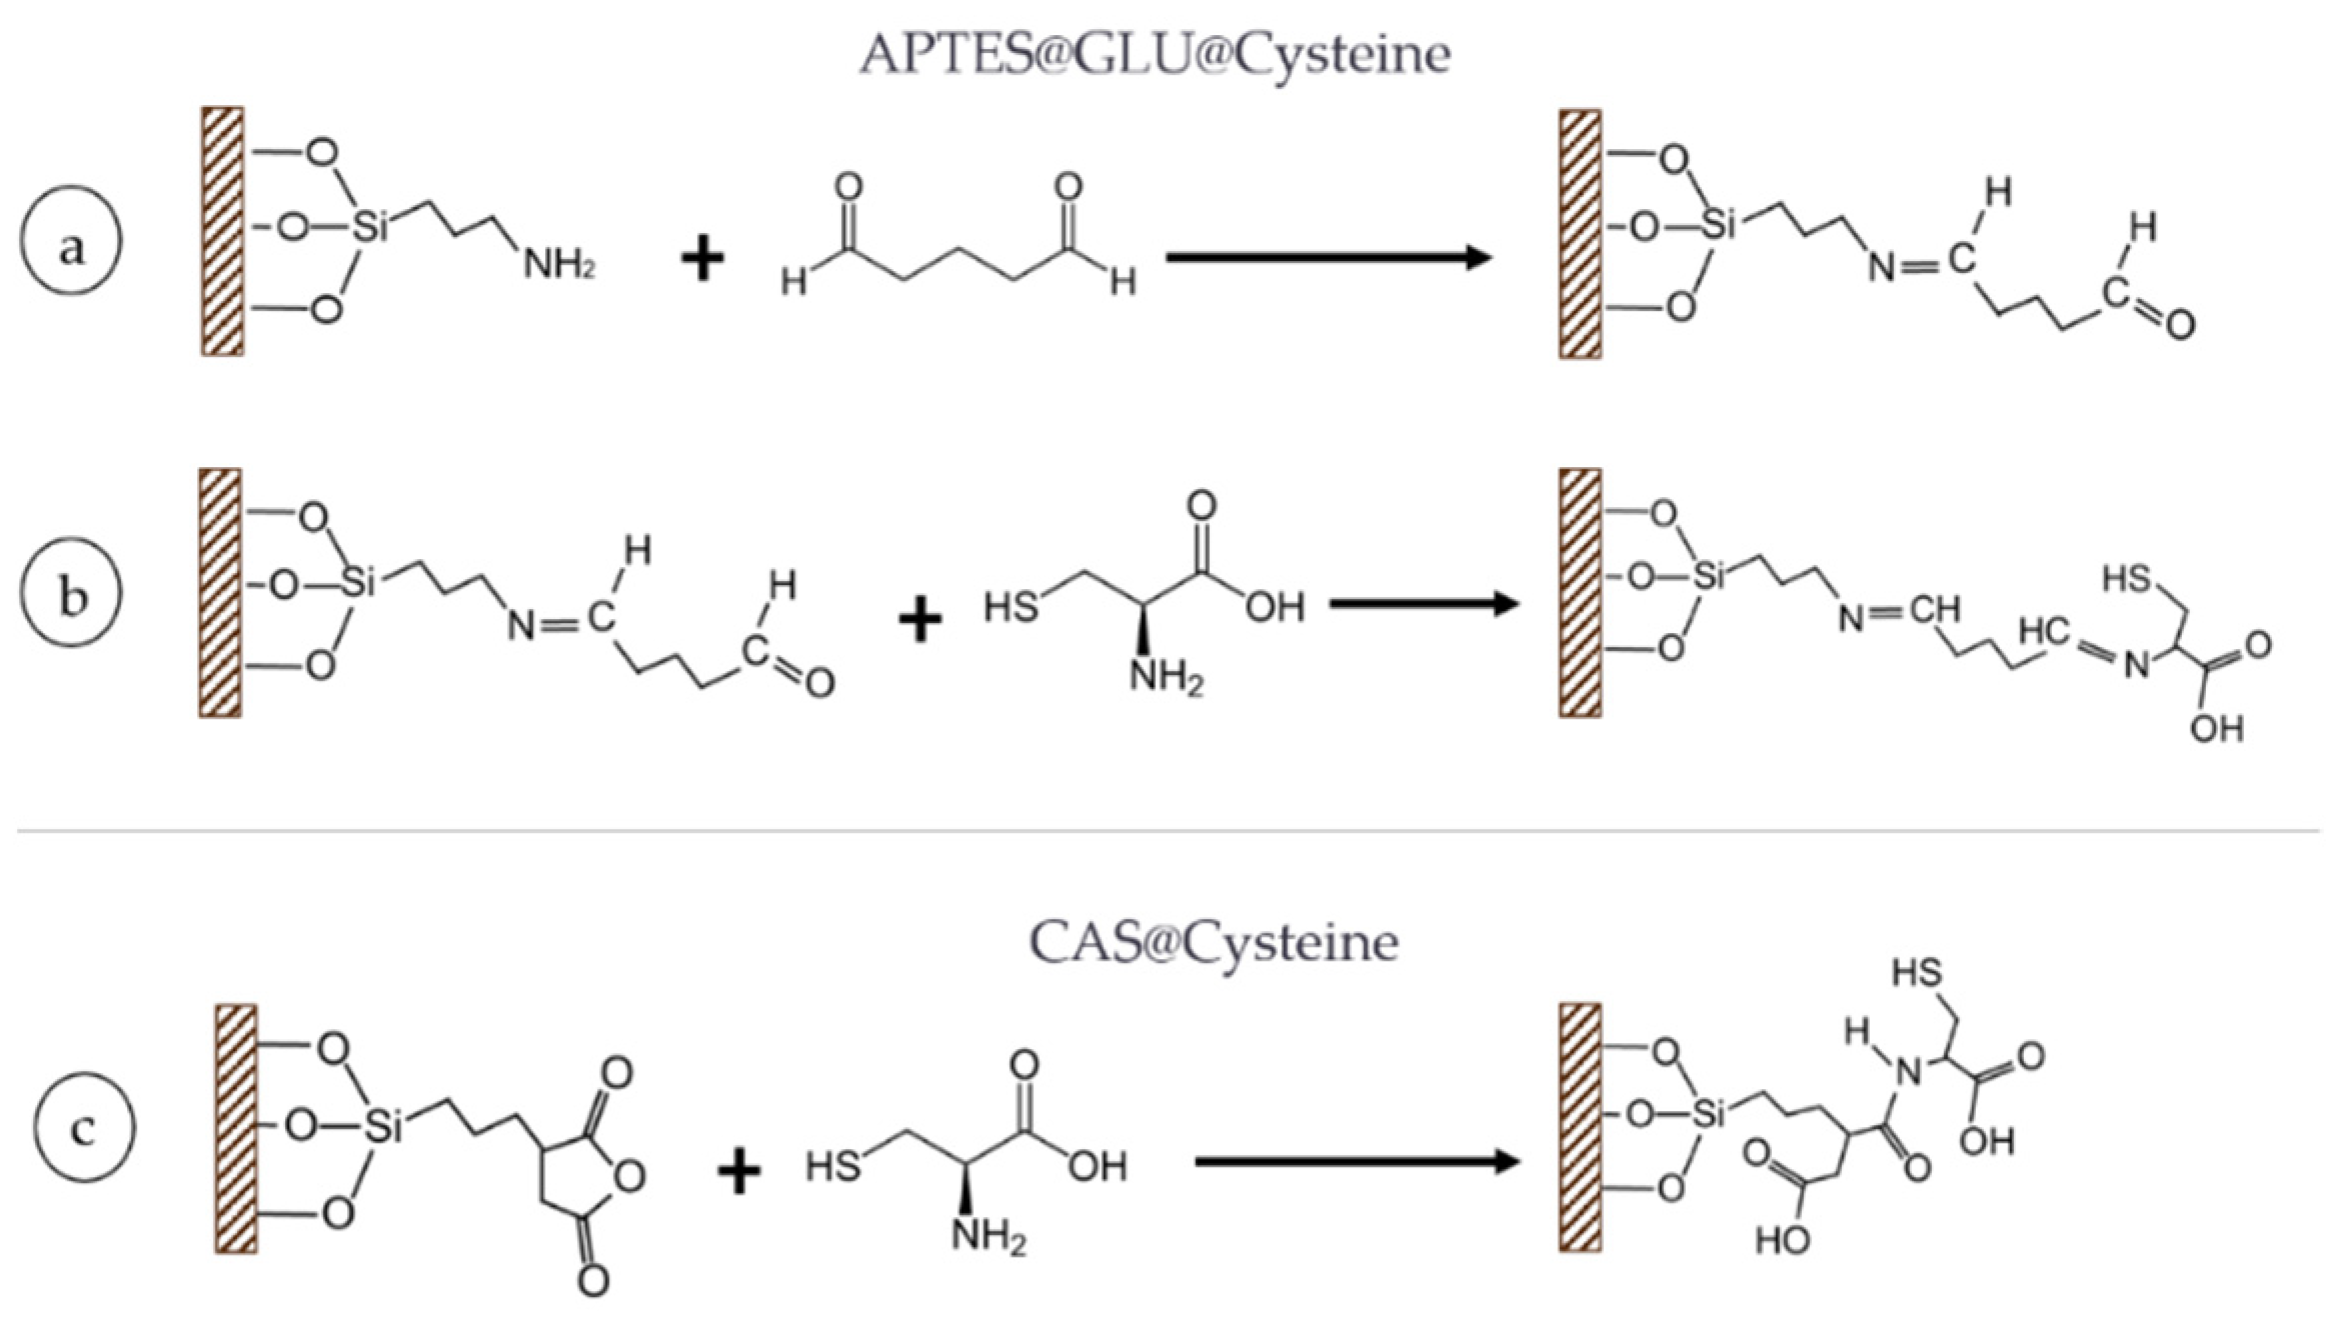
Additionally, a second functionalization with
l-Cysteine was carried out by following two different functionalization schemes (
Figure 10). Previously silanized substrates (with APTES), were first allowed to activate in a solution of GLU 1% (
v/
v) for 30 min. This was followed by thoroughly rinsing the substrate with milli-Q water to avoid nonspecific adsorption of the GLU. Alternatively, substrates silanized with CAS followed a succinylation of the anhydride group with the terminal amine group of Cys. The reaction was conducted under a basic pH conditions (i.e., pH: 8.0–10.0). Both CAS and APTES@GLU substrates were subsequently reacted with Cys at 0.01% (
w/
v) overnight (
Figure 10b,c). All reactions were carried out at room temperature.
3.3. Adsorbent Characterization
The hydrodynamic diameter of the synthesized Fe3O4 NPs was determined at room temperature by Dynamic Light Scattering (DLS) using a Zetasizer Nano ZS, (Malvern Panalytical, Malvern, Worcestershire, UK). This was accomplished by resuspending the magnetic NPs at 3% (w/v) in 1 mL of milli-Q water in the presence of 100 µL TMAH. Morphology and composition of both substrates before and after functionalization were studied with focused ion beam-scanning electron microscope (FIB-SEM). For the measurement, the samples were placed on aluminum-coated slices previously covered with carbon tape and then coated by evaporation with a thin film of Au to improve resolution and signal to noise ratio. Imaging was carried out under vacuum at a beam potency of 10 kV and 5000X of magnification with a Jeol Lyra 3 (TESCAN, Brno, Czech Republic). The surface modification of Fe3O4 NPs, and Al2O3 spheres with APTES, CAS, Glutaraldehyde and L-Cysteine were also verified via Fourier transform infrared spectroscopy (FTIR) using a Bruker Alpha II FTIR Eco-ATR (Bruker, Ettlinglen, Germany). Spectra were collected in the range of 4000–500 cm−1 with a spectral resolution of 2 cm−1 at room temperature.
3.4. Cd Removal Studies
Adsorption experiments were carried out in batches by maintaining 10 mg of substrate per 10 mL of Cd solution (0.1% (w/v) overnight (~18 h) at room temperature) and 200 rpm agitation in a VWR Standard orbital shaker (Avantor, Radnor, PA, USA). Control samples of the original Cd solution were taken prior to Cd removal assays and all measurements were conducted in triplicate. After the removal experiments, Fe3O4 NPs were recovered using a strong neodymium magnet. Al2O3 spheres were separated and recovered from the solutions with a 500 µm pore size metallic filter.
A stock solution of 0.1 mg/L of Cd was prepared from a 1000 mg/L Cd standard solution with milli-Q water. The Cd concentration in the solutions was measured via flame atomic adsorption spectroscopy (FAAS). Cadmium removal efficiency (R%) for each substrate was calculated according to the following equation (Equation (8)):
where
is the initial concentration of the Cd ion in the stock solution (mg/L); and
is final concentration of the Cd ion in the treated solution (mg/L).
The amount of Cd ions removed on the substrates was calculated as (Equation (9)):
where
q is the adsorption capacity (mg/g);
w is the substrate dosage (g); and
V is the total Cd solution volume (L).
Substrate Recovery
All the modified surfaces were weighted before and after the removal experiments. The percentage of mass recovered of each adsorbent after the removal experiments was calculated by the following relationship (Equation (10)):
where
WR% is the percentage of mass recovered;
is the initial substrate dosage; and
is the mass of filtered substrate from solutions after the removal experiments.
3.5. Impact of Substrate Type and Surface Modifications
The impact of the type of substrate and surface modification was investigated via adsorption experiments of Cd solution at a 0.1 mg/L concentration. The pH of the solutions was adjusted to 5.0 and the temperature maintained at room level (18 °C). The concentration of the remaining Cd ions was measured by FAAS after the substrates were filtered out with a 0.45 µm PTFE filter.
3.6. Effect of Solution pH
The adsorbents exhibiting the highest removal efficiencies (R%) were selected to investigate further the impact of pH on adsorption. In this regard, adsorption experiments were conducted at pH values ranging from 2.0 to 6.0 adjusted by adding either 0.1 M HCl or 0.1 M NaOH solutions. The initial Cd concentration for these studies was 0.1 mg/L.
3.7. Kinetic Studies
In these experiments, silanized Fe3O4 NPs (Fe3O4 NPs@APTES) at four different concentrations ranging from 0.0125 to 0.1% (w/v) were employed for removal experiments as described above. After the experiments, the adsorbents were recovered as explained above and the collected supernatants measured for cadmium contents as a function of time for up to 2 h.
3.8. Reusability Studies
The reusability of the Fe3O4 NPs@APTES was analyzed by carrying out four full operation cycles of 0.1 mg/L Cd removal at pH 4.0. After each cycle, the material was removed from the solution, transferred to a fresh Cd solution, and maintained therein overnight. Cd removal was measured with respect to the control solution before and after exposure for a period of 5 days.
Desorption studies were performed to investigate the feasibility for regeneration and reusability of the substrates. The Cd removal assays for Fe
3O
4 NPs@APTES started at pH 5.0 and at a Cd concentration of 0.1 mg/L. Then, adsorbents were separated, recovered, and placed independently for 1 h in a 0.1% (
v/
v) HCl solution followed by rinsing multiple times with milli-Q water to desorb Cd ions from their surfaces. The regenerated adsorbents were added later on to fresh Cd solutions under the same conditions to compare their removal efficiencies with those of pristine materials. The desorption efficiency was calculated using the following equation (Equation (11)) [
18]:
where
(mg/L) is the concentration of the originally adsorbed Cd ions, and
(mg/L) is the concentration of Cd in the solution after the desorption process.
3.9. Potential Environmental Impact
Different toxicity tests were conducted for the adsorbents with the highest Cd removal efficiencies to assess their potential environmental impact before their discharge to superficial waters.
3.9.1. NPs Phytotoxicity
Fe3O4 NPs phytotoxicity was determined by measuring the germination and stem length of Lolium perenne seeds (Ryegrass) (Agrosemillas, Medellin, Colombia) placed on a filter paper in culture plates. Solutions with unmodified NPs and modified with APTES, APTES@Cys and CAS at six different concentrations (0.01, 0.1, 1, 10, 100, 1000 µg/mL) in water were added to the culture plates with 6 seeds per well. Seeds were grown for seven days under static conditions at 18 °C and light cycles of 10 h.
3.9.2. NPs Toxicity in Zebrafish Embryos
Adult, TAB wild type, zebrafish were maintained under a constant 14 h light–10 h dark cycle at 28 °C, according to standard protocols [
60] in a controlled multitank recirculating system (Aquaneering, San Diego, CA, USA). The day before eggs were required for the assay, adults were placed in breeding tanks and allowed to breed. Embryos were collected 1 h after light was turned on the next morning and raised on 6-well microplates in egg water (60 µg/mL sea salt in RO water with 1 mg/L Methylene Blue) at 28 °C until 3 h post fertilization (dpf).
Groups of 10 embryos (3hpf) were exposed to Fe
3O
4 NPs @APTES at different concentrations (25, 50, 100 mg/L) until 4 dpf. Egg water was used as negative control. Each treatment was performed in triplicate, under the same conditions, and every 24 h, the water with the treatment was changed according to the protocols indicated by the OECD guide [
56].
Survival of the embryos was determined by observations of movement, heartbeat, and blood circulation aided by a stereoscope microscope AZ100M (Nikon, Tokyo, Japan) at 3, 24, 48, 72, and 96 h. Embryos that appeared opaque and exhibited white color were considered coagulated and were removed from the tank. All protocols were approved by the Institutional Animal Care and Use Committee of Universidad de los Andes (CICUAL) with the C.FUA_19-004.
3.9.3. Statistical Analysis
Germination of seeds, root and shoot elongation data were analyzed via a two-way ANOVA (with NP type and concentration as factors) followed by a Bonferroni post hoc test and were expressed as the mean ± standard deviation (S.D.).
Survival rate was determined during acute toxicity test (4 days) and was tested for Fe3O4 NPs @APTES, together with negative control (egg water). The collected data were analyzed with one-way ANOVA followed by Tukey test and were expressed as the mean ± S.D. The statistical analyses were developed in Minitab 19 Statistical Software, and for all comparisons, the level of significance was established as p ≤ 0.05.
4. Conclusions
Due to the increasing amounts of cadmium and other heavy metals being released into the environment on a daily basis, more efficient and inexpensive routes for their capture are urgently needed. One interesting strategy to address this need is to develop potent adsorbents capable of capturing significant amounts of heavy metal ions, and with the potential of being reused several times. Here, we explored the use of bare and functionalized Fe3O4 NPs and Al2O3 spheres as potential cadmium adsorbents. The already remarkable capacity of Fe3O4 for Cd adsorption was improved in more than 20% by surface functionalization with the organo-silane APTES. This was attributed to the significant increase in surface reactivity given by the pendant amine groups of APTES. For Fe3O4 NPs, an optimum pH of 5.0 was found for Cd removal, which was attributed to suitable charges for strong electrostatic interactions between Cd ions in the solution and the surface functional groups. Kinetic studies of cadmium adsorption suggest that the process is most likely controlled by the available active sites on the surface of the materials as well as by the cadmium ion concentrations in solution. All adsorbents can be easily recovered from water solutions with efficiencies higher than 80%; however, despite having a relatively lower cadmium capturing capacity, Al2O3 spheres showed the best results. Fe3O4 NPs @APTES recycled up to four uses with more than 50% of their removal efficiency. No evident phytotoxicity was found for either the bare or functionalized adsorbents for concentrations below 100 µg/mL. Fe3O4 NPs @APTES evaluated here showed that toxicity is concentration dependent. Survival data suggests exposures to concentrations below 50 µg/m are not harmful; however, more detailed studies that includes the effect on hatching, malformation, changes in behavior and possible nanoparticle bioaccumulation, among others; are suggested as future work.
Overall, these results indicate that metal ion retention is highly dependent on the porosity of the surface and the adsorbent´s particle size. Similar cadmium removal percentages were achieved with both Fe3O4 and Al2O3. Further studies at a larger scale are required to evaluate whether the adsorbents can be potentially introduced into niche markets locally and internationally.


 ,
, 


