Article

The Tannins from Sanguisorba officinalis L. (Rosaceae): A Systematic Study on the Metabolites of Rats Based on HPLC–LTQ–Orbitrap MS2 Analysis

1
Department of Pharmacy, Renmin Hospital of Wuhan University, Wuhan 430060, China
2
School of Pharmaceutical Sciences, Wuhan University, Wuhan 430071, China
*
Author to whom correspondence should be addressed.
Molecules 2021, 26(13), 4053; https://doi.org/10.3390/molecules26134053
Submission received: 25 March 2021 / Revised: 9 May 2021 / Accepted: 11 May 2021 / Published: 2 July 2021

Abstract

:
Sanguisorba tannins are the major active ingredients in Sanguisorba ofJicinalis L. (Rosaceae), one of the most popular herbal medicines in China, is widely prescribed for hemostasis. In this study, three kinds of tannins extract from Sanguisorba officinalis L. (Rosaceae), and the metabolites in vivo and in vitro were detected and identified by high-pressure liquid chromatography, coupled with linear ion trap orbitrap tandem mass spectrometry (HPLC–LTQ–Orbitrap). For in vivo assessment, the rats were administered at a single dose of 150 mg/kg, after which 12 metabolites were found in urine, 6 metabolites were found in feces, and 8 metabolites were found in bile, while metabolites were barely found in plasma and tissues. For in vitro assessment, 100 μM Sanguisorba tannins were incubated with rat liver microsomes, liver cytosol, and feces, after which nine metabolites were found in intestinal microbiota and five metabolites were found in liver microsomes and liver cytosol. Moreover, the metabolic pathways of Sanguisorba tannins were proposed, which shed light on their mechanism.

1. Introduction

The Sanguisorba officinalis L. (Rosaceae), with a long history of cultivation, is widely distributed in Asia, Western Europe, and North America and is specifically native to the temperate zones of the Northern Hemisphere, a kind of plant that is available for medicine in China, Europe, Japan, and Korea [1]. It is a member of subfamily Rosoideae and family Rosaceae, and all parts of the plant can be used as an effective astringent, but the root is the most active [2]. The dried root of Sanguisorba is recorded in various versions of Chinese Pharmacopoeia, European Pharmacopoeia, Russian Pharmacopoeia [3,4]. Since the Sanguisorba contains phenolic compounds, such as tannic acid, with a function of “cooling blood for hemostasis, detoxification, and astringency”, it has been used for metrorrhagia and metrostaxis, hematemesis, hematochezia, bleeding hemorrhoids, pudendum eczema, menopathy, and leukorrheal diseases [5]. The main constituents include triterpenoid saponins, flavonoids, phenols, etc., among which the phenols are highest and are quite active in the treatment for increasing white blood cell, along with having anticancer, antioxidant, and antibacterial benefits [6].
According to the chemical structure of tannins, they can be divided into three categories: (i) hydrolyzable tannins, which generally refer to tannins that can produce gallic acid or various gallic acid polymers (CG, S-HHDP, DHDDP, S, S-gallagyl, lactone valoneoyl) and glucose after hydrolysis; (ii) condensed tannins, which are a class of compounds in which catechins or their derivatives and other flavan-3-ols are polymerized with C–C bonds [7,8]. Since there is no glycoside bond and ester bond in their structure, they cannot be hydrolyzed by acid or base [9]; and (iii) complex tannins, which are composed of the components of condensed tannins, flavan-3-ols, and the hydrolyzed tannins by carbon–carbon bonding. These tannins were first isolated from the Fagaceae [10] and have been widely found in plants containing both hydrolyzable tannins and condensed tannins [11].
At present, the limited studies available mainly focus on the metabolites and tissue distribution of Ziyuglycoside I and II [12], the major active ingredients isolated from Sanguisorba officinalis, with few studies about Sanguisorba tannins.
In the present study, high-performance liquid chromatography, coupled with high-resolution mass spectrometry (HPLC–HRMS), has been used as an effective and reliable analytical tool to identify metabolites due to its high resolution and high sensitivity [13,14]. Metabolism research can identify metabolites and major metabolic pathways, which can help to understand the pharmacological mechanisms of food and drugs [15]. Recently, the intestinal microbiota has been considered to be a “hidden organ” of the body [16], which can be regarded as a systematic research approach to study the intestinal microbiota metabolism in vitro [17]. In addition, Sanguisorba tannins can be metabolized by liver microsomes, cytosol, and rat primary hepatocytes in vitro [18], which has been regarded as a valuable model to study food and drug metabolism in vitro due to the biotransformation organ of the liver [19].
Therefore, in this study, we conducted a comprehensive in vivo–in vitro investigation on the metabolism of Sanguisorba tannins using HPLC–LTQ–Orbitrap MS2. In vitro, Sanguisorba tannins mediated metabolism was studied in the intestinal microbiota and liver microsomal culture system of rats. In vivo, Sanguisorba tannins metabolites were characterized in various biological samples, including urine, feces, plasma, bile, and various tissues, after oral administration of Sanguisorba tannins in adult rats.

2. Results

2.1. Establishment of the Analytical Strategy

In this study, an effective strategy was taken for metabolite identification of Sanguisorba tannins in vivo and in vitro using HPLC–LTQ–Orbitrap MS (Thermo Fisher Scientific, Waltham, MA, USA) [20], coupled with multiple data processing methods. Firstly, fragmental patterns of the tannins from Sanguisorba L. were analyzed based on the MS1 and MS2 information obtained by HPLC–LTQ–Orbitrap MS2 to acquire the cleavage pathways and diagnostic product ions (DPIs) for metabolite identification. Then, metabolite templates (known and identified metabolites) were summarized and established using the reported metabolic transforms of ingredients in the literature. Thirdly, compared with blank biosamples including urine, bile, plasma, feces, liver microsomes, liver cytosol, and intestinal microbiota, the metabolites from Sanguisorba L. in biosamples were identified using multiple metabolite templates, extracted ion chromatograms (EICs), and DPIs. Furthermore, we also used ChemDraw 14.0 (Thermo Fisher Scientific, Waltham, MA, USA) to calculated the Clog p values and the isomers were selected with different retention times. Often, the compound had a longer retention time when the Clog p value was greater in the reverse-phase chromatographic system.

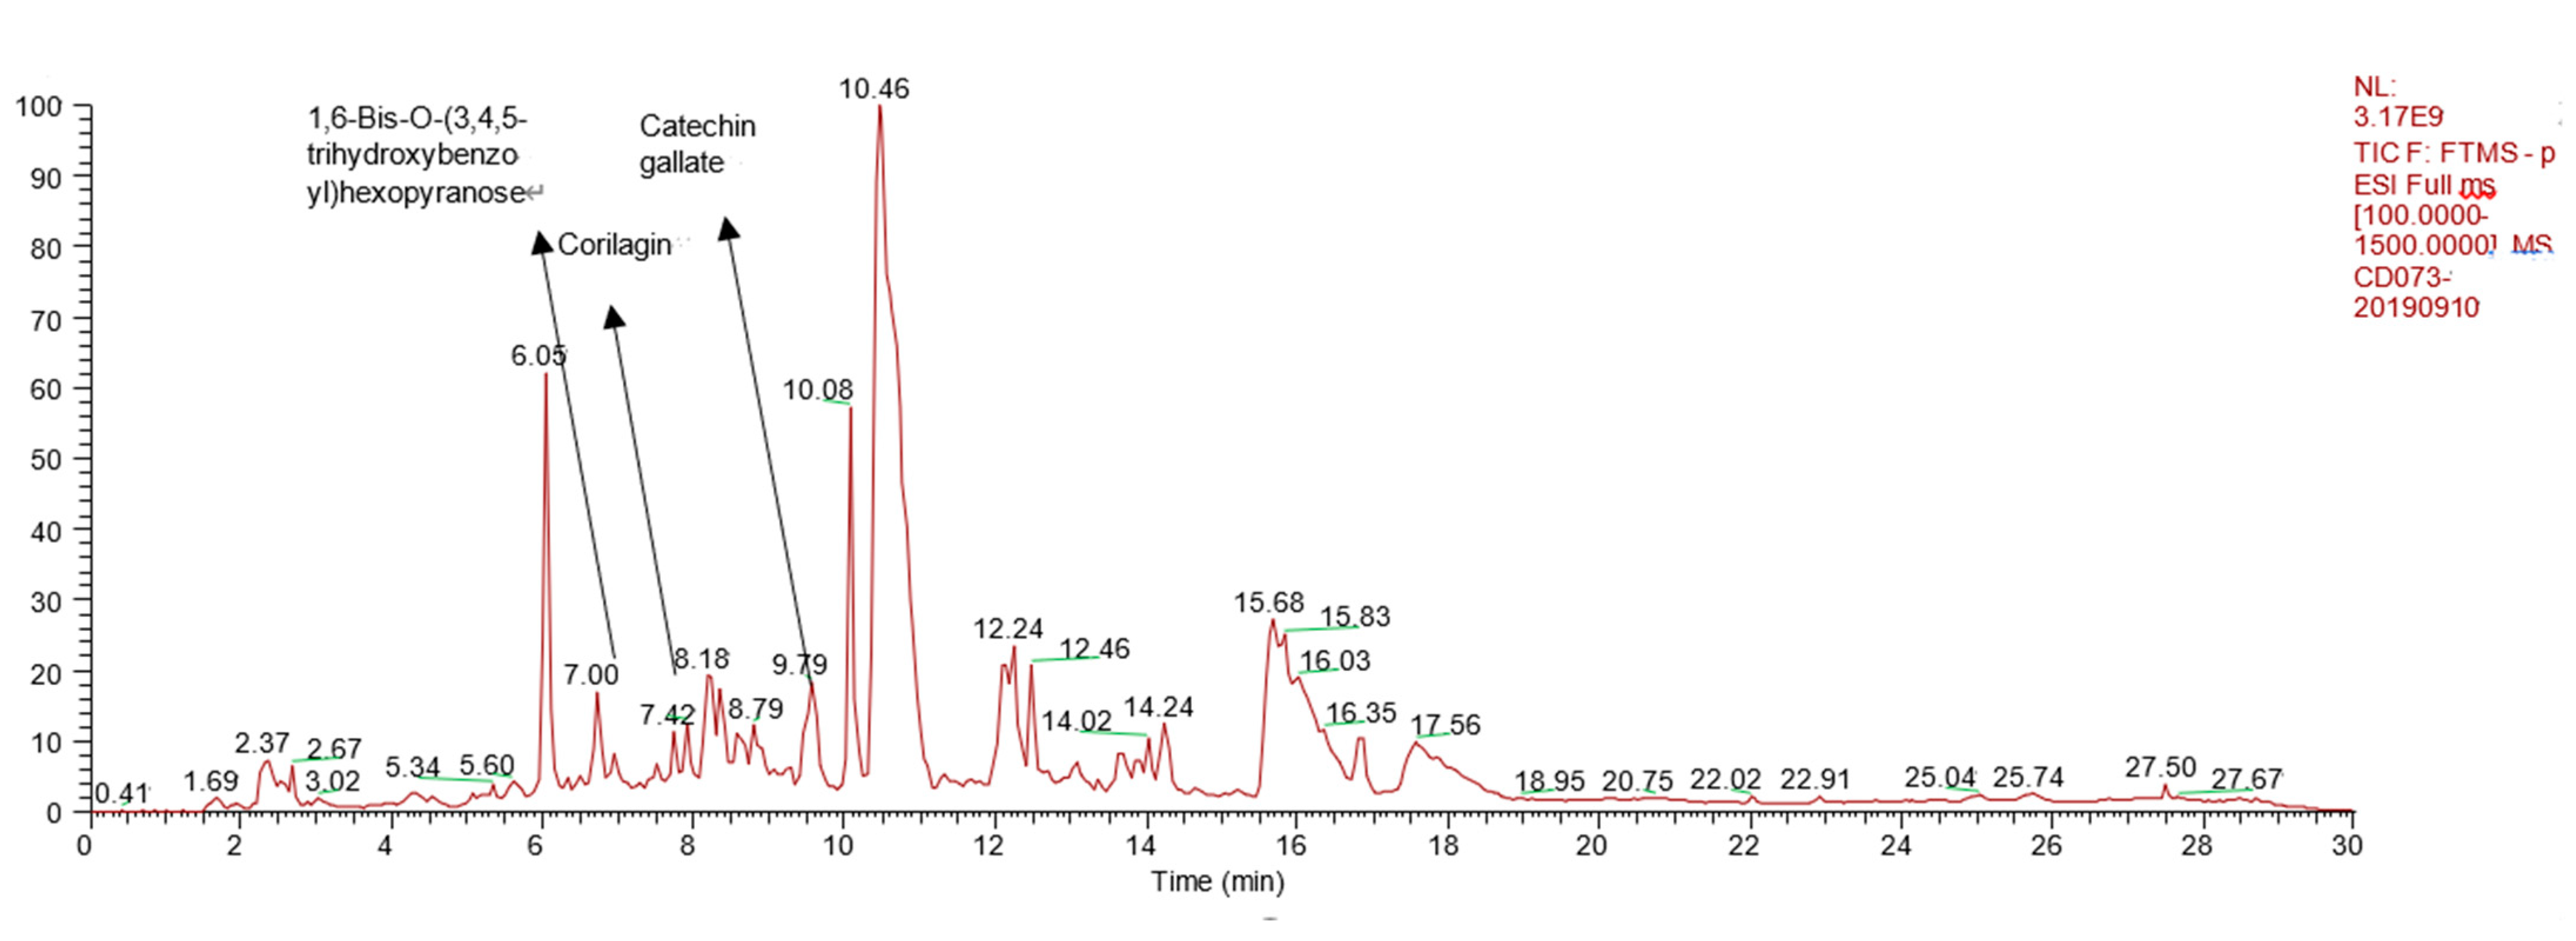
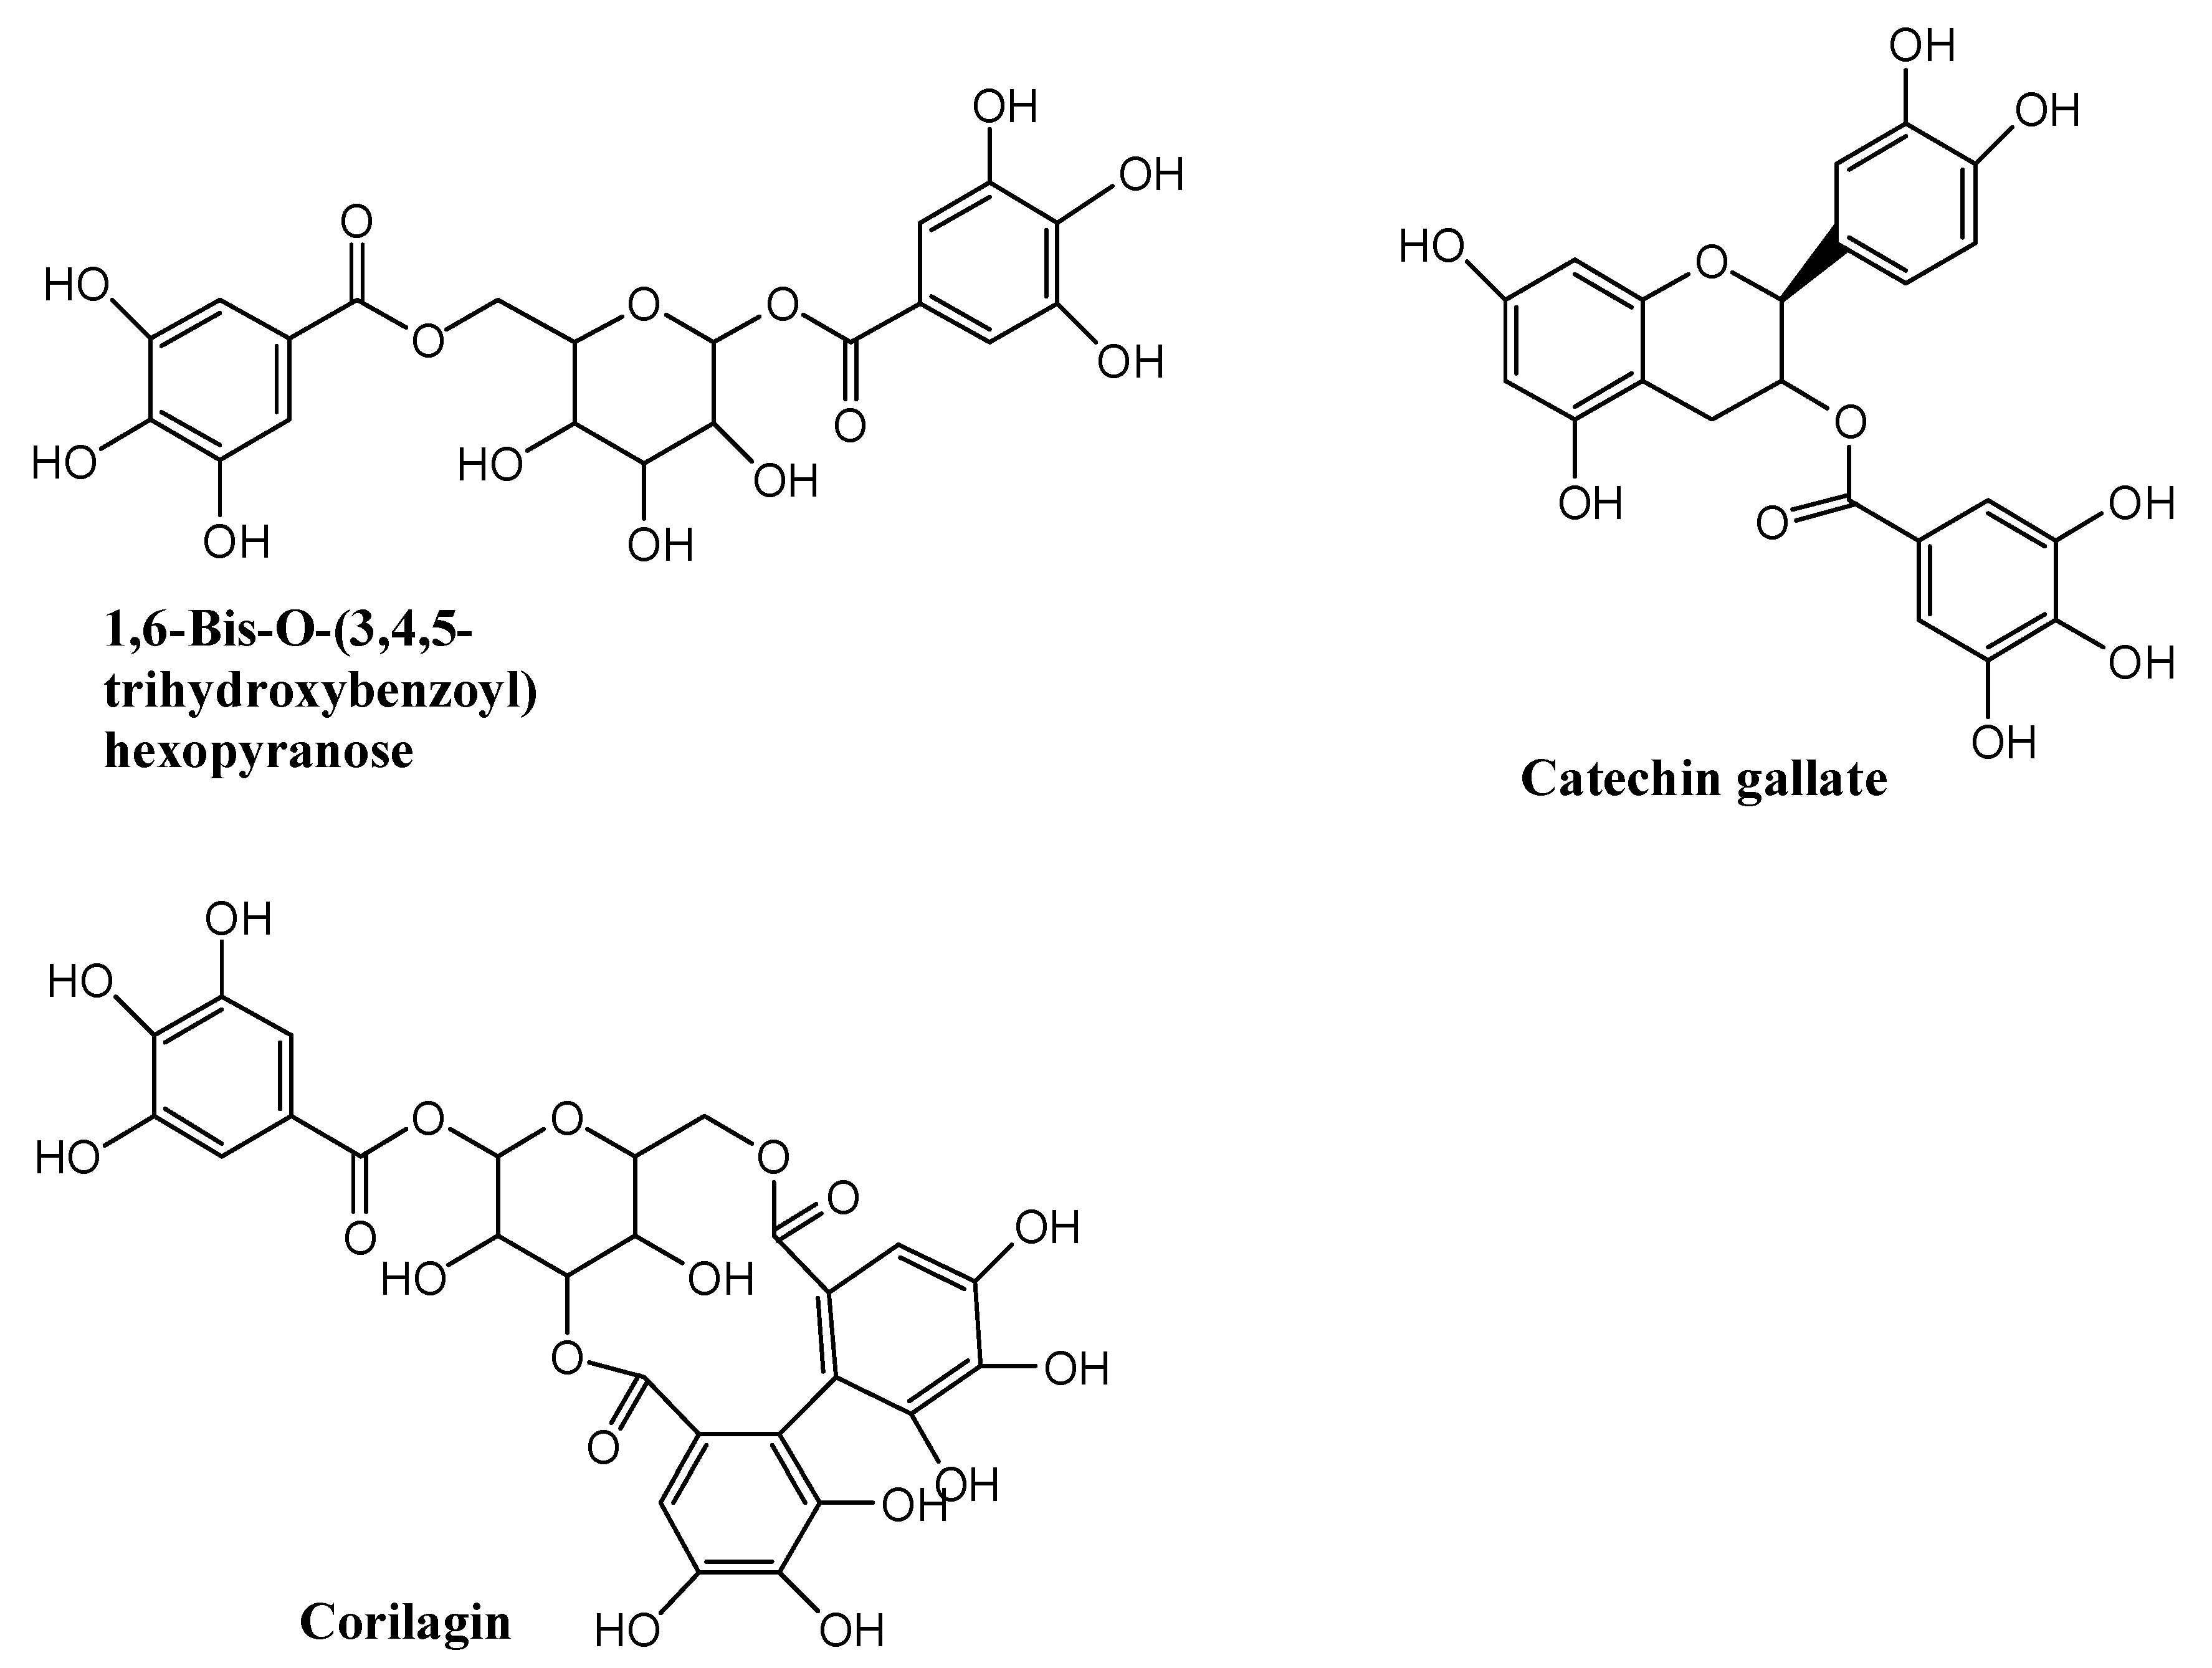
2.2. Identification of Total Tannins Compounds Extracted from Sanguisorba Tannins

After concentration using HDP-400 macroporous resin column, the total tannins content in the final product was 65.5% and the main compounds extracted from Sanguisorba tannins were measured by using HPLC–LTQ–Orbitrap MS2. The main compounds detected are shown in Table 1, the total ion chromatograms of Sanguisorba tannins are shown in Figure 1, the summary analytical strategy diagram is shown in Figure 2 and their structures are shown in Figure 3.

2.3. Identification of Metabolite of Sanguisorba Tannins In Vivo and In Vitro

According to the above analysis method, a large number of metabolites were identified in biological samples. All the detected metabolites of Sanguisorba tannins in vivo and in vitro are listed in Table 2, Table 3 and Table 4, respectively, the structures of the metabolites in vivo and in vitro are shown in Figure 4, and the metabolic pathways in vivo are shown in Figure 5.

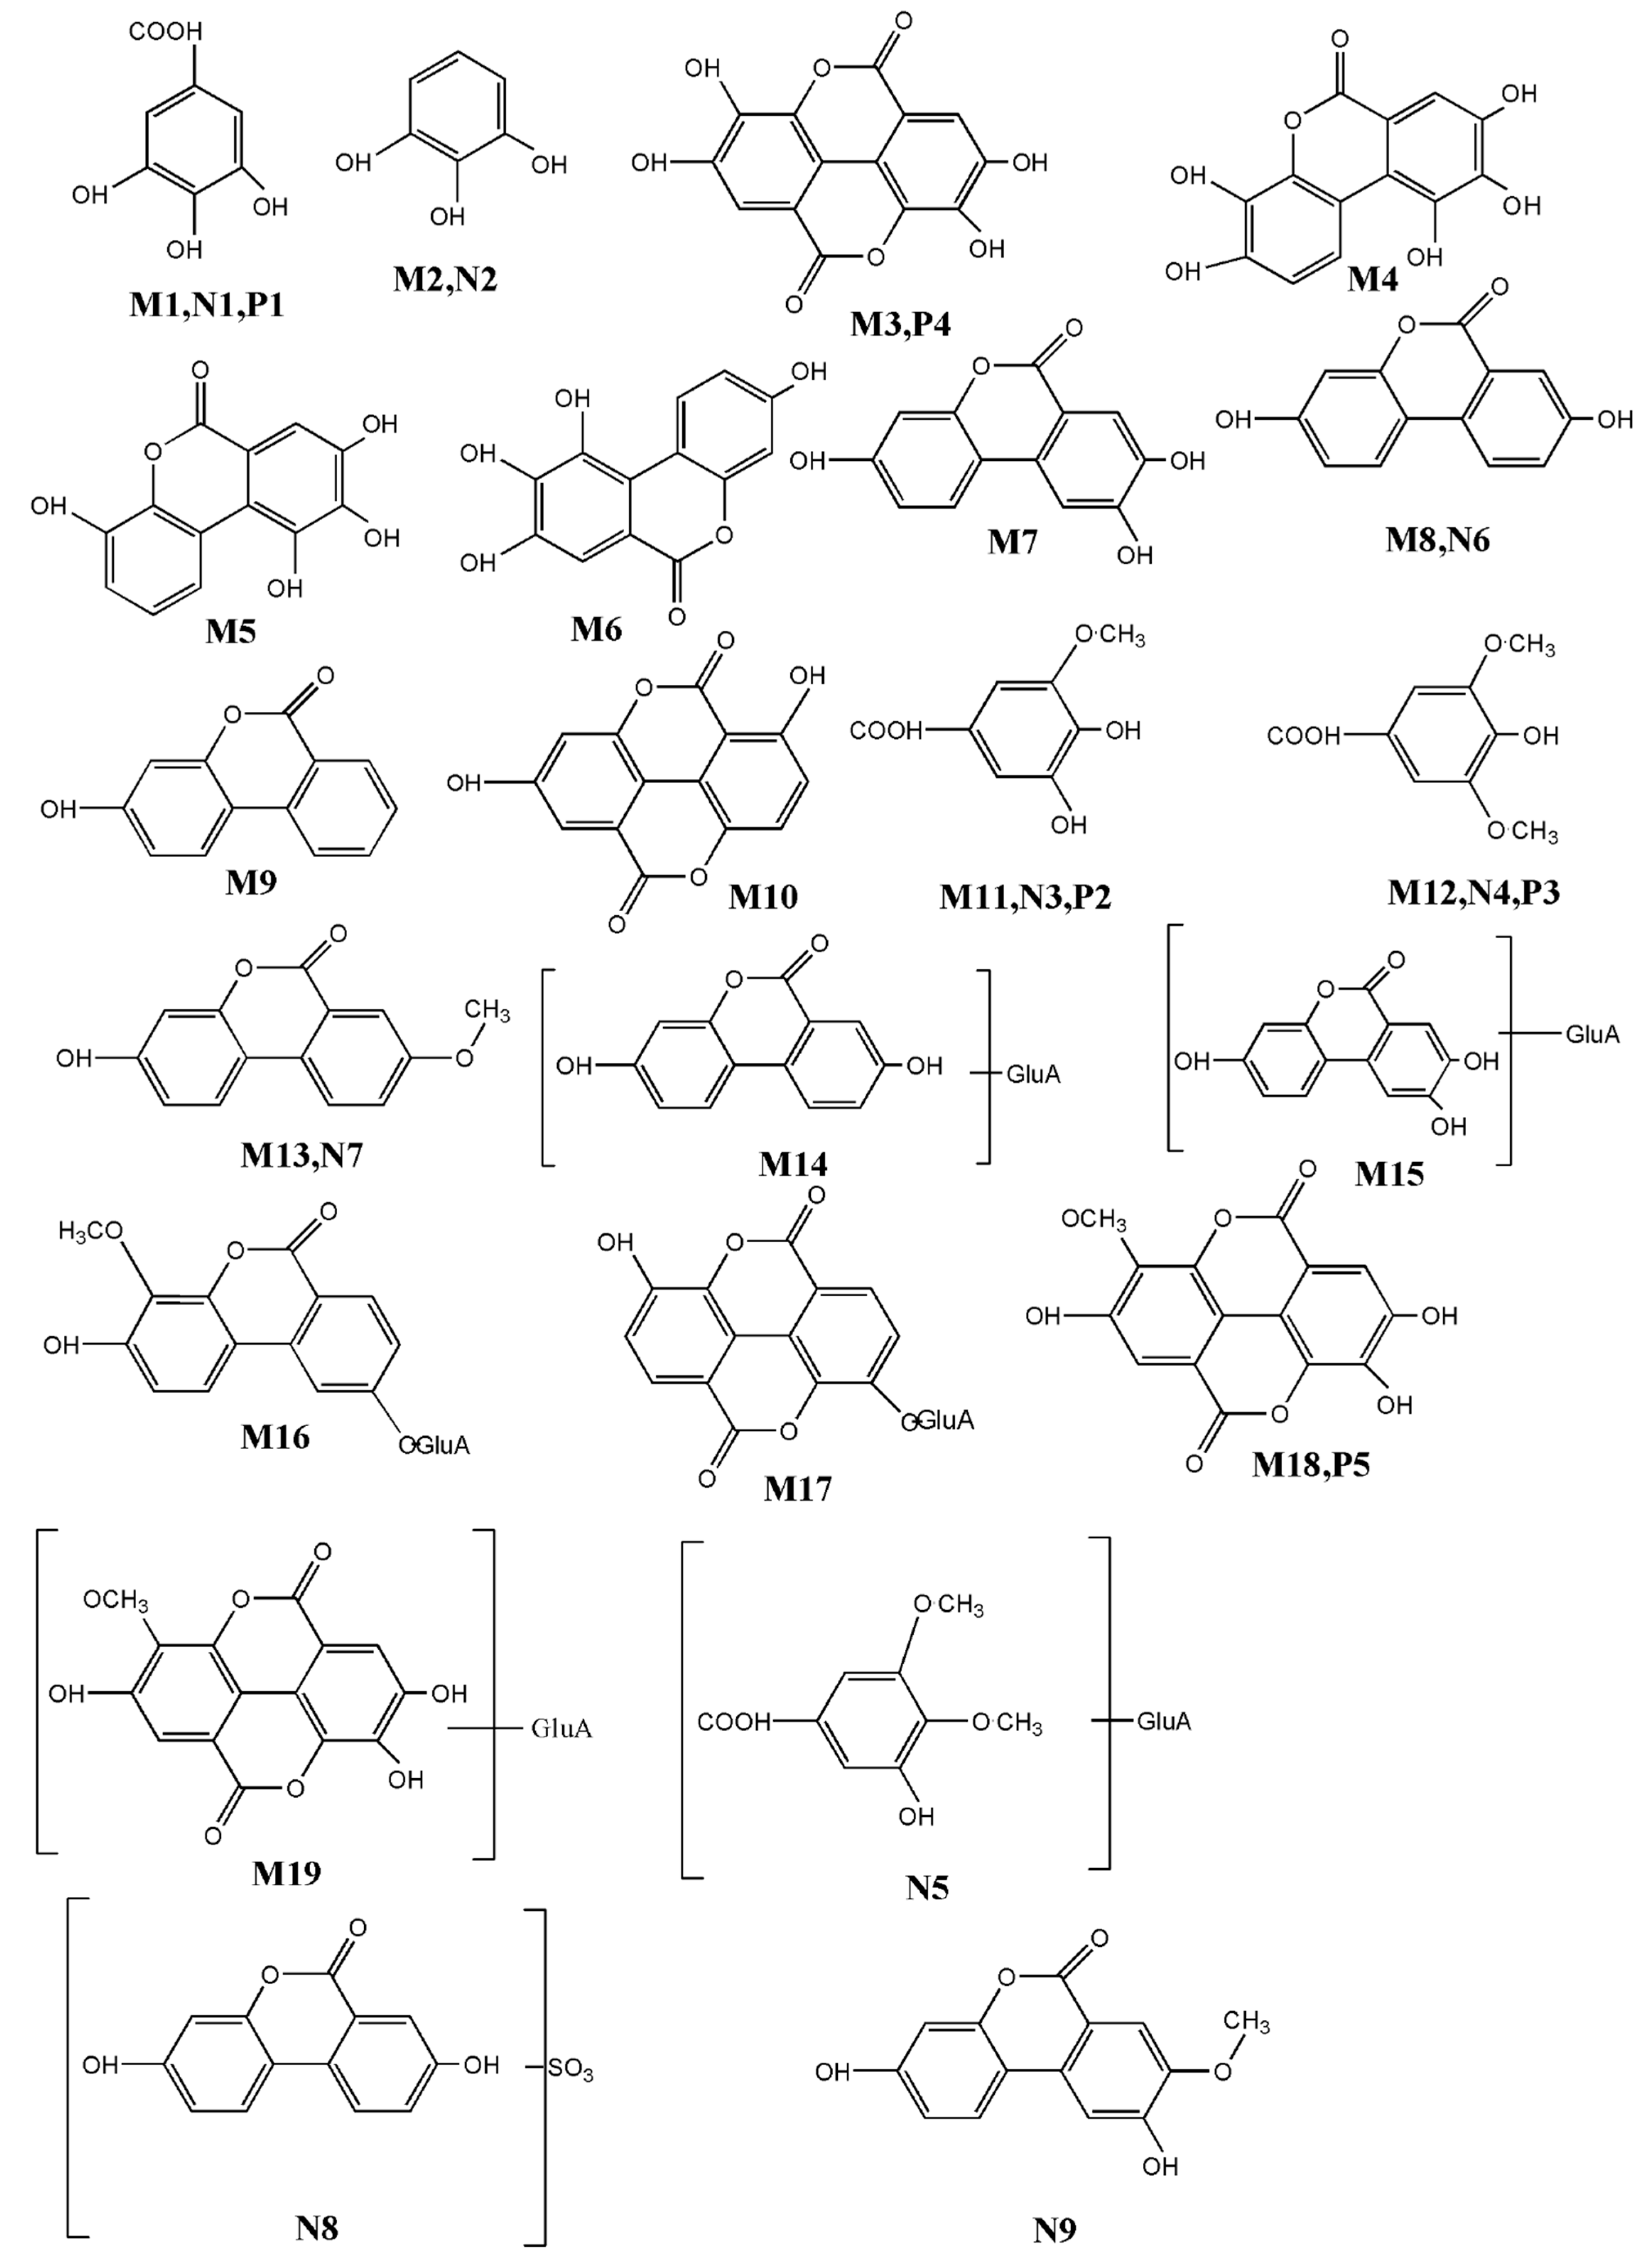
2.4. Identification of Phase I Metabolites In Vivo

1,6-Bis-O-(3,4,5-trihydroxybenzoyl)hexopyranose, Corilagin, and their hydrolyzed metabolites. M1 eluted at 3.1 min and had a [M−H] ion at m/z 169.0148 (C7H5O5, 3.54 ppm). The fragment ion at m/z 125.0241 (C6H5O3) was generated by the loss of CO2 (44 Da) unit. M2 displayed a deprotonated molecular ion [M−H] at m/z 125.0257 (C6H5O3, 2.05 ppm) at 6.7 min. The fragment ion at m/z 81.0345 (C5H5O) was fragmented by the loss of CO2 (44 Da). Based on the mass spectra data and comparison with their reference substances, M1 and M2 were absolutely identified as gallic acid and pyrogallol, respectively [21].
M3 and P4 eluted at 28.1 min and 27.8 min, respectively, and had a [M−H] ion at m/z 300.9996 (C14H5O8, 2.32 ppm). The fragment ions at m/z 283.1526 (C14H3O7) and m/z 257.0825 (C13H5O6) were generated by the loss of H2O (18 Da) unit and CO2 (44 Da) unit from the precursor ion, respectively. Based on the mass spectra data and comparison with their reference substances, M3 was absolutely identified as ellagic acid [22].
Derived metabolites of hydrolysates: M4 exhibited a protonated molecular ion [M−H] at m/z 275.0204 (C13H7O7, 6.08 ppm) at 6.08 min. The fragment ion at m/z 257.0106 (C13H5O6) was occurred via the loss of H2O (18 Da), suggesting that the loss was from the lactone. The fragment ions at m/z 229.0167 (C12H5O5) through the elimination of the CO (28 Da) unit, which were consistent with those of M3. Based on the mass pattern, M4 was tentatively identified as a hydrolyzed product of M3, which indicated that M4 was urolithin M5 (3,4,8,9,10-pentahydroxy-urolithin) [22].
Metabolite M5 and M6 eluted at 25.2 min and 24.4 min, and are isomers that had [M−H] ion at m/z 259.0249 (C13H7O6, 0.38 ppm) and 259.0251 (C13H7O6, 1.16 ppm), respectively. The ion of M5 was at m/z 241.0176 (−18 Da) and its fragment ion was at m/z 213.0223 (−18 Da–28 Da); compared with the molecular ion of M4, there was a reduction by 16 Da. Based on the mass spectra data, it is speculated that M5 and M6 were formed by M4 dehydroxylation. The UV absorption spectrum of M6 shows two absorption peaks in the region of 240–400 nm, with an absorption peak of 349 nm, a second absorption peak of 263 nm, and a third absorption peak of 291 nm, similar to that of M4, and no significant redshift in band II. According to the literature [23], if no hydroxyl group is substituted on the para position (nine-position) of carbonyl group on urolith parent nucleus, there will be a redshift (displacement in the direction of longwave) in band I. Therefore, it is speculated that M6 retains the phenolic hydroxyl group in the para position of the carbonyl group, which is urolith D. The UV absorption spectrum of M5 showed three major absorption peaks in the region of 240–400 nm, respectively, at 251 nm, 275 nm, and 361 nm, with a significant redshift of band 2, compared with M4 (349 nm), suggesting that M5 is a nine-position hydroxyl removal metabolite of M4, which was named urolith M6.
M7 eluted at 28.4 min and had a [M−H] ion at m/z 243.0299 and compared with M6, its fragment ion is reduced by 16 Da. It is preliminarily determined to continue dehydroxylation from the metabolite M6 to obtain M7, and the UV absorption peak was 257 nm, 306 nm, and 345 nm, respectively. Consistent with the literature [24], identified M7 was urolithin C.
Metabolite M8 eluted at 30.4 min and had a [M−H] ion at m/z 227.0358, and its fragment ion decreased by 16 Da, compared with that of M7. It was tentatively identified that M8 was obtained from the metabolite M7 that continued to dehydroxyl, and the UV absorption peak was 238 nm, 306 nm, and 355 nm, respectively. Consistent with the literature [21], M8 was identified as urolithin A.
Metabolite M9 eluted at 38.1 min and had a [M−H] ion at m/z 211.0408, and its fragment ion decreased by 16 Da, compared with that of M8. It was tentatively identified that M9 was obtained from the metabolite M8 that continued to dehydroxyl, and the UV absorption peak was 238 nm, 306 nm, and 355 nm, respectively. Consistent with the literature [21], identified M9 was urolithin B.
The metabolite M10 eluted at 36.7 min and had a [M−H] ion at m/z 269.0424, and its fragment ions were 225.0454 (−16 Da–28 Da) and 197.0649 (−16 Da–28 Da), decreased by 32 Da (2O), compared with the molecular ion 257.0825 and 229.0167 of ellagic acid, speculating that M10 is a metabolite formed after the removal of two hydroxyl groups of ellagic acid, namely, 4, 9-dehydroxy-ellagic acid (Nasutin A) [21].

2.5. Identification of Phase II Metabolites In Vivo

M11 (retention time = 8.9 min) had a [M−H] ion at m/z 183.0294 (C8H7O5, 3.19 ppm). The fragment ion at m/z 169.0049 (C7H5O5) was fragmented by the loss of CH2 (14 Da), indicating that M7 was monomethylated conjugate. Moreover, the fragment ion m/z 125.0126 (C6H5O3) was also observed. The fragmentation pattern of M11 is consistent with the literature [25]. Therefore, M11 was tentatively identified as methylation of M11. Metabolite M12 eluted at 4.2 min and had a [M−H] ion at m/z 197.0460 with 14 Da higher than that of M11; it was speculated that M12 was the metabolite M11 that continued to methylation. Hence, M12 was speculated to be gallic acid dimethyl.
M13 (retention time = 34.3 min) had a [M−H] ion at m/z 241.0513 (C14H9O4, −2.9 ppm). The fragment ions at m/z 210.9041 and 196.9863 were detected; it is speculated that M13 was urolithin A methyl [25].
Metabolites M14, M15, M16, and M17 are glucuronic acid metabolites [25]. Their mass spectrometry all lost 176 Da, which proved to be phase II of combined with glucuronic acid metabolites. Metabolite 14 and 15 eluted at 26.6 min and 26.8 min and had [M−H] ions m/z 402.0678 and 419.0645, respectively. In their negative MS2 spectra, the fragment ions observed were m/z 227.0305 and m/z 243.0314, due to the loss of mass 176 Da corresponding to glucuronic acid. Therefore, metabolites 14 and 15 were urolithin A glucuronide and urolithin C glucuronide, respectively. Metabolite 16, 433.0787 [M−H] was obtained, fragment ions m/z 257.0485 and 243.0256 were obtained, after losing a methyl, the ionic peak of urolith C was obtained. Hence, M16 was identified as urolithin C methyl ether glucuronide. Metabolite M17 eluted at 29.4 min and had a [M−H] ion m/z 445.0792, and the fragment m/z 269.0463 (−176 Da) was obtained, speculating it was a glucuronic acid conjugate of 4,9-dehydroxy-ellagic acid (Nasutin A glucuronide).
Metabolite M18 eluted at 31.8 min and had a [M−H] ion at m/z 315.0140, and its fragment ion was 300.3491 (−15 Da), higher 15 Da (CH3) than ellagic acid, speculating that metabolite M18 was ellagic acid methyl ether. Metabolite M19 eluted at 25.8 min and had a [M−H] ion at m/z 491.0013, and its fragment ion was 315.0128 (−176 Da), decreasing 176 Da (C6H9O6) compared with M18, which proved to be phase II of combined with glucuronic acid metabolites; hence, Metabolite M19 was ellagic acid methyl ether glucuronide.

2.6. The Identification and Characterization of Metabolites In Vitro

Some metabolites in intestinal microbiota, liver microsomes, and liver cytosol can also be detected in vivo metabolism; moreover, new compounds were detected in vitro metabolism, proving that in vitro–in vivo metabolism is different. For example, metabolite N5, metabolite N8, and metabolite N9 were detected in intestinal microbiota.

2.7. Identification of Phase II Metabolites
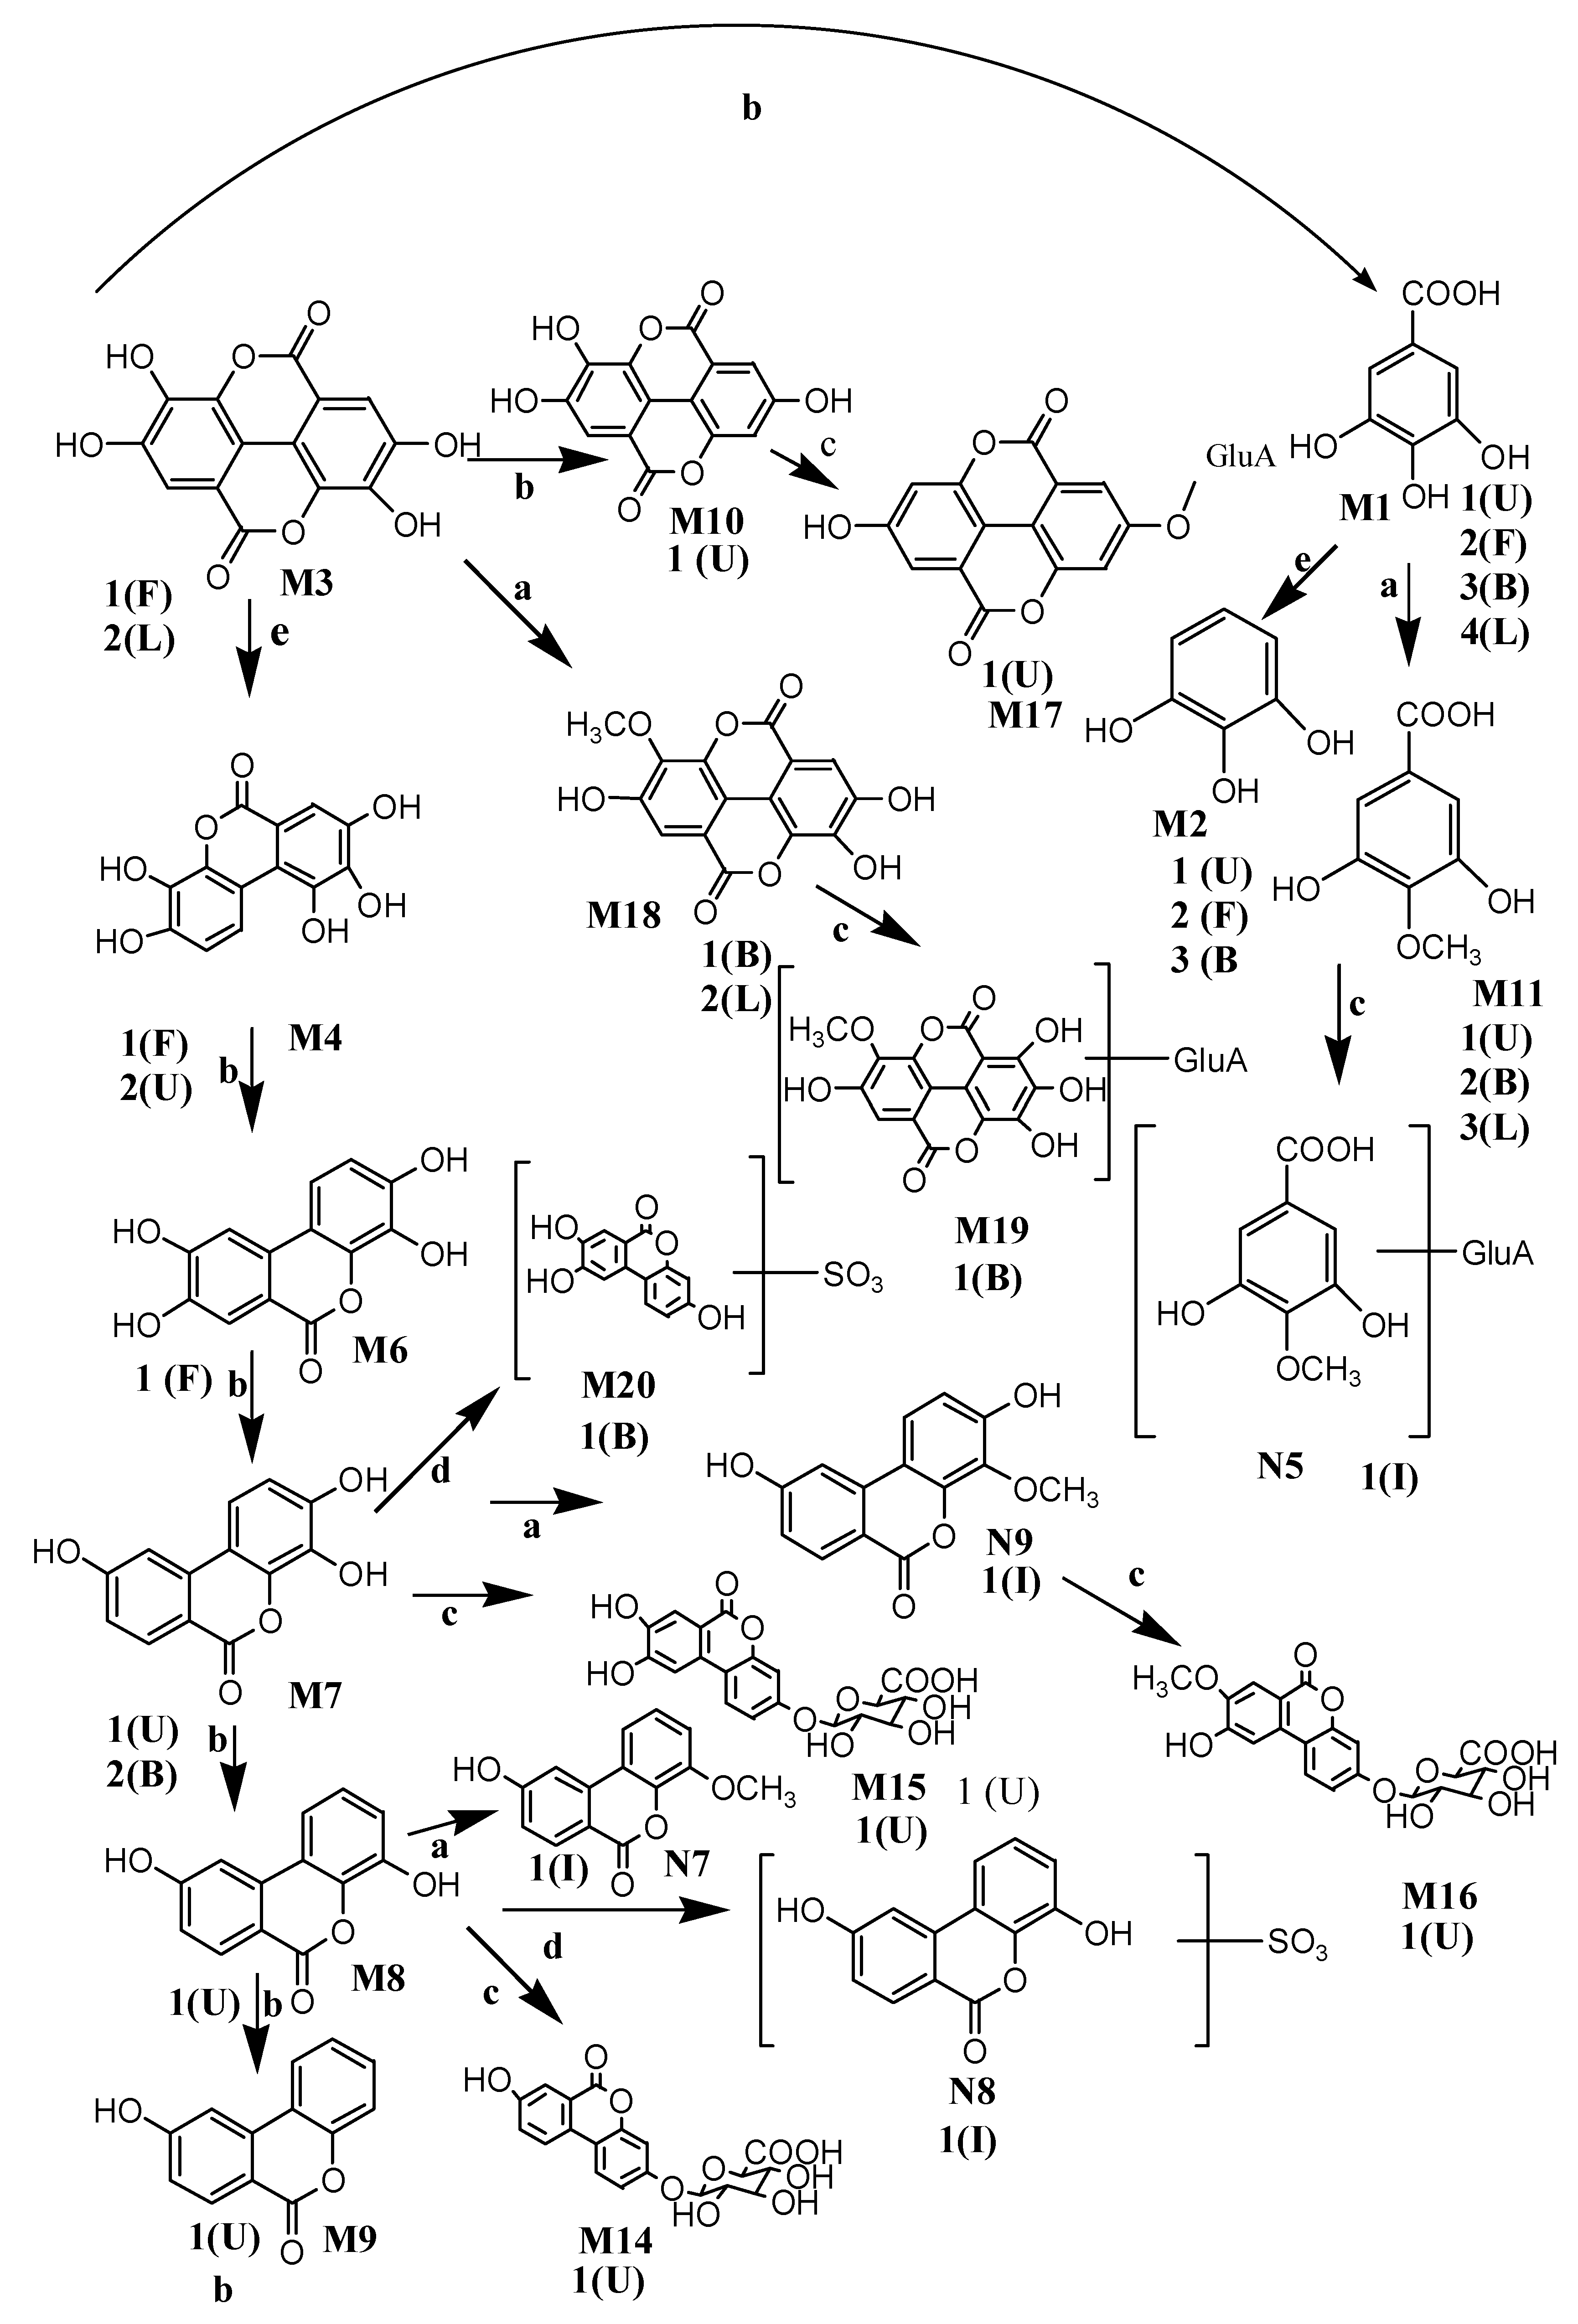
Its mass spectrometry lost 176 Da, which proved to be phase II of combined with glucuronic acid metabolites. Metabolite N5, eluted at 9.6 min, had a [M−H] ion m/z 359.0264. In the negative MS spectra, the fragment ions observed were m/z 183.0205 and m/z 169.1322, due to the loss of mass 176 Da, corresponding to glucuronic acid. Therefore, metabolite N5 was gallic acid methyl ether glucuronide.
Metabolite N8 showed the HPLC profile with the retention time at 8.5 min and had the [M−H] ion at m/z 309.9918, and the fragment ions was 227.0374 (−80 Da), decreased by 80 Da (SO3) compared with the urolithin A, which indicated that N8 was sulfate conjugation metabolite.
N9 (retention time = 37.8 min) had a [M−H] ion at m/z 257.0458 (C14H10O5, 0.78 ppm). The fragment ion at m/z 243.0276 (−14 Da) was obtained. Moreover, the fragment ion m/z 215.0385 (C12H8O4) was also observed. Therefore, N9 was urolithin C methyl.

3. Discussion

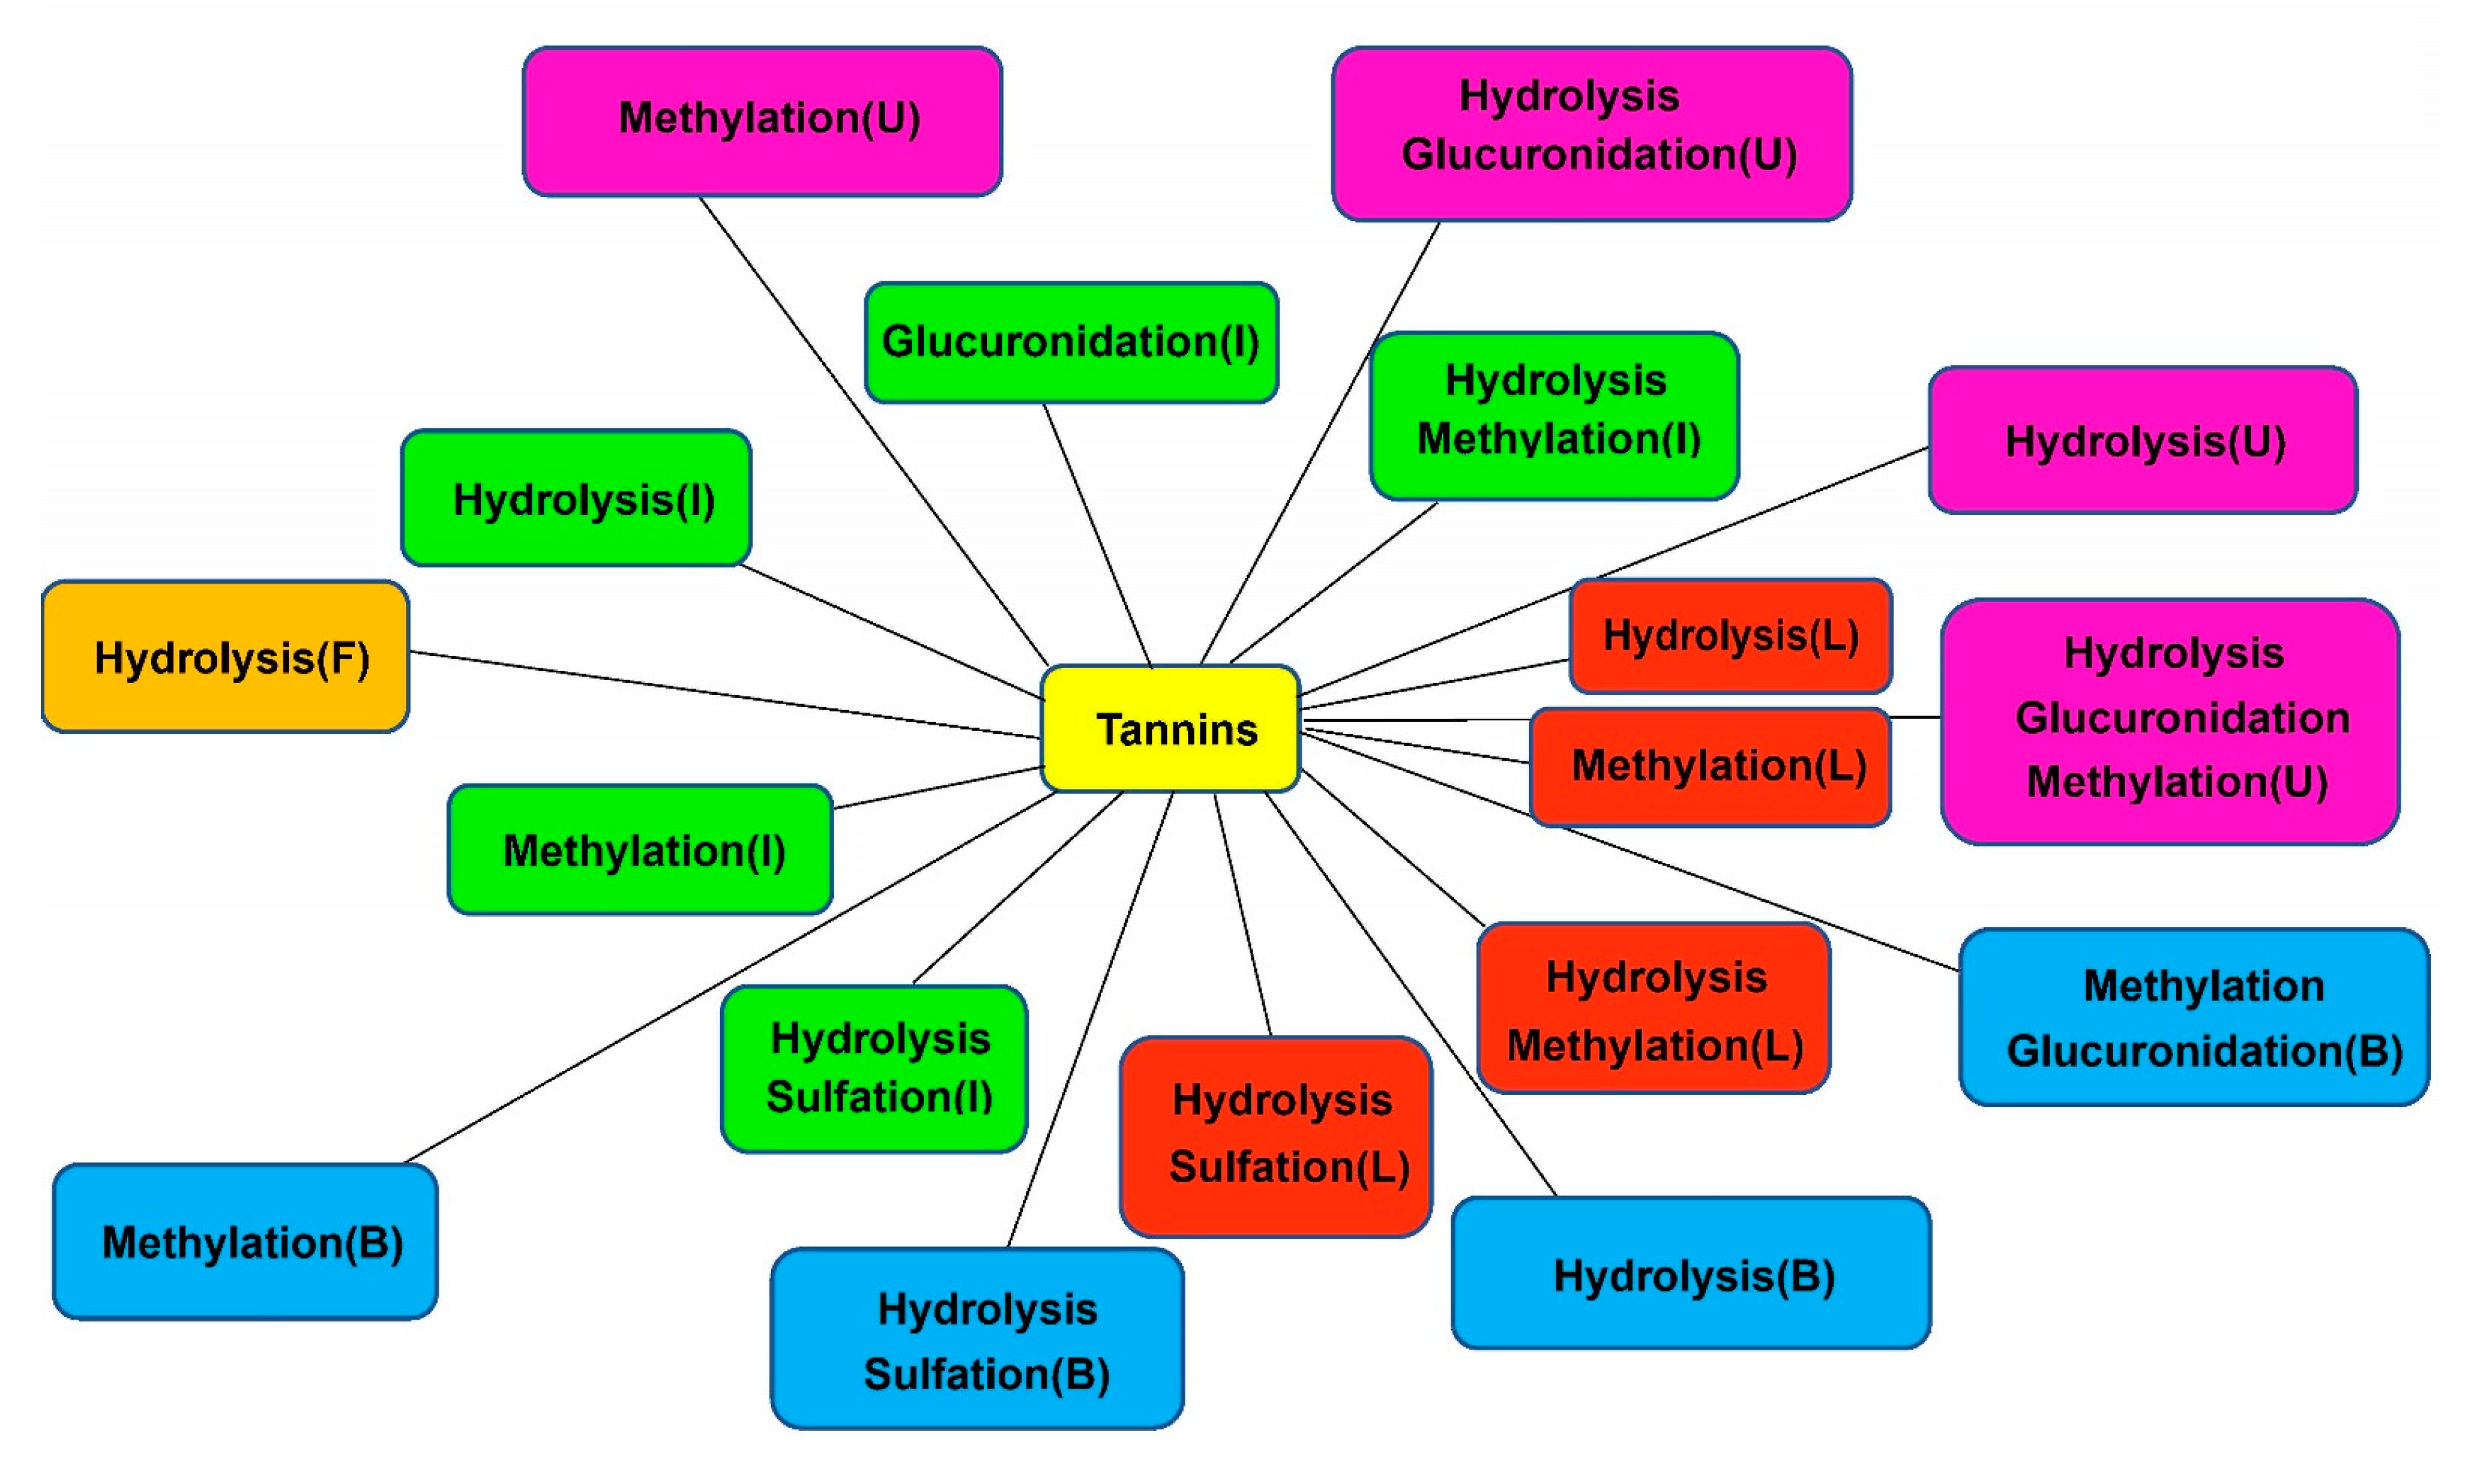
3.1. Metabolic Pathways of Sanguisorba Tannins

The metabolism of Sanguisorba tannins in rats after oral administration in vivo (plasma, urine, bile, feces, and tissues) and in vitro (liver microsomes, liver cytosol, and intestinal microbiota) through incubation was elaborated in this study. Results are presented in what follows.
HPLC–LTQ–Orbitrap MS2 identified 19 metabolites in rats, including 4 metabolites from plasma, 9 metabolites from bile, 10 metabolites from urine, 5 metabolites from feces, 1 metabolite from kidney, 5 metabolites from liver microsomes and cytosol, and 9 metabolites from intestinal microbiota. According to the main components in the alcohol extract of Sanguisorba tannins contained and the structures of its metabolites, it can be inferred that after oral administration of tannins, it rapidly decreased in the blood, entered the liver, and expelled from bile, during which nine metabolites were detected. Figure 6 shows the proposed metabolic profiles of Sanguisorba tannins in rats, in liver microsomes, and intestinal microbiota, respectively. Gallic acid and ellagic acid were detected in liver microsomes and cytosol, and their conjugation of methyl was also detected, then absorbed into the blood and excrete from bile for the next metabolic reaction. M4–M10 were dehydroxylation metabolites of phase I, which were mainly detected in feces. Eventually, urolithin A is formed in feces. The phase II metabolites were urolithins of their derivatives and the combination with glucuronic acid, which were mainly detected in urine. Among them, urolithin A was also detected in intestinal microbiota; it is speculated that after oral sanguisorba tannins, the metabolites of phase I appeared first in intestinal microbiota, and a kind of smaller polarity such as urolithins was formed, then absorbed into the body; afterward, conjugation of phase II was formed, which became more polar and excreted from the urine. These results manifested that tannins mainly underwent reduction, hydrolysis, glucuronide conjugation, sulfate conjugation, and methylation changes. It should be noted that reduction reactions were the main metabolic steps. The conversion was further carried out by sulfation, followed by glucuronidation.

3.2. Comparison of Metabolites In Vitro and In Vivo

Metabolism research plays an important role in understanding the configuration of food and drugs and provides a basis for the study of the safety and toxicity of food and drugs [26]. The approach in vivo is quantitative and very effective in drug metabolism studies [27]. However, because of complex biomatrix, drug metabolites are often difficult to characterize in vivo [28]. Therefore, in vitro metabolic model is necessary to avoid the influence of other biomatrixes on metabolism in vivo. The identification of in vitro metabolites can supplement in vivo metabolites in complex biological samples. In vitro, culture methods are generally applicable to targeted studies and often predict the risk of real harm [29].
Sanguisorba tannins are the main tannins in Sanguisorba, play the main role in Sanguisorba, and have made a great contribution to the biological activity of Sanguisorba. However, research on its metabolic transport modes and pathways in the body is relatively weak, and the biotransformation of Sanguisorba tannins is mostly focused on hydrolyzable tannins. Research on the metabolism of condensed tannins in the body is relatively superficial. What is the relationship between the metabolic mechanism of Sanguisorba tannins in the body and the performance of its pharmacological activities? It needs further investigation.

4. Materials and Methods

4.1. Plant Materials

The dried Sanguisorba (FY2048) about 1 kg was collected at FEIYUBIO medicine market from Hubei Province, China, in June 2018, identified as Sanguisorba by Professor Zhang Hong of Wuhan University, ground to a fine powder in a grinder, passed through a 60-mesh (pore size in 0.25 mm) sieve and stored at 4 °C until analysis.

4.2. Chemicals and Materials

The authentic standards of ellagic acid (EA), pyrogallol, and gallic acid (GA) were purchased from the Chengdu MUST Bio-Technology CO. Ltd. (Chengdu, China), phosphate-buffered saline (PBS, pH = 7.4, 0.01 M), HPD resin was purchased from Tianjin Baowen Chemical Technology CO. Ltd. (Tianjin, China), anaerobic bags (AnaeroPouch Anaero, Mitsubishi Gas Chemical Company Inc., Tokyo, Japan), GAM broth medium was bought from Qingdao Haibo Biology CO. Ltd. (Qingdao, China), β-nicotinamide adenine dinucleotide phosphate (NADP), glucose-6-phosphate (G-6-P), glucose-6-phosphate dehydrogenase (G-6-PD), dithiothreitol, and S-adenosyl-L-methionine (SAM) were obtained from Sigma Chemical CO. (St. Louis, MO, USA). Acetonitrile, methanol, and formic acid were of HPLC-grade, which were purchased from Thermo Fisher Scientific CO. Ltd. (Waltham, MA, USA). Purified water was prepared by using Milli-Q System (Millipore, Billerica, MA, USA). All other analytical-grade reagents were provided by the Sinopharm Chemical Reagent CO. Ltd. (Shanghai, China).

4.3. Instrumentations and Investigation Conditions

Separation was carried out on a Welch Ultimate XB-C18 HPLC column (250 × 4.6 mm, 5 µm) at 35 °C. The mobile phase system was composed of acetonitrile (A) and 0.1% formic acid aqueous solution (B). The gradient program was used as follows: 0–20 min, 95% B; 20–25 min, 95–80% B; 25–30 min, 80–70% B; 30–45 min, 70–95% B. The flow rate was set at 0.80 mL/min. Two microliters supernatant samples were injected into LTQ–Orbitrap XL mass spectrometer system (Thermo Scientific, Bremen, Germany) for analysis.
The operating conditions of mass spectrometry were as follows: electrospray ionization (ESI) source was employed, and positive and negative ion mode were selected; sheath gas flow, 40 A.U.; auxiliary gas flow, 20 and 10 A.U.; source voltage 3.8 kV; capillary temperature of 300 °C; capillary voltage 25 and −35 V; tube lens, 110 and −110 V. The samples were analyzed using FT full scan with mass in the m/z 100–1500 range. All the raw data were processed using Xcalibur 3.0 software19 (Thermo Fisher Scientific, Waltham, MA, USA).

4.4. Sample Preparation and Pretreatment

4.4.1. Extraction and Purification of the Total Tannins from Sanguisorba

According to the assay reported by [30], ultrasonic (Ningshang Ultrasonic Instrument CO. Ltd. Shanghai, China) assisted ethanol extraction of crude polyphenols was used. Preweighed amounts of Sanguisorba powder were placed into a volumetric flask (100 mL), soak dry ground Sanguisorba powder for 20 g with 70% ethanol solution at 20:1 solvent-to-sample ratio (v/w), and the extraction was placed in an ultrasonic cleaning bath at 40 °C for 1 h. Then, filtered through 0.22 μm filter paper to obtain the filtrate, while the residue was extracted again under the same extraction conditions, collected together with the filter, and concentrated by rotary vacuum evaporator (IKA-Werke-GmbH & CO., Staufen, Germany) to obtain the powders. Refer to the purification and separation methods [31] summarized in the previously published results of the research group. The HPD-400 macroporous resin column (Macklin biochemical CO. Ltd., Shanghai, China) was used for purification. Briefly, the crude polyphenolic extract was dissolved in sterile water to obtain the final concentration of 1 mg/Ml. Then, the concentrate was loaded into HPD-400 macroporous adsorption resin column (16 × 300 mm) at a flow rate of 2 mL/min. The final eluent was collected, concentrated by rotary vacuum evaporator, and freeze dried to obtain the tannic powder of Sanguisorba and kept sealed in the dark.

4.4.2. Quantitation and Chemical Analysis of Total Tannins from Sanguisorba

After purified by HDP-400 macroporous resin column, the content of the total tannins in the final product was measured according to the spectrophotometric method from the Chinese Pharmacopoeia, 2010 edition. The total tannins were slightly modified according to the Folin–Ciocalteu method [32]. In brief, 0.2 mL of the extract (2 mg/mL) was mixed with 1 mL of the Folin–Ciocalteu’s reagent and 2 mL of 150 mg/mL Na2CO3. The 10 mL volumetric flasks were shaken and allowed to stand for 2 h at room temperature. The absorbance was measured with a spectrophotometer (Shimadzu CO., Tokyo, Japan) at 765 nm against a reagent blank and gallic acid was used as the standard with the contraction ranging from 2.909 to 6.545 μg/mL. All assays were run in three replicates. The total tannin content value was expressed as milligrams of gallic acid equivalents (GAE) per gram of dry weight (DW) (mg GAE/g DW). The method of determining nonadsorbed phenol content was the same as the determination of total phenol content, except that 0.6 g of casein was added to the sample. As a result, the total tannin content is total phenol content minus nonadsorbed phenol content, which is 65.5%.

4.5. Animal Experiments

The male Sprague Dawley (SD) rats, aged 6 weeks (200–220 g), were obtained from the Center of Experimental Animals of Medical College, Wuhan University. The rats were housed in the SPF breeding house of the animal experiment center of the people’s hospital of Wuhan university (temperature: 22–25 °C, relative humidity: 55–60%, light/dark cycle for 12 h) for seven days. All rats were fed on a standard pellet diet without tannins and water was freely available.
Sanguisorba tannins were suspended in saline. The 72 rats were randomly divided into 12 groups with 6 rats in each group (group 1, the blank plasma sample group; group 2, the experimental plasma sample group; group 3, the blank bile sample group; group 4, the experimental bile sample group; group 5, the blank urine and feces sample group; group 6, the experimental urine and feces sample group; group 7, the blank liver microsomes and cytosol sample group; group 8, the experimental liver microsomes and cytosol sample group; group 9, the blank intestinal microbiota sample group; group 10, the experimental intestinal microbiota sample group; group 11, the blank tissues sample group; group 12 the experimental tissues group). Before the experiment, the rats in the 12 groups fasted for 12 h with free access to water. The rats in vivo experiments group were orally administered Sanguisorba tannins at a single dose of 150 mg/kg (crude drug weight/rat weight). At the same time, saline was orally administered as blank control group rats. The rats in vitro experiments group, liver microsomes and cytosol, intestinal microbiota were incubated with Sanguisorba tannins (100 mg/mL, suspended in saline).

4.6. Sample Preparation

4.6.1. Sample Collection and Pretreatment In Vivo

Plasma samples collection: After gavage, 200 μL of blood was obtained from the canthus in rats at 0, 1.5, 4, 10, 20, 40, 60, 90, 120, 180, and 240 min. The blood with three volumes of acetonitrile was centrifuged at 4500 rpm for 5 min, then the supernatant was centrifuged at 10,000 rpm/min for 15 min, and the supernatant was taken [33].
The urine and feces collection: a total of 12 rats were divided into two groups at random and housed in individual stainless steel metabolic cages designed for the separation and collection of urine and feces. Urine and feces were collected for 72 h post dosing. After measuring the volume of urine samples and dry weight of feces samples, an aliquot of 3 mL mixed urine was prepared using Grace Pure solid-phase extraction (SPE) C18 columns (Deerfield, IL, USA). Prior to sample preparation, SPE columns were conditioned using 5 mL methanol and subsequent 5 mL deionized water. Then, urine was loaded on the SPE cartridge, rinsed with 5 mL of deionized water, and eluted with 3 mL of methanol. The methanol eluent was collected and then evaporated to dryness at 40 °C under a gentle stream of nitrogen. Finally, the residues were redissolved using 100 μL 5% acetonitrile and vortex-mixed for 3 min. The 1 g of dried feces were dissolved with deionized water with ultrasonic processing for 60 min, after which the supernatant was collected after centrifuging at 3500 rpm/min for 10 min and concentrated [34].
The bile collection: The rats were orally administered drugs and then anesthetized with 2% pentasorbital sodium (45 mg/kg); the cannulas were surgically inserted into the bile duct to collect bile. An aliquot of 50 μL mixed bile samples were collected before dosing and during 0–4, 4–8, 8–12, 12–24, 24–36, and 36–48 h after dosing. The bile with three volumes of acetonitrile was centrifuged at 10,000 rpm/min for 5 min [35]. The study was carried out in compliance with the ARRIVE guidelines. (https://arriveguidelines.org, accessed on 13 July 2018).
The tissues collection: The rats were sacrificed 4 h after oral administration then anesthetized with 2% pentasorbital sodium (45 mg/kg), collected heart, liver, spleen, lung, kidney, stomach, and small intestine. All tissue samples were washed with saline to remove the blood and content, blotted on filter paper, weighed, and were added three volumes of saline for homogenate. Equal volume methanol was added to the homogenate and vortex-mixed for 1 min, then centrifuged at 10,000 rpm/min for 15 min, and the supernatant was collected. The organic phase was dried and extracted with ethyl acetate and centrifuged at 3000 rpm/min for 5 min, the ethyl acetate phase was extracted by the same method, and the organic phase was evaporated to dryness. Finally, the residues were redissolved by using 100 μL 5% acetonitrile and vortex-mixed for 3 min [36]. The study was carried out in compliance with the ARRIVE guidelines. (https://arriveguidelines.org, accessed on 13 July 2018).
All biological samples were stored at −80 °C and filtered through a 0.45 μm membrane filter until analysis.

4.6.2. Sample Preparation and Treatment In Vitro

Preparation of liver microsomes and cytosol: Rat liver microsomes and cytosol were prepared by previous methods [37]. After anesthetized with 2% pentasorbital sodium (45 mg/kg), the liver of the rats was taken, rinsed with ice-cold normal saline, weighed, and homogenized in 0.1 mM phosphate buffer (pH7.4) containing 0.25 M sucrose. The homogenate was centrifuged at 4 °C for 30 min (10,000× g), and the supernatant was centrifuged at 4 °C for 60 min (105,000× g). The supernatant was liver cytosol and the precipitation was liver microsomes. The protein content was determined by the BCA method [37]. The study was carried out in compliance with the ARRIVE guidelines. (https://arriveguidelines.org, accessed on 13 July 2018).
The rat liver microsomes incubation was prepared as follows: 100 μM Sanguisorba tannins, 1.3 mM NADP, 3.3 mM G-6-P, 0.4 U/mL G-6-P-D, 3.3 mM magnesium chloride. The incubation system was achieved with Tris/KCl buffer (pH 7.4) and its volume was 250 μL. After preincubation for 5 min at 37 °C, add NADPH mixture to start the reaction, which including 1.3 mM NADP, 3.3 mM G-6-P, 0.4 U/mL G-6-P-D, and 3.3 mM magnesium chloride. Incubated at 37 °C for two hours and add equal volume acetonitrile to terminated the reaction. The incubation was centrifuged at 10,000× g for 10 min, the supernatant evaporated to dryness at 40 °C under a gentle stream of nitrogen. The residues were dissolved with 80 μL acetonitrile, and 20 μL aliquot was analyzed by HPLC–LTQ–Orbitrap MS2.
The optimal incubation conditions (200 μL reaction volume) for rat liver cytosol were as follows: 100 μM Sanguisorba tannins, 5 mM magnesium chloride, 1 mM dithiothreitol, and 300 μM SAM. The incubation system was achieved with Tris/KCl buffer (pH 7.4), and its volume was 200 μL. After preincubation for 5 min at 37 °C, add rat liver cytosol to start the reaction. Incubated at 37 °C for two hours and add equal volume acetonitrile to stop the reaction. The incubation was centrifuged at 10,000× g for 10 min, the supernatant evaporated to dryness at 40 °C under a gentle stream of nitrogen. The residues were dissolved in an 80 μL acetonitrile, and 30 μL aliquot was analyzed by HPLC–LTQ–Orbitrap MS2.
Preparation of rat intestinal microbiota: Anaerobic culture medium was prepared as follows: K2HPO4 (37.5 mL, 0.78%), solution A (37.5 mL, 0.47% KH2PO4, 1.18% NaCl, 1.2% (NH4)2SO4, 0.12% CaCl2, and 0.25% MgSO4·H2O), Na2CO3 (50 mL, 8%), L-cysteine (0.5 g), L-ascorbic acid (26 mL, 25%), eurythrol (1 g), tryptone (1 g), and nutrient agar (1 g) were mixed together and diluted with distilled water to 1000 mL. The solution was then adjusted to pH 7.5–8.0 with 2 M HCl [38]. Fresh feces collected from Sprague Dawley rats were immediately homogenized in normal saline solution at a ratio of 1 g to 4 mL. The homogenate was filtered, and the filtrate of fresh feces (10 mL) was added to an anaerobic culture medium (90 mL) to obtain an intestinal microbiota cultural solution.
The rat intestinal microbiota incubation was prepared as follows: 100 μM Sanguisorba tannin was added to the intestinal microbiota cultural solution (200 μL). After incubation for 0, 2, 4, 6, 12, 24, 36, 48, and 72 h at 37 °C in an anaerobic environment, equal volume acetonitrile was added to terminate the reaction. The incubation was centrifuged at 10,000× g for 10 min, the supernatant evaporated to dryness at 40 °C under a gentle stream of nitrogen. The residues were dissolved in an 80 μL acetonitrile, and 30 μL aliquot was analyzed by HPLC–LTQ–Orbitrap MS2.

5. Conclusions

In conclusion, using HPLC–LTQ–Orbitrap MS2 for analysis, high-resolution mass spectrometry solves the deficiencies of the above methods by virtue of its ultra-high resolution and accurate mass function, especially for multicomponent screening. Additionally, a variety of post-acquisition data mining tools were used. This method has good sensitivity and selectivity and is suitable for qualitative analysis for screening purposes; the metabolites in vivo and in vitro of Sanguisorba tannins were successfully identified. A total of 19 metabolites in vivo and 14 metabolites in vitro were recognized in this study; no active drug, ellagic acid, or other metabolites were detected in rat plasma; after the treatment of the tissues, no active drug or metabolites were detected in them, but ellagic acid was detected in the liver and methyl ether glucuronide in the kidney. Moreover, seven metabolites in vitro were also found in vivo; N5, N8, and N9 were detected in vitro but not found in vivo, which indicated metabolic mechanism between in vivo and in vitro was different. The basic metabolic changes that occurred in rats were reduction, which provides a basis for other metabolic reactions such as glucuronide conjugation, sulfate conjugation, and methylation. Finally, the metabolic profile of Sanguisorba tannins was reviewed. High-performance liquid chromatography–mass spectrometry, combined with various data processing techniques, provides valuable information for the identification of metabolites.
Sanguisorba tannins were the main content in Sanguisorba, which have drawn growing attention due to the prominent biological activities of its metabolites. For example, urolithin A, C, and D can reduce the accumulation of triglyceride, reducing the risk of animation atherosclerosis [39]; urolithiasis A and its sulfate conjugation may protect against breast cancer [40]; urolithin A has anti-inflammatory and antioxidant effects of [41]; urolithin A glucuronide and its aglycone urolithin A ameliorate TNF-alpha-induced inflammation [42], which made a great contribution to biological activity. We hope that the strategies developed in this study and the results achieved in this study will be helpful for future studies on the effectiveness and safety of tannins in Sanguisorba. Based on the analysis of its metabolites, the tannin’s metabolism and transport pathway can be speculated in vivo, which further elucidated the mechanism of its role.
However, there are many restrictions. The components of traditional Chinese medicine are complex, not a single ingredient, and therefore, it was not possible to trace the metabolic pathways of individual components in the body. Only by combining in vivo and in vitro, by detecting the metabolites in different organs, we can analyze and detect the metabolic pathways in the body. Further study on the activity of its metabolites will be carried out in the following part to provide the basis for the development and utilization of new drugs.

Author Contributions

Conceptualization, Q.L.; methodology, J.T.; validation, J.T., Q.L. and B.Z.; formal analysis, J.T.; investigation, J.T.; resources, J.T.; data curation, J.T.; writing—original draft preparation, J.T.; writing—review and editing, J.T.; visualization, J.T.; supervision, B.Z.; project administration, B.Z.; funding acquisition, B.Z. All authors have read and agreed to the published version of the manuscript.

Funding

This research was funded by National Natural Science Foundation of China, grant number No.31770381.

Institutional Review Board Statement

The committee for experimental animals of Wuhan University approved all experimental procedures, and the procedures complied with the Guidelines for the Care and Use of Laboratory Animals. Laboratory Animal Welfare & Ethics Committee approved this research (No. 20180713).

Informed Consent Statement

Informed consent was obtained from all subjects involved in the study.

Data Availability Statement

The data presented in this study are available in this article.

Conflicts of Interest

The authors declare no conflict of interest associated with this publication and there has been no financial support for this work that could have influenced its outcome.

Sample Availability

Samples of the Sanguisorba tannins are available from the authors.

References

  1. Zhao, Z.; He, X.; Zhang, Q.; Wei, X.; Huang, L.; Fang, J.C.; Wang, X.; Zhao, M.; Bai, Y.; Zheng, X. Traditional Uses, Chemical Constituents and Biological Activities of Plants from the Genus Sanguisorba L. Am. J. Chin. Med. 2017, 45, 199–224. [Google Scholar] [CrossRef]
  2. Karkanis, A.C.; Fernandes, Â.; Vaz, J.; Petropoulos, S.A.; Georgiou, E.; Ciric, A.; Sokovic, M.; Oludemi, T.; Barros, L.; Ferreira, I.C.F.R. Chemical composition and bioactive properties of Sanguisorba minor Scop. under Mediterranean growing conditions. Food Funct. 2019, 10, 1340–1351. [Google Scholar] [CrossRef] [PubMed] [Green Version]
  3. Karkanis, A.; Vellios, E.; Thomaidis, T.; Bilalis, D.; Efthimiadou, A.; Travlos, I. Phytochemistry and Biological Properties of Burnet Weed (Sanguisorba spp.): A Review. Not. Sci. Biol. 2014, 6, 395–398. [Google Scholar] [CrossRef] [Green Version]
  4. Shikov, A.N.; Narkevich, I.A.; Flisyuk, E.V.; Luzhanin, V.G.; Pozharitskaya, O.N. Medicinal plants from the 14th edition of the Russian Pharmacopoeia, recent updates. J. Ethnopharmacol. 2021, 268, 113685. [Google Scholar] [CrossRef] [PubMed]
  5. Honda, T.; Rounds, B.V.; Bore, L.; Finlay, H.J.; Favaloro, F.G.; Suh, N.; Wang, Y.P.; Sporn, M.B.; Gribble, G.W. Synthetic oleanane and ursane triterpenoids with modified rings A and C: A series of highly active inhibitors of nitric oxide produc-tion in mouse macrophages. J. Med. Chem. 2000, 43, 4233–4246. [Google Scholar] [CrossRef] [PubMed]
  6. Li, W.; Yang, C.-J.; Wang, L.-Q.; Wu, J.; Dai, C.; Yuan, Y.-M.; Li, G.Q.; Yao, M.-C. A tannin compound from Sanguisorba officinalis blocks Wnt/β-catenin signaling pathway and induces apoptosis of colorectal cancer cells. Chin. Med. 2019, 14, 22. [Google Scholar] [CrossRef] [Green Version]
  7. Taylor, J.; Taylor, J.R.N.; Belton, P.S.; Minnaar, A. Kafirin microparticle encapsulation of catechin and sorghum condensed tannins. J. Agric. Food Chem. 2009, 57, 7523–7528. [Google Scholar] [CrossRef]
  8. Yano, T.; Ohmori, K.; Takahashi, H.; Kusumi, T.; Suzuki, K. Unified approach to catechin hetero-oligomers: First total synthe-sis of trimer EZ–EG–CA isolated from Ziziphus jujube. Org. Biomol. Chem. 2012, 10, 7685–7688. [Google Scholar] [CrossRef]
  9. Cala, O.; Pinaud, N.; Simon, C.; Fouquet, E.; Laguerre, M.; Dufourc, E.J.; Pianet, I. NMR and molecular modeling of wine tan-nins binding to saliva proteins: Revisiting astringency from molecular and colloidal prospects. FASEB J. 2010, 24, 4281–4290. [Google Scholar] [CrossRef]
  10. Chen, H.F.; Tanaka, T.; Nonaka, G.I.; Fujioka, T.; Mihashi, K. Hydrolyzable tannins based on a triterpenoid glycoside core, from Castanopsis-hystrix. Phytochemistry 1993, 32, 1457–1460. [Google Scholar]
  11. Bae, Y.-S.; Burger, J.F.; Steynberg, J.P.; Ferreira, D.; Hemingway, R.W. Flavan and procyanidin glycosides from the bark of blackjack oak. Phytochemistry 1994, 35, 473–478. [Google Scholar] [CrossRef] [Green Version]
  12. Li, Z.; Zhou, M.; Tan, T.; Zhong, C.C.; Wang, Q.; Pan, L.L.; Luo, Y.Y.; Yang, S.L.; Feng, Y.L.; Ouyang, H. A Sample and Sen-sitive HPLC-MS/MS Method for Simultaneous Determination of Ziyuglycoside I and Its Metabolite Ziyuglycoside II in Rat Pharmacokinetics. Molecules 2018, 23, 543. [Google Scholar] [CrossRef] [PubMed] [Green Version]
  13. Yisimayili, Z.; Guo, X.; Liu, H.; Xu, Z.; Abdulla, R.; Aisa, H.A.; Huang, C. Metabolic profiling analysis of corilagin in vivo and in vitro using high-performance liquid chromatography quadrupole time-of-flight mass spectrometry. J. Pharm. Biomed. Anal. 2019, 165, 251–260. [Google Scholar] [CrossRef]
  14. Ma, J.Y.; Zhou, X.L.; Fu, J.; He, C.Y.; Feng, R.; Huang, M.; Shou, J.W.; Zhao, Z.X.; Li, X.Y.; Zhang, L.Y. In vivo metabolite pro-filing of a purified ellagitannin isolated from Polygonum capitatum in rats. Molecules 2016, 21, 1110. [Google Scholar] [CrossRef] [Green Version]
  15. Saldan, N.C.; Almeida, R.T.R.; Avíncola, A.; Porto, C.; Galuch, M.B.; Magon, T.F.S.; Pilau, E.J.; Svidzinski, T.I.E.; Oliveira, C.C. Development of an analytical method for identification of Aspergillus flavus based on chemical markers using HPLC-MS. Food Chem. 2018, 241, 113. [Google Scholar] [CrossRef]
  16. Koeth, R.A.; Wang, Z.E.; Levison, B.S.; Buffa, J.A.; Org, E.; Sheehy, B.T.; Britt, E.B.; Fu, X.M.; Wu, Y.P.; Li, L. Intestinal micro-biota metabolism of L-carnitine, a nutrient in red meat, promotes atherosclerosis. Nat. Med. 2013, 19, 576. [Google Scholar] [CrossRef] [Green Version]
  17. Ma, Q.T.; Li, Y.Q.; Li, P.F.; Wang, M.; Wang, J.K.; Tang, Z.Y.; Wang, T.; Luo, L.; Wang, C.G.; Zhao, B.S. Research progress in the relationship between type 2 diabetes mellitus and intestinal flora. Biomed. Pharmacother. 2019, 117, 109–138. [Google Scholar] [CrossRef]
  18. Zhang, X.; Yao, Y.; Lou, Y.; Jiang, H.; Wang, X.; Chai, X.; Zeng, S. Metabolism of Ebracteolata Compound B Studied In Vitro with Human Liver Microsomes, HepG2 Cells, and Recombinant Human Enzymes. Drug Metab. Dispos. 2010, 38, 2157–2165. [Google Scholar] [CrossRef] [Green Version]
  19. Ma, J.-Y.; Zhou, X.; Fu, J.; Hu, T.; Or, P.M.; Feng, R.; He, C.-Y.; Chen, W.-J.; Zhang, X.; Chen, Y.; et al. Metabolite profiling analysis of FR429, an ellagitannin purified from Polygonum capitatum, in rat and human liver microsomes, cytosol and rat primary hepatocytes In Vitro. Chem. Interact. 2014, 220, 33–40. [Google Scholar] [CrossRef] [PubMed]
  20. Ojanpera, S.; Ojanpera, L. Forensic drug screening by LC-MS using accurate mass measurement. LCGC Eur. 2005, 11, 607–614. [Google Scholar]
  21. Shahrzad, S.; Bitsch, I. Determination of gallic acid and its metabolites in human plasma and urine by high-performance liquid chromatography. J Chromatogr. B Biomed. Sci. AppI. 1998, 705, 87–95. [Google Scholar] [CrossRef]
  22. Landete, J. Ellagitannins, ellagic acid and their derived metabolites: A review about source, metabolism, functions and health. Food Res. Int. 2011, 44, 1150–1160. [Google Scholar] [CrossRef]
  23. Vallverdú-Queralt, A.; Meudec, E.; Eder, M.; Lamuela-Raventos, R.M.; Sommerer, N.; Cheynier, V. Targeted filtering reduces the complexity of UHPLC-Orbitrap-HRMS data to decipher polyphenol polymerization. Food Chem. 2017, 227, 255–263. [Google Scholar] [CrossRef]
  24. González-Barrio, R.; Truchado, P.; Ito, H.; Espín, J.C.; Tomás-Barberán, F.A. UV and MS Identification of Urolithins and Nasutins, the Bioavailable Metabolites of Ellagitannins and Ellagic Acid in Different Mammals. J. Agric. Food Chem. 2011, 59, 1152–1162. [Google Scholar] [CrossRef]
  25. Fu, J.; Ma, J.Y.; Zhang, X.F.; Wang, Y.; Feng, R.; Chen, Y.C.; Tan, X.S.; Zhang, Y.Y.; Sun, Y.P.; Zhou, Y. Identification of me-tabolites of FR429, a potential antitumor ellagitannin, transformed by rat intestinal bacteria in vitro, based on liquid chroma-tography–ion trap-time of flight mass spectrometry analysis. J. Pharm. Biomed. Anal. 2012, 71, 162–167. [Google Scholar] [CrossRef]
  26. Miao, X.; Wang, J.; Chen, L.; Peng, Z.; Chen, Y. Identification of in vivo and in vitro metabolites of 4,5-dimethoxycanthin-6-one by HPLC–Q-TOF-MS/MS. J. Chromatogr. B 2016, 1020, 78–84. [Google Scholar] [CrossRef]
  27. Scarth, J.P.; Spencer, H.A.; Timbers, S.E.; Hudson, S.C.; Hillyer, L.L. The use of in vitro technologies coupled with high reso-lution accurate mass LC-MS for studying drug metabolism in equine drug surveillance. Drug Test. Anal. 2010, 2, 1–10. [Google Scholar]
  28. Zhou, S.; Chan, S.Y.; Goh, B.C.; Chan, E.; Duan, W.; Huang, M.; McLeod, H.L. Mechanism-Based Inhibition of Cytochrome P450 3A4 by Therapeutic Drugs. Clin. Pharmacokinet. 2005, 44, 279–304. [Google Scholar] [CrossRef]
  29. Wilk-Zasadna, I.; Bernasconi, C.; Pelkonen, O.; Coecke, S. Biotransformation in vitro: An essential consideration in the quan-titative in vitro-to-in vivo extrapolation (QIVIVE) of toxicity data. Toxicology 2015, 332, 8–19. [Google Scholar] [CrossRef] [PubMed]
  30. Feng, S.; Luo, Z.; Tao, B.; Chen, C. Ultrasonic-assisted extraction and purifcation of phenolic compounds from sugarcane (Saccharum ofcinarum L.) rinds. LWT-Food Sci. Technol. 2015, 60, 970–976. [Google Scholar] [CrossRef]
  31. Li, Q.; Tu, J.; Zhou, B. The tannins from Punica granatum L, natural regulator of TGF-β1/Smad signaling activity improves nephrectomy and adriamycin induced focal segmental glomerulosclerosis in vivo. J. Funct. Foods 2019, 57, 361–372. [Google Scholar] [CrossRef]
  32. Kaur, C.; Kapoor, H.C. Anti-oxidant activity and total phenolic content of some Asian vegetables. Int. J. Food Sci. Technol. 2002, 37, 153–161. [Google Scholar] [CrossRef]
  33. Azuma, K.; Ippoushi, K.; Nakayama, M.; Ito, H.; Higashio, H.; Terao, J. Absorption of Chlorogenic Acid and Caffeic Acid in Rats after Oral Administration. J. Agric. Food Chem. 2000, 48, 5496–5500. [Google Scholar] [CrossRef]
  34. Prasain, J.K.; Jones, K.; Brissie, N.; Moore, R.; Wyss, A.J.M.; Barnes, S. Identification of Puerarin and Its Metabolites in Rats by Liquid Chromatography−Tandem Mass Spectrometry. J. Agric. Food Chem. 2004, 52, 3708–3712. [Google Scholar] [CrossRef]
  35. Zheng, D.; Sun, C.-C.; Su, H.; Zhang, Q.-F. Metabolism, Excretion, and Tissue Distribution of Astilbin–Zein Nanoparticles in Rats. J. Agric. Food Chem. 2019, 67, 8332–8338. [Google Scholar] [CrossRef]
  36. Zollner, P.; Jodlbauer, J.; Kleinova, M.; Kahlbacher, H.; Kuhn, T.; Hochsteiner, W.W. Lindner, Concentration levels of zeara-lenone and its metabolites in urine, muscle tissue, and liver samples of pigs fed with mycotoxin-contaminated oats. J. Agric. Food Chem. 2002, 50, 2494–2501. [Google Scholar] [CrossRef]
  37. Yoshihara, S.; Makishima, M.; Suzuki, N.; Ohta, S. Metabolic Activation of Bisphenol A by Rat Liver S9 Fraction. Toxicol. Sci. 2001, 62, 221–227. [Google Scholar] [CrossRef] [Green Version]
  38. Zhou, J.; Ma, Y.H.; Zhou, Z.; Chen, Y.; Wang, Y.; Gao, X. Intestinal Absorption and Metabolism of Epimedium Flavonoids in Osteoporosis Rats. Drug Metab. Dispos. 2015, 43, 1590–1600. [Google Scholar] [CrossRef] [Green Version]
  39. Kang, I.; Kim, Y.; Tomás-Barberán, F.A.; Espín, J.C.; Chung, S. Urolithin A, C, and D, but not iso-urolithin A and urolithin B, attenuate triglyceride accumulation in human cultures of adipocytes and hepatocytes. Mol. Nutr. Food Res. 2016, 60, 1129–1138. [Google Scholar] [CrossRef] [PubMed] [Green Version]
  40. González-Sarrías, A.; Miguel, V.; Merino, G.; Lucas, R.; Morales, J.C.; Tomás-Barberán, F.; Álvarez, A.I.; Espín, J.C. The Gut Microbiota Ellagic Acid-Derived Metabolite Urolithin A and Its Sulfate Conjugate Are Substrates for the Drug Efflux Transporter Breast Cancer Resistance Protein (ABCG2/BCRP). J. Agric. Food Chem. 2013, 61, 4352–4359. [Google Scholar] [CrossRef]
  41. Ishimoto, H.; Shibata, M.; Myojin, Y.; Ito, H.; Sugimoto, Y.; Tai, A.; Hatano, T. In vivo anti-inflammatory and antioxidant properties of ellagitannin metabolite urolithin A. Bioorganic Med. Chem. Lett. 2011, 21, 5901–5904. [Google Scholar] [CrossRef] [PubMed] [Green Version]
  42. Gimenez-Bastida, J.A.; Gonzalez-Sarrias, A.M.; Larrosa, F.; Tomas-Barberan, J.C.; Espin, M.T.; Garcia-Conesa, M.T. Ellag-itannin metabolites, urolithin A glucuronide and its aglycone urolithin A, ameliorate TNF-α-induced inflammation and associated molecular markers in human aortic endothelial cells. Mol. Nutr. Food Res. 2012, 56, 784–796. [Google Scholar] [CrossRef]
Figure 1. Total ion chromatograms of Sanguisorba tannins.
Molecules 26 04053 g001
Figure 2. The summary analytical strategy diagram for the detection and identification of Sanguisorba tannins: EICs—extracted ion chromatograms, DPIs—diagnostic product ions.
Molecules 26 04053 g002
Figure 3. The summary contents structure in Sanguisorba tannins.
Molecules 26 04053 g003
Figure 4. Metabolic profile and the proposed metabolic pathways of Sanguisorba tannins in vivo and in vitro.
Molecules 26 04053 g004
Figure 5. The summary metabolites structure in vivo and in vitro: a—methylation, b—dihydroxylation, c—glucuronidation conjugation, d—sulfation conjugation, e—decarbonylation, U—urine, P—plasma, F—feces, I—intestinal flora, L—liver microsomes and liver cytosol.
Molecules 26 04053 g005
Figure 6. The metabolic networks of Sanguisorba tannins: U—urine, F—feces, B—bile, I—intestinal flora, L—liver microsomes and liver cytosol.
Molecules 26 04053 g006
Table 1. Tannins profile in Sanguisorba ethanolic extract.
NO.NameFormulatR (min)MS1MS2mzCloud
Best Match
11,6-Bis-O-(3,4,5-trihydroxybenzo
yl)hexopyranose
C20H20O147.00484.1111153.013777.9
2Catechin gallateC22H18O109.79442.0894151.0387
139.0380
123.0440
79.1
3CorilaginC27H22O187.42634.4729463.0524
300.9995
89.3
Table 2. Summary of phase I and phase Ii metabolites of Sanguisorba tannins in SD rats’ plasma, bile, urine, feces, and tissues samples: I—phase I metabolites, II—phase II metabolites.
NO.tR (min)MS1Diff(ppm)MS2FormulaCompoundOccurrence
M1 I3.1169.01483.54125.0241C7H6O5Gallic acidUrine
Feces
Bile
plasma
M2 I6.7125.02572.0581.0345C6H6O3PyrogallolUrine
Feces
Bile
Plasma
M3 I28.1300.99962.32283.1526
257.0825
C15H6O8Ellagic acidFeces
M4 I24.1275.02046.08257.0106
229.0167
C13H8O7Urolithin M5
(3,4,8,9,10-pentahydroxy-urolithin)
Urine
Feces
M5 I25.2259.02490.38241.0176
213.0223
C13H8O6Urolithin M6Feces
M6 I24.4259.02511.16241.0171
213.0225
C13H8O6Urolithin DFeces
M7 I28.4243.02990.82215.0367
187.0426
C13H8O5Urolithin CUrine
Bile
M8 I30.4227.03584.40199.0346C13H8O4Urolithin AUrine
M9 I38.1211.04083.79167.0502
139.0556
C13H8O3Urolithin BUrine
M10 I36.7269.0424−1.12224.0454
197.0649
C14H6O6Nasutin A
(4,9-dehydroxy-ellagic acid)
Urine
M11 II8.9183.02942.73169.0049
125.0126
C8H8O5Gallic
acid
methyl
Urine
Bile
M12 II4.2197.04600.51183.0854
169.0146
125.0196
C9H10O5Gallic acid
dimethyl
Bile
M13 II34.3241.0513−2.9210.9041
196. 9863
C14H10O4Urolithin A
methyl
Bile
M14 II26.6402.06787.89227.0305
227.1005
175.2006
C19H16O10Urolithin A
glucuronide
Urine
M15 II26.8419.06451.53243.0314
214.9997
187.0426
C19H16O11Urolithin C
glucuronide
Urine
M16 II26.5433.07875.07257.0485
243.0256
C20H18O11Urolithin C methyl ether glucuronideUrine
M17 II29.4445.07922.47269.0463C21H18O11Nasutin A glucuronideUrine
M18 II31.8315.0140−9.52300.9991C15H8O8Ellagic
acid methyl
ether
Bile
M19 II25.8491.00130. 26315.0128
299.7270
C21H16O14Ellagic
acid methyl
ether glucuronide
Bile
Kidney
Table 3. Summary of phase I and phase II metabolites of Sanguisorba tannins in rat intestinal microbiota: I—phase I metabolites, II—phase II metabolites.
NO.tR (min)MS1Diff(ppm)MS2FormulaCompound
N1 I2.2169.011515.97125.0225C7H6O5Gallic acid
N2 I5.8125.34462.7581.1342C6H6O3Pyrogallol
N3 II8.4183.02980.54169.0052
125.0177
C8H8O5Gallic acid methyl
N4 II4.1197.04660.54169.0118
125.0232
C9H10O5Gallic acid dimethyl
N5 II9.6359.02641.86183.0205
169.1322
C14H16O11Gallic acid methyl ether glucuronide
N6 I32.3227.03121.58199.0344C13H8O4Urolithin A
N7 II36.6241.053110.4210.9047
196.9068
C14H10O4Urolithin A methyl
N8 II8.5309.99182.83227.0374C13H7O7SUrolithin A sulfate
N9 II37.8257.04580.78243.0276
215.0385
C14H10O5Urolithin C methyl
Table 4. Summary of phase I and phase II metabolites of Sanguisorba tannins in rat liver microsomes and liver cytosol: I—phase I metabolites, II—phase II metabolites.
NO.tR(min)MS1Diff(ppm)MS2FormulaCompound
P1 I2.7169.01152.96125.4925C7H6O5Gallic acid
P2 II8.4183.0292−3.82125.0236C8H8O5Gallic acid methyl
P3 II5.3197.04140.51125.0788C9H10O5Gallic acid dimethyl
P4 I27.8300.99962.32283.9996
257.0067
229.0102
185.0274
C15H6O8Ellagic acid
P5 II30.8315.01483.25299.9936C15H8O8Ellagic
acid methyl
ether
Publisher’s Note: MDPI stays neutral with regard to jurisdictional claims in published maps and institutional affiliations.

