
Insight into the Metabolic Profiles of Pb(II) Removing Microorganisms


Abstract
:1. Introduction
2. Results
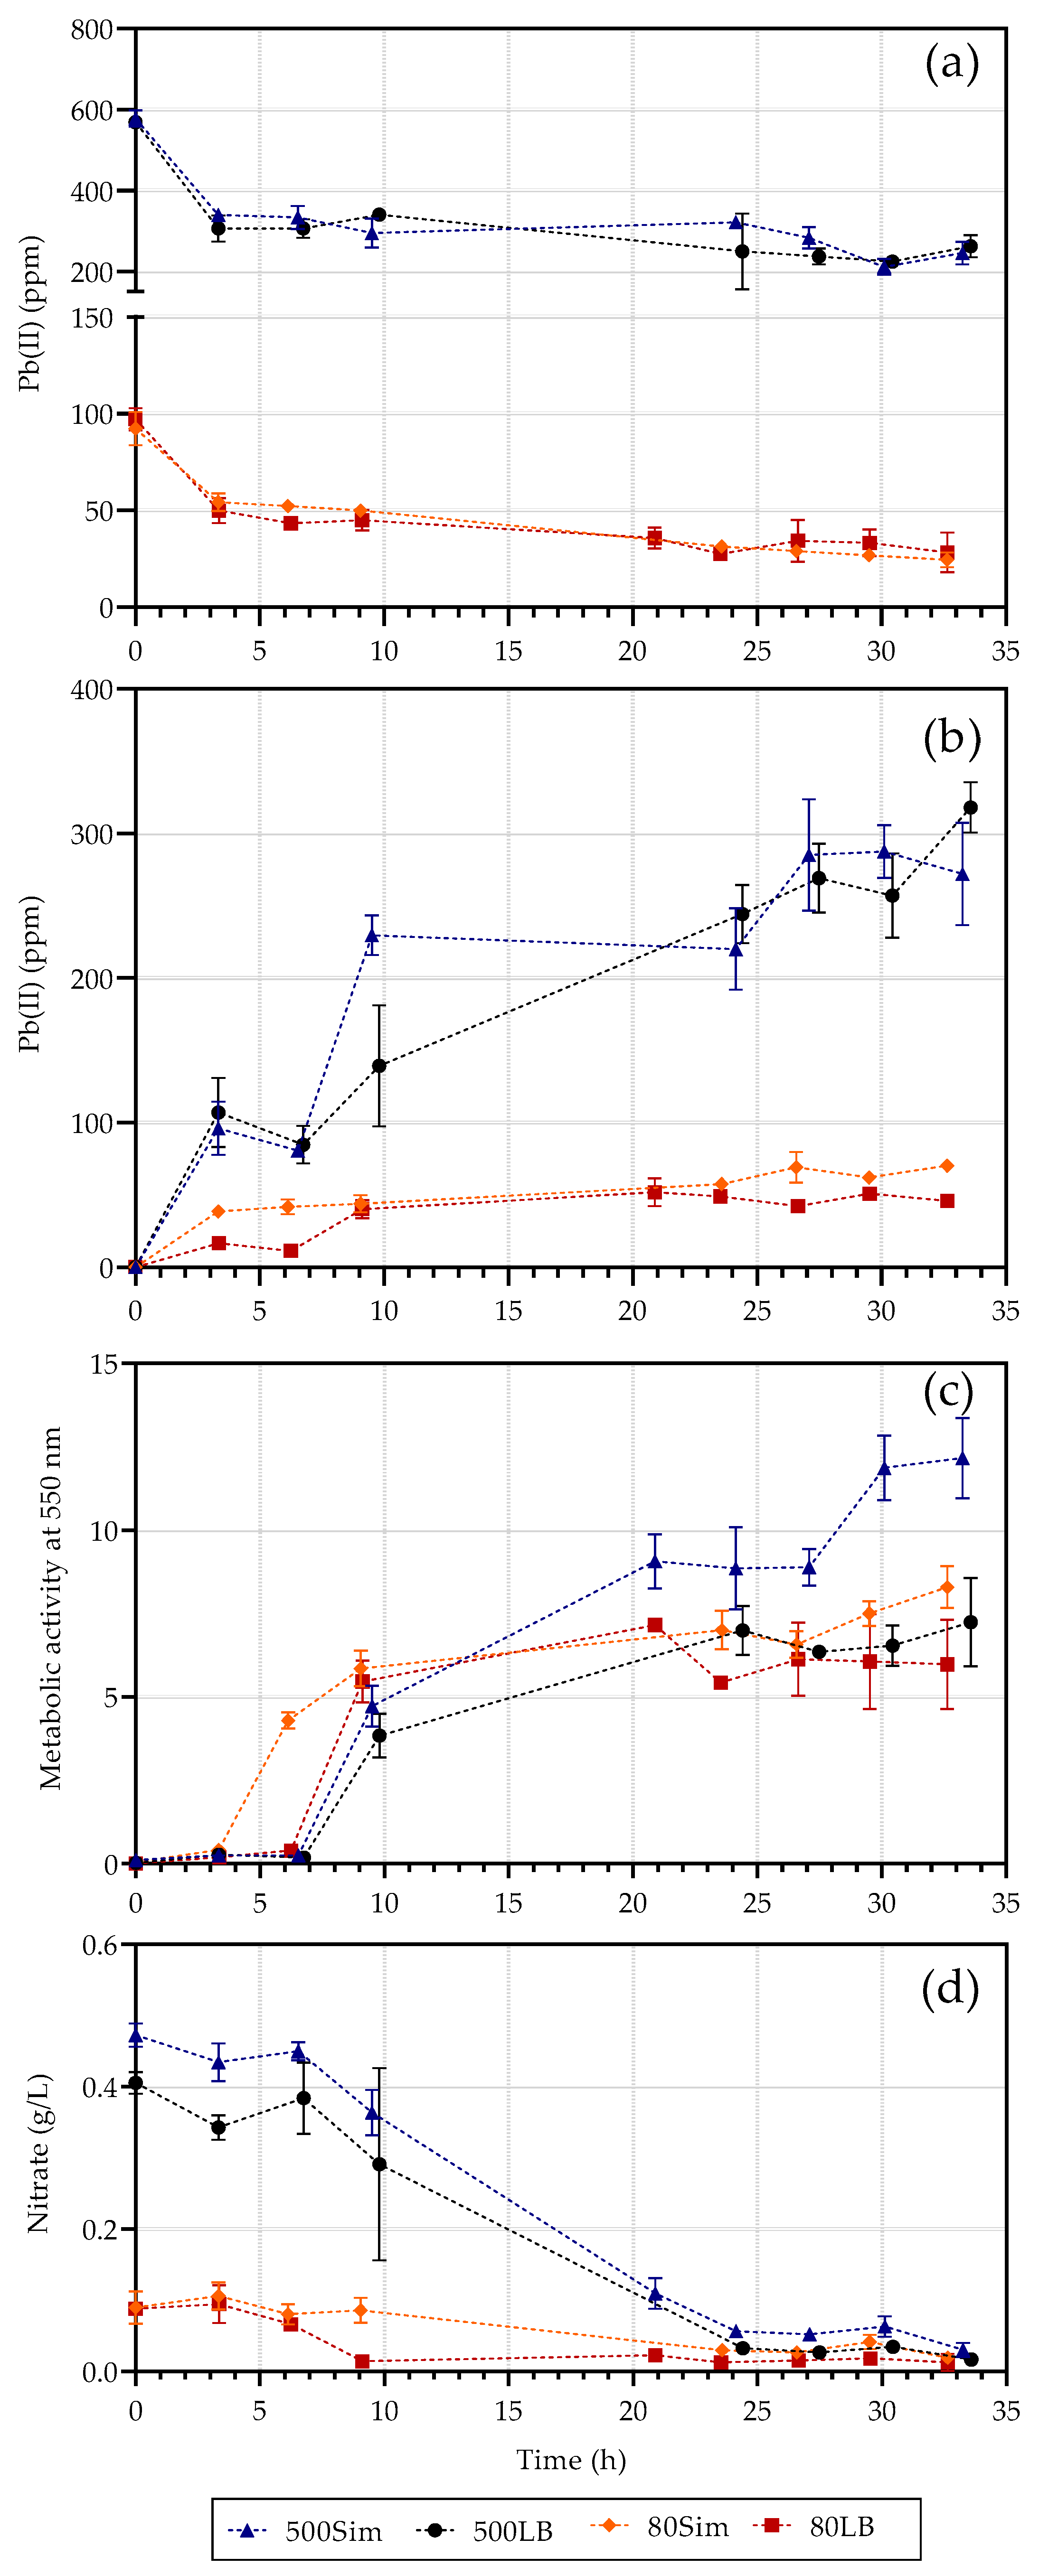
2.1. Batch Reactor Results
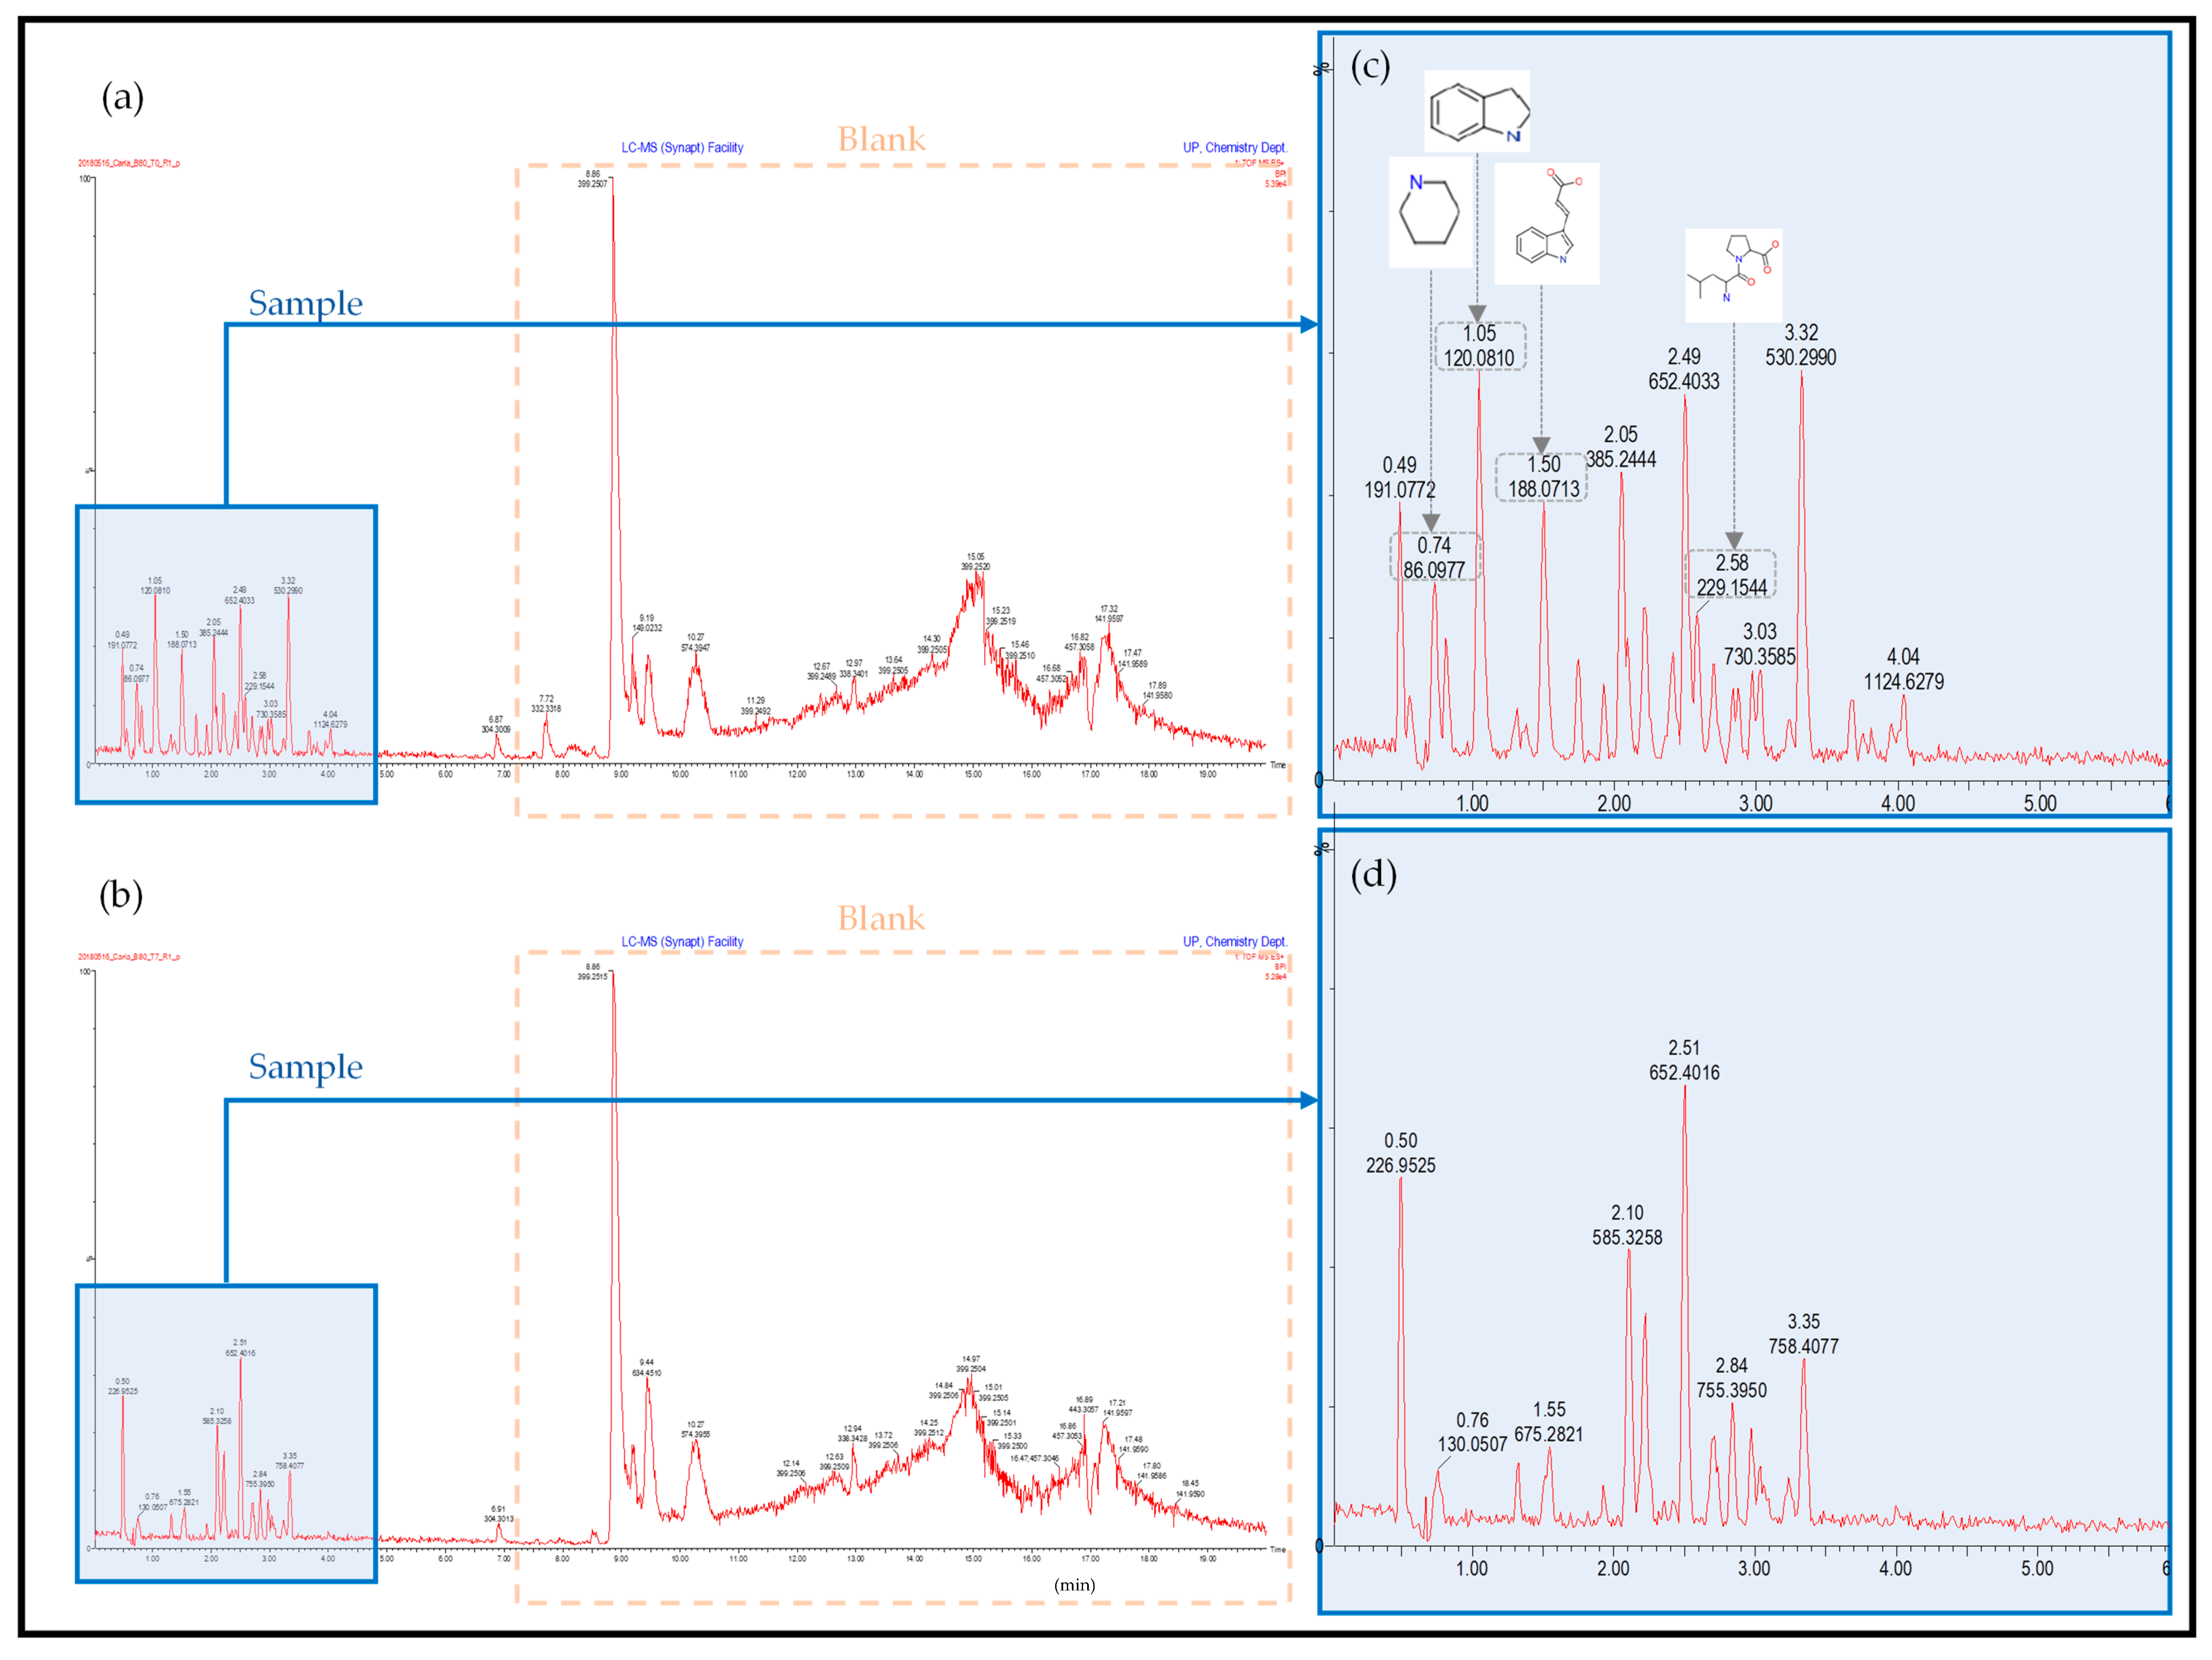
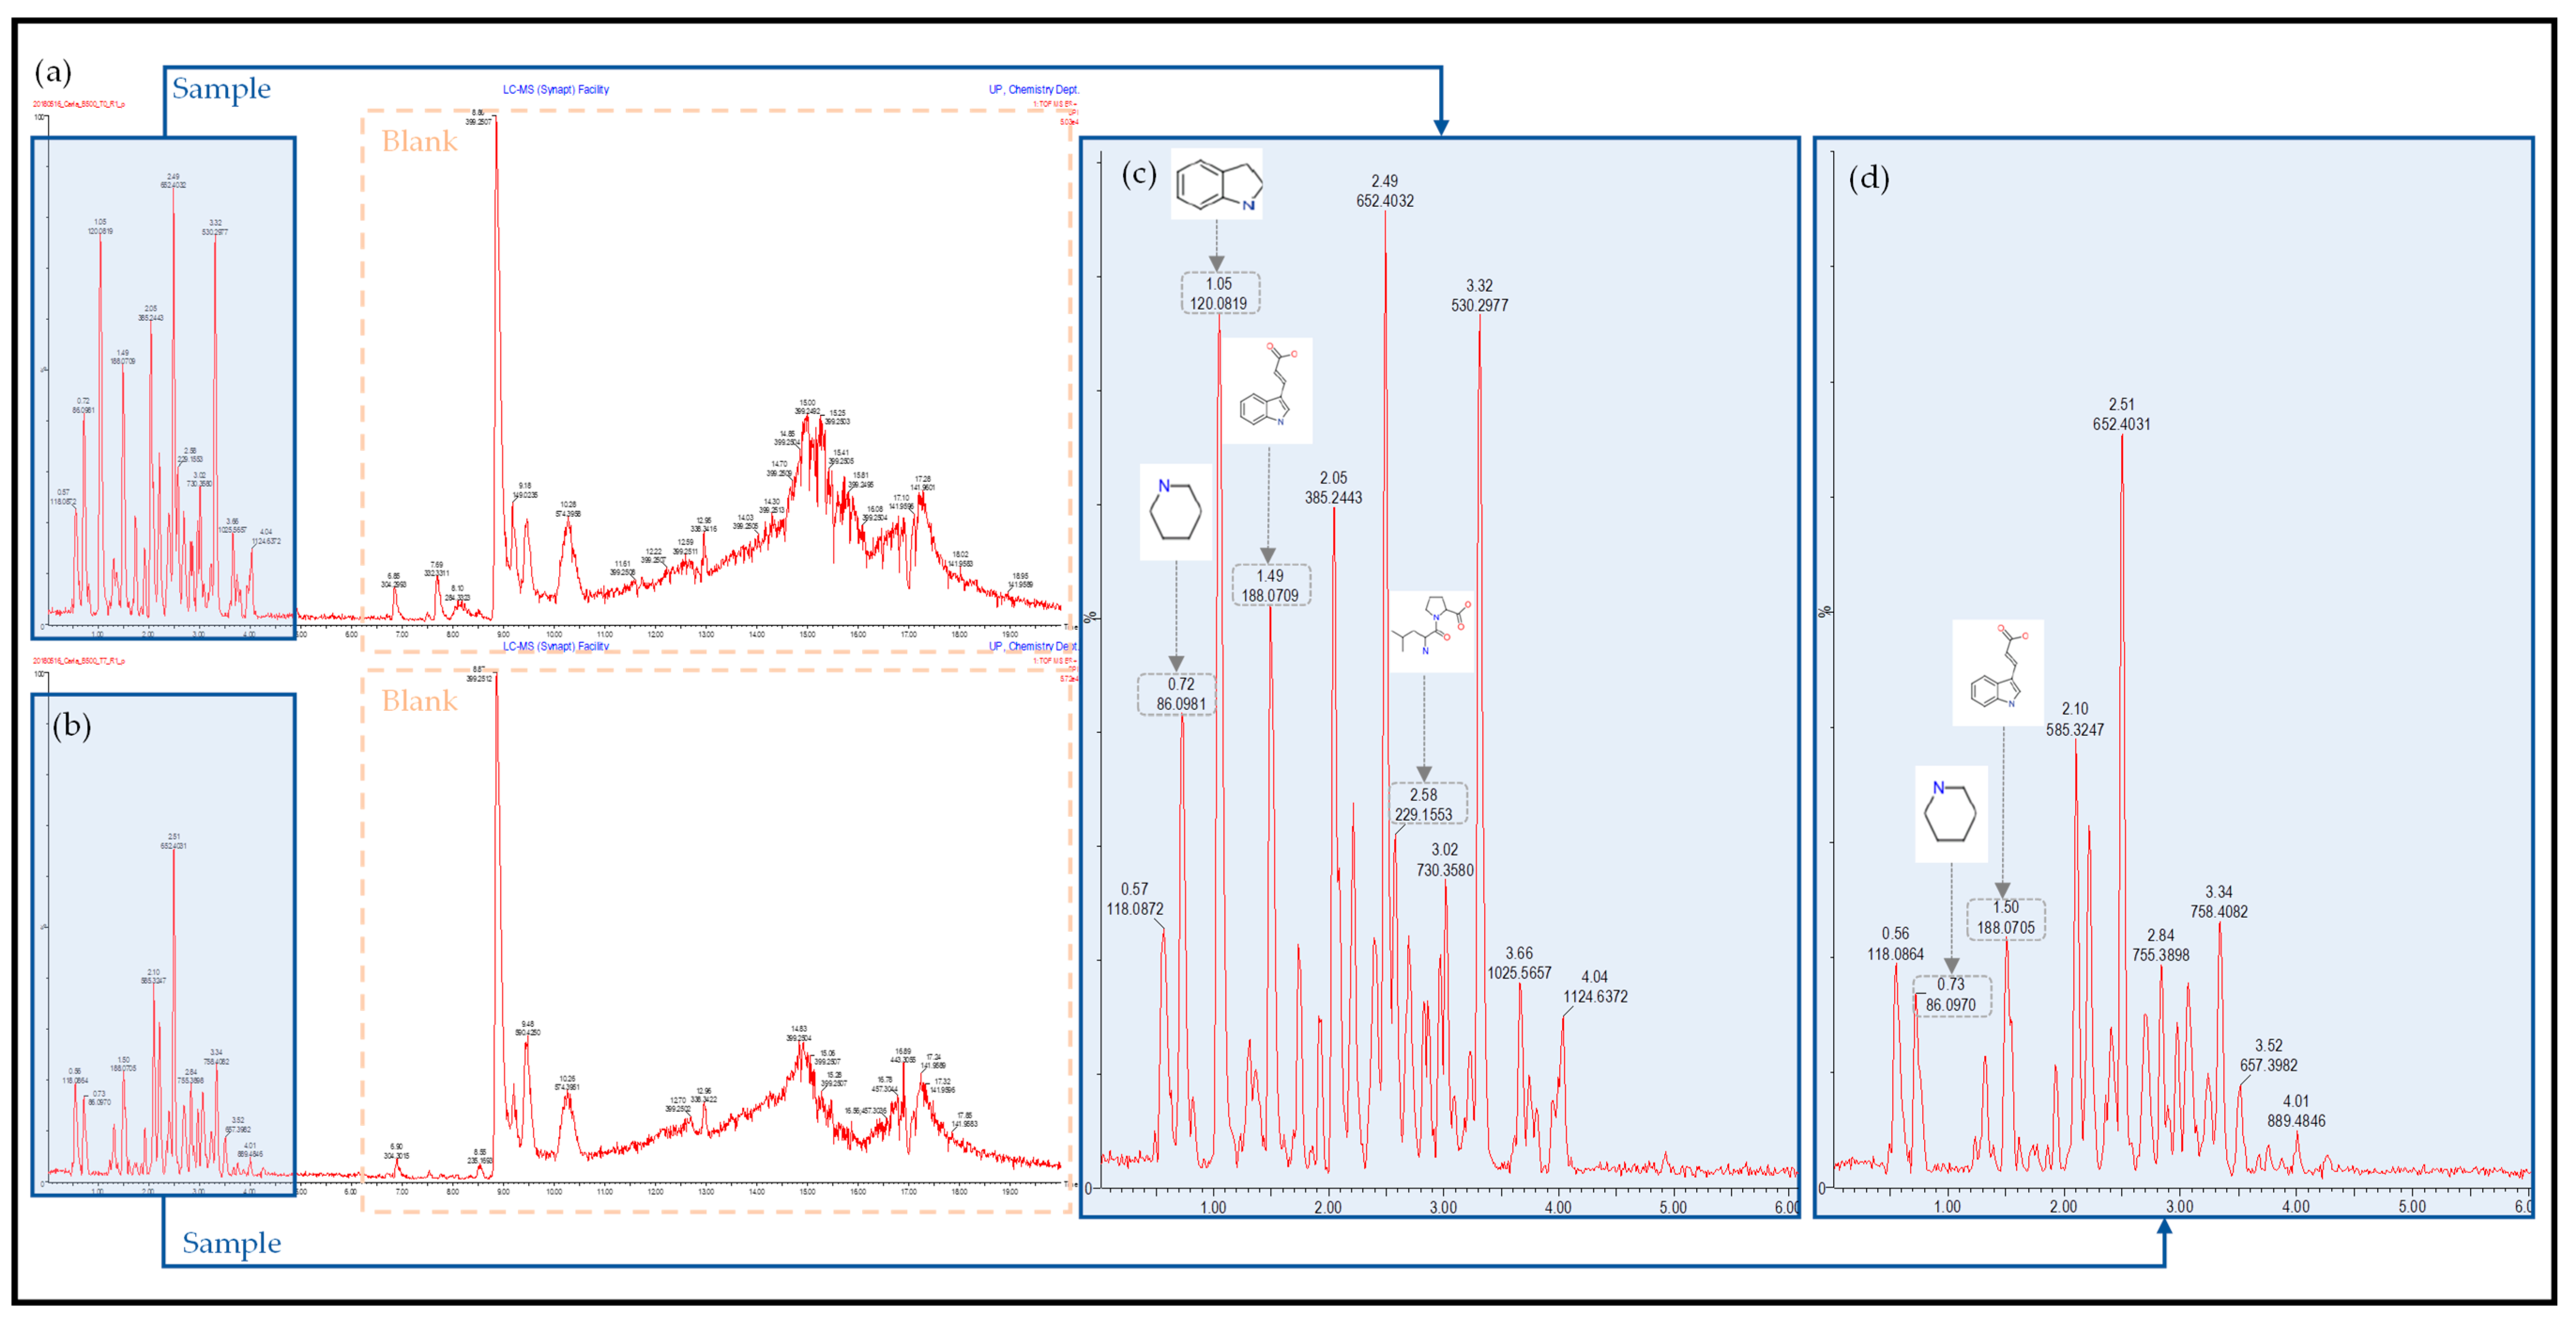
2.2. Ultra-Performance Liquid Chromatography–High-Definition Mass Spectrometry
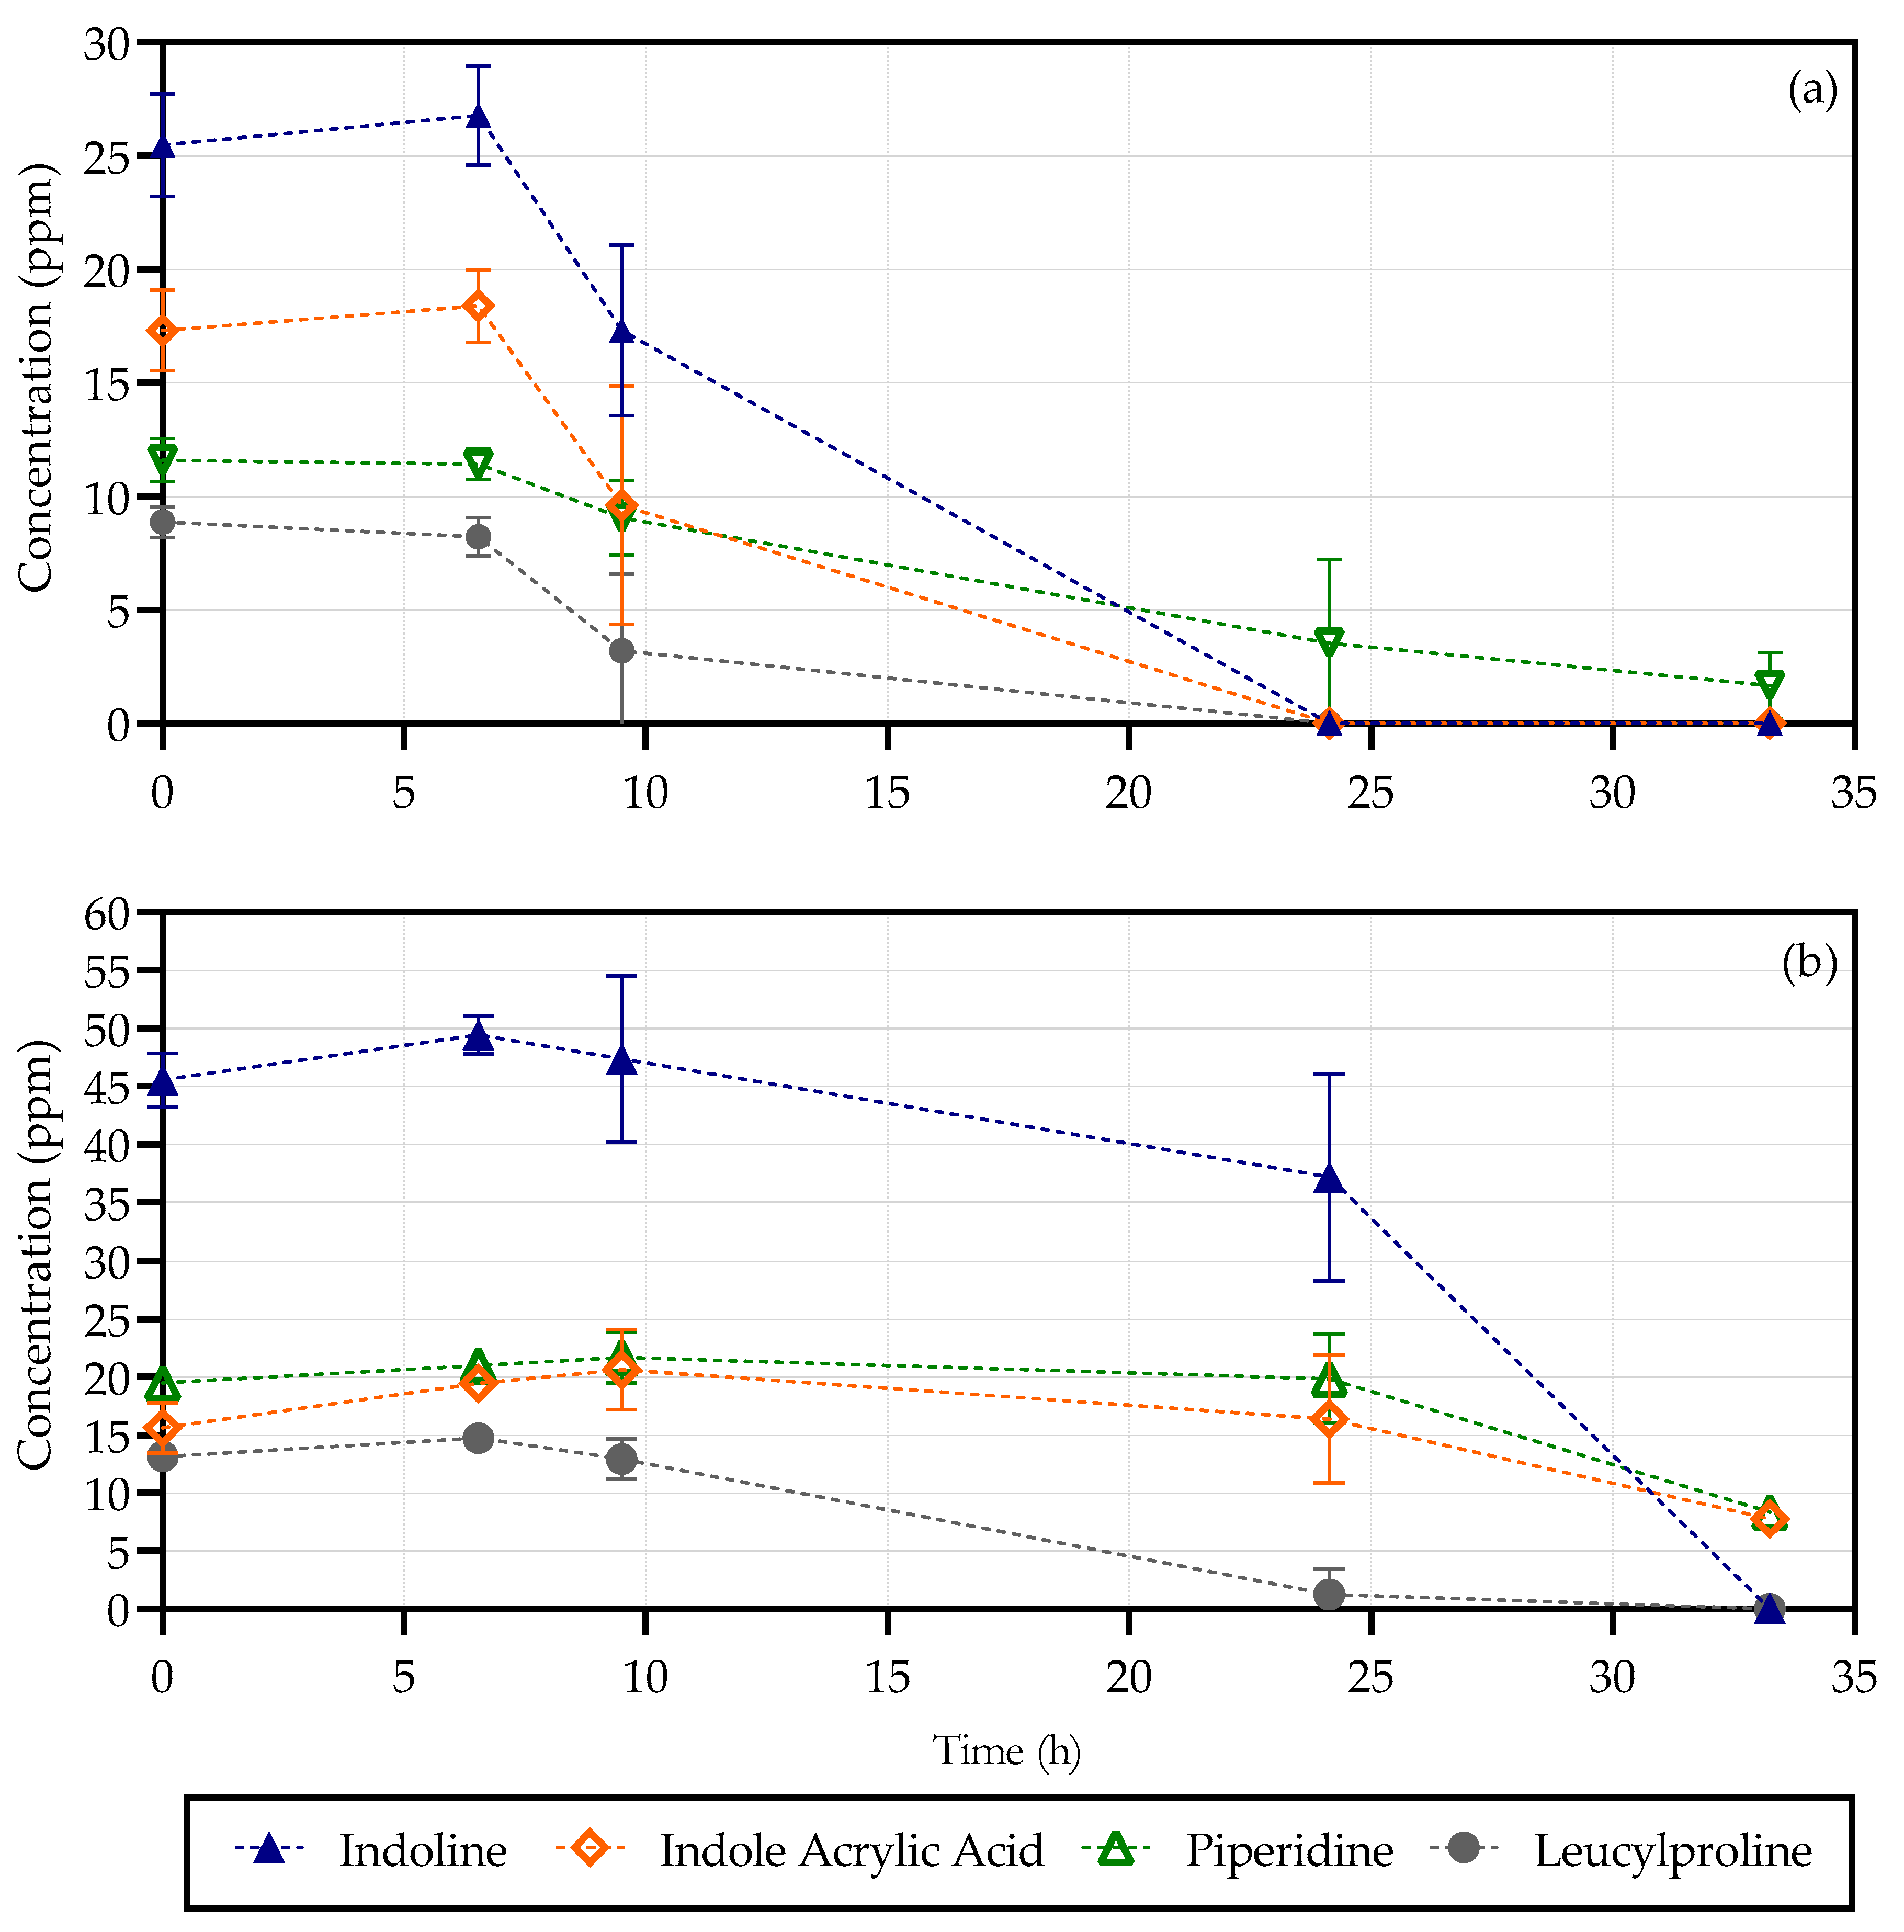
2.3. High-Performance Liquid Chromatography
2.4. X-ray Photoelectron Spectroscopy
3. Discussion
3.1. Metabolites
3.1.1. Piperidine
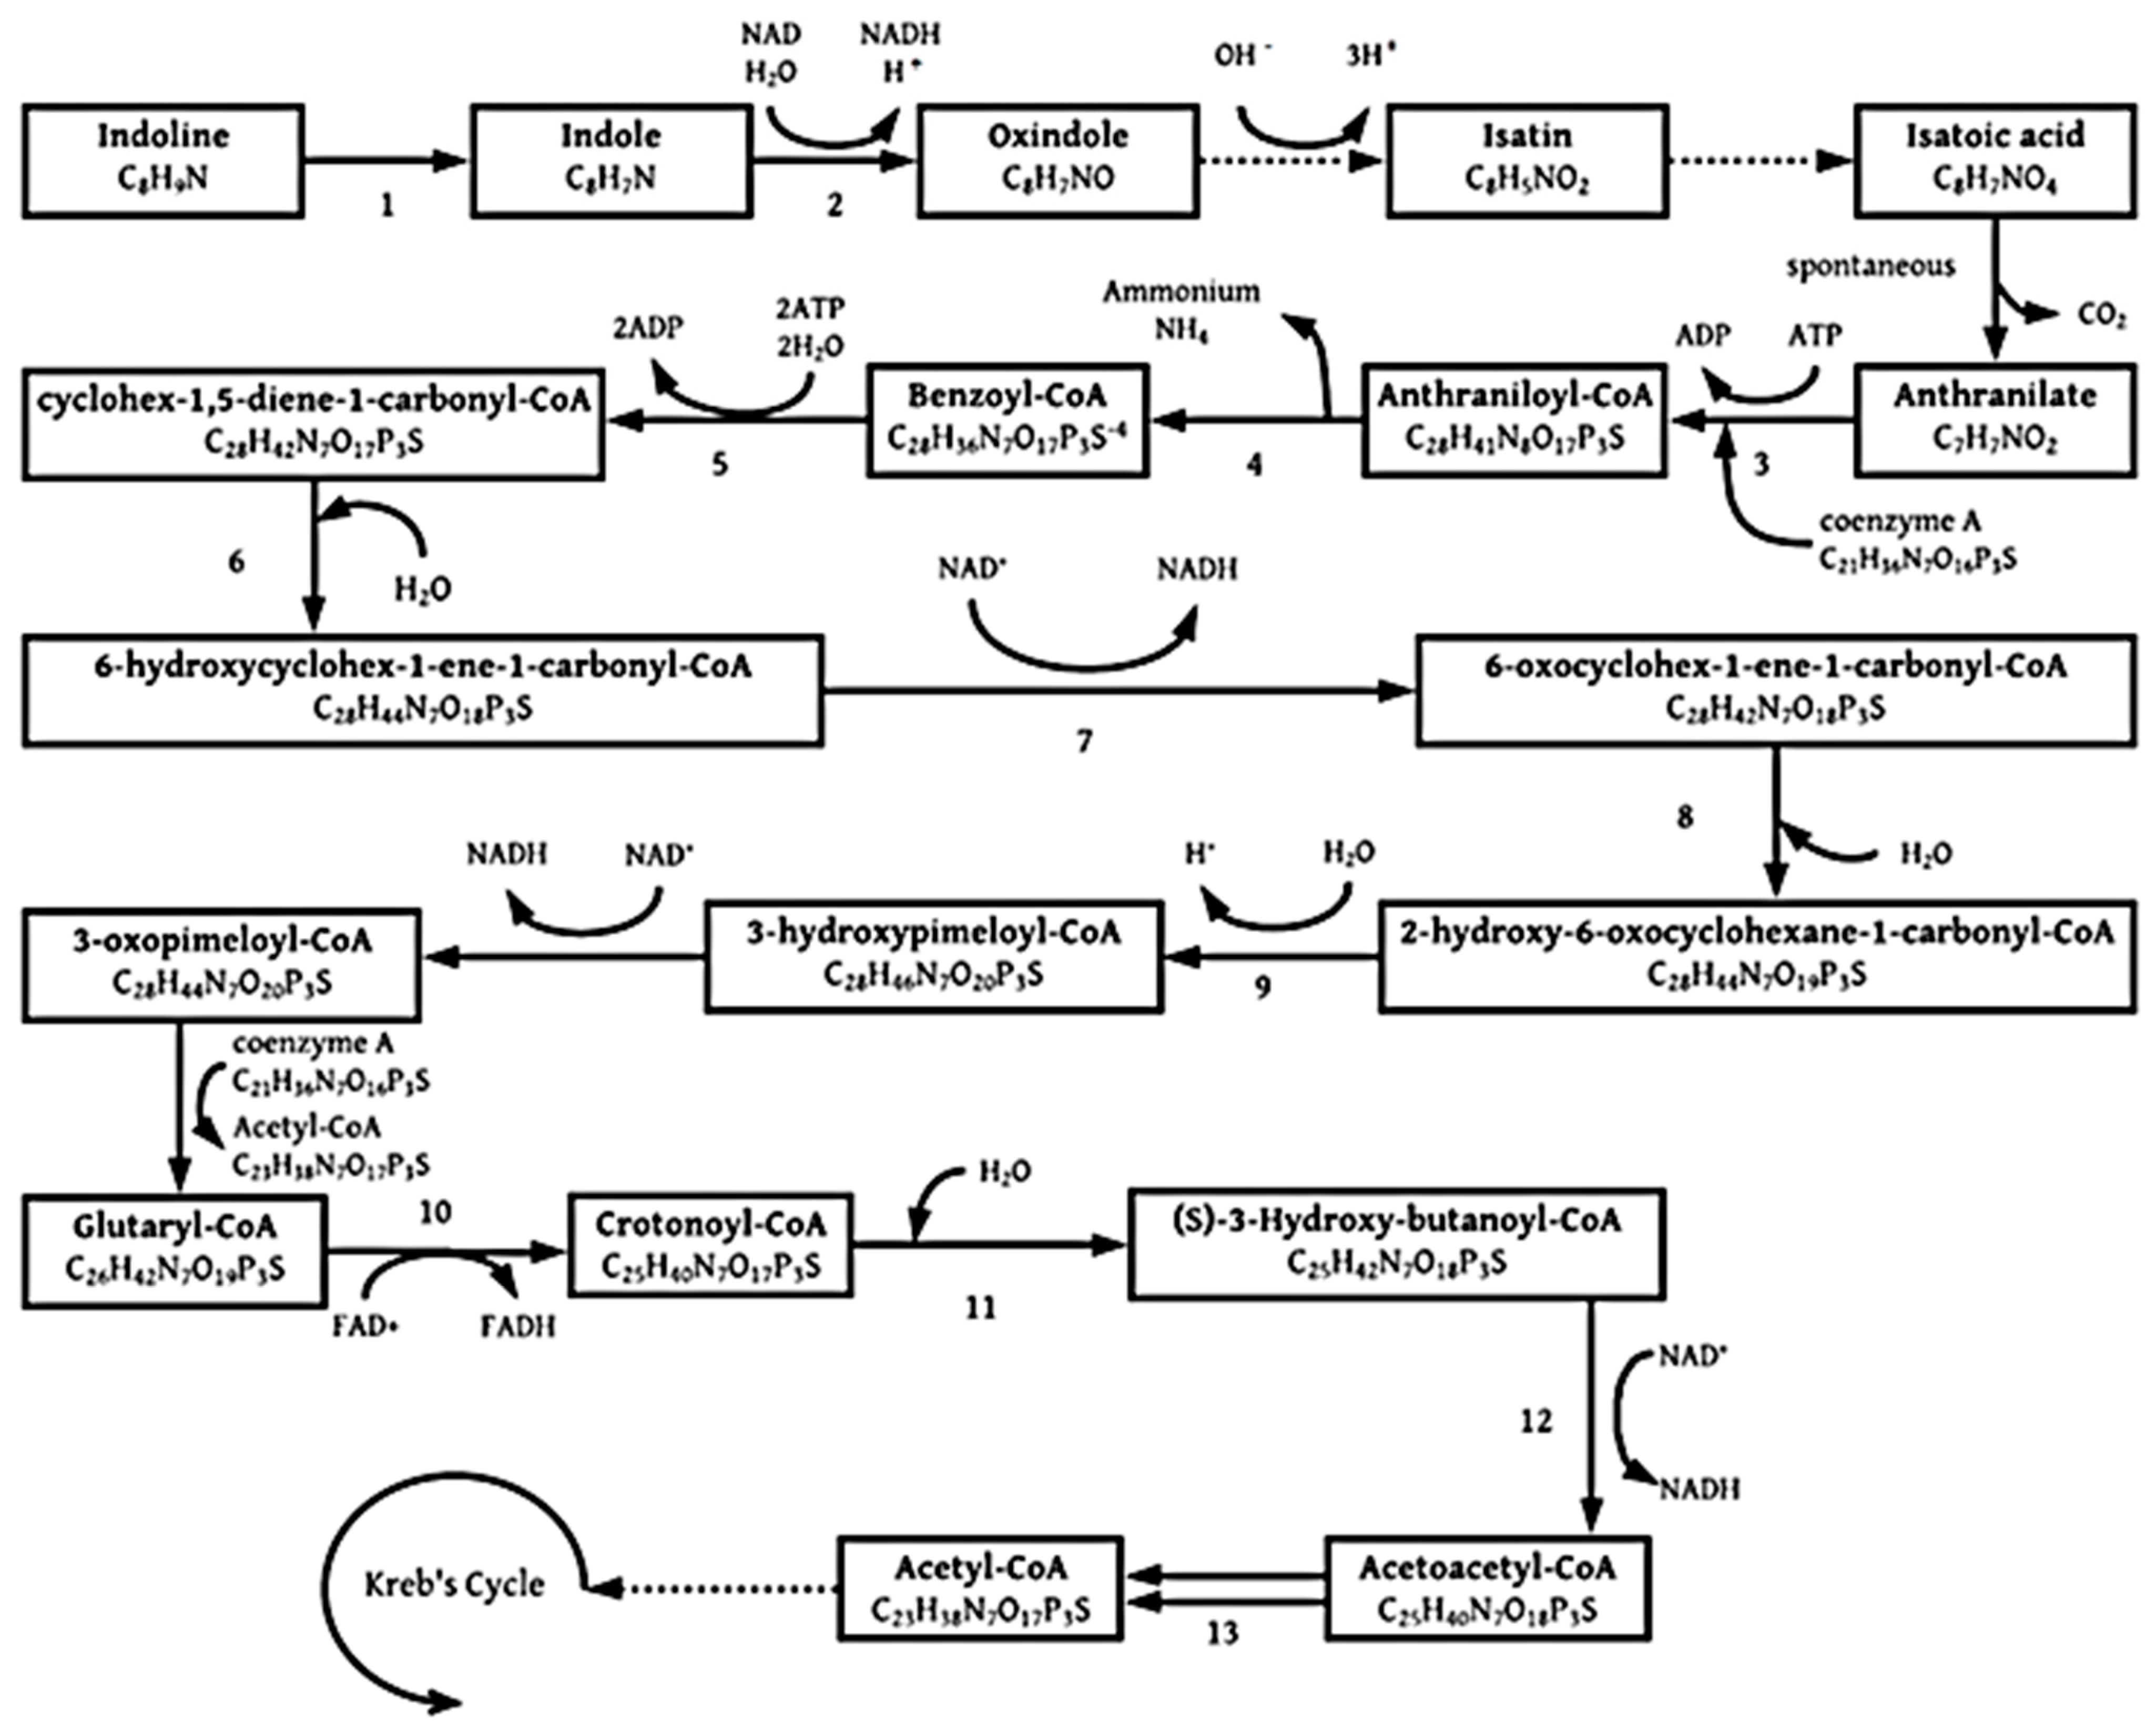
3.1.2. Indoline
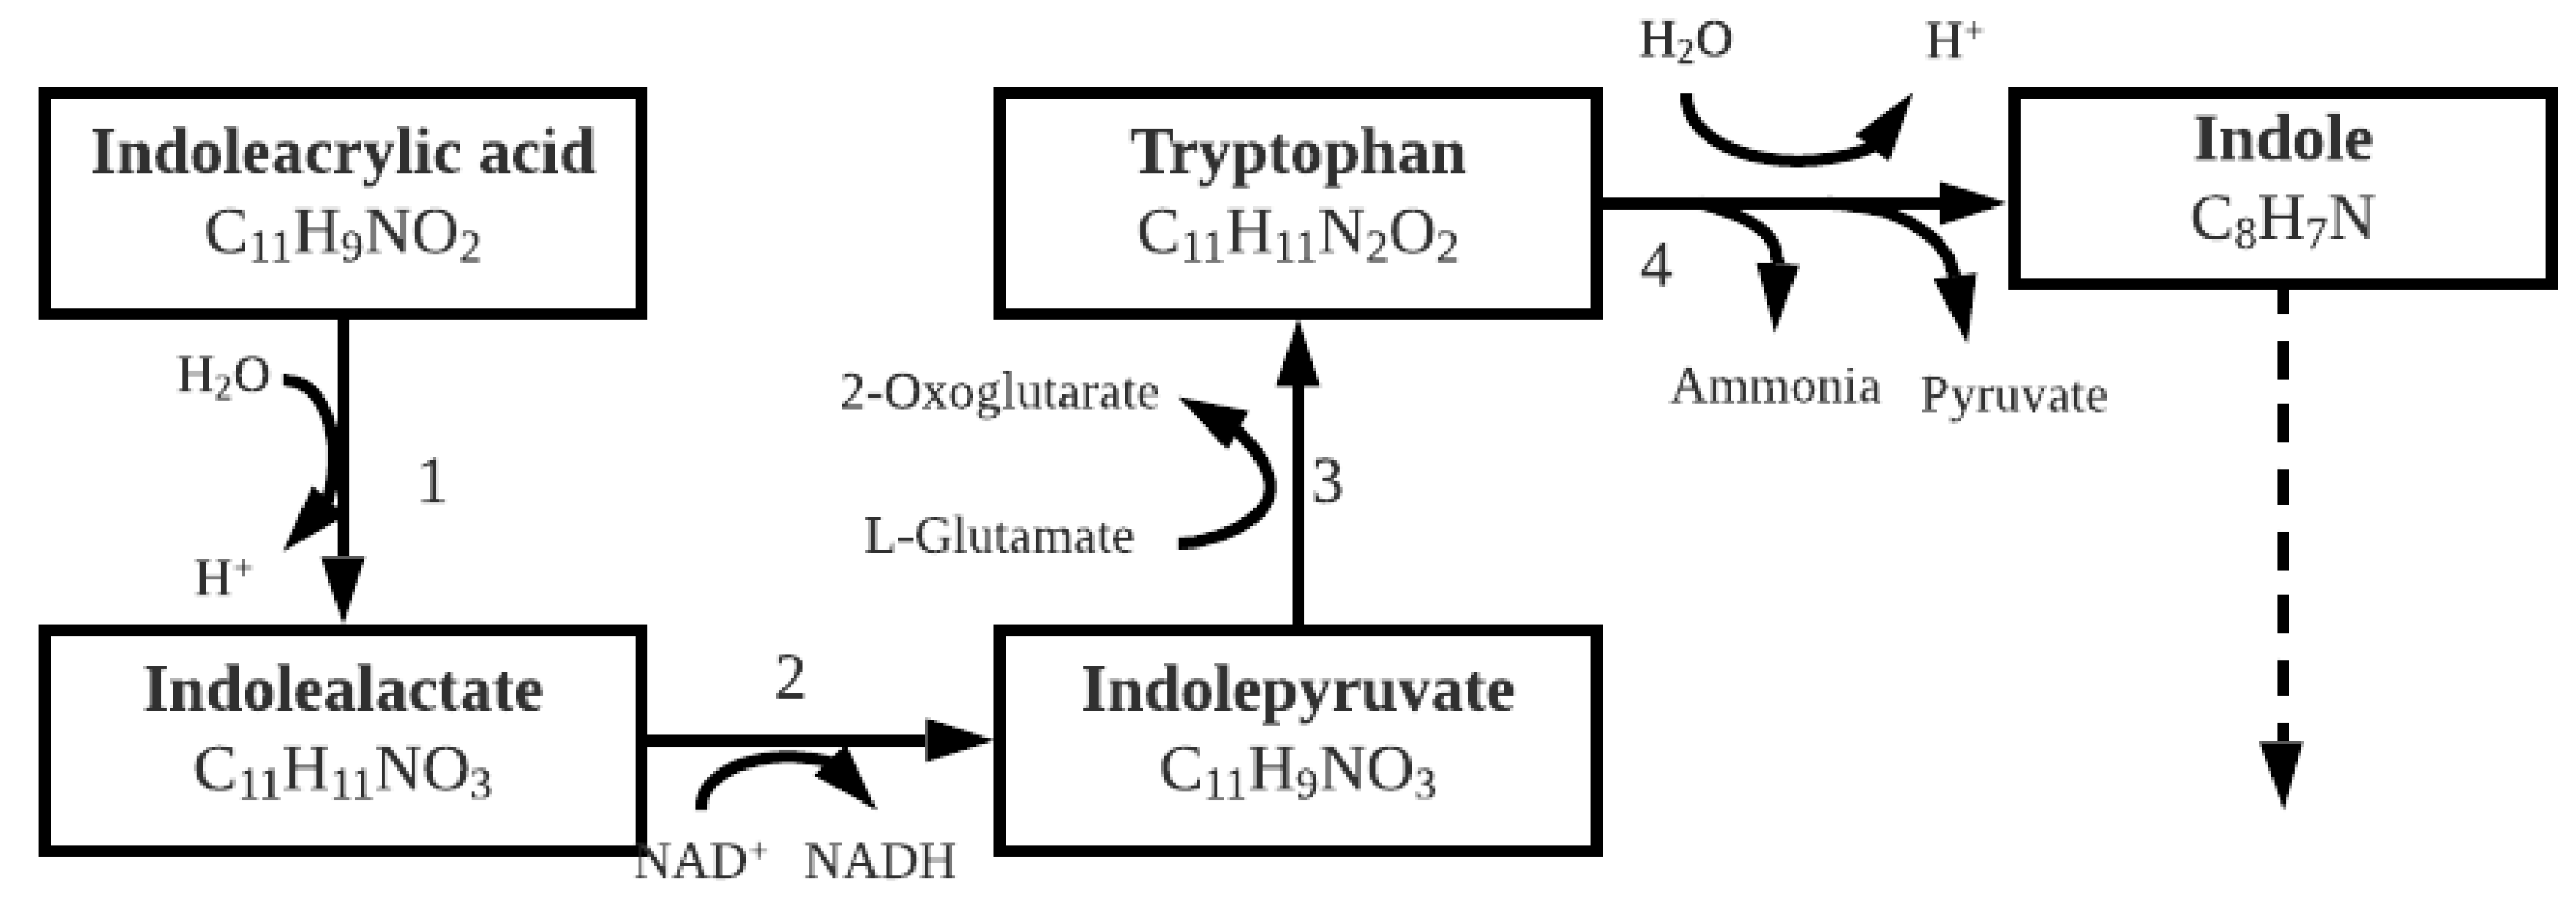
3.1.3. Indoleacrylic Acid
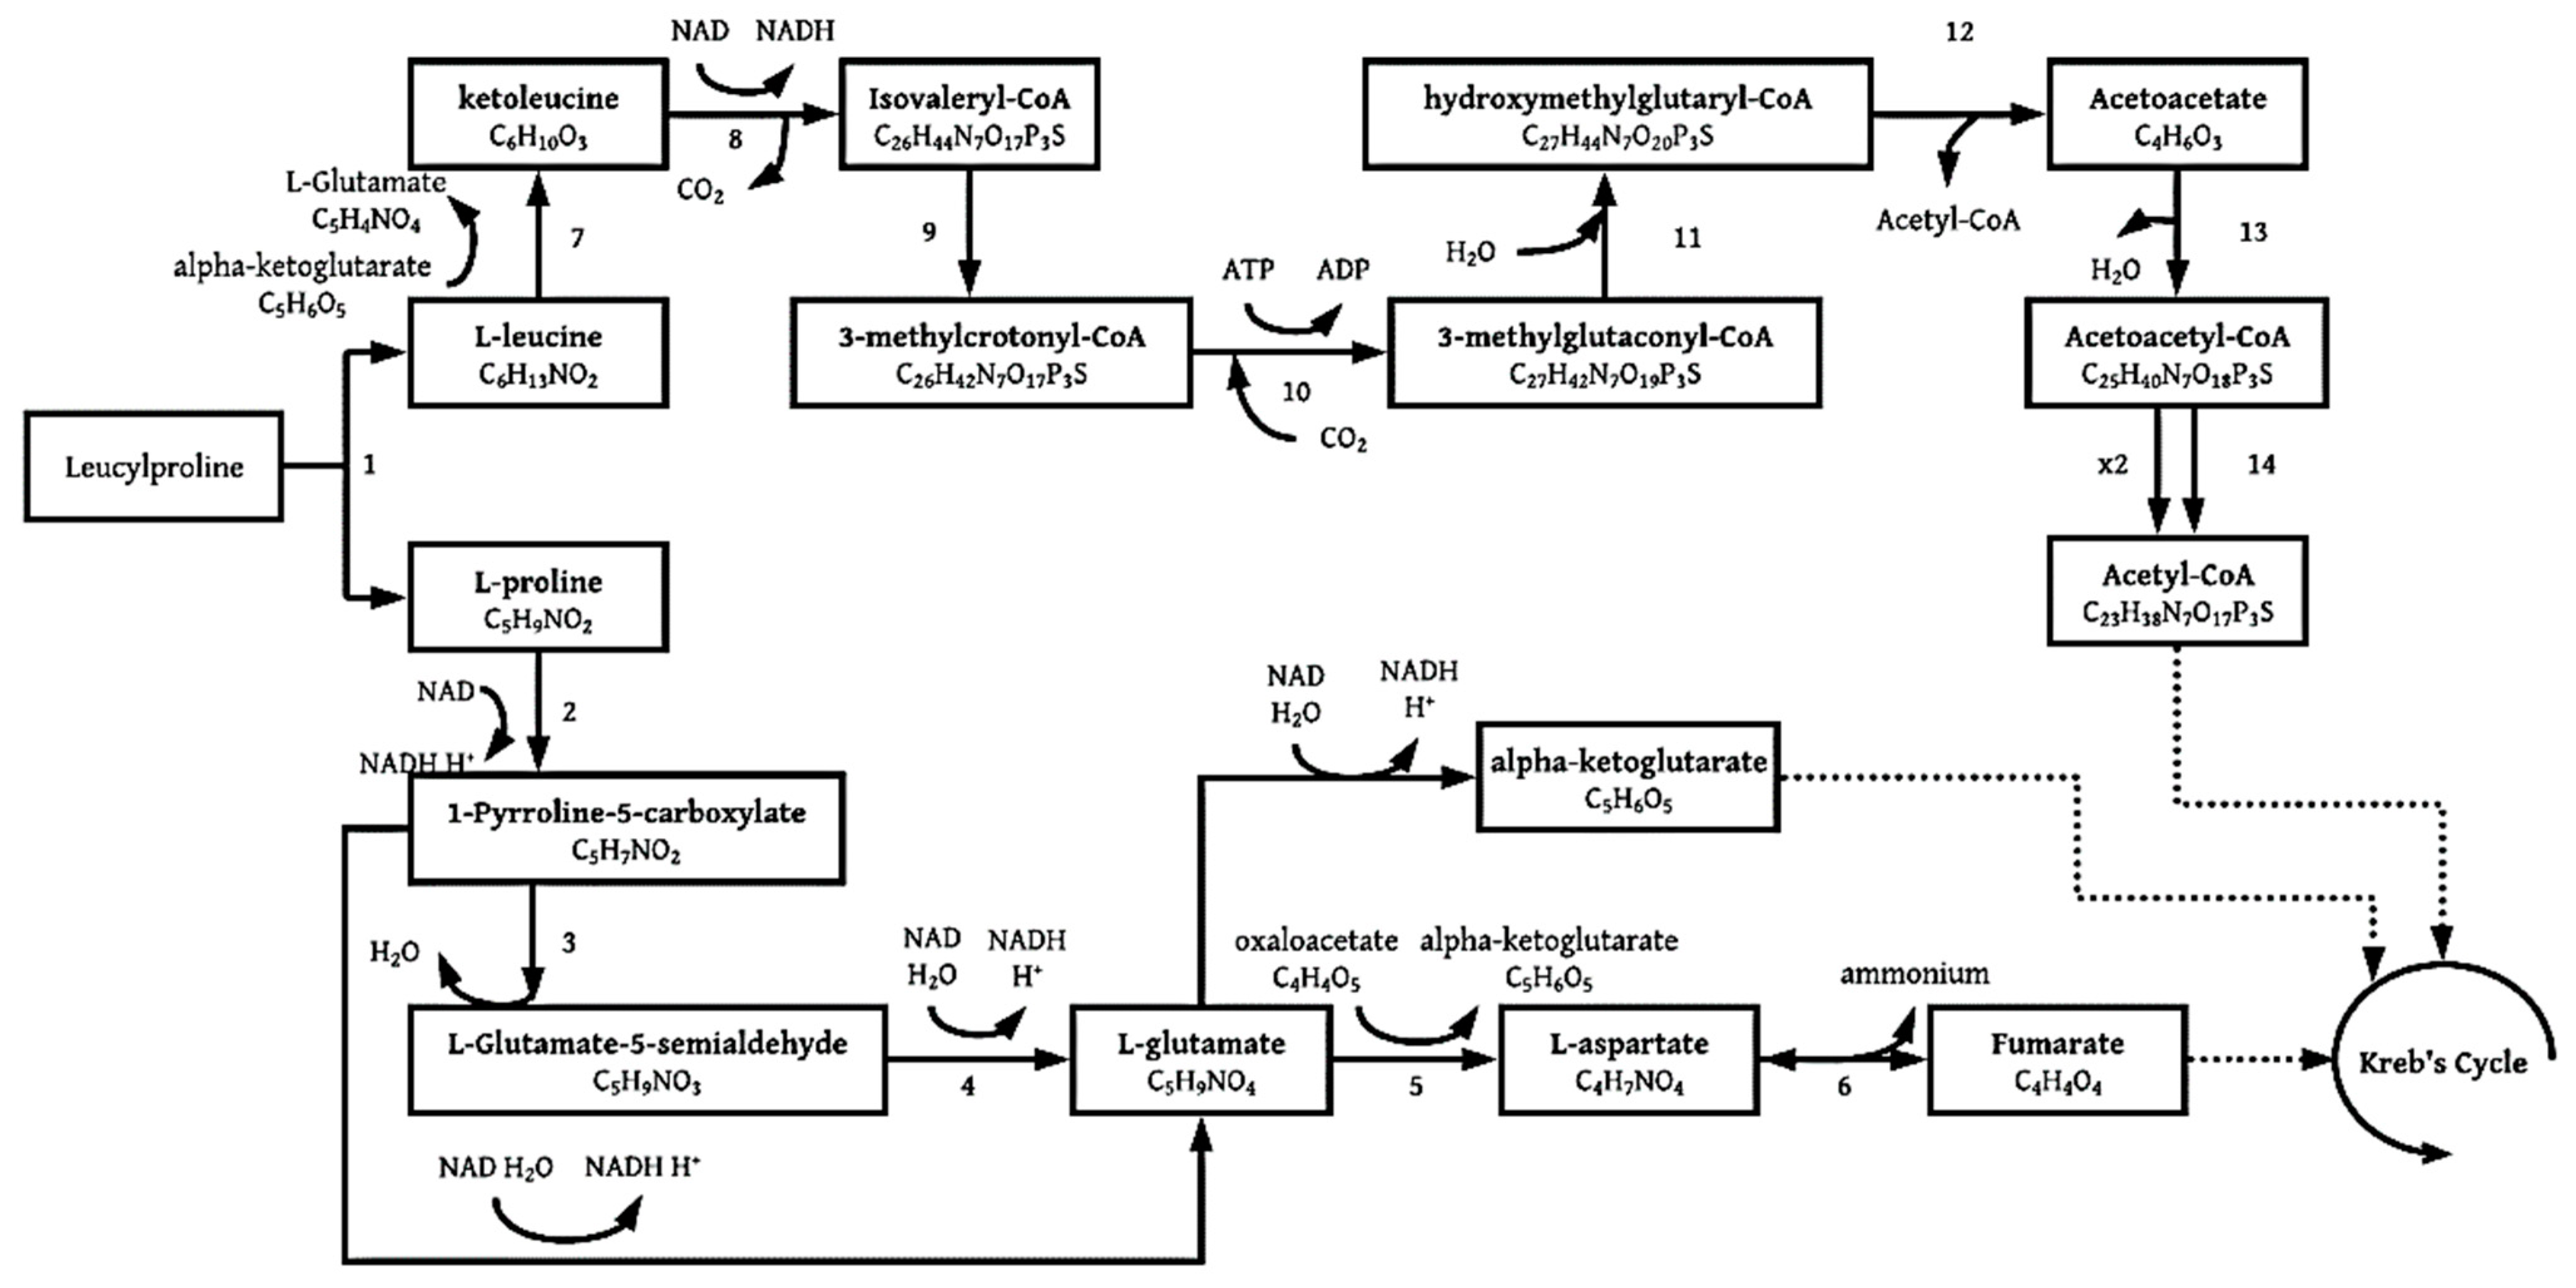
3.1.4. Leucylproline
3.2. Energy Production Analysis
3.3. XPS Coupled with Metabolite Profiling
4. Materials and Methods
4.1. Materials
4.2. Microbial Culture
4.3. Experimental
4.4. Sampling
4.5. Batch Analyses
4.5.1. Pb(II) Measurements
4.5.2. Metabolic Activity
4.5.3. Nitrates
4.5.4. UPLC-HDMS
4.5.5. HPLC Conditions and Specifications
4.5.6. XPS Sample Preparation and Analysis
5. Conclusions
Author Contributions
Funding
Data Availability Statement
Conflicts of Interest
Sample Availability
References
- Tiwari, S.; Tripathi, I.P.; Gandhi, M.; Gramoday, C.; Tiwari, H. Effects of lead on environment. Int. J. Emerg. Res. Manag. Technol. 2013, 2, 1–5. [Google Scholar]
- Needleman, H. Lead poisoning. Annu. Rev. Med. 2004, 55, 209–222. [Google Scholar] [CrossRef] [Green Version]
- Cheng, H.; Hu, Y. Lead (Pb) isotopic fingerprinting and its applications in lead pollution studies in China: A review. Environ. Pollut. 2010, 158, 1134–1146. [Google Scholar] [CrossRef] [PubMed]
- Pan, X.; Zhang, D.; Fu, Q. Bioremediation of Pb-Contaminated soil based on microbially induced calcite precipitation. J. Microbiol. Biotechnol. 2012, 22, 244–247. [Google Scholar]
- Tiquia-Arashiro, S.M. Lead absorption mechanisms in bacteria as strategies for lead bioremediation. Appl. Microbiol. Biotechnol. 2018, 102, 5437–5444. [Google Scholar] [CrossRef]
- Arbabi, M.; Hemati, S.; Amiri, M. Removal of lead ions from industrial wastewater: A review of removal methods. Int. J. Epidemiol. Res. 2015, 2, 105–109. [Google Scholar]
- Chimhundi, J.; Horstmann, C.; Chirwa, E.M.N.; Brink, H.G. Microbial removal of Pb(II) Using an Upflow Anaerobic Sludge Blanket (UASB) reactor. Catalysts 2021, 11, 512. [Google Scholar] [CrossRef]
- Van Veenhuyzen, B.; Hörstmann, C.; Peens, J.; Brink, H.G. Bioremediation and biorecovery of aqueous lead by local lead-resistant organisms. Emerg. Techol. Environ. Bioremediation 2020, 407–424. [Google Scholar] [CrossRef]
- Hörstmann, C.; Brink, H.G.; Chirwa, E.M.N. Pb (II) bio-removal, viability, and population distribution of an industrial microbial consortium: The effect of Pb(II) and nutrient concentrations. Sustainability 2020, 12, 2511. [Google Scholar] [CrossRef] [Green Version]
- Statista Lead Reserves Worldwide as of 2018, by Country (in Million Metric Tons). Available online: https://www.statista.com/statistics/273652/global-lead-reserves-by-selected-countries/2/5 (accessed on 2 May 2020).
- International Lead Association ILA—International Lead Association. Available online: https://www.ila-lead.org/lead-facts/lead-production--statistics (accessed on 3 June 2020).
- Lud, W.; Prihanta, W.; Bachtiard, Z.; Permana, T.I. Potential bioremediation of lead (Pb) using marine microalgae Nannochloropsis oculata potential bioremediation of lead (Pb) using marine microalgae nannochloropsis oculata. In Proceedings of the AIP Conference Proceedings, Indonesia, Malang, 26 August 2020; Volume 2231, p. 40088. [Google Scholar]
- Utami, U.; Harianie, L.; Dunyana, N. Lead-resistant bacteria isolated from oil wastewater sample for bioremediation of lead. Water Sci. Technol. 2020, 81, 2244–2249. [Google Scholar] [CrossRef]
- Zhang, K.; Xue, Y.; Xu, H.; Yao, Y. Lead removal by phosphate solubilizing bacteria isolated from soil through biomineralization. Chemosphere 2019, 224, 272–279. [Google Scholar] [CrossRef] [PubMed]
- Proust, L.; Sourabié, A.; Pedersen, M.; Besançon, I.; Haudebourg, E.; Monnet, V.; Juillard, V.; Hebert, E.M.; Mora, D. Insights into the complexity of yeast extract peptides and their utilization by streptococcus thermophilus. Front. Microbiol. 2019, 10, 906. [Google Scholar] [CrossRef] [PubMed] [Green Version]
- Sezonov, G.; Joseleau-Petit, D.; Ari, R.D. Escherichia coli physiology in luria-bertani broth. J. Bacteriol. 2007, 189, 8746–8749. [Google Scholar] [CrossRef] [PubMed] [Green Version]
- Perkin-Elmer Atomic Spectroscopy A Guide to Selecting the Appropriate Technique and System; PerkinElmer: Waltham, MA, USA, 2011.
- Kikuchi, S.; Ishimoto, M. Nitrate respiration of Klebsiella pneumoniae on amino acids, especially on serine. Z. Allg. Mikrobiol. 1980, 20, 405–413. [Google Scholar] [CrossRef] [PubMed]
- America, A.H.P.; Cordewener, J.H.G. Comparative LC-MS: A landscape of peaks and valleys. Proteomics 2008, 8, 731–749. [Google Scholar] [CrossRef] [PubMed]
- Peens, J. Pb (II)-Removal from Water Using Microorganisms Naturally Evolved to Tolerate Pb(II)-Toxicity. Master’s Thesis, University of Pretoria, Pretoria, South Africa, October 2018. [Google Scholar]
- Brink, H.G.; Hörstmann, C.; Peens, J. Microbial Pb(II)-precipitation: The influence of oxygen on Pb(II)-removal from aqueous environment and the resulting precipitate identity. Int. J. Environ. Sci. Technol. 2019, 17, 409–420. [Google Scholar] [CrossRef]
- Abdel-Rehim, A.M. Thermal and XRD analysis of Egyptian galena. J. Therm. Anal. Calorim. 2006, 86, 393–401. [Google Scholar] [CrossRef]
- Henrik, K.; Rodrigues, S.P.; Maurelli, A.T.; Mccormick, B.A. Inhibition of Salmonella typhimurium Enteropathogenicity by Piperidine, a Metabolite of the Polyamine Cadaverine. J. Infect. Dis. 2002, 186, 1122–1130. [Google Scholar]
- Bae, H.-S.; Im, W.-T.; Suwa, Y.; Lee, J.M.; Lee, S.-T.; Chan, Y.-K. Characterization of diverse heterocyclic amine-degrading denitrifying bacteria from various environments. Arch. Microbiol. 2009, 191, 329–340. [Google Scholar] [CrossRef]
- Tomar, P.C.; Lakra, N.; Mishra, S.N. A lysine catabolite involved in plant growth and development Cadaverine. Plant Signal. Behav. 2013, 8, e25850. [Google Scholar] [CrossRef] [Green Version]
- Knorr, S.; Sinn, M.; Galetskiy, D.; Williams, R.M.; Wang, C.; Müller, N.; Mayans, O.; Schleheck, D.; Hartig, J.S. Widespread bacterial lysine degradation proceeding via glutarate and L-2-hydroxyglutarate. Nat. Commun. 2018, 9, 2–11. [Google Scholar] [CrossRef]
- Revelles, O.; Espinosa-urgel, M.; Fuhrer, T.; Sauer, U.; Ramos, J.L. Multiple and Interconnected Pathways for L-Lysine Catabolism in Multiple and Interconnected Pathways for L -Lysine Catabolism in Pseudomonas putida KT2440. J. Bacteriol. 2005, 187, 7500–7510. [Google Scholar] [CrossRef] [Green Version]
- Sun, H.; Ehlhardt, W.J.; Kulanthaivel, P.; Lanza, D.L.; Reilly, C.A.; Yost, G.S. Dehydrogenation of indoline by cytochrome P450 Enzymes: A novel dehydrogenation of indoline by cytochrome P450 enzymes: A novel “Aromatase” process. J. Pharmacol. Exp. Ther. 2007, 322, 843–851. [Google Scholar] [CrossRef] [PubMed]
- Ma, Q.; Zhang, X.; Qu, Y. Biodegradation and biotransformation of indole: Advances and perspectives. Front. Microbiol. 2018, 9, 2625. [Google Scholar] [CrossRef] [PubMed]
- Madsen, E.L. Bollag. J. Hicrobiology. Arch. Microbiol. 1989, 151, 71–76. [Google Scholar] [CrossRef]
- Corbett, B.M.D.; Chipko, B.R. Peroxide Oxidation of hdole to Oxindole by chloroperoxidase catalysis. Biochem. J. 1979, 183, 269–276. [Google Scholar] [CrossRef] [PubMed] [Green Version]
- Laempe, D.; Martina, J.; Georg, F. 6-Hydroxycyclohex-1-ene-1-carbonyl-CoA dehydrogenase and 6-oxocyclohex-1-en. Eur. J. Biochem. 1999, 263, 420–429. [Google Scholar] [CrossRef] [PubMed] [Green Version]
- Yuan, L.; Liu, J.; Xiao, X. Biooxidation of indole and characteristics of the responsible enzymes. Afr. J. Biotechnol. 2011, 10, 19855–19863. [Google Scholar]
- Roager, H.M.; Licht, T.R. Microbial tryptophan catabolites in health and disease. Nat. Commun. 2018, 9, 1–10. [Google Scholar] [CrossRef] [Green Version]
- Zhang, P.; Jin, T.; Sahu, S.K.; Xu, J.; Shi, Q.; Liu, H.; Wang, Y. The distribution of tryptophan-dependent indole-3-acetic acid synthesis pathways in bacteria unraveled by large-scale genomic analysis. Molecules 2019, 24, 1411. [Google Scholar] [CrossRef] [Green Version]
- Kaminogawa, S.; Azuma, N.; Hwang, I.; Suzuki, Y. Isolation and characterization of a prolidase from streptococcus cremoris H61. Agric. Biol. Chem. 2014, 48, 3035–3040. [Google Scholar] [CrossRef]
- Chamadol, N.; Hughes, T.; Connor, T.O.; Andrews, R.H.; Holmes, E.; Taylor-Robinson, S.D. Characterisation of the urinary metabolic profile of liver fluke-associated cholangiocarcinoma. J. Clin. Exp. Hepatol. 2019, 9, 657–675. [Google Scholar]
- Jandke, J.; Spiteller, G. Dipeptide analysis in human urine. J. Chromatogr. 1986, 382, 39–45. [Google Scholar] [CrossRef]
- Moses, S.; Sinner, T.; Zaprasis, A.; Stöveken, N.; Hoffmann, T.; Belitsky, B.R. Proline Utilization by Bacillus subtilis: Uptake and Catabolism. J. Bacteriol. 2012, 194, 745–758. [Google Scholar] [CrossRef] [PubMed] [Green Version]
- Riekeberg, E.; Powers, R. Escherichia coli and Salmonella: Cellular and molecular biology. F1000Research 2017, 6, 1–10. [Google Scholar]
- Rudman, D.; Meister, A. Transamination in escherichia coli. J. Biol. Chem. 1952, 200, 591–604. [Google Scholar] [CrossRef]
- Kinney, R.W. The Bacterial Degradation of Leucine; Iowa State University: Ames, IA, USA, 1960. [Google Scholar]
- Wang, H.; Cheng, H.; Wang, F.; Wei, D.; Wang, X. An improved 3-(4,5-dimethylthiazol-2-yl)-2,5-diphenyl tetrazolium bromide (MTT) reduction assay for evaluating the viability of Escherichia coli cells. J. Microbiol. Methods 2010, 82, 330–333. [Google Scholar] [CrossRef]
- Wooding, M.; Rohwer, E.R.; Naudé, Y. Determination of endocrine disrupting chemicals and antiretroviral compounds in surface water: A disposable sorptive sampler with comprehensive gas chromatography—Time-of-flight mass spectrometry and large volume injection with ultra-high performance liquid chromatography—Tandem mass spectrometry. J. Chromatogr. 2017, 1496, 122–132. [Google Scholar]
- Brandes, H.K.; Claus, J.E.; Bell, D.S.; Aurand, C.R. Improved Reversed-Phase Peptide Separations on High-Performance Silica Particles, Sigma-Aldrich; Sigma-Aldrich: Bellefonte, PA, USA, 2010; pp. 1–20. [Google Scholar]


| Microorganism Type and Name | Pb Contamination Type | Mechanism | Maximum Pb Concentration | Removal (%) | Precipitate Identity | Reference |
|---|---|---|---|---|---|---|
| Bacteria Kocuria flava | Soil | Calcite precipitation | 85.4 mg/kg | 83.4 | Various Pb calcite species | [4] |
| Microalgae Nannochloropsis oculata | Water | Pb absorption | 1.3 ppm | 55 | Not applicable | [12] |
| Microbial consortium | Water | Biosorption | 50 ppm | 57 | Not mentioned | [13] |
| Bacteria Bacillus sp. | Water | Biosorption | 518 ppm | 37 | Pb5(PO4)3 OH | [14] |
| Microbial consortium (mainly Klebsiella pneumoniae and Clostridium bifermentans) | Water | Biosorption coupled with bio-precipitation | 2000 ppm | 99 | PbS, PbO, Pb0 | [7,9] |
| Compound (Mass Spectrometry Similarity ≥90%) | Mass (g/mol) | Retention Time (min) | Formula | Structure |
|---|---|---|---|---|
| Piperidine | 85.15 | 0.72–0.74 | C5 H11 N |  |
| Indoline | 119.1 | 1.05–1.054 | C8 H9 N |  |
| Indoleacrylic Acid | 187.1 | 1.49–1.5 | C11 H9 NO2 |  |
| Leucylproline | 228.2 | 2.58 | C11 H20 N2 O3 |  |
| Dataset | PbS (%) | PbO (%) | Pb0 (%) |
|---|---|---|---|
| 80 LB [21] | 54 | 38 | 8 |
| 500 Sim | 59 | 41 | 0 |
| Compound | Product | NADHi | FADHi | NADHTCA | FADHTCA | Net NADH and FADH (mmol/L) |
|---|---|---|---|---|---|---|
| Piperidine | 2 × Acetyl-CoA | 4 | 0 | 3 × 2 = 6 | 1 × 2 = 2 | 1.49 |
| Indoline | 3 × Acetyl-CoA | 5 | 0 | 3 × 3 = 9 | 1 × 3 = 3 | 3.36 |
| Leucylproline | 3 × Acetyl-CoA + Fumarate | 4 | 0 | 3 × 3 + 2 = 11 | 1 × 3 + 1 = 4 | 0.68 |
| Indoleacrylic acid | 4 × Acetyl-CoA | 7 | 0 | 3 × 3 + 3 = 12 | 1 × 4 = 4 | 4.87 |
| Total | 10.4 |
| PB SPECIES | Concentration after 33 h (ppm) | Concentration after 144 h (ppm) [9] |
|---|---|---|
| PBS | 38.04 | 38.04 |
| PBO | 7.79 | 24.98 |
| PB0 | 4.88 | |
| TOTAL | 45.83 | 67.9 |
Publisher’s Note: MDPI stays neutral with regard to jurisdictional claims in published maps and institutional affiliations. |
© 2021 by the authors. Licensee MDPI, Basel, Switzerland. This article is an open access article distributed under the terms and conditions of the Creative Commons Attribution (CC BY) license (https://creativecommons.org/licenses/by/4.0/).
Share and Cite
Cilliers, C.; Chirwa, E.M.N.; Brink, H.G. Insight into the Metabolic Profiles of Pb(II) Removing Microorganisms. Molecules 2021, 26, 4008. https://doi.org/10.3390/molecules26134008
Cilliers C, Chirwa EMN, Brink HG. Insight into the Metabolic Profiles of Pb(II) Removing Microorganisms. Molecules. 2021; 26(13):4008. https://doi.org/10.3390/molecules26134008
Chicago/Turabian StyleCilliers, Carla, Evans M. N. Chirwa, and Hendrik G. Brink. 2021. "Insight into the Metabolic Profiles of Pb(II) Removing Microorganisms" Molecules 26, no. 13: 4008. https://doi.org/10.3390/molecules26134008
APA StyleCilliers, C., Chirwa, E. M. N., & Brink, H. G. (2021). Insight into the Metabolic Profiles of Pb(II) Removing Microorganisms. Molecules, 26(13), 4008. https://doi.org/10.3390/molecules26134008