
Analysis of Mercury in Skin Lightening Cream by Microwave Plasma Atomic Emission Spectroscopy (MP-AES)


Abstract

1. Introduction
2. Results
3. Discussion
4. Materials and Method
4.1. Materials
4.2. Reagent Preparation
4.3. Measurement Optimization
4.3.1. Initial Conditions of MP-AES System
- Reaction chamber: MSIS (multimode sample introduction system),
- Reductant: solution of sodium borohydride (NaBH4) 1.0%,
- Wavelength: 253.652 nm,
- Stabilization time: 15 s,
- Uptake time: 10 s,
- Pump speed: 50 rpm,
- Injection system: manual.
4.3.2. Optimization of NaBH4 Reductant Concentration
4.3.3. Test of Solution Stability
4.4. Sample Preparation
4.5. Precision Test
4.6. Accuracy Test
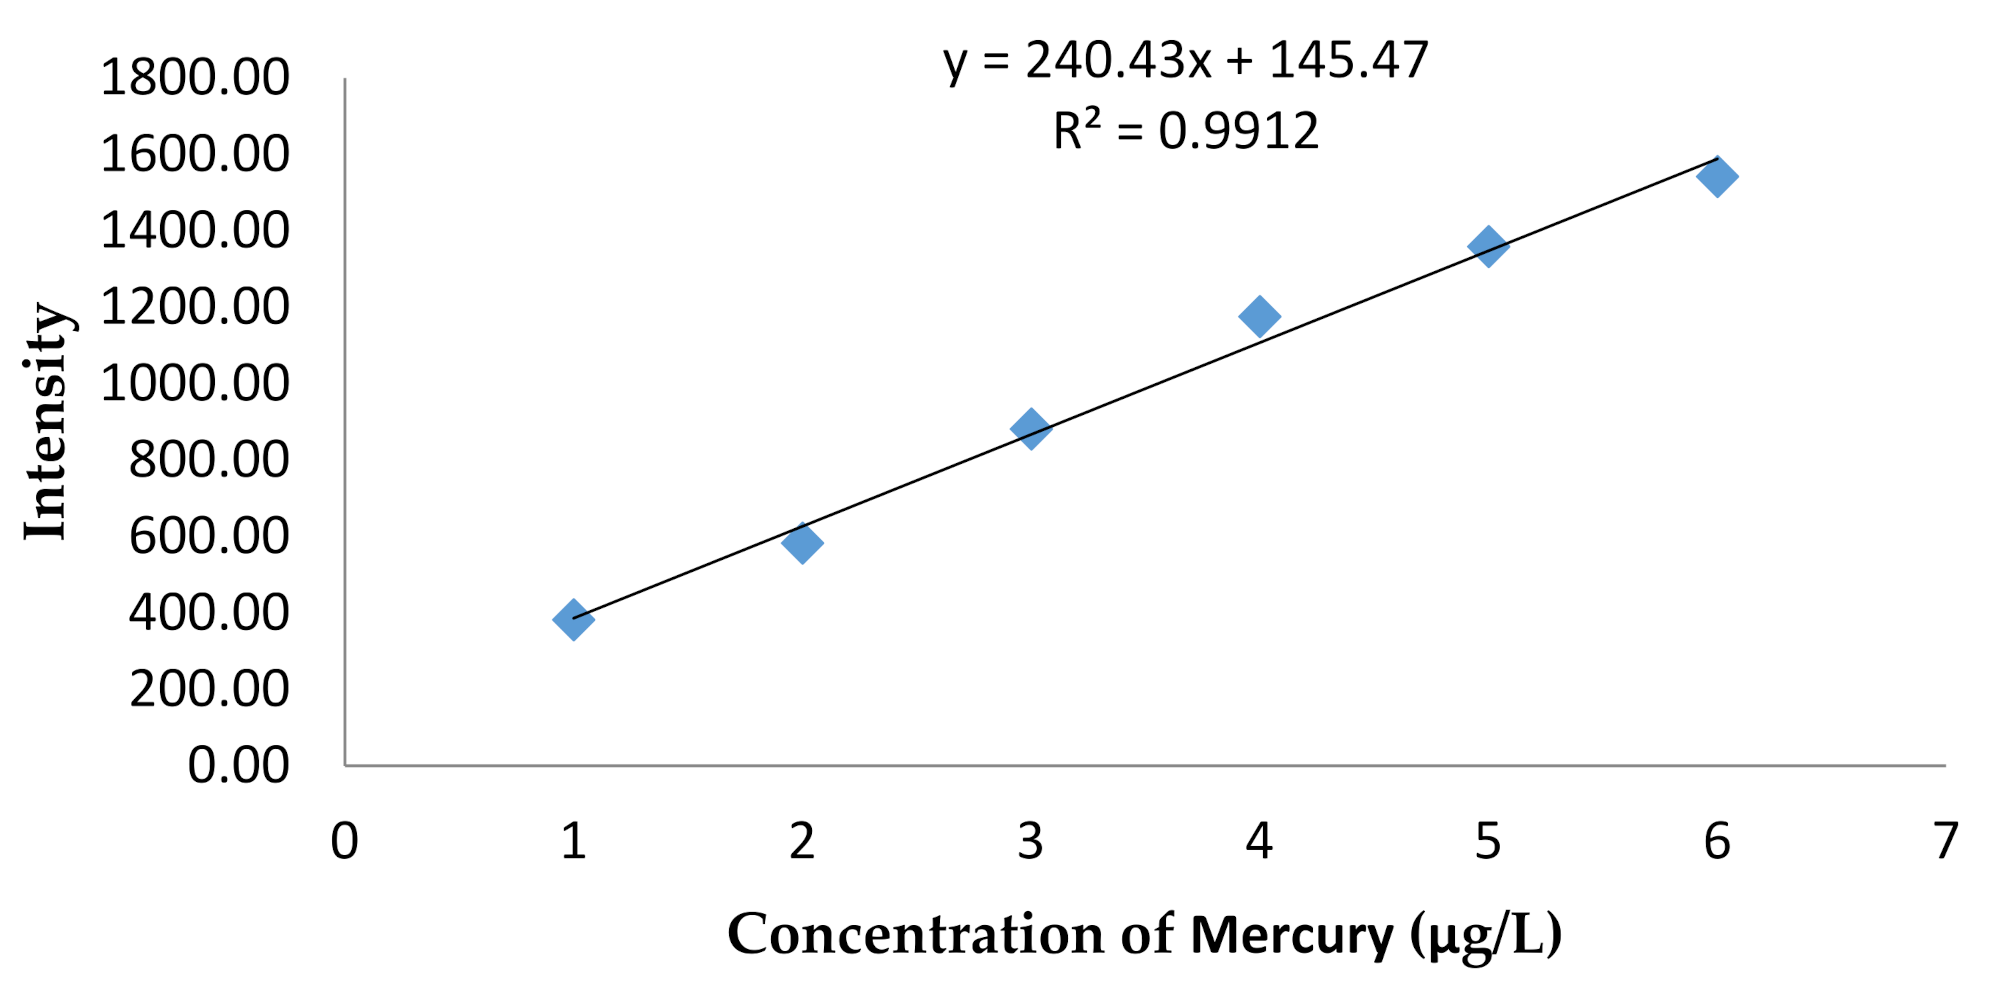
4.7. Linearity Test
4.8. Test of Limit of Detection (LoD) and Limit of Quantity (LoQ)
5. Conclusions
Author Contributions
Funding
Institutional Review Board Statement
Informed Consent Statement
Data Availability Statement
Acknowledgments
Conflicts of Interest
Sample Availability
References
- Regulation of Indonesia National Agency of Food and Drug Control (INAFDC/BPOM). The Pollutants in Cosmetics; National Agency of Food and Drug Control: Jakarta, Indonesia, 2019. (In Indonesian) [Google Scholar]
- Clarkson, T.; Magos, L. The toxicology of mercury and its chemical compounds. Critic. Rev.Toxicol. 2006, 36, 609–662. [Google Scholar] [CrossRef] [PubMed]
- Arshad, H.; Mehmood, M.Z.; Shah, M.S.; Abbasi, A.M. Evaluation of heavy metals in cosmetic products and their health risk assessment. Saudi Pharm. J. 2020, 28, 779–790. [Google Scholar] [CrossRef] [PubMed]
- Alam, M.F.; Akhter, M.; Mazumder, B.; Ferdous, A.; Hossain, M.D.; Dafader, N.C.; Ahmed, F.T.; Kundu, S.K.; Taheri, T.; Atique Ullah, A.K.M. Assessment of some heavy metals in selected cosmetics commonly used in Bangladesh and human health risk. J. Anal. Sci. Tech. 2019, 10, 2. [Google Scholar] [CrossRef]
- Dwijayanti, E.; Susanti, S. Analysis of Mercury (Hg) in Whitening Cream Distributed in Palu City by Atomic Absorption Spectroscopy (AAS). J. Appl. Chem. Sci. 2018, 5, 430–433. [Google Scholar] [CrossRef]
- Ladizinski, B.; Mistry, N.; Kundu, R.V. Widespread Use of Toxic Skin Lightening Compounds: Medical and Psychosocial Aspects. Dermatol. Clin. 2011, 29, 111–123. [Google Scholar] [CrossRef] [PubMed]
- World Health Organization. Mercury and Health. 2017. Available online: https://www.who.int/news-room/fact-sheets/detail/mercury-and-health (accessed on 16 April 2021).
- Head, K.A. Peripheral neuropathy: Pathogenic mechanisms and alternative therapies. Altern. Med. Rev. 2006, 11, 294–329. [Google Scholar]
- Robbins, W.B.; Caruso, J.A. Development of Hdyride Generation Method for Atomic Spectroscopy Analysis. Anal. Chem. 1979, 51, 889A. [Google Scholar] [CrossRef]
- Lateef, A.M.A.; Mohamed, R.A.; Mahmoud, H.M. Determination of Arsenic (III) and (V) Species in Some Environmental Samples by Atomic Absorption Spectrometry. Adv. Chem. Sci. 2013, 2, 110–113. [Google Scholar]
- Moreno, F.N.; Anderson, C.; Stewart, R.; Robinson, B. Analysis of Mercury-Rich Plants and Mine Tailings Using the Hydride-Generation AAS Method. Braz. Arch. Biol. Tech. 2009, 52, 953–960. [Google Scholar] [CrossRef]
- Mohammed, E.; Mohammed, T.; Mohammed, A. Optimization of instrument conditions for the analysis for mercury, arsenic, antimony and selenium by atomic absorption spectroscopy. MethodsX 2018, 5, 824–833. [Google Scholar] [CrossRef] [PubMed]
- Zhao, Y.; Li, Z.; Ross, A.; Huang, Z.; Chang, W.; Ou-yang, K.; Chen, Y.; Wu, C. Determination of heavy metals in leather and fur by microwave plasma-atomic emission spectrometry. Spectrochim. Acta Part B Atomic Spectros. 2015, 112, 6–9. [Google Scholar] [CrossRef]
- Kamala, C.T.; Balaram, V.; Dharmendra, V.; Satyanarayanan, M.; Subramanyam, K.S.V.; Krishnaiah, A. Application of Microwave Plasma Atomic Emission Spectrometry (MP-AES) for environmental monitoring of industrially contaminated sites in Hyderabad City. Environ. Monit. Assess. 2014, 186, 7097–7113. [Google Scholar] [CrossRef] [PubMed]
- Karlsson, S.; Sjoberg, V.; Ogar, A. Comparison of MP AES and ICP-MS for analysis of principal and selected trace elements in nitric acid digests of sunflower (Helianthus annuus). Talanta 2015, 135, 124–132. [Google Scholar] [CrossRef] [PubMed]
- Wu, C.; Chen, Y.; Ou-yang, K.; Zhang, Z.; Taylor, C. Analysis of Chinese Herbal Medicines by Microwave Plasma-Atomic Emission Spectrometry (MP-AES) Application Note. Agil. Technol. 2012. Available online: https://hpst.cz/sites/default/files/oldfiles/5990-9791en-appnote-4100mp-aes-chinesemedicines.pdf (accessed on 2 February 2021).
- Yang, X.; Pan, J.-C.; Lei, Y.-Q.; Zhou, Q.-L.; Guo, P.-R. Simultaneous Determination of Multiple Elements in Characteristic South China Herbal Medicine by Microwave Plasma Atomic Emission Spectrometry. J. Instrum. Anal. 2015, 34, 227–231. [Google Scholar] [CrossRef]
- Alves, V.M.; Muratov, E.N.; Zakharov, A.; Muratov, N.N.; Andrade, C.H.; Tropsha, A. Chemical toxicity prediction for major classes of industrial chemicals: Is it possible to develop universal models covering cosmetics, drugs, and pesticides? Food Chem. Toxicol. 2018, 112, 526–534. [Google Scholar] [CrossRef] [PubMed]
- Linsey, M.; Milnes, I. Heavy Metal Analysis of Cosmetics & Personal Care Products: A Critical and Unavoidable Global Challenge. EURO Cosmet. 2011, 19, 17–19. [Google Scholar]
- AOAC International. Appendix F: Guidelines for Standard Method Performance Requirements. 2016. Available online: http://www.eoma.aoac.org/app_f.pdf (accessed on 1 February 2021).
- Torres, D.P.; Frescura, V.L.A.; Curtius, A.J. Simple mercury fractionation in biological samples by CV AAS following microwave-assisted acid digestion or TMAH pre-treatment. Microchem. J. 2009, 93, 206–210. [Google Scholar] [CrossRef]
- Li, Y.; Chen, C.; Li, B.; Sun, J.; Wang, J.; Gao, Y.; Zhao, Y.; Chai, Z. Elimination efficiency of different reagents for the memory effect of mercury using ICP-MS. J. Anal. At. Spectrom. 2006, 21, 94–96. [Google Scholar] [CrossRef]
- Valentina, G.; Minkina, V.G.; Stanislav, I.; Shabunya, S.I.; Vladimir, I.; Kalinin, V.I.; Vladimir, V.; Martynenko, V.V.; Alevtina, L.; Smirnova, A.L. Stability of alkaline aqueous solutions of sodium borohydride. Int. J. Hydrogen Energy 2012, 37, 3313–3318. [Google Scholar] [CrossRef]


| Label | Intensity |
|---|---|
| Precision 1 | 2118.279 |
| Precision 2 | 2071.708 |
| Precision 3 | 2040.439 |
| Precision 4 | 1993.080 |
| Precision 5 | 2005.446 |
| Precision 6 | 1973.390 |
| Average | 2033.724 |
| Standard deviation (SD) | 54.28 |
| RSD (%) | 2.67 |
| Label | Intensity | Expected Value (ng/g) | Obtained Value (ng/g) | Recovery (%) |
|---|---|---|---|---|
| Recovery 1 | 2118.279 | 40.00 | 38.55 | 96.37 |
| Recovery 2 | 2071.708 | 40.00 | 37.76 | 94.39 |
| Recovery 3 | 2040.439 | 40.00 | 37.23 | 93.06 |
| Recovery 4 | 1993.080 | 40.00 | 36.42 | 91.05 |
| Recovery 5 | 2005.446 | 40.00 | 36.63 | 91.57 |
| Recovery 6 | 1973.390 | 40.00 | 36.08 | 90.21 |
| Average | 92.78 | |||
| The smallest | 90.21 | |||
| The biggest | 96.37 | |||
| Sample Code | Mercury Content (µg/g) |
|---|---|
| 1 | n.d. |
| 2 | n.d. |
| 3 | n.d. |
| 4 | n.d. |
| 5 | 1901.82 |
| 6 | n.d. |
| 7 | 422.61 |
| 8 | n.d. |
| 9 | n.d. |
| 10 | n.d. |
| 11 | 836.27 |
| 12 | 44,960.79 |
| 13 | 26,212.56 |
| 14 | 6681.45 |
| 15 | 4928.30 |
| 16 | 4360.44 |
| Step | Temperature (°C) | Time (min) | Power (Watt) |
|---|---|---|---|
| 1 | 130 | 10 | 800 |
| 2 | 160 | 10 | 800 |
| 3 | 190 | 10 | 800 |
Publisher’s Note: MDPI stays neutral with regard to jurisdictional claims in published maps and institutional affiliations. |
© 2021 by the authors. Licensee MDPI, Basel, Switzerland. This article is an open access article distributed under the terms and conditions of the Creative Commons Attribution (CC BY) license (https://creativecommons.org/licenses/by/4.0/).
Share and Cite
Qudus, H.I.; Purwadi, P.; Holilah, I.; Hadi, S. Analysis of Mercury in Skin Lightening Cream by Microwave Plasma Atomic Emission Spectroscopy (MP-AES). Molecules 2021, 26, 3130. https://doi.org/10.3390/molecules26113130
Qudus HI, Purwadi P, Holilah I, Hadi S. Analysis of Mercury in Skin Lightening Cream by Microwave Plasma Atomic Emission Spectroscopy (MP-AES). Molecules. 2021; 26(11):3130. https://doi.org/10.3390/molecules26113130
Chicago/Turabian StyleQudus, Hardoko I., Purwadi Purwadi, Iis Holilah, and Sutopo Hadi. 2021. "Analysis of Mercury in Skin Lightening Cream by Microwave Plasma Atomic Emission Spectroscopy (MP-AES)" Molecules 26, no. 11: 3130. https://doi.org/10.3390/molecules26113130
APA StyleQudus, H. I., Purwadi, P., Holilah, I., & Hadi, S. (2021). Analysis of Mercury in Skin Lightening Cream by Microwave Plasma Atomic Emission Spectroscopy (MP-AES). Molecules, 26(11), 3130. https://doi.org/10.3390/molecules26113130