
The Glitazone Class of Drugs as Carbonic Anhydrase Inhibitors—A Spin-Off Discovery from Fragment Screening


 ,
,  , and
, and
Abstract

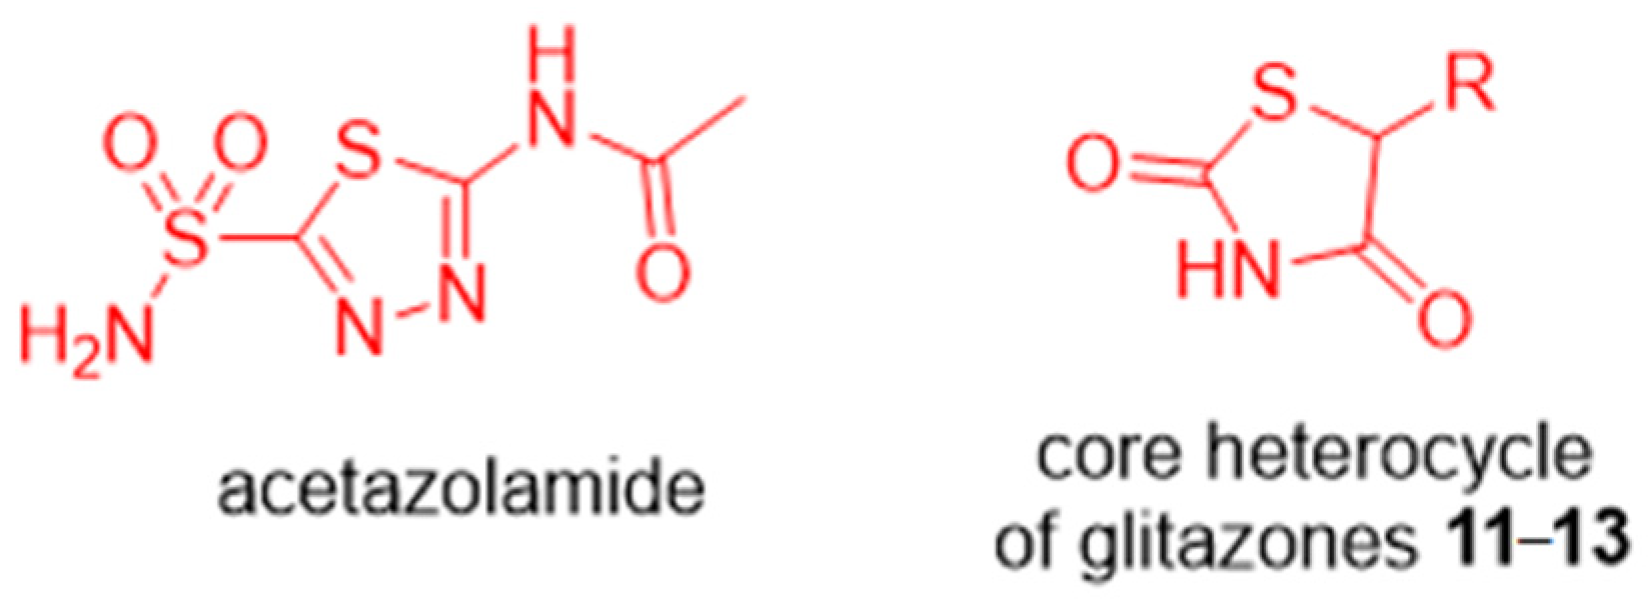
1. Introduction
2. Results and Discussion
2.1. Native Mass Spectrometry
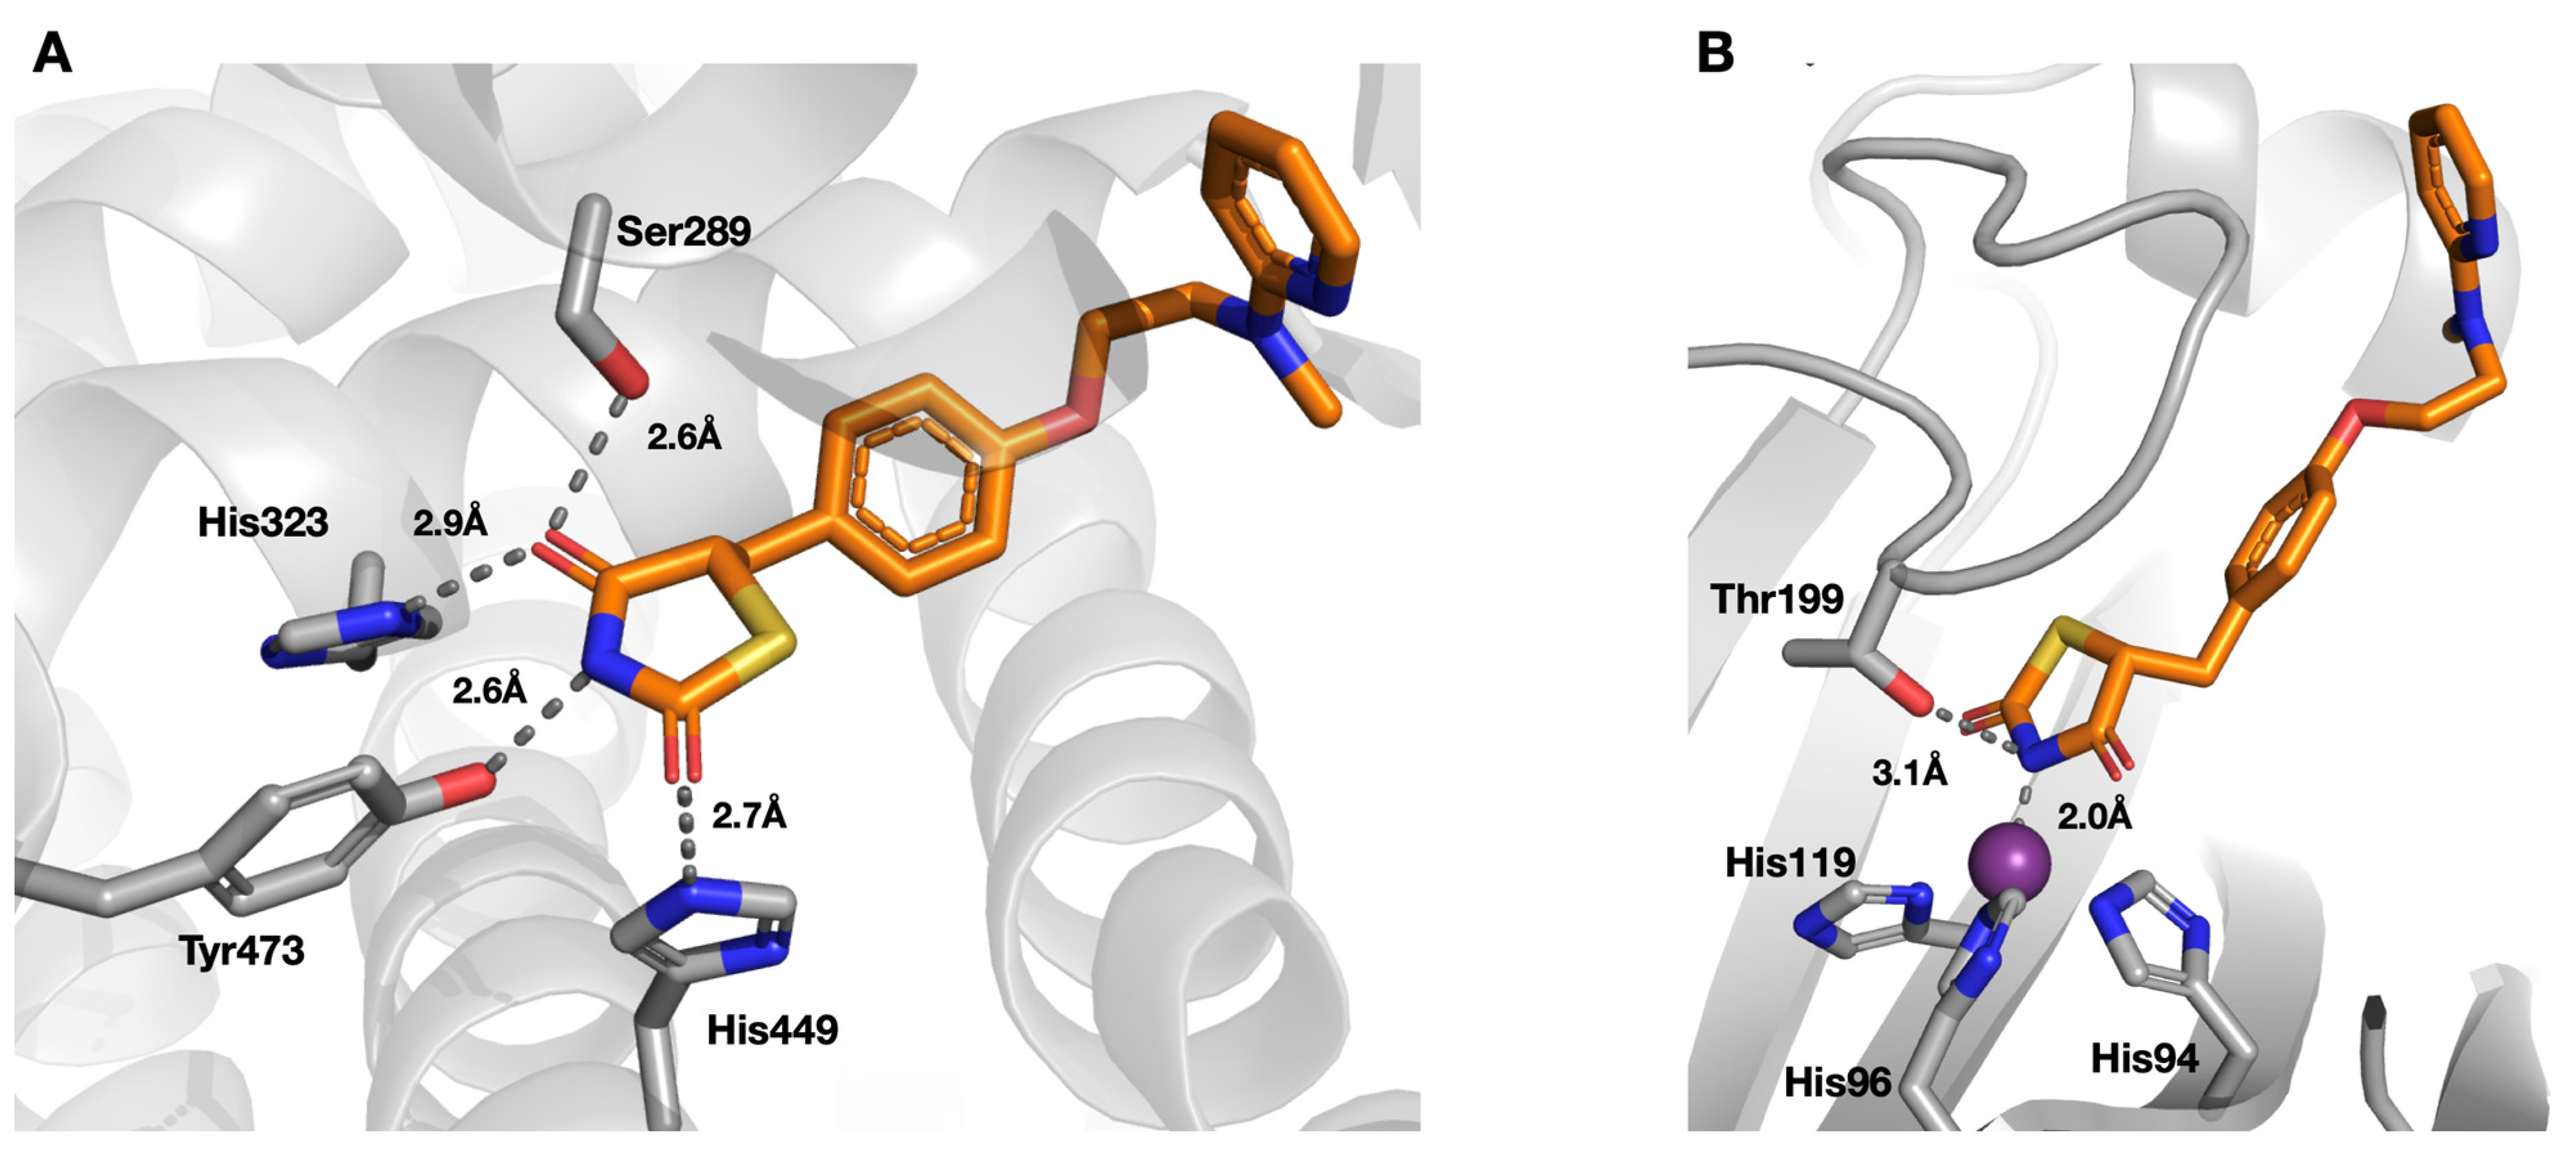
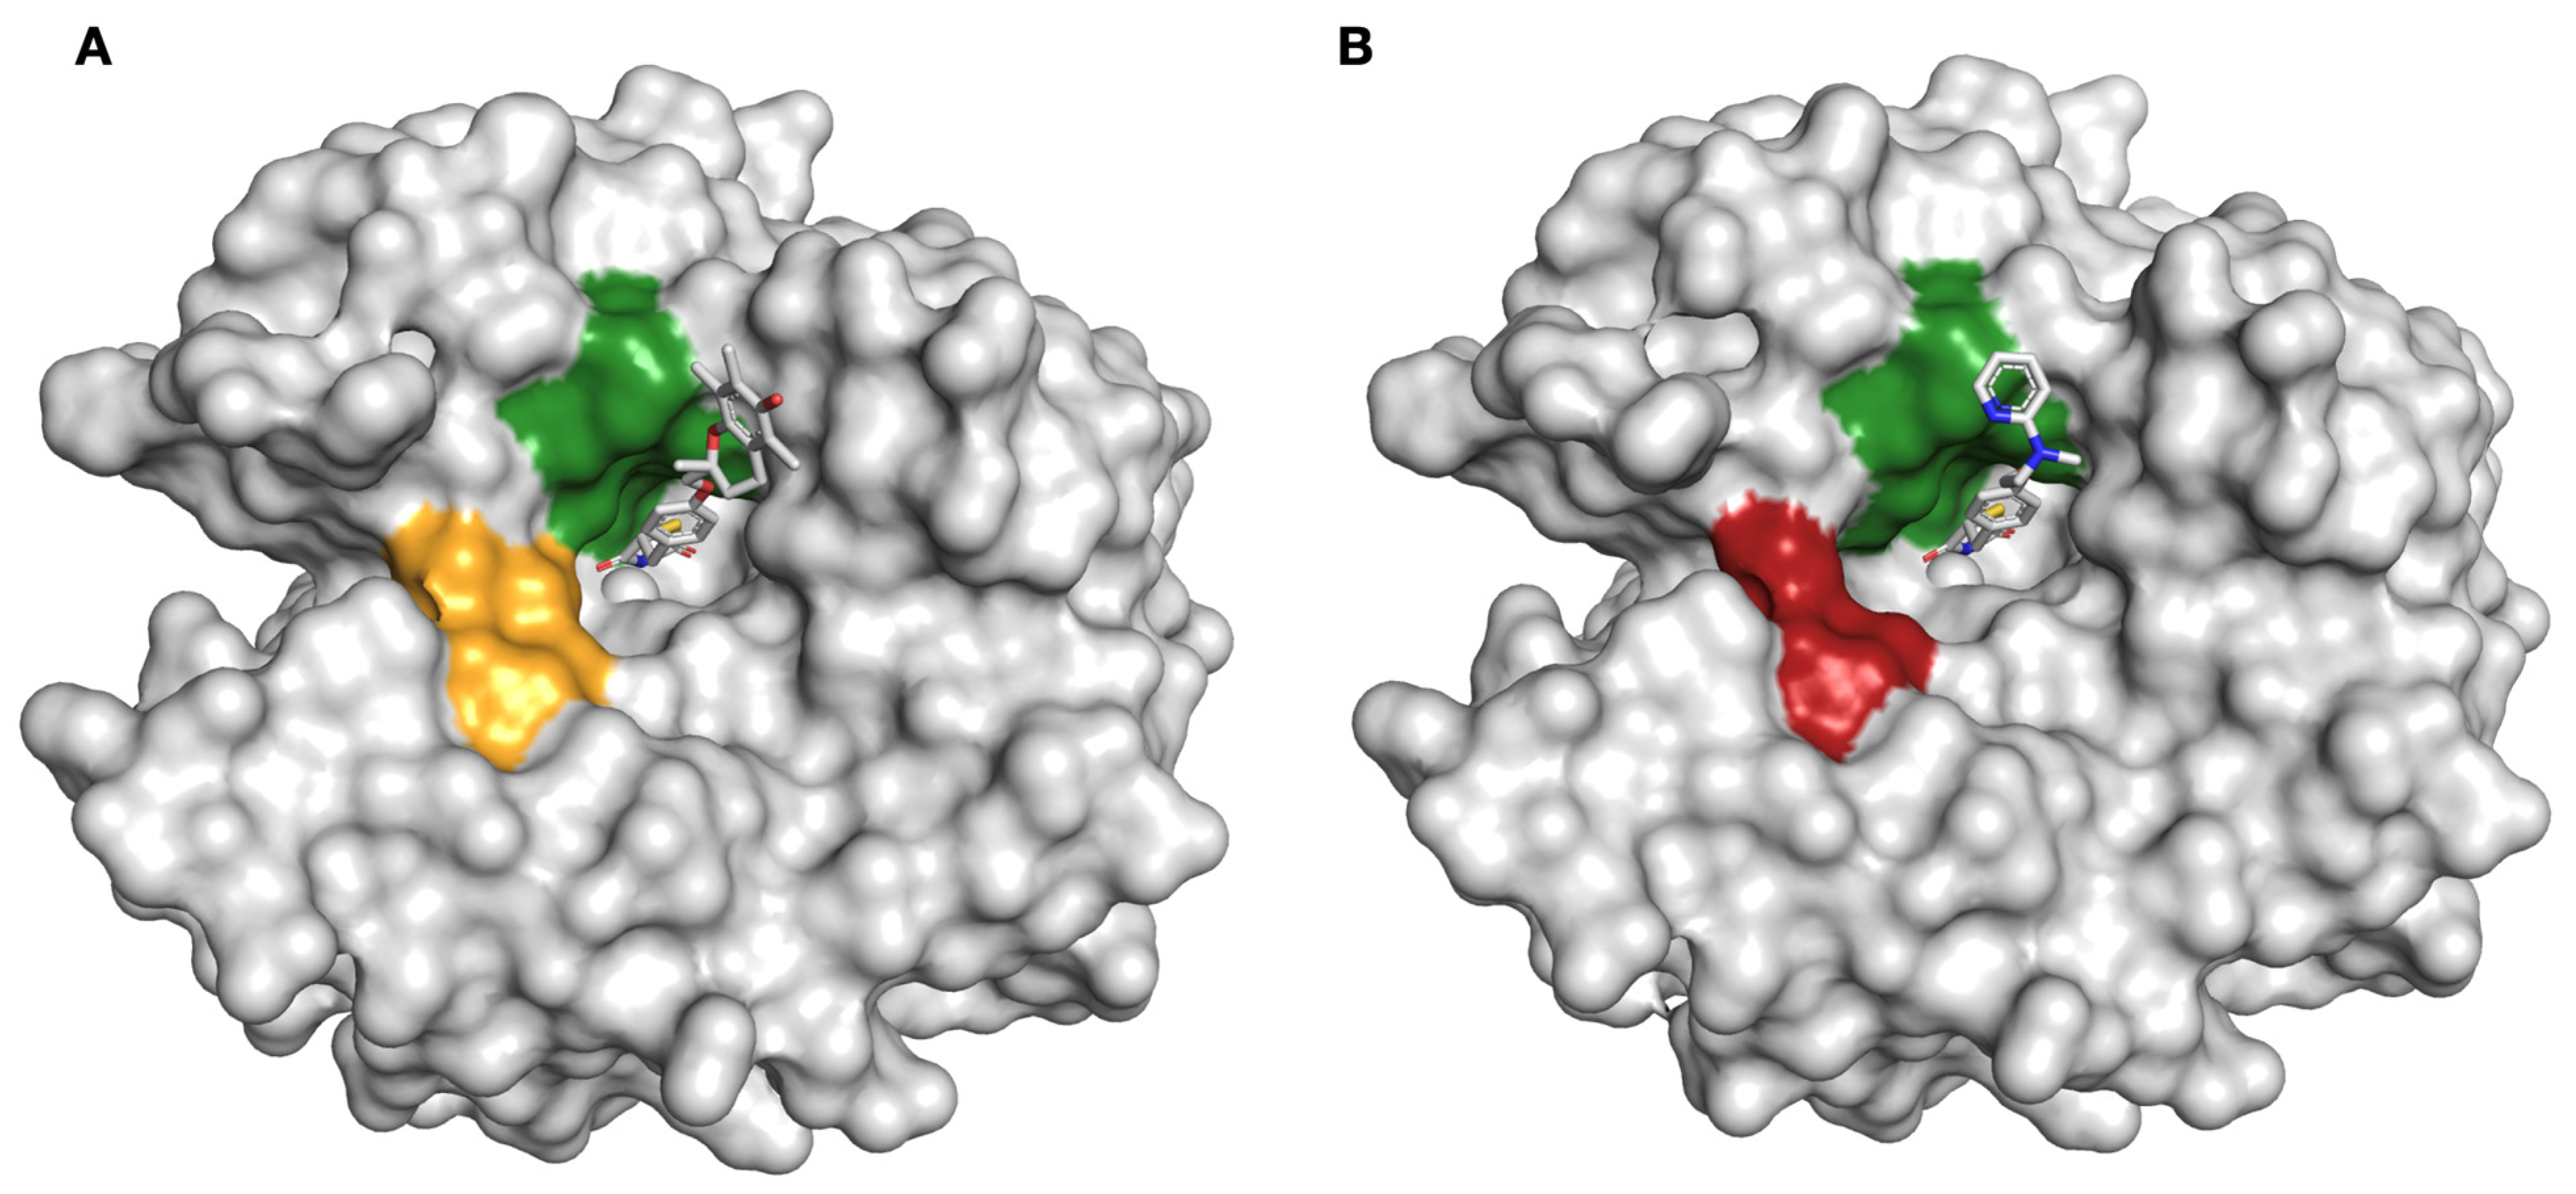
2.2. Protein X-ray Crystallography
2.3. Hydrogen–Deuterium Exchange Mass Spectrometry
2.4. Carbonic Anhydrase Inhibition
3. Materials and Methods
3.1. Native Mass Spectrometry
3.2. Protein X-ray Crystallography
3.3. Hydrogen–Deuterium Exchange Mass Spectrometry
3.4. Carbonic Anhydrase Inhibition
4. Conclusions
Supplementary Materials
Author Contributions
Funding
Institutional Review Board Statement
Informed Consent Statement
Data Availability Statement
Acknowledgments
Conflicts of Interest
References
- Erlanson, D.A.; Fesik, S.W.; Hubbard, R.E.; Jahnke, W.; Jhoti, H. Twenty years on: The impact of fragments on drug discovery. Nat. Rev. Drug Discov. 2016, 15, 605–619. [Google Scholar] [CrossRef]
- Jahnke, W.; Erlanson, D.A.; de Esch, I.J.P.; Johnson, C.N.; Mortenson, P.N.; Ochi, Y.; Urushima, T. Fragment-to-lead medicinal chemistry publications in 2019. J. Med. Chem. 2020, 63, 15494–15507. [Google Scholar] [CrossRef]
- Johnson, C.N.; Erlanson, D.A.; Murray, C.W.; Rees, D.C. Fragment-to-lead medicinal chemistry publications in 2015. J. Med. Chem. 2017, 60, 89–99. [Google Scholar] [CrossRef]
- Johnson, C.N.; Erlanson, D.A.; Jahnke, W.; Mortenson, P.N.; Rees, D.C. Fragment-to-lead medicinal chemistry publications in 2016. J. Med. Chem. 2018, 61, 1774–1784. [Google Scholar] [CrossRef]
- Mortenson, P.N.; Erlanson, D.A.; de Esch, I.J.P.; Jahnke, W.; Johnson, C.N. Fragment-to-lead medicinal chemistry publications in 2017. J. Med. Chem. 2019, 62, 3857–3872. [Google Scholar] [CrossRef]
- Erlanson, D.A.; de Esch, I.J.P.; Jahnke, W.; Johnson, C.N.; Mortenson, P.N. Fragment-to-lead medicinal chemistry publications in 2018. J. Med. Chem. 2020, 63, 4430–4444. [Google Scholar] [CrossRef]
- Andreini, C.; Banci, L.; Bertini, I.; Rosato, A. Zinc through the three domains of life. J. Proteome Res. 2006, 5, 31733178. [Google Scholar] [CrossRef]
- Perez, C.; Barkley-Levenson, A.M.; Dick, B.L.; Glatt, P.F.; Martinez, Y.; Siegel, D.; Momper, J.D.; Palmer, A.A.; Cohen, S.M. Metal-binding pharmacophore library yields the discovery of a glyoxalase 1 inhibitor. J. Med. Chem. 2019, 62, 1609–1625. [Google Scholar] [CrossRef]
- Perez, C.; Li, J.; Parlati, F.; Rouffet, M.; Ma, Y.; Mackinnon, A.L.; Chou, T.-F.; Deshaies, R.J.; Cohen, S.M. Discovery of an inhibitor of the proteasome subunit Rpn11. J. Med. Chem. 2017, 60, 1343–1361. [Google Scholar] [CrossRef]
- Jacobsen, J.; Fullagar, J.; Miller, M.; Cohen, S. Identifying chelators for metalloprotein inhibitors using a fragment-based approach. J. Med. Chem. 2011, 54, 591–602. [Google Scholar] [CrossRef] [PubMed]
- Supuran, C.T. Carbonic anhydrases: Novel therapeutic applications for inhibitors and activators. Nat. Rev. Drug Discov. 2008, 7, 168–181. [Google Scholar] [CrossRef]
- Lopez, M.; Salmon, A.J.; Supuran, C.T.; Poulsen, S.-A. Carbonic anhydrase inhibitors developed through ‘click tailing’. Curr. Pharm. Des. 2010, 16, 3277–3287. [Google Scholar] [CrossRef] [PubMed]
- Lopez, M.; Paul, B.; Hofmann, A.; Morizzi, J.; Wu, Q.K.; Charman, S.A.; Innocenti, A.; Vullo, D.; Supuran, C.T.; Poulsen, S.-A. S-Glycosyl primary sulfonamides—A new structural class for selective inhibition of cancer-associated Carbonic Anhydrases. J. Med. Chem. 2009, 52, 6421–6432. [Google Scholar] [CrossRef]
- Loughrey, B.T.; Healy, P.; Parsons, P.G.; Poulsen, S.-A.; Supuran, C.T.; Williams, M. Novel organometallic ruthenium (II) Cp* benzenesulphonamides for the inhibition of carbonic anhydrases. J. Biol. Inorg. Chem. 2009, 14, 935–945. [Google Scholar] [CrossRef]
- Moeker, J.; Peat, T.S.; Bornaghi, L.F.; Vullo, D.; Supuran, C.T.; Poulsen, S.-A. Cyclic secondary sulfonamides: Unusually good inhibitors of cancer-related carbonic anhydrase enzymes. J. Med. Chem. 2014, 57, 3522–3531. [Google Scholar] [CrossRef]
- Mujumdar, P.; Teruya, K.; Tonissen, K.F.; Vullo, D.; Supuran, C.T.; Peat, T.S.; Poulsen, S.-A. An unusual natural product primary sulfonamide: Synthesis, carbonic anhydrase inhibition, and protein X-ray structures of Psammaplin C. J. Med. Chem. 2016, 59, 5462–5470. [Google Scholar] [CrossRef]
- Singer, M.; Lopez, M.; Bornaghi, L.F.; Innocenti, A.; Vullo, D.; Supuran, C.T.; Poulsen, S.-A. Inhibition of carbonic anhydrase isozymes with benzene sulfonamides incorporating thio, sulfinyl and sulfonyl glycoside moieties. Bioorg. Med. Chem. Lett. 2009, 19, 2273–2276. [Google Scholar] [CrossRef]
- Woods, L.A.; Dolezal, O.; Ren, B.; Ryan, J.H.; Peat, T.S.; Poulsen, S.-A. Native state mass spectrometry, surface plasmon resonance, and X-ray crystallography correlate strongly as a fragment screening combination. J. Med. Chem. 2016, 59, 2192–2204. [Google Scholar] [CrossRef]
- Chrysanthopoulos, P.K.; Mujumdar, P.; Woods, L.A.; Dolezal, O.; Ren, B.; Peat, T.S.; Poulsen, S.-A. Identification of a new zinc binding chemotype by fragment screening. J. Med. Chem. 2017, 60, 7333–7349. [Google Scholar] [CrossRef]
- Gaspari, R.; Rechlin, C.; Heine, A.; Bottegoni, G.; Rocchia, W.; Schwarz, D.; Bomke, J.; Gerber, H.-D.; Klebe, G.; Cavalli, A. Kinetic and structural insights into the mechanism of binding of sulfonamides to human carbonic anhydrase by computational and experimental studies. J. Med. Chem. 2016, 59, 4245–4256. [Google Scholar] [CrossRef]
- Lebovitz, H.E. Thiazolidinediones: The forgotten diabetes medications. Curr. Diabetes Rep. 2019, 19, 151. [Google Scholar] [CrossRef] [PubMed]
- Fujita, T.; Sugiyama, Y.; Taketomi, S.; Sohda, T.; Kawamatsu, Y.; Iwatsuka, H.; Suzuoki, Z. Reduction of insulin resistance in obese and/or diabetic animals by 5-[4-(1-methylcyclohexylmethoxy) benzyl]-thiazolidine-2, 4-dione (ADD-3878, U-63,287, ciglitazone), a new antidiabetic agent. Diabetes 1983, 32, 804–810. [Google Scholar] [CrossRef] [PubMed]
- Lehmann, J.M.; Moore, L.B.; Smith-Oliver, T.A.; Wilkison, W.O.; Willson, T.M.; Kliewer, S.A. An antidiabetic thiazolidinedione Is a high affinity ligand for peroxisome proliferator-activated receptor γ (PPARγ). J. Biol. Chem. 1995, 270, 12953–12956. [Google Scholar] [CrossRef]
- Fajas, L.; Auboeuf, D.; Raspé, E.; Schoonjans, K.; Lefebvre, A.-M.; Saladin, R.; Najib, J.; Laville, M.; Fruchart, J.-C.; Deeb, S.; et al. The organization, promoter analysis, and expression of the human PPARγ gene. J. Biol. Chem. 1997, 272, 18779–18789. [Google Scholar] [CrossRef]
- Willson, T.M.; Brown, P.J.; Sternbach, D.D.; Henke, B.R. The PPARs: From orphan receptors to drug discovery. J. Med. Chem. 2000, 43, 527–550. [Google Scholar] [CrossRef] [PubMed]
- Ricote, M.; Li, A.C.; Willson, T.M.; Kelly, C.J.; Glass, C.K. The peroxisome proliferator-activated receptor-γ is a negative regulator of macrophage activation. Nature 1998, 391, 79–82. [Google Scholar] [CrossRef] [PubMed]
- Lehrke, M.; Lazar, M.A. The many faces of PPARγ. Cell 2005, 123, 993–999. [Google Scholar] [CrossRef] [PubMed]
- Thangavel, N.; Al Bratty, M.; Akhtar Javed, S.; Ahsan, W.; Alhazmi, H.A. Targeting peroxisome proliferator-activated receptors using thiazolidinediones: Strategy for design of novel antidiabetic drugs. Int. J. Med. Chem. 2017, 2017, 1069718. [Google Scholar] [CrossRef] [PubMed]
- Zhang, H.; Zhang, A.; Kohan, D.E.; Nelson, R.D.; Gonzalez, F.J.; Yang, T. Collecting duct-specific deletion of peroxisome proliferator-activated receptor γ blocks thiazolidinedione-induced fluid retention. PNAS 2005, 102, 9406. [Google Scholar] [CrossRef]
- Gale, E. The rise and fall of the Glitazones. In Unveiling Diabetes—Historical Milestones in Diabetology; Jörgens, V.P.M., Ed.; Karger: Basel, Switzerland, 2020; Volume 29, pp. 146–156. [Google Scholar]
- Graham, D.J.; Green, L.; Senior, J.R.; Nourjah, P. Troglitazone-induced liver failure: A case study. Am. J. Med. 2003, 114, 299–306. [Google Scholar] [CrossRef]
- Devchand, P.R.; Liu, T.; Altman, R.B.; FitzGerald, G.A.; Schadt, E.E. The Pioglitazone trek via human PPAR gamma: From discovery to a medicine at the FDA and beyond. Front. Pharmacol. 2018, 9, 1–9. [Google Scholar] [CrossRef] [PubMed]
- Vaccaro, O.; Lucisano, G.; Masulli, M.; Bonora, E.; Del Prato, S.; Rivellese, A.A.; Giorda, C.B.; Mocarelli, P.; Squatrito, S.; Maggioni, A.P.; et al. Cardiovascular effects of pioglitazone or sulfonylureas according to pretreatmentrisk: Moving toward personalized care. J. Clin. Endocrinol. Metab. 2019, 104, 3296–3302. [Google Scholar] [CrossRef] [PubMed]
- Day, C.; Bailey, C.J. Rosiglitazone. In Reference Module in Biomedical Sciences; Elsevier: Amsterdam, The Netherlands, 2016. [Google Scholar]
- Filipova, E.; Uzunova, K.; Kalinov, K.; Vekov, T. Pioglitazone and the risk of bladder cancer: A meta-analysis. Diabetes Ther. 2017, 8, 705–726. [Google Scholar] [CrossRef]
- Dormandy, J.B.M.; van Troostenburg de Bruyn, A.R. PROactive investigators. Safety and tolerability of pioglitazone in high-risk patients with type 2 diabetes: An overview of data from PROactive. Drug Saf. 2009, 32, 187–202. [Google Scholar] [CrossRef] [PubMed]
- Vitek, W.; Alur, S.; Hoeger, K. Off-label drug use in the treatment of polycystic ovary syndrome. Fertil. Steril. 2015, 103, 605–611. [Google Scholar] [CrossRef]
- Migliavacca, M.; Assanelli, A.; Ferrua, F.; Cicalese, M.P.; Biffi, A.; Frittoli, M.; Silvani, P.; Chidini, G.; Calderini, E.; Mandelli, A.; et al. Pioglitazone as a novel therapeutic approach in chronic granulomatous disease. J. Allergy Clin. Immunol. 2016, 137, 1913–1915.e1912. [Google Scholar] [CrossRef]
- Baell, J.B.; Holloway, G.A. New substructure filters for removal of Pan Assay Interference Compounds (PAINS) from screening libraries and for their exclusion in bioassays. J. Med. Chem. 2010, 53, 2719–2740. [Google Scholar] [CrossRef]
- Daina, A.; Michielin, O.; Zoete, V. SwissADME: A free web tool to evaluate pharmacokinetics, drug-likeness and medicinal chemistry friendliness of small molecules. Sci. Rep. 2017, 7, 1–13. [Google Scholar] [CrossRef]
- Farce, A.; Renault, N.; Chavatte, P. Structural insight into PPAR gamma ligands binding. Curr. Med. Chem. 2009, 16, 1768–1789. [Google Scholar] [CrossRef]
- Liberato, M.V.; Nascimento, A.S.; Ayers, S.D.; Lin, J.Z.; Cvoro, A.; Silveira, R.L.; Martínez, L.; Souza, P.C.; Saidemberg, D.; Deng, T.; et al. Medium chain fatty acids are selective peroxisome proliferator activated receptor (PPAR) γ activators and pan-PPAR partial agonists. PLoS ONE 2012, 7, 1–10. [Google Scholar] [CrossRef]
- Wykoff, C.C.; Beasley, N.J.; Watson, P.H.; Turner, K.J.; Pastorek, J.; Sibtain, A.; Wilson, G.D.; Turley, H.; Talks, K.L.; Maxwell, P.H.; et al. Hypoxia-inducible expression of tumor-associated carbonic anhydrases. Cancer Res. 2000, 60, 7075–7083. [Google Scholar] [PubMed]
- Chiche, J.; Brahimi-Horn, M.C.; Pouysségur, J. Tumour hypoxia induces a metabolic shift causing acidosis: A common feature in cancer. J. Cell. Mol. Med. 2010, 14, 771–794. [Google Scholar] [CrossRef]
- Kopecka, J.; Rankin, G.M.; Salaroglio, I.C.; Poulsen, S.-A.; Riganti, C. P-glycoprotein-mediated chemoresistance is reversed by carbonic anhydrase XII inhibitors. Oncotarget 2016, 7, 85861–85875. [Google Scholar] [CrossRef] [PubMed]
- Tonissen, K.F.; Poulsen, S.-A. Carbonic anhydrase XII inhibition overcomes P-glycoprotein-mediated drug resistance: A potential new combination therapy in cancer. Cancer Drug Resist. 2021, 4, 1–13. [Google Scholar] [CrossRef]
- Monti, S.M.; Supuran, C.T.; De Simone, G.; Di Fiore, A. Chapter 9—Carbonic anhydrase VII. In Carbonic Anhydrases as Biocatalysts; Supuran, C.T., De Simone, G., Eds.; Elsevier: Amsterdam, The Netherlands, 2015; pp. 151–168. [Google Scholar]
- Akdemir, A.; Güzel-Akdemir, Ö. Chapter 7—The structure, physiological role, and potential medicinal applications of carbonic anhydrase V. In Carbonic Anhydrases as Biocatalysts; Supuran, C.T., De Simone, G., Eds.; Elsevier: Amsterdam, The Netherlands, 2015; pp. 125–138. [Google Scholar]
- Mishra, C.B.; Tiwari, M.; Supuran, C.T. Progress in the development of human carbonic anhydrase inhibitors and their pharmacological applications: Where are we today? Med. Res. Rev. 2020, 40, 2485–2565. [Google Scholar] [CrossRef]
- Yu, C.; Chen, L.; Luo, H.; Chen, J.; Cheng, F.; Gui, C.; Zhang, R.; Shen, J.; Chen, K.; Jiang, H.; et al. Binding analyses between human PPARγ–LBD and ligands. Eur. J. Biochem. 2004, 271, 386–397. [Google Scholar] [CrossRef]
- Yasmin, S.; Capone, F.; Laghezza, A.; Piaz, F.D.; Loiodice, F.; Vijayan, V.; Devadasan, V.; Mondal, S.K.; Atlı, Ö.; Baysal, M.; et al. Novel benzylidene thiazolidinedione derivatives as partial PPARγ agonists and their antidiabetic effects on type 2 diabetes. Sci. Rep. 2017, 7, 1–17. [Google Scholar] [CrossRef]
- Cowieson, N.P.; Aragao, D.; Clift, M.; Ericsson, D.J.; Gee, C.; Harrop, S.J.; Mudie, N.; Panjikar, S.; Price, J.R.; Riboldi-Tunnicliffe, A.; et al. MX1: A bending-magnet crystallography beamline serving both chemical and macromolecular crystallography communities at the Australian Synchrotron. J. Synchrotron Radiat. 2015, 22, 187–190. [Google Scholar] [CrossRef]
- Kabsch, W. XDS. Acta Crystallogr. Sect. D Biol. Crystallogr. 2010, 66, 125–132. [Google Scholar] [CrossRef]
- Evans, P.R.; Garib, N.M. How good are my data and what is the resolution? Acta Crystallogr. Sect. D Biol. Crystallogr. 2013, 69, 1204–1214. [Google Scholar] [CrossRef]
- McCoy, A.; Grosse-Kunstleve, R.; Adams, P.; Winn, M.; Storoni, L.; Read, R. Phaser crystallographic software. J. Appl. Crystallogr. 2007, 40, 658–674. [Google Scholar] [CrossRef]
- Emsley, P.; Cowtan, K. Coot: Model-building tools for molecular graphics. Acta Crystallogr. Sect. D Biol. Crystallogr. 2004, 60, 2126–2132. [Google Scholar] [CrossRef] [PubMed]
- Vagin, A.A.; Steiner, R.A.; Lebedev, A.A.; Potterton, L.; McNicholas, S.; Long, F.; Murshudov, G.N. REFMAC5 dictionary: Organization of prior chemical knowledge and guidelines for its use. Acta Crystallogr. Sect. D 2004, 60, 2184–2195. [Google Scholar] [CrossRef] [PubMed]
- Moriarty, N.W.; Grosse-Kunstleve, R.W.; Adams, P.D. electronic Ligand Builder and Optimization Workbench (eLBOW): A tool for ligand coordinate and restraint generation. Acta Crystallogr. Sect. D 2009, 65, 1074–1080. [Google Scholar] [CrossRef] [PubMed]
- Venkatachalam, C.M.; Jiang, X.; Oldfield, T.; Waldman, M. LigandFit: A novel method for the shape-directed rapid docking of ligands to protein active sites. J. Mol. Graph. Model. 2003, 21, 289–307. [Google Scholar] [CrossRef]
- Zhang, N.; Yu, X.; Zhang, X.; D’Arcy, S. HD-eXplosion: Visualization of hydrogen–deuterium exchange data as chiclet and volcano plots with statistical filtering. Bioinformatics 2020, btaa892. [Google Scholar] [CrossRef]
- Khalifah, R. The carbon dioxide hydration activity of carbonic anhydrase I. Stop-flow kinetic studies on the native human isoenzymes B and C. J. Biol. Chem. 1971, 246, 2561–2573. [Google Scholar] [CrossRef]
- Nocentini, A.; Angeli, A.; Carta, F.; Winum, J.; Zalubovskis, R.; Carradori, S.; Capasso, C.; Donald, W.; Supuran, C. Reconsidering anion inhibitors in the general context of drug design studies of modulators of activity of the classical enzyme carbonic anhydrase. J. Enzym. Inhib. Med. Chem. 2021, 36, 561–580. [Google Scholar] [CrossRef]
- Bouzina, A.; Berredjem, M.; Nocentini, A.; Bua, S.; Bouaziz, Z.; Jose, J.; Le Borgne, M.; Marminon, C.; Gratteri, P.; Supuran, C. Ninhydrins inhibit carbonic anhydrases directly binding to the metal ion. Eur. J. Med. Chem. 2021, 209, 112875. [Google Scholar] [CrossRef]
- Supuran, C.T. Exploring the multiple binding modes of inhibitors to carbonic anhydrases for novel drug discovery. Expert Opin. Drug Discov. 2020, 15, 671–686. [Google Scholar] [CrossRef]
- Bonardi, A.; Nocentini, A.; Bua, S.; Combs, J.; Lomelino, C.; Andring, J.; Lucarini, L.; Sgambellone, S.; Masini, E.; McKenna, R.; et al. Sulfonamide inhibitors of human carbonic anhydrases designed through a three-tails approach: Improving ligand/isoform matching and selectivity of action. J. Med. Chem. 2020, 63, 7422–7444. [Google Scholar] [CrossRef] [PubMed]


| Compound | SPR KD (μM) | PDB ID | Protein-Fragment Interaction Distances (Å) | ||
|---|---|---|---|---|---|
| Zn-NH | T199OH-NH | T199NH-O1/S1 | |||
| 8 | 3.5 | 5TXY and 5TY8 | 1.9 | 3.2 | 3.0 |
| 9 [20] | 1.2 | 4YX4 | 1.9 | 2.9 | 3.0 |
| 10 | 32.9 | 5TYA | 2.0 | 3.1 | 3.7 |
| Compound | Ki(μM) a | ||||||||||
|---|---|---|---|---|---|---|---|---|---|---|---|
| hCA | |||||||||||
| I | II | IV | VA | VB | VI | VII | IX | XII | XIII | XIV | |
| 11 | 57.2 | 1.3 | >100 | 12.4 | 28.9 | 46.7 | 2.5 | 1.3 | 0.92 | 32.3 | 16.8 |
| 12 | 16.3 | 0.75 | 58.9 | 8.2 | 40.9 | 5.9 | 6.1 | 2.5 | 3.7 | 7.4 | 2.3 |
| 13 | 39.6 | 7.1 | 92.1 | 5.3 | 36.2 | 19.8 | 4.9 | 0.75 | 0.85 | 21.5 | 6.6 |
| acetazolamide | 0.25 | 0.012 | 0.074 | 0.063 | 0.054 | 0.011 | 0.003 | 0.025 | 0.006 | 0.017 | 0.041 |
Publisher’s Note: MDPI stays neutral with regard to jurisdictional claims in published maps and institutional affiliations. |
© 2021 by the authors. Licensee MDPI, Basel, Switzerland. This article is an open access article distributed under the terms and conditions of the Creative Commons Attribution (CC BY) license (https://creativecommons.org/licenses/by/4.0/).
Share and Cite
Mueller, S.L.; Chrysanthopoulos, P.K.; Halili, M.A.; Hepburn, C.; Nebl, T.; Supuran, C.T.; Nocentini, A.; Peat, T.S.; Poulsen, S.-A. The Glitazone Class of Drugs as Carbonic Anhydrase Inhibitors—A Spin-Off Discovery from Fragment Screening. Molecules 2021, 26, 3010. https://doi.org/10.3390/molecules26103010
Mueller SL, Chrysanthopoulos PK, Halili MA, Hepburn C, Nebl T, Supuran CT, Nocentini A, Peat TS, Poulsen S-A. The Glitazone Class of Drugs as Carbonic Anhydrase Inhibitors—A Spin-Off Discovery from Fragment Screening. Molecules. 2021; 26(10):3010. https://doi.org/10.3390/molecules26103010
Chicago/Turabian StyleMueller, Sarah L., Panagiotis K. Chrysanthopoulos, Maria A. Halili, Caryn Hepburn, Tom Nebl, Claudiu T. Supuran, Alessio Nocentini, Thomas S. Peat, and Sally-Ann Poulsen. 2021. "The Glitazone Class of Drugs as Carbonic Anhydrase Inhibitors—A Spin-Off Discovery from Fragment Screening" Molecules 26, no. 10: 3010. https://doi.org/10.3390/molecules26103010
APA StyleMueller, S. L., Chrysanthopoulos, P. K., Halili, M. A., Hepburn, C., Nebl, T., Supuran, C. T., Nocentini, A., Peat, T. S., & Poulsen, S.-A. (2021). The Glitazone Class of Drugs as Carbonic Anhydrase Inhibitors—A Spin-Off Discovery from Fragment Screening. Molecules, 26(10), 3010. https://doi.org/10.3390/molecules26103010