Article

Reflection Absorption Infrared Spectroscopy Characterization of SAM Formation from 8-Mercapto-N-(phenethyl)octanamide Thiols with Phe Ring and Amide Groups

Department of Organic Chemistry, Center for Physical Sciences and Technology (FTMC), Saulėtekis Ave. 3, LT-10257 Vilnius, Lithuania
*
Author to whom correspondence should be addressed.
Molecules 2020, 25(23), 5633; https://doi.org/10.3390/molecules25235633
Submission received: 3 November 2020 / Revised: 20 November 2020 / Accepted: 27 November 2020 / Published: 30 November 2020
(This article belongs to the Special Issue Interfacial Chemistry)

Abstract

:
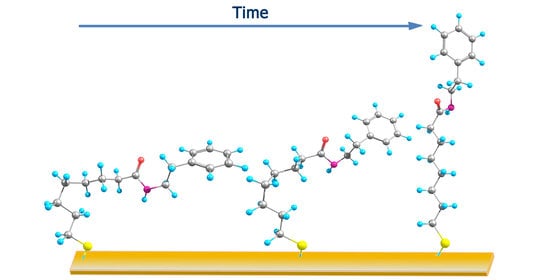
Multifunctional amide-containing self-assembled monolayers (SAMs) provide prospects for the construction of interfaces with required physicochemical properties and distinctive stability. In this study, we report the synthesis of amide-containing thiols with terminal phenylalanine (Phe) ring functionality (HS(CH2)7CONH(CH2)2C6H5) and the characterization of the formation of SAMs from these thiols on gold by reflection absorption infrared spectroscopy (RAIRS). For reliable assignments of vibrational bands, ring deuterated analogs were synthesized and studied as well. Adsorption time induced changes in Amide-II band frequency and relative intensity of Amide-II/Amide-I bands revealed two-state sigmoidal form dependence with a transition inflection points at 2.2 ± 0.5 and 4.7 ± 0.5 min, respectively. The transition from initial (disordered) to final (hydrogen-bonded, ordered) structure resulted in increased Amide-II frequency from 1548 to 1557 cm−1, which is diagnostic for a strongly hydrogen-bonded amide network in trans conformation. However, the lateral interactions between the alkyl chains were found to be somewhat reduced when compared with well-ordered alkane thiol monolayers.

Graphical Abstract

1. Introduction

Self-assembled monolayers (SAMs) of functional thiol molecules at the gold metal surface modify interfacial physicochemical properties and provide a valuable platform for the investigation of specific interactions of the terminal functional group with solution components, provide the possibility to probe the mechanism of electron transfer reactions, and serve for the construction of (bio)sensors and the development of biotechnological processes [1,2,3,4]. The terminal group of monolayers affords the opportunity to construct an interface with specifically designed physical and chemical properties. The monolayer containing the terminal phenylalanine (Phe) ring group provides the possibility to probe the subtle interactions of the ring with solution components and adjacent adsorbed molecules in the monolayer. The Phe ring plays an important role in stabilizing the tertiary structure of proteins, binding, and the catalytic function [5]. Being fully aromatic, Phe residue participates in a variety of noncovalent interactions involving the delocalized π-electron system, such as π-π stacking, CH-π, and cation-π [6,7,8,9]. These interactions are weak and difficult to study. Self-assembled monolayers on the gold surface with the terminal Phe ring group may provide a promising platform to gain insights into the various interactions of aromatic moiety that are important for the biological function of proteins and peptides.
The functional properties of the terminal molecular group depend on the structure and stability of the monolayer. The architecture and stability of SAM depends on several important interactions, the main ones being (i) metal-sulfur covalent bonding, (ii) interactions between the adjacent hydrocarbon chains, and (iii) interactions between the terminal functional groups in the monolayer and with solution components. The stability of the monolayer increases considerably by the introduction of the amide functional group in the hydrocarbon chain of thiol molecules because of the formation of lateral hydrogen bonds between the adjacent chains in the monolayer [10,11,12,13,14,15,16]. Indeed, temperature-programmed desorption studies have revealed that the amide group containing SAM displayed a delay of the alkyl chain disordering by 50 K, as compared to the linear chain thiols with OH-terminal group. In addition, the onset of sulfur desorption has been found to occur at 25 K higher temperatures [15]. It was demonstrated that the presence of the hydrogen bonding network increases the ordering of alkanethiols and the blocking properties of the monolayer for electrochemical reactions [13].
Several analytical techniques have been used extensively to characterize self-assembled monolayers, such as high-resolution electron energy loss spectroscopy (HREELS), X-ray photoelectron spectroscopy (XPS), reflection absorption infrared spectroscopy (RAIRS), sum-frequency generation (SFG) spectroscopy, surface-enhanced Raman spectroscopy (SERS), atomic force microscopy (AFM), scanning tunneling microscopy (STM), and cyclic voltammetry [1,2,17]. Among these techniques, the RAIRS approach is particularly useful for acquiring vibrational information from monolayers on smooth gold substrates because of the submonolayer sensitivity and ability to attain molecular level information on the hydrogen bonding interaction and ordering of molecules in the film [18,19,20,21,22,23]. In fact, monitoring the stretching frequency of methylene bands is one of the most sensitive methods for the analysis of the conformational order of alkyl chains [24,25]. An important advantage of the RAIRS tool for analysis of monolayers on a metallic surface is the operation of specific surface selection rules, stating that only the vibrations with a transition dipole moment component aligned perpendicularly to the surface are active for adsorbed molecules [26]. Therefore, the method affords important information about the orientation of molecules and molecular groups with respect to the surface and bonding geometry [27,28,29].
The present work aims at the reflection absorption infrared spectroscopy characterization of monolayers formed from newly synthesized multifunctional thiol molecules with the Phe ring terminal group and intrachain amide moiety (Figure 1).

2. Results and Discussion

2.1. Assignments of MOPHE Infrared Absorption bands

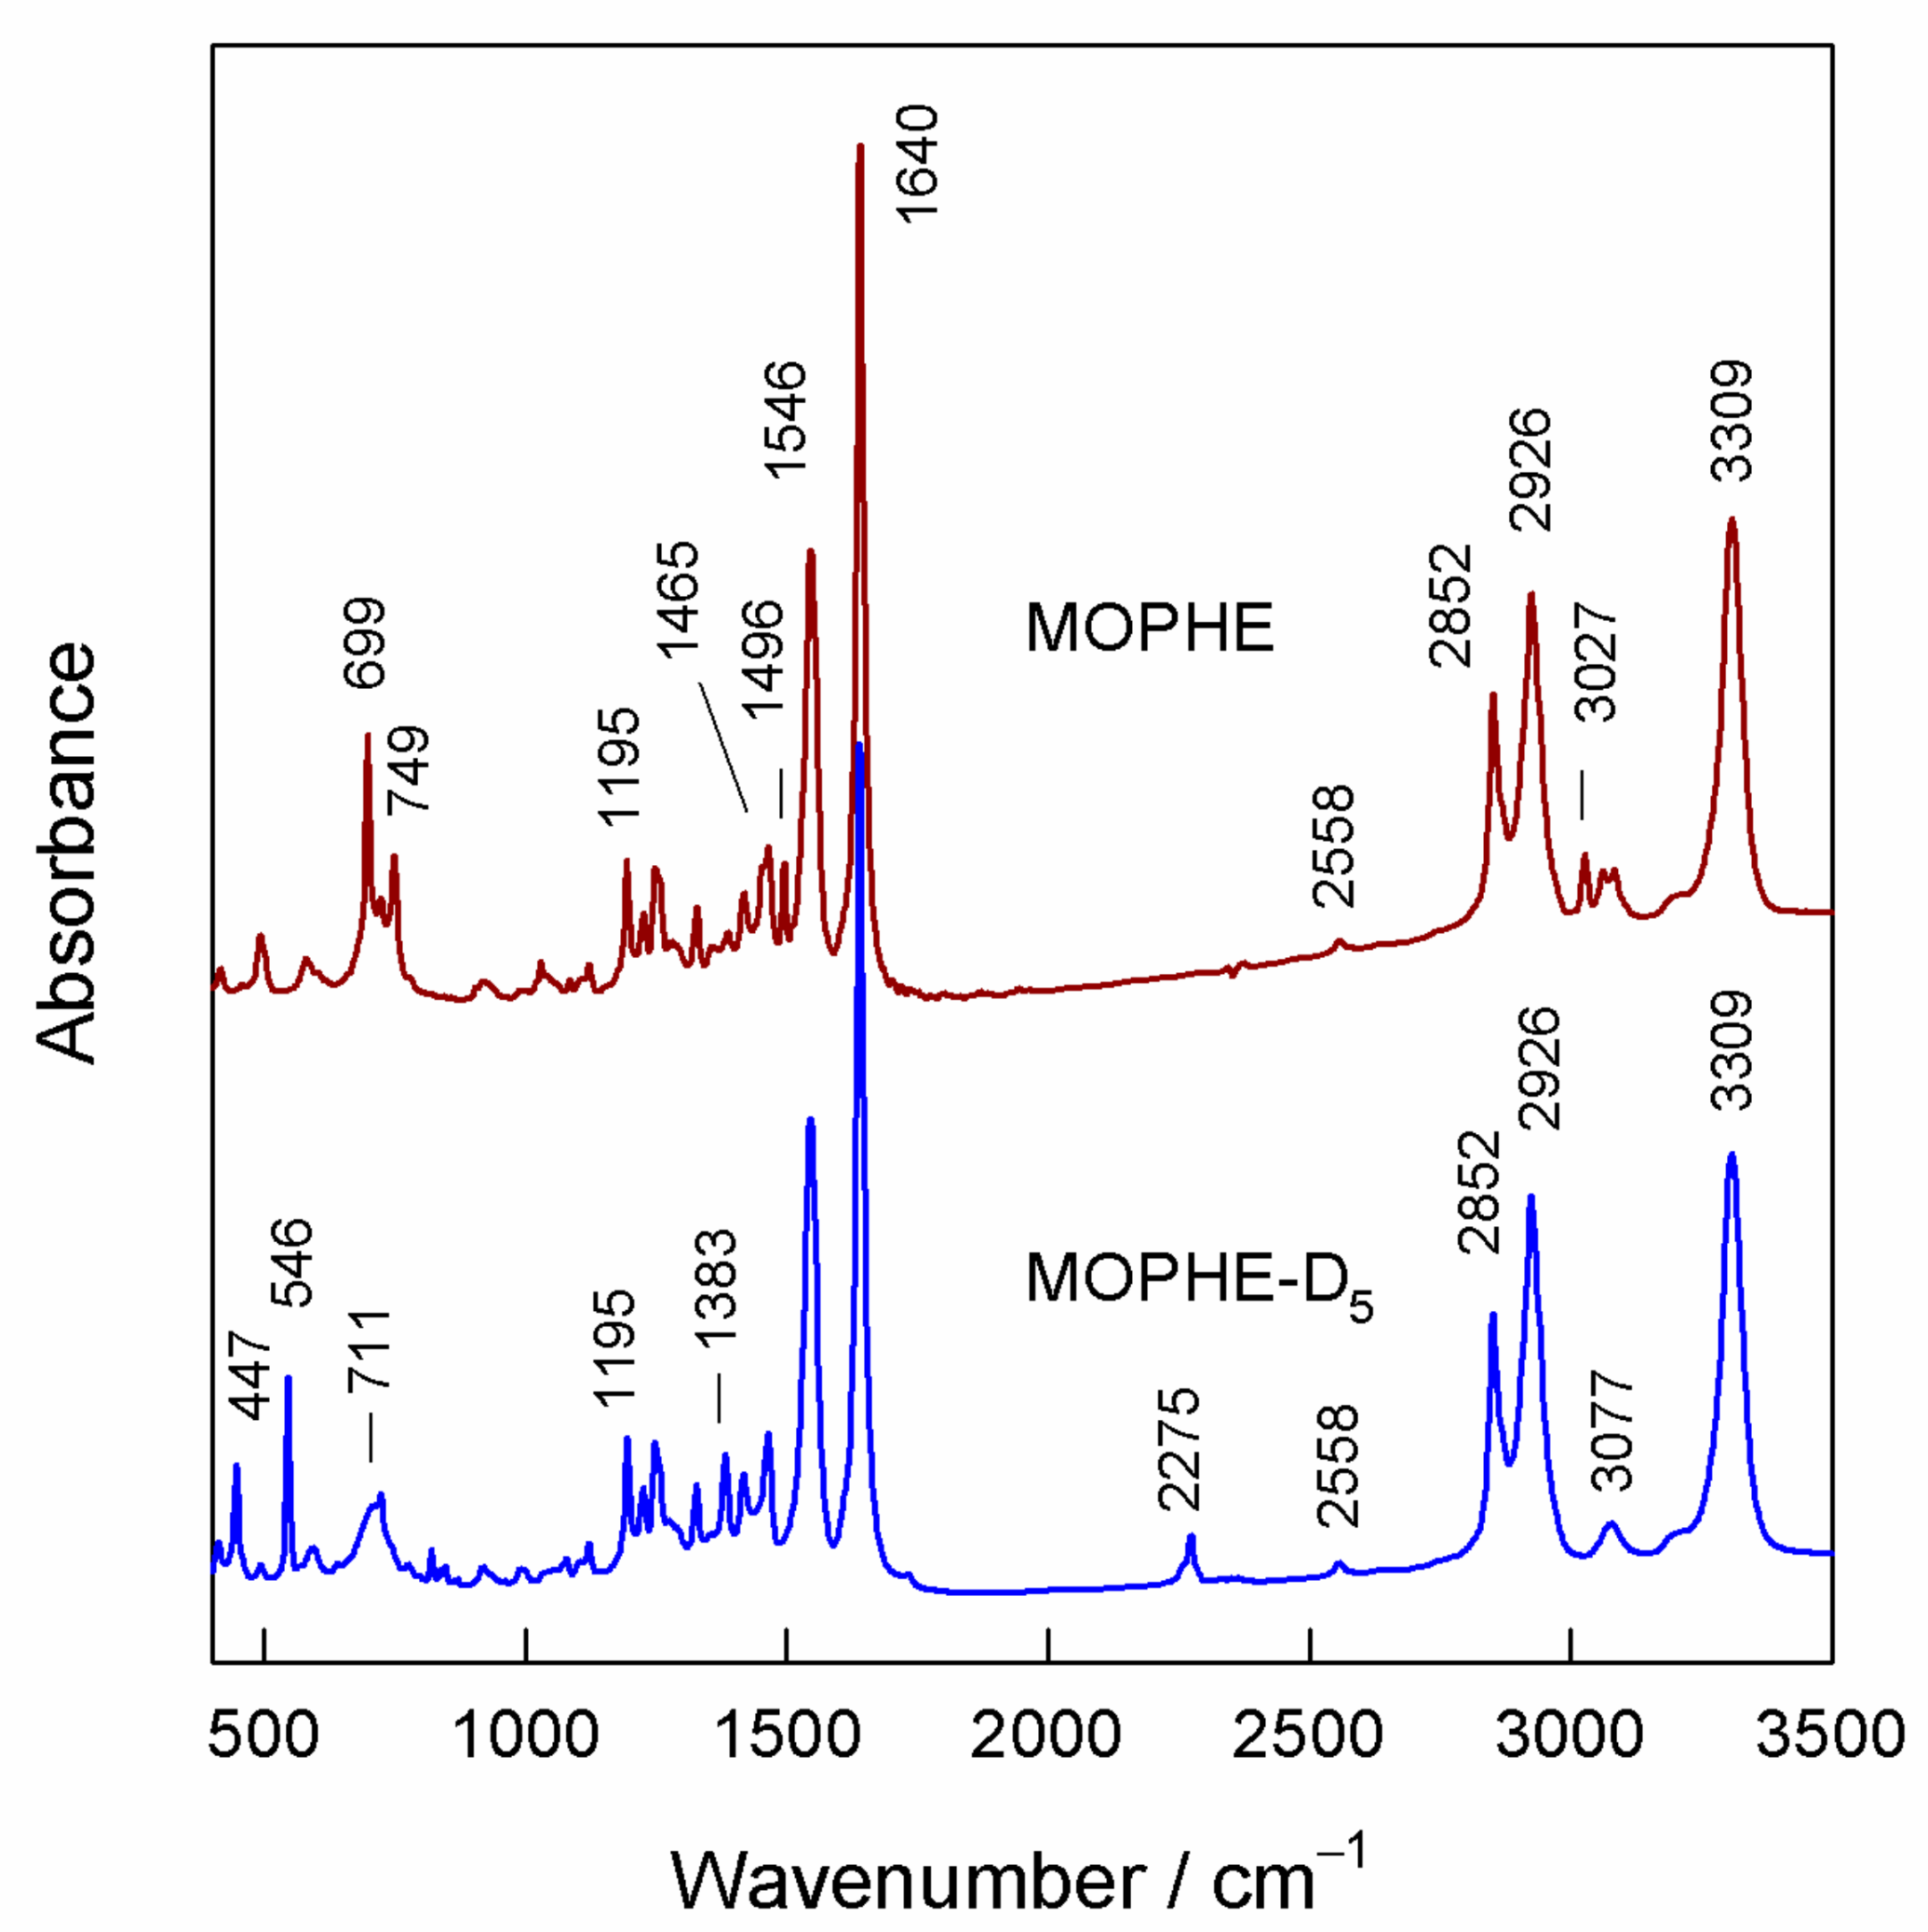
The MOPHE molecule consists of four molecular units: (i) the thiol group (SH), (ii) the polyethylene chain (−(CH2)7−), (iii) the amide group (−CO−NH−), and (iv) the terminal Phe ring (Figure 1). Each molecular group can be characterized by infrared spectroscopy. To increase reliability and facilitate the assignments of infrared absorption bands, we have synthesized the studied thiol molecule with deuterated terminal Phe ring, MOPHE-D5. Thus, ring-related vibrational modes can be easily identified by an observed frequency shift. To clarify the assignments of infrared bands, we have conducted the first-principles quantum chemical calculations of MOPHE and MOPHE-D5 compounds. Figure 2 compares infrared absorption spectra of bulk MOPHE and MOPHE-D5 compounds dispersed in the KBr tablet. Assignments of the main infrared bands based on our calculations and previous publications [30,31,32,33,34,35,36,37,38,39] are given in Table 1.
The most intense bands are associated with the vibrations of the amide group. The highest frequency intense band near 3309 cm−1 belongs to stretching vibration ν(N−H) (Amide-A mode, Am-A). The frequency of this mode decreases with the increasing hydrogen bonding interaction strength with the hydrogen atom of amide group. The most intense band located at 1640 cm−1 is primarily associated to C=O stretching vibration (83%) coupled with out-of-phase C−N stretching and the C–C−N deformation motion of the amide group (Amide-I mode, Am-I) [31,32,33,34]. The well-defined band at 1546 cm−1 is associated with the coupled out-of-phase C−N stretching and in-plane N−H bending vibrations (Amide-II mode, Am-II) [34]. The Amide-III (Am-III) vibrational mode is visible as the middle intensity band near 1249 cm−1. This mode originates primarily from the in-phase C−N stretching vibration coupled with the N−H in-plane bending. Finally, the low frequency Amide-V vibrational mode (Am-V) associated with the N−H out-of-plane bending vibration is visible near 711 cm−1. Because of the high number of methylene groups, several modes associated with the alkyl chain vibrations are clearly visible in the infrared spectra. Thus, intense bands at 2852 and 2926 cm−1 are associated with symmetric stretching and asymmetric stretching vibrations of the CH2 groups, respectively (Figure 2, Table 1). The deformation (scissoring) vibration of the CH2 groups is clearly visible as a middle intensity band near 1465 cm−1. Other relatively low intensity deformation vibrations of methylene groups are listed in Table 1. The thiol group can be recognized in the infrared spectra from the low intensity S−H stretching band near 2558 cm−1. For thiol compounds dissolved in water, this band usually appears at 2582 cm−1 [4]; a shift to lower wavenumbers indicates a strong hydrogen bonding interaction of the thiol groups in the solid state. Because of the relatively low intensity, the Phe ring vibrational modes can only be recognized in the infrared spectra by ring-deuteration-induced frequency shifts. Thus, aromatic ring stretching vibration ν(=C–H) shifts from 3027 to 2275 cm−1 upon Phe ring-deuteration. The characteristic substituted benzene ring C=C stretching mode coupled with in-plane C–H deformation, named F19 (according to Wilson notation for Phe ring) appears at 1496 and 1383 cm−1 in the spectra of the MOPHE and MOPHE-D5 compounds, respectively. The middle intensity out-of-plane C–H deformation vibrational modes F11 and F4 of the MOPHE ring are visible at 749 and 699 cm−1, respectively.

2.2. Reflection Absorption Infrared Spectroscopy (RAIRS) Analysis of Monolayer Formation

Figure 3 shows the immersion-time in adsorption solution-dependent RAIRS spectra of the adsorbed MOPHE compound on the gold surface. After 5 s incubation in the adsorption solution, the RAIRS spectrum reveals two broad and similar intensity bands at 1652 and 1548 cm−1 which are associated with the Am-I and Am-II vibrational modes of the amide group, respectively (Figure 3a). The presence of the Phe ring at the interface can be recognized from the narrow and low intensity F19 mode at 1499 cm−1. The band near 1456 cm−1 belongs to the scissoring deformation vibration of CH2 groups in the hydrocarbon chain. The frequency of the Am-I mode is a sensitive indicator of the hydrogen bonding interaction (C=O∙∙∙H) strength involving the amide group and dipole–dipole interaction between the C=O groups [32,33,38]. Higher Am-I frequency corresponds to weakened hydrogen bonding interaction [38]. A relatively low Am-I wavenumber value for the MOPHE compound in the solid state (1640 cm−1) resembles the strongly hydrogen-bonded network of molecules. However, at the initial monolayer formation stage, the peak position of this band is upshifted (1652 cm−1), indicating a weakened hydrogen bonding interaction strength through the C=O group of the amide moiety. It has been demonstrated previously that, contrary to Am-I, the frequency of the Am-II mode probes the hydrogen bonding interaction strength primarily at the N−H site of the amide group [40]. The formation of stronger hydrogen bonds at this site results in higher Am-II frequencies. At the initial adsorption state (Figure 3a), the wavenumber value of Am-II band (1548 cm−1) is very similar with the one observed for MOPHE in the solid state (1546 cm−1); thus at this condition, the N−H site is involved in a strong interaction. Such an interaction may not be related solely with the hydrogen bonding interaction, but in addition, may include contact with the metal or even bonding with the gold surface through the amide moiety [41,42].
The increase of the incubation time in the adsorption solution to 30 s results in the intensity increase of all the vibrational bands (Figure 3b). In addition, the broad band near 1247 cm−1 becomes clearly visible. This band is associated with the Am-III vibrational mode of the amide group [43,44]. The frequency of this band is sensitive to the hydrogen bonding interaction at both the C=O and N−H sites of amide group. While the intensity of this band usually is lower by 5–10 times compared with the Am-I mode in the infrared spectra of the polypeptides and proteins, this mode provides useful information on the secondary structure of biomolecules because of the absence of interference with the water contribution and better resolved positions of secondary structure elements [33,45]. It should be noted that in the RAIRS spectrum of MOPHE obtained after 30 s incubation time, the Am-I band splits into the two components positioned at 1641 and 1659 cm−1, indicating the presence of two differently hydrogen-bonded populations of adsorbed molecules on the gold surface. The lower frequency component resembles strongly hydrogen-bonded amide groups through the C=O moiety. The further increase of the incubation time of gold substrate in the adsorption solution results in considerable changes in relative intensities and other parameters of the Am-I and Am-II bands.
A more detailed analysis of the incubation time-induced changes in the parameters of amide bands is displayed in Figure 4. One can see that both the peak position of the Am-II band and ratio of integrated intensities AAm-II/AAm-I dependencies on the incubation time in the adsorption solution exhibit a similar sigmoidal form. Thus, experimental data were fitted with the equation representing a two-state mechanism for the changes in the frequency and relative intensity of Am-II band with four parameters [38]:
P = P 0 + α ( 1 + e x p ( t t m b ) )
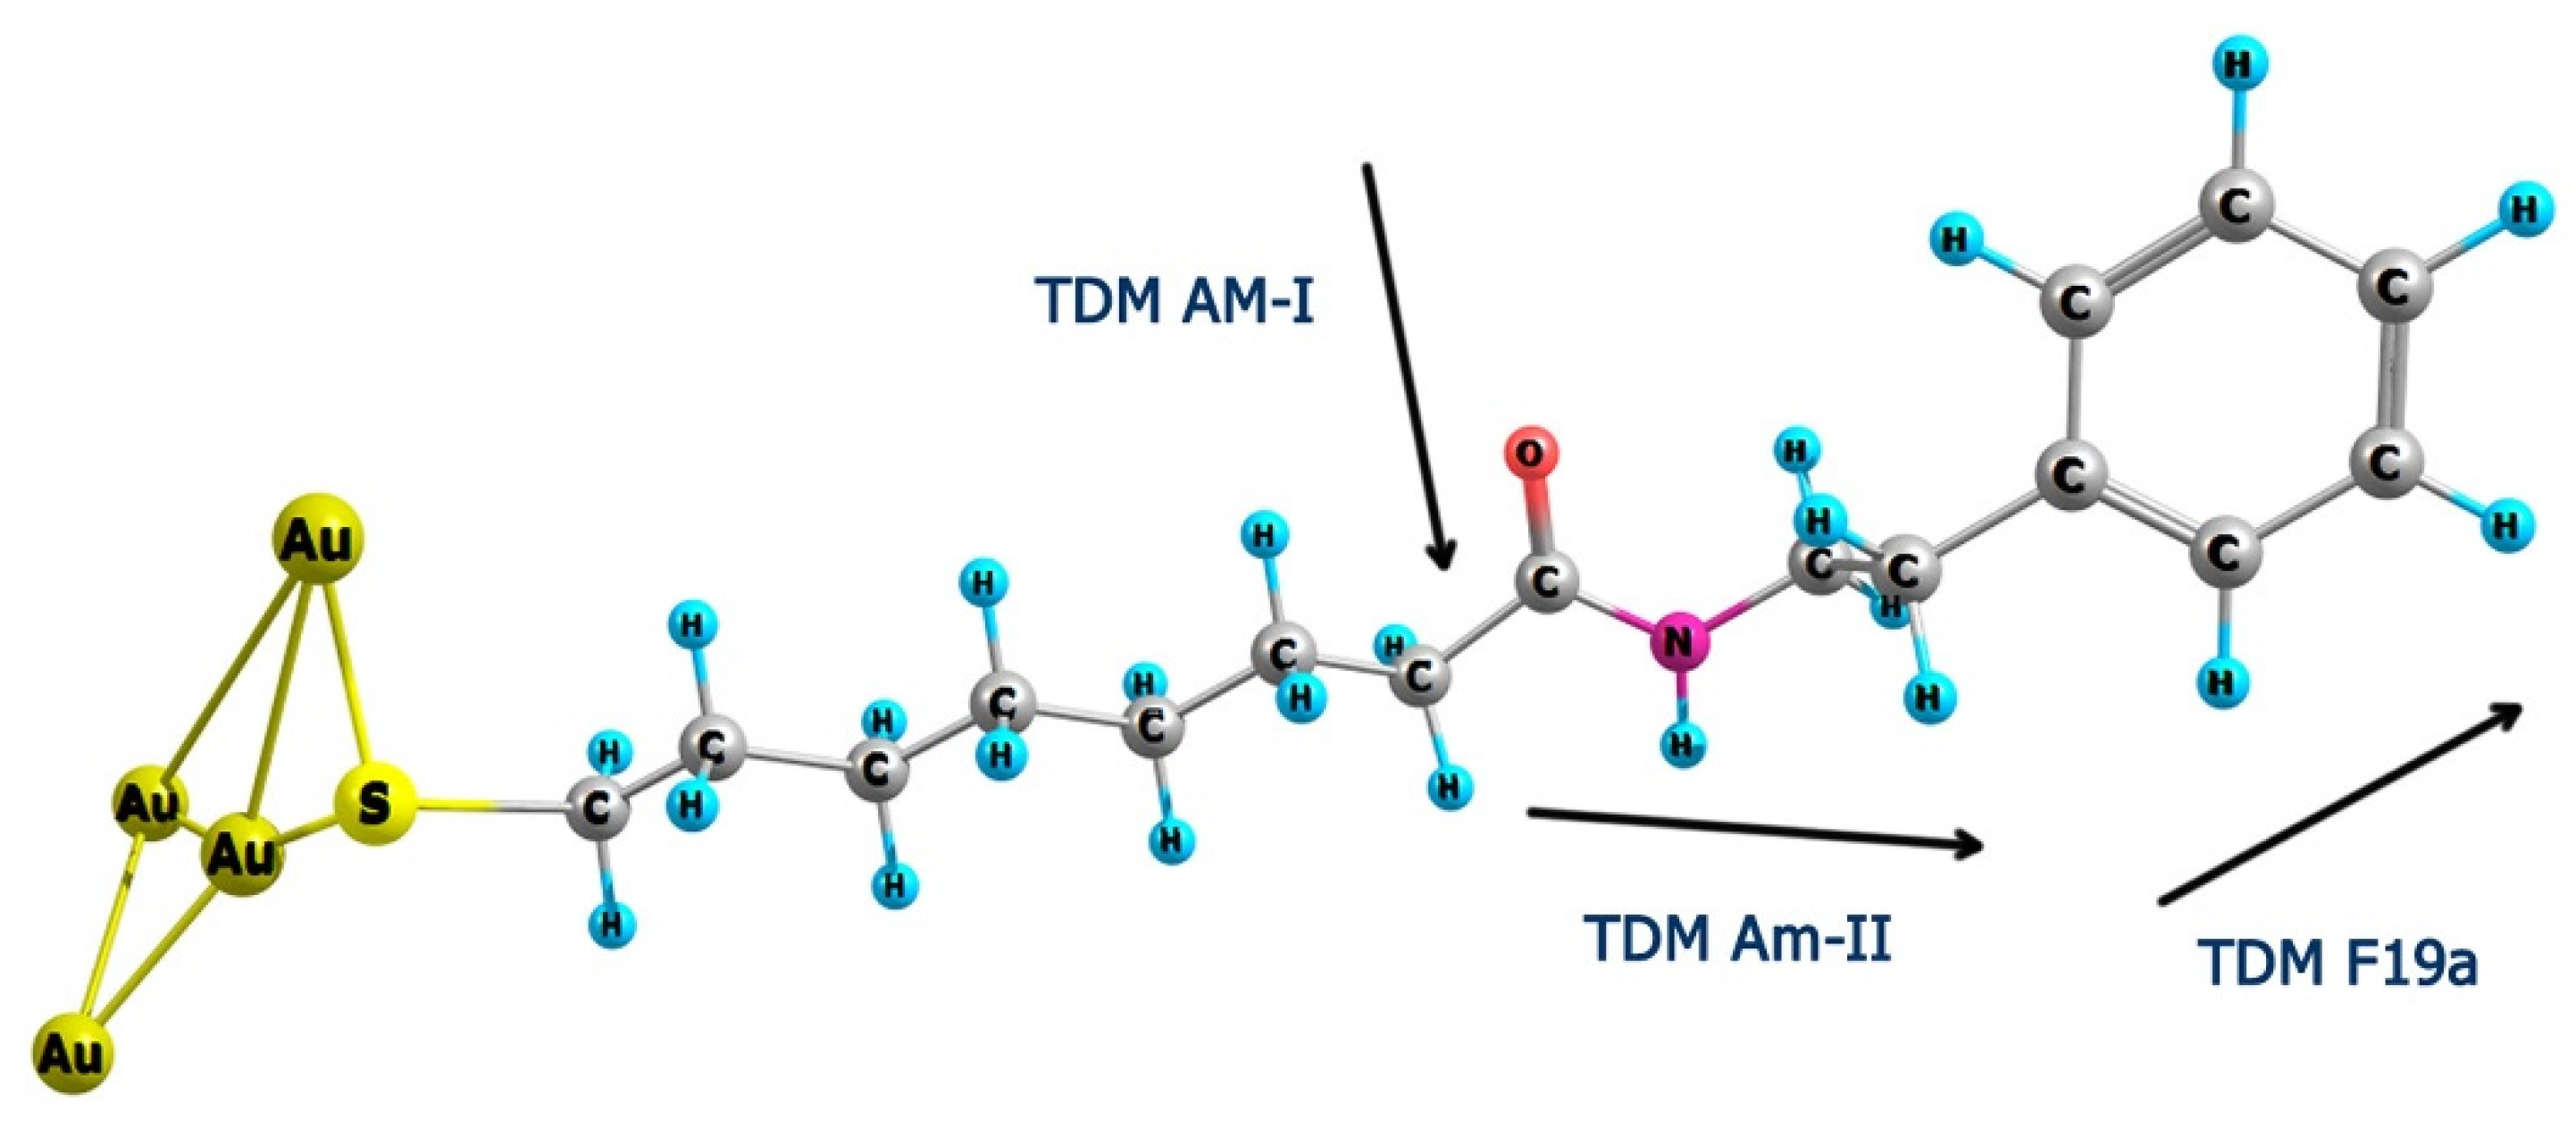
where tm is the observed transition inflection point. The best fit to Equation (1) was found to be with tm = 2.2 ± 0.5 min and tm = 4.7 ± 0.5 min for the Am-II frequency and relative intensity AAm-II/AAm-I dependencies on incubation time in adsorption solution, respectively. Presented spectroscopic data show that the Am-II frequency increases with the development of SAM at the gold surface. A higher frequency indicates a stronger hydrogen bonding interaction strength at the N−H site of the amide group [40]. Clegg et al. [13] have proposed that the upshift in frequency of the Am-II mode specifies the increasing restriction forced on the N−H bending vibration within the SAM, consisting of the presence of the strong hydrogen bonding network. The high peak frequency of the Am-II band observed after long adsorption time (1557 cm−1) (Figure 4A) is consistent with the presence of strongly hydrogen-bonded amide groups in trans configuration [44,46]. Thus, two states of the amide group N−H site can be represented as the initial relatively weak and final relatively strong hydrogen bonding interactions. The intensities of the Am-I and Am-II modes in the RAIRS method depend on the orientation of the amide group with respect to the surface plane. In general, the relative intensity of the band in the RAIRS spectrum is proportional to the transition dipole moment (TDM) component perpendicular to the surface plane [21,22]. The transition dipole moment component for the Am-I mode lies perpendicularly to the long molecular axis; in contrast, parallel orientation is characteristic for the Am-II mode [31,43]. DFT calculations of the model complex compound Au4−MOPHE show the TDM of the Am-I mode aligned nearly perpendicularly to the main molecular axis of –(CH2)7− hydrocarbon chain, while the TDM of the Am-II mode was found to be ranged in near parallel with this axis configuration (Figure 5). Therefore, the variation in orientation of the molecular axis of the adsorbed thiol molecules containing the amide group from near parallel with respect to the surface plane to a near perpendicular alignment results in the increase of Am-II and the decrease of Am-I band intensities [47]. Relative intensity changes depicted in Figure 4B evidence a sharp transition in the orientation of adsorbed molecules from the predominant near parallel orientation of the molecular axis at short incubation times to a near perpendicular configuration after a longer adsorption period. The reorientation transition inflection time was found to be 4.7 ± 0.5 min. One can see that the intensity of the Am-I band is very low for the RAIRS spectra recorded at long adsorption time (Figure 3). In accordance with the surface selection rules for RAIRS spectroscopy, this observation confirms a near parallel with surface plane orientation of the C=O group and a close to surface normal orientation of the long molecular axis of the studied thiol compound (Figure 5) [21,22,43].
In addition, we observed adsorption time-induced changes in the width of the bands determined as full width at half maximum (FWHM). Thus, the FWHM value of the Am-II band decreases considerably from 37.5 cm−1 to 28.8 cm−1 as the adsorption time increases from 5 s to 1 h, respectively. The narrowing of the band suggests a homogeneous and well-packed structure without a high number of gauche defects in the main molecular chain. The Am-II band shape is symmetric (Figure 3); and there is no lower frequency band near 1510 cm−1, due to the unbounded or weakly-bonded amide groups being visible [10,46].
Insights into the alignment of the terminal Phe ring may be gained from the analysis of the prominent band at 1499 cm−1 (F19a). Figure 3 shows that the relative intensity of this band clearly increases with increasing the incubation time. The TDM of this mode is aligned primarily along with the C–C6H5 bond (Figure 5). In the spectrum of the bulk MOPHE compound intensity of F19a mode is considerably lower compared to the Am-I mode (Figure 2). However, the surface spectrum intensity of this mode is substantially higher compared to Am-I (Figure 3). Thus, changes in the relative intensity of F19a band during the self-assembly imply a near perpendicular with surface orientation of C–C6H5 bond at the final monolayer formation stage.
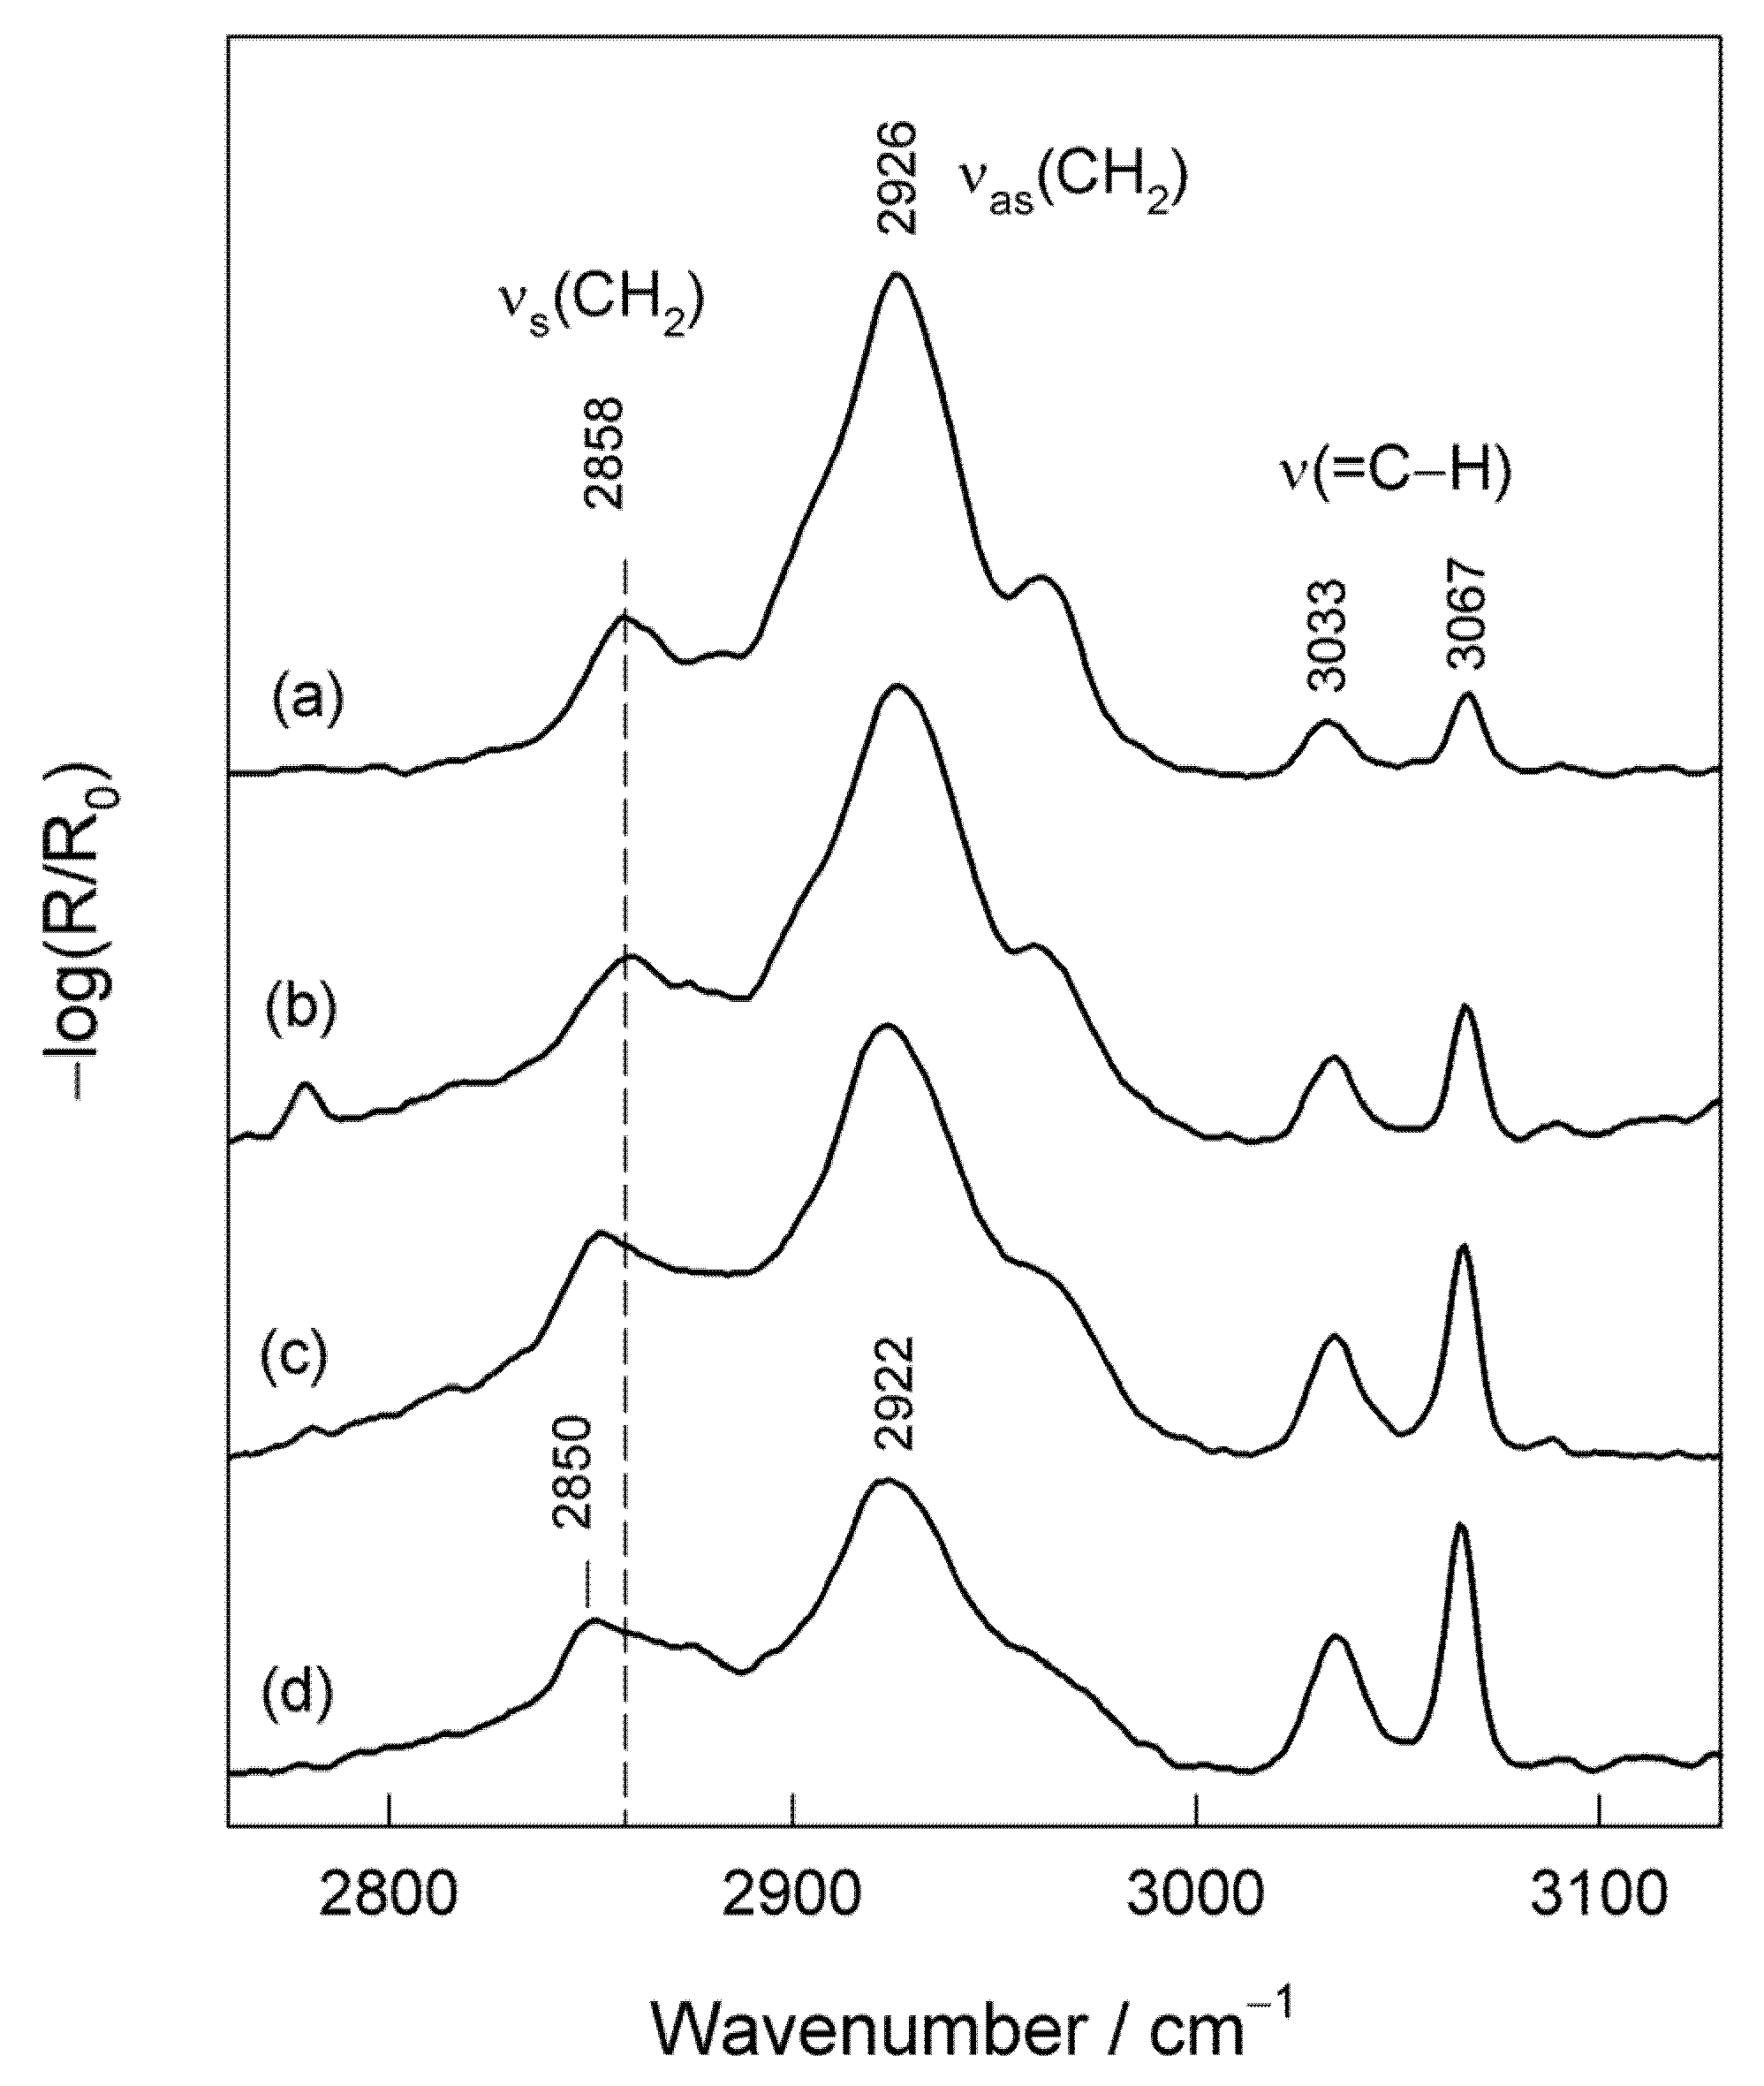
Information on the structure and packing of the alkyl chain in the monolayer might be extracted from the analysis of the high frequency C–H stretching vibration region of the RAIRS spectra (Figure 6). At initial adsorption time (5 s), the intense band near 2926 cm−1, due to asymmetric stretching vibration of CH2 groups (d), dominates in the spectrum. The symmetric stretching vibration of methylene groups is visible near 2858 cm−1 (d+), while two bands at 3033 and 3067 cm−1 are associated with stretching vibration ν(=C–H) and demonstrate the presence of the terminal Phe ring at the interface [39]. The high frequency value of νas(CH2) and νs(CH2) modes indicates the disordered state of the alkyl chains at the interface [12,15,48]. It is known that for SAMs with well-ordered and densely packed alkyl chains, the diagnostic positions of methylene stretching vibrations νas(CH2) and νs(CH2) occur at lower wavenumbers, i.e., at 2918 and 2950 cm−1, respectively [12]. A relatively high intensity of the νas(CH2) band is consistent with the alignment of alkyl chains at a high angle to the normal surface, because the transition dipole moment of this mode is perpendicular to C–C bond. The increase in adsorption time results in the substantial reorganization of alkyl chains in the monolayer: (i) relative intensity of νas(CH2) mode decreases, (ii) frequency of νas(CH2) and νs(CH2) bands shifts significantly to lower wavenumbers, and (iii) relative intensity of terminal Phe ring modes at 3033 and 3067 cm−1 increases (Figure 6). Observed changes indicate the development of ordering and packing in the alkyl chain region of the monolayer. However, it should be noted that even after 24 h adsorption time, the frequency of νas(CH2) mode did not reach the diagnostic value for well-ordered and highly-packed structures, 2918 cm−1 [12]. Snyder et al. [24,49] and Troughton et al. [50] have demonstrated that the position of νas(CH2) frequency provides insight into the extent of the lateral intermolecular interactions between the alkyl chains. The increase in lateral interactions downshifts the frequency. Thus, lateral interactions between the alkyl chains are somewhat reduced in the case of our studied monolayer when compared with the densely packed long-alkyl chain structures, possibly because of the bulky terminal Phe ring group.

3. Conclusions

We synthesized a novel multifunctional thiol compound with terminal phenylalanine and intrachain amide groups (HS(CH2)7CONH(CH2)2C6H5). To provide reliable assignments of the bands, the isotopically substituted analog with the deuterated phenylalanine ring was synthesized as well. The adsorption time-dependent evolution of the structure of the self-assembled monolayer was probed by reflection absorption infrared spectroscopy. We have observed a sigmoidal form transition from unordered to strongly hydrogen-bonded amide functionality with a transition inflection point at 2.2 ± 0.5 min related with the Amide-II band frequency increase from 1548 to 1557 cm−1. In addition to the Amide-II frequency evolution, we observed the sigmoidal form increase in the relative integrated intensity of the Amide-II/Amide-I bands, suggesting the adsorption time-induced reorientation of molecules in the monolayer so that, in the final state, the amide group C=O and N−H bonds are positioned nearly parallel to the gold substrate plane. No Amide-II band characteristic for unbounded or weakly bonded amide groups (near 1510 cm−1) was detected in the RAIRS spectra after sufficiently long adsorption times. The frequency of asymmetric stretching vibration of CH2 groups (2922 cm−1) revealed that the alkyl chain region is not as compact as was previously observed for long-chain well-ordered alkanethiol monolayers. On the basis of the changes in the relative intensity of F19a band of Phe ring at 1499 cm−1 during the self-assembly it was suggested that the C–C6H5 bond adopts a near perpendicular with surface plane orientation at the final monolayer formation stage.
We intend to extend the vibrational spectroscopy study of SAMs formed from MOPHE and MOPHE-D5 compounds in spectroelectrochemical cell by using surface-enhanced Raman spectroscopy (SERS) [51] to gain insights into the electric potential-induced changes in the structure of the Phe ring and amide groups.

4. Materials and Methods

4.1. Materials

Millipore-purified water (18 MΩ cm) was used for the preparation of monolayer formation solutions. The used inorganic salts were of ACS grade and were purchased from Sigma-Aldrich Chemie GmbH (Schnelldorf, Germany). Gold substrates were prepared by magnetron sputtering of the Cr sublayer (~3 nm) and, subsequently, on the 200 nm layer of Au on the cleaned glass substrates. These substrates were immersed into a 10 mM MOPHE ethanol solution for various adsorption times. Subsequently, the substrates were rinsed with ethanol (≥99.8%) and dried under N2 flow.

4.2. Reflection-Absorption IR Spectroscopy (RAIRS)

RAIRS data were collected on a Vertex 80v FTIR spectrometer (Bruker Inc., Ettlingen, Germany) equipped with a liquid nitrogen cooled mercury-cadmium-telluride (MCT) narrow band detector and a horizontal reflection accessory [52]. The spectral resolution was set at 4 cm−1. Spectra were acquired from 400 scans at a grazing angle of 80° by using p-polarized light. The spectrometer and the sample chamber were evacuated during the measurements. The spectrum of hexadecanethiol-d33 [HS(CD2)15CD3] self-assembled on gold was used as a reference. Infrared measurements of bulk samples were recorded by using KBr pellets. Frequencies and intensities of RAIRS bands were determined by fitting the experimental contour with Gaussian-Lorentzian form components. Spectral analysis was performed by using GRAMS/A1 8.0 (Thermo Electron Corp., Waltham, MA, USA) software. Standard deviations of parameters of RAIRS bands (peak position and intensity) were determined from 3–5 measurements.

4.3. Theoretical Modeling

Theoretical modeling was performed using Gaussian 09 distribution for Windows [53]. Geometry optimization and frequency calculations were completed with DFT method using the B3LYP functional. Geometry optimization and frequency calculations were done using the 6-311++G(2d,p) basis set for C, H, N, O, and S atoms, and LANL2DZ with ECP for Au atoms [4]. Calculated frequencies and intensities were scaled according to the procedure described elsewhere [4,54,55]. No imaginary wavenumbers were obtained in the calculated spectra.

4.4. Synthesis of MOPHE Compound

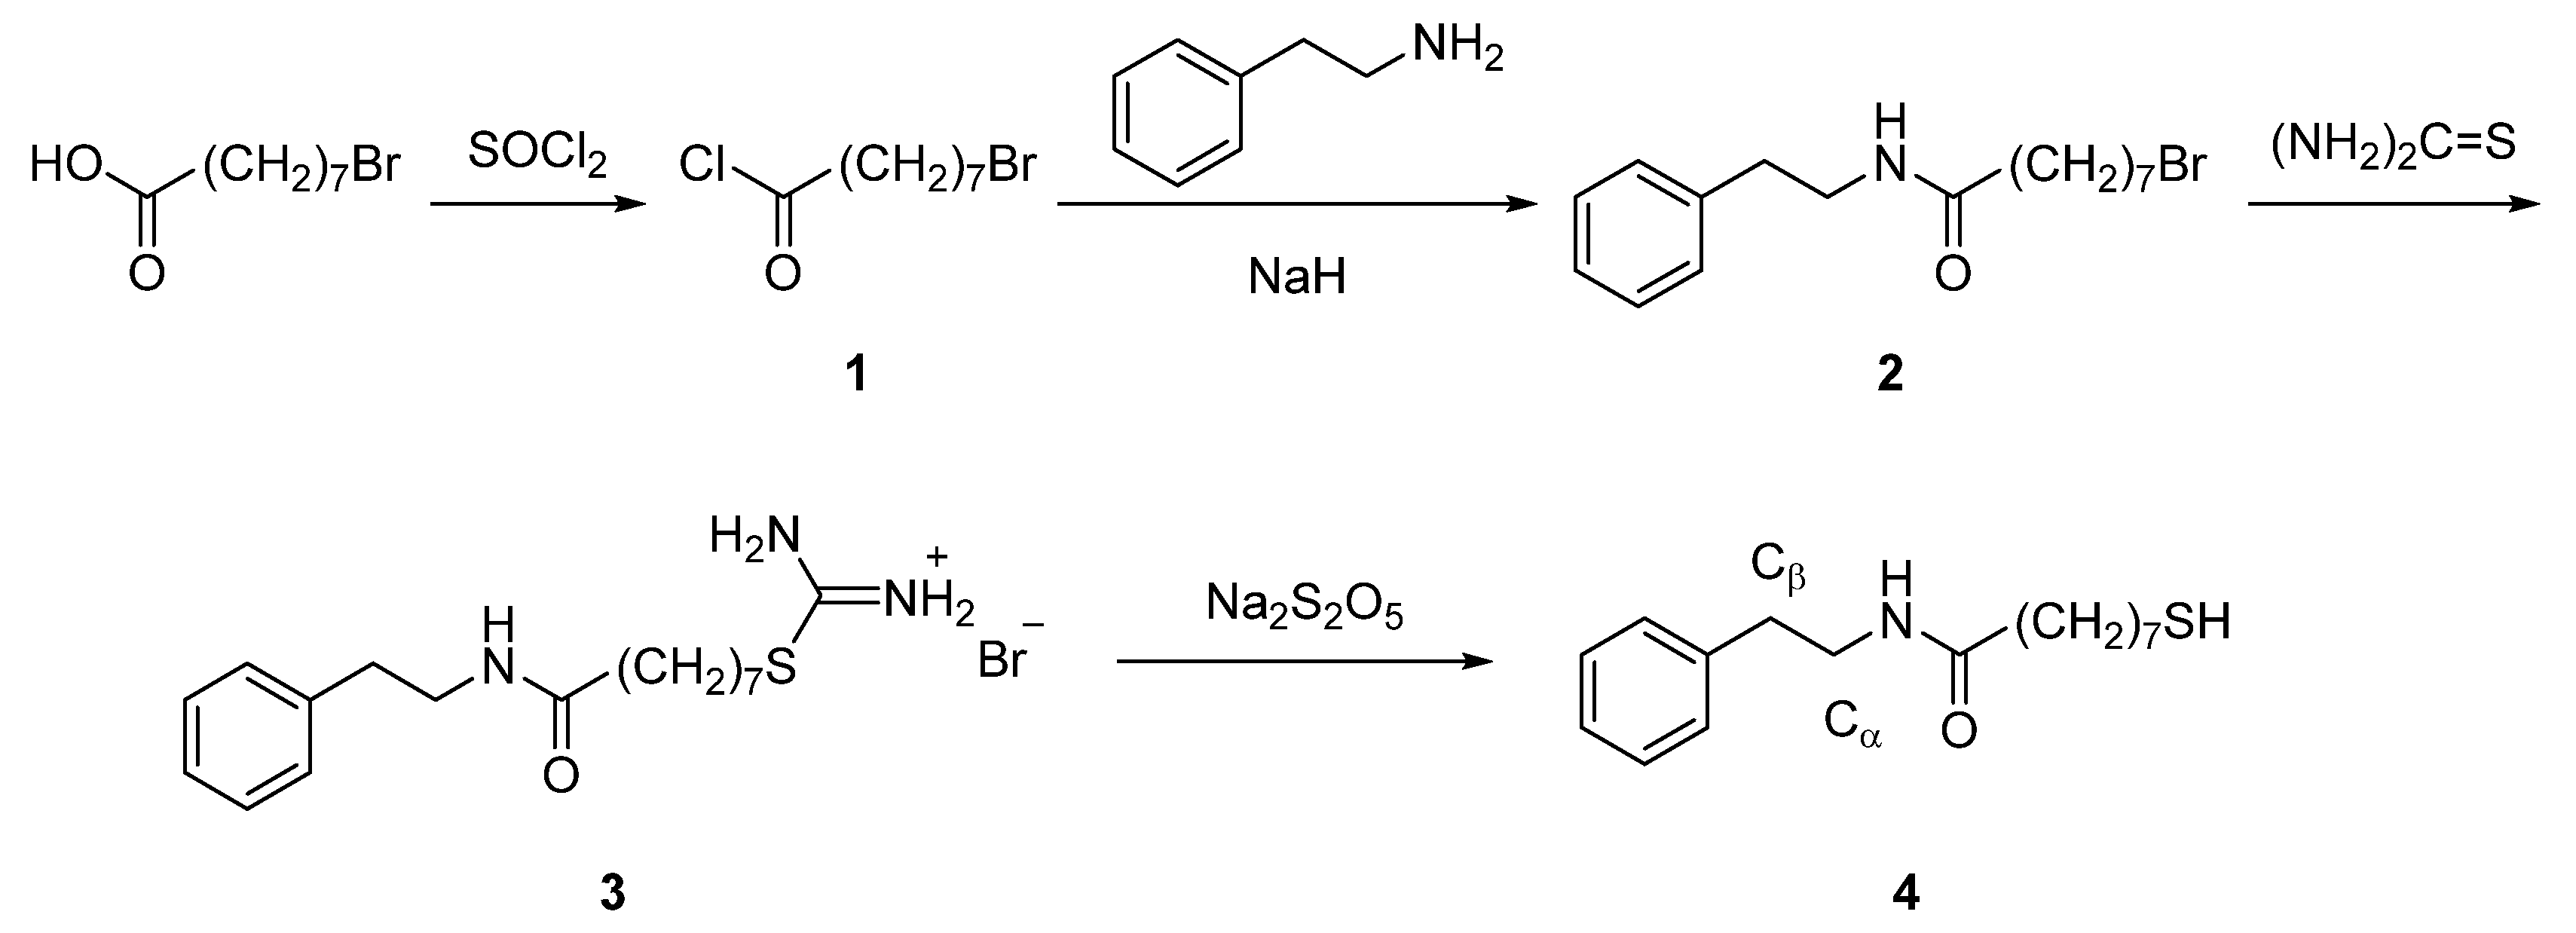
In this work, we synthesized bifunctional thiol molecule 8-mercapto-N-(phenethyl)octanamide (MOPHE) able to form self-assembled monolayers at the gold substrate. The synthesis route of this compound is shown in Figure 7.
General procedures. 8-Bromooctanoic acid (97%) and 2-phenylethan-1-amine (99%) were obtained from Sigma-Aldrich Chemie GmbH (Munich, Germany) and Across Organics (Geel, Belgium), respectively, and were used without additional purification. 1H and 13C NMR spectra were recorded in CDCl3 on Varian Unity Inova (300 MHz) spectrometer (Varian, Palo Alto, CA, USA) at a frequency of 299.75 MHz and 75.37 MHz for 1H and 13C, respectively; spectra were referenced using the solvent signal as internal standard (1H NMR: δ = 7.26 ppm; 13C NMR: δ = 77.0 ppm).
8-Bromo-N-(phenethyl)octanamide (2). Mixture of 8-bromooctanoic acid (1.1 g, 5 mmol), thionyl chloride (0.72 mL, 10 mmol) and dimethylformamide (0.2 mL) was stirred at room temperature for 15 h and evaporated. The obtained 8-bromooctanoylchloride (1) was used in the subsequent step without further purification. Solution of 1 in dry tetrahydrofuran (20 mL) was added to a mixture of 2-phenylethan-1-amine (0.6 g, 5 mmol) and NaH (0.3 g, 60% dispersion in mineral oil) in dry tetrahydrofuran (30 mL) at 0 °C. The reaction mixture was stirred at 0 °C for 2 h and then at room temperature for 20 h. The reaction mixture was then diluted with chloroform and washed with 0.5 M HCl. Organic phase was dried over anhydrous MgSO4, filtered and evaporated. Purification by crystallization from n-hexane afforded compound 2 (1 g, 61.3%). mp. 57–58 °C; 1H NMR (CDCl3): 1.26–1.36 (4H, m), 1.37–1.46 (2H, m), 1.59 (2H, p, J = 7.3 Hz), 1.84 (2H, p, J = 6.9 Hz), 2.12 (2H, t, J = 7.5 Hz), 2.82 (2H, t, J = 6.8 Hz), 3.40 (2H, t, J = 6.8 Hz), 3.53 (2H, q, J = 6.8 Hz), 7.1–7.33 (5H, m);. Found (%): C 58.67, H 7.62, Br 24.26. C16H24BrNO. Requires (%): C 58.90, H 7.41, Br 24.49.
8-Mercapto-N-(phenethyl)octanamide (MOPHE) (4). A solution of 2 (1 g, 3.1 mmol) and thiourea (0.3 g, 4 mmol) in acetonitrile (50 mL) was refluxed for 14 h, then cooled to room temperature and evaporated to dryness. The remaining residue was triturated with acetone and filtered. The obtained compound 3 was used in the subsequent step without further purification. To a solution of compound 3 (0.7 g, 1.7 mmol) in water (40 mL) and chloroform (40 mL), Na2S2O5 (0.4 g, 2 mmol) was added and the resulting mixture was refluxed under argon atmosphere for 7 h. Cooled reaction mixture was extracted with chloroform, combined organic phase was dried over anhydrous Na2SO4, filtered and evaporated. Purification by recrystallization from n-hexane afforded compound 4 (0.4 g, 41%). mp 58–60 °C; 1H NMR (CDCl3): 1.25–1.44 (7H, m), 1.54–1.64 (4H, m), 2.11 (2H, t, J = 7.5 Hz), 2.52 (2H, q, J = 7.5 Hz), 2.82 (2H, t, J = 6.8 Hz), 3.51 (2H, q, J = 6.8 Hz), 7.17–7.35 (5H, m); 13C NMR (CDCl3): 24.6, 25.6, 28.2, 28.8, 29.1, 33.9, 35.7, 36.8, 40.5, 126.5, 128.7, 128.8, 138.9, 172.9. Found (%): C 68.91, H 9.22, S 11.25. C16H25NOS. Requires (%): C 68.77, H 9.02, S 11.47.

4.5. Synthesis of MOPHE-D5 Compound

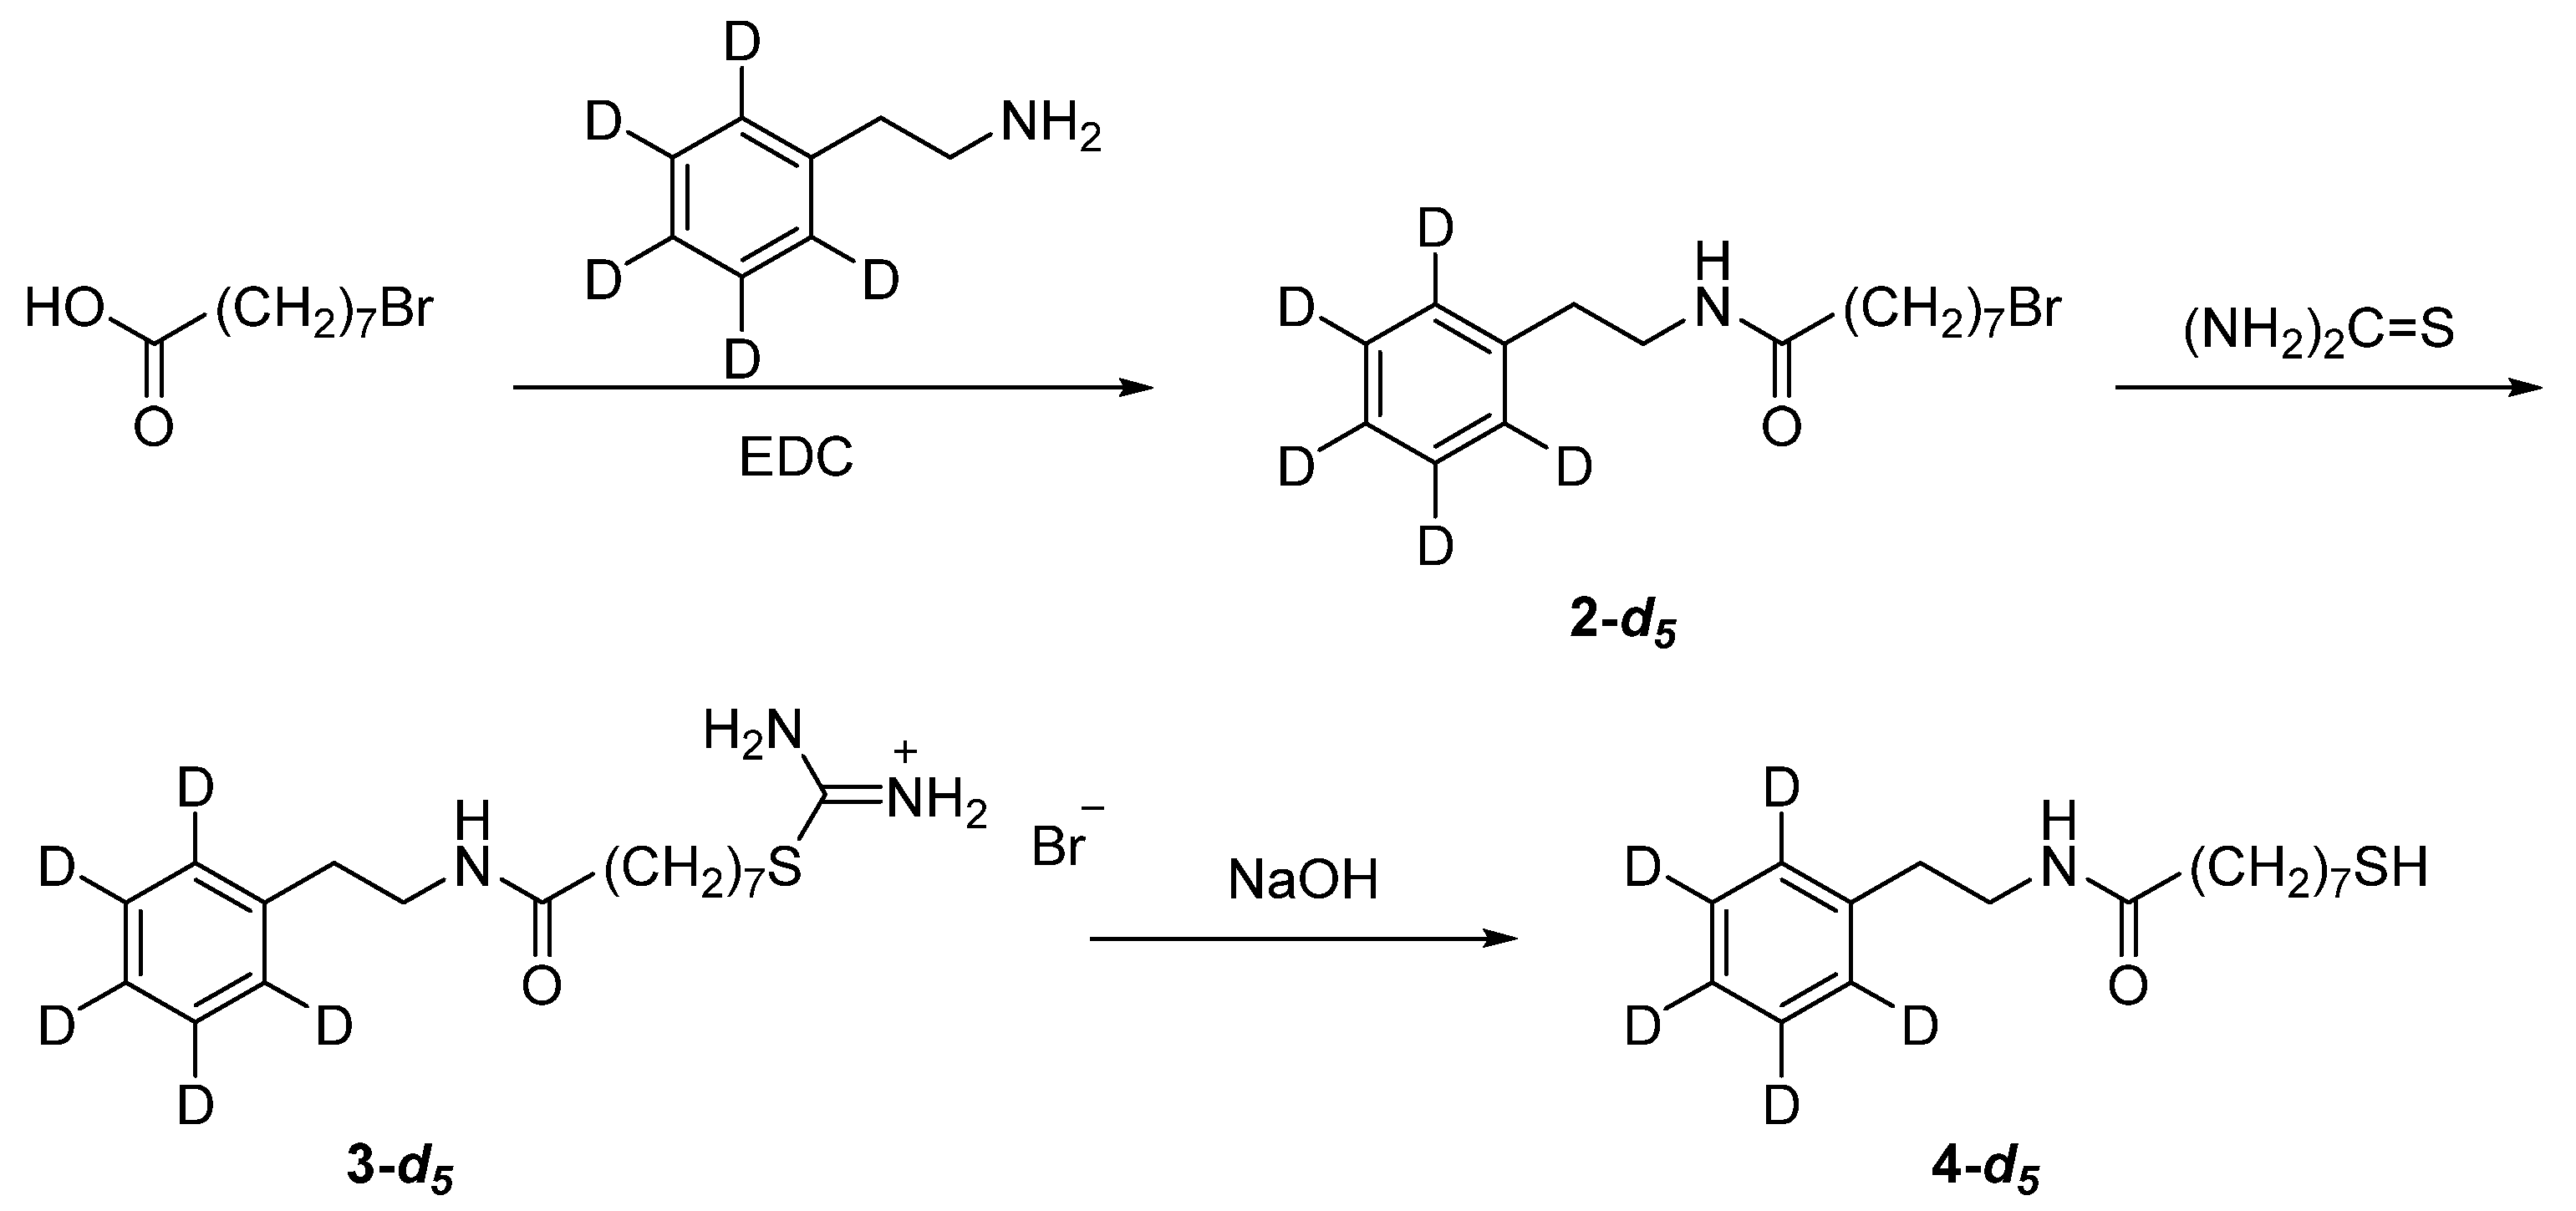
To afford reliable assignments of vibrational bands, we synthesized the Phe ring deuterated analog of the studied compound, MOPHE-D5. Synthesis route of this compound is shown in Figure 8.
General Procedures. Bromobenzene-d5 (99.5 atom%), N-(3-dimethylaminopropyl)-N’-ethylcarbodiimide hydrochloride (EDC) and 8-bromooctanoic acid were purchased from Sigma-Aldrich Chemie GmbH, Apollo Scientific (Stockport, UK) and Fluorochem (Hadfield, UK), respectively. 2-Phenylethan-1-amine-d5 was prepared from bromobenzene-d5 by following the reported procedures [56]. Dichloromethane and trimethylamine were dried and distilled from calcium hydride under argon before use. Thin layer chromatography was carried out on Kieselgel 60 F254 (Merck, Darmstadt, Germany) sheets coated with silica gel, and ZEOprep 60 silica gel (35–70 μm) (Apollo Scientific) was used for column chromatography.
1H and 13C NMR spectra were recorded in CDCl3 on Avance III (400 MHz) spectrometer (Bruker BioSpin GmbH, Rheinstetten, Germany) operating at a frequency of 400.13 and 100.61 MHz for 1H and 13C, respectively; spectra were referenced using the solvent signal as internal standard (1H NMR: δ = 7.26 ppm; 13C NMR: δ = 77.0 ppm). GC-MS analyses were performed with a Shimadzu GCMS-QP2010Ultra Plus (Kyoto, Japan), chromatographic separation was achieved on a Rxi®-5 ms column (30 m × 0.25 mm I.D., 0.25 μm film thickness (Restek, Bellefonte, PA, USA) using helium as carrier gas at 40 cm/s in a constant linear velocity mode. Temperature program: 50 °C (1 min), from 50 °C to 320 °C (25 °C/min), from 320 to 330 °C (50 °C/min), 330 °C (3.7 min). The temperatures of injector, interface, and ion source were 250, 330, and 250 °C, respectively. Detection was operated by selected ion monitoring (SIM) mode (EI mode), data were collected and analyzed using the GC-MS solution version 2.71 (Shimadzu, Kyoto, Japan).
8-Bromo-N-(phenethyl)octanamide-d5 (2-d5). Triethylamine (2.1 mL, 15 mmol) and N-(3-dimethylaminopropyl)-N’-ethylcarbodiimide hydrochloride (EDC; 2.3 g, 12 mmol) were added to a solution of 2-phenylethan-1-amine-d5 (1.26 g, 10 mmol) and 8-bromooctanoic acid (2.68 g, 12 mmol) in dry dichloromethane (100 mL) at 0 °C. The reaction mixture was stirred at 0 °C for 1 h and then at room temperature for 20 h. The reaction mixture was then diluted with dichloromethane (100 mL) and washed successively with 0.5 M HCl (2 × 100 mL), water (100 mL), saturated NaHCO3 (100 mL), and water (100 mL). The organic phase was dried over anhydrous Na2SO4, filtered and evaporated. Purification of the obtained residue by column chromatography on silica gel with a mixture of hexane-ethyl acetate (6:4, Rf = 0.24) afforded 2-d5 (2.51 g, 76%) as a clear oil, which solidifies on standing. Yellowish solid, mp. 57–59 °C; 1H NMR (CDCl3): 1.25–1.45 (6H, m), 1.59 (2H, p, J = 7.5 Hz), 1.84 (2H, p, J = 6.8 Hz), 2.11 (2H, t, J = 7.5 Hz), 2.82 (2H, t, J = 6.8 Hz), 3.39 (2H, t, J = 6.8 Hz), 3.52 (2H, q, J = 6.8 Hz), 5.47 (1H, br s); 13C NMR (CDCl3): 25.5, 27,9, 29.0, 32.7, 33.9, 35.6, 36.7, 40.4, 138.7, 172.9; GC-MS: tR = 11.475 min (m/z 330/332 (2.4/2.3%), [M]+●).
8-Mercapto-N-(phenethyl)octanamide-d5 (4-d5). A solution of 2-d5 (2.45 g, 7.4 mmol) and thiourea (620 mg, 8.14 mmol) in ethanol (24 mL) was refluxed overnight under argon atmosphere, then cooled to room temperature and evaporated to dryness. The obtained crude 3-d5 was used in the subsequent step without further purification. Crude 3-d5 was suspended in degassed aqueous NaOH solution (326 mg, 8.14 mmol in 24 mL water) and the resulting mixture was stirred at 100 °C under argon atmosphere for 2 h. Cooled reaction mixture was extracted with dichloromethane (3 × 20 mL), combined organic phase was dried over anhydrous Na2SO4, filtered and evaporated. Purification of the obtained residue by column chromatography on silica gel with a mixture of dichloromethane-methanol (99:1, Rf = 0.18) afforded 4-d5 (1.54 g, 73%) as a clear oil, which solidifies on standing. Colorless solid, mp. 56–57 °C; 1H NMR (CDCl3): 5.45 (1H, br s), 3.52 (2H, q, J = 6.8 Hz), 2.81 (2H, t, J = 6.8 Hz), 2.51 (2H, q, J = 7.4 Hz), 2.11 (2H, t, J = 7.5 Hz), 1.62–1.55 (4H, m), 1.40–1.25 (6H, m), 1.32 (1H, t, J = 7.7. Hz); 13C NMR (CDCl3): 24.6, 25.6, 28.1, 28.7, 29.1, 33.9, 35.6, 36.7, 40.4, 138.7, 172.9; GC-MS: tR = 11.412 min (m/z 251 (54%), [M-SH]+●).

Author Contributions

Conceptualization, Z.K., L.L., G.N.; synthesis, Z.K., L.L., S.S., O.E.-L., R.S.; methodology, investigation and analysis, I.M., M.Š., O.E.-L., G.N.; writing—original draft preparation, G.N.; writing—review and editing, Z.K., I.M., M.Š., L.L., S.S., O.E.-L., R.S., G.N.; project administration, G.N. All authors have read and agreed to the published version of the manuscript.

Funding

This research received no external funding.

Acknowledgments

G.N. gratefully acknowledges the Center of Spectroscopic Characterization of Materials and Electronic/Molecular Processes (SPECTROVERSUM Infrastructure) for use of Raman spectrometer. O.E.-L. and G.N. gratefully acknowledge the High Performance Computing Center “HPC Sauletekis” of Faculty of Physics at Vilnius University for computational resources.

Conflicts of Interest

The authors declare no conflict of interest.

References

  1. Ulman, A. Formation and structure of self-assembled monolayers. Chem. Rev. 1996, 96, 1533–1554. [Google Scholar] [CrossRef]
  2. Vericat, C.; Vela, M.E.; Corthey, G.; Pensa, E.; Cortes, E.; Fonticelli, M.H.; Ibanez, F.; Benitez, G.E.; Carro, P.; Salvarezza, R.C. Self-assembled monolayers of thiolates on metals: A review article on sulfur-metal chemistry and surface structures. RSC Adv. 2014, 4, 27730–27754. [Google Scholar] [CrossRef]
  3. Valincius, G.; Niaura, G.; Kazakevičienė, B.; Talaikytė, Z.; Butkus, E.; Razumas, V. Anion effect of mediated electron transfer through ferrocene-terminated self-asembled monolayers. Langmuir 2004, 20, 6631–6638. [Google Scholar] [CrossRef]
  4. Matulaitienė, I.; Kuodis, Z.; Matijoška, A.; Eicher-Lorka, O.; Niaura, G. SERS of the positive charge bearing pyridinium ring terminated self-assembled monolayers: Structure and bonding spectral markers. J. Phys. Chem. C 2015, 119, 26481–26492. [Google Scholar] [CrossRef]
  5. Salonen, L.M.; Ellermann, M.; Diederich, F. Aromatic rings in chemical and biological recognition: Energetics and structures. Angew. Chem. Int. Ed. 2011, 50, 4808–4842. [Google Scholar] [CrossRef]
  6. Makwana, K.M.; Mahalakshmi, R. Implications of aromatic–aromatic interactions: From protein structures to peptide models. Protein Sci. 2015, 24, 1920–1933. [Google Scholar] [CrossRef] [Green Version]
  7. Dougherty, D.A. The cation-π interaction. Acc. Chem. Res. 2013, 46, 885–893. [Google Scholar] [CrossRef] [Green Version]
  8. Hunter, C.A.; Singh, J.; Thornton, J.M. π–π Interactions: The geometry and energetics of phenylalanine-phenylalanine interactions in proteins. J. Mol. Biol. 1991, 218, 837–846. [Google Scholar] [CrossRef]
  9. Santos, L.A.; Da Cunha, E.F.F.; Freitas, M.P.; Ramalho, T.C. Hydrophobic noncovalent interactions of inosine-phenylalanine: A theoretical model for investigating the molecular recognition of nucleobases. J. Phys. Chem. A 2014, 118, 5808–5817. [Google Scholar] [CrossRef]
  10. Kim, M.; Hohman, J.N.; Serino, A.C.; Weiss, P.S. Structural manipulation of hydrogen-bonding networks in amide-containing alkanethiolate monolayers via electrochemical procesing. J. Phys. Chem C 2010, 114, 19744–19751. [Google Scholar] [CrossRef]
  11. Lewis, P.A.; Smith, R.K.; Kelly, K.F.; Bumm, L.A.; Reed, S.M.; Clegg, R.S.; Gunderson, J.D.; Hutchison, J.E.; Weiss, P.S. The role of buried hydrogen bonds in self-assembled mixed composition thiols on Au{111}. J. Phys. Chem. B 2001, 105, 10630–10636. [Google Scholar] [CrossRef]
  12. Clegg, R.S.; Hutchison, J.E. Control of monolayer assembly structure by hydrogen bonding rather than adsorbate-substrate templating. J. Am. Chem. Soc. 1999, 121, 5319–5327. [Google Scholar] [CrossRef]
  13. Clegg, R.S.; Hutchison, J.E. Hydrogen-bonding, self-assembled monolayers: Ordered molecular films for study of through-peptide electron transfer. Langmuir 1996, 12, 5239–5243. [Google Scholar] [CrossRef]
  14. Malysheva, L.; Onipko, A.; Valiokas, R.; Liedberg, B. First-principles modeling of oligo(ethylene glycol)-terminated and amide group containing alkanethiolates. Appl. Surf. Sci. 2005, 246, 372–376. [Google Scholar] [CrossRef]
  15. Valiokas, R.; Ostblom, M.; Svedhem, S.; Svensson, S.C.T.; Liedberg, B. Thermal stability of self-assembled monolayers: Influence of lateral hydrogen bonding. J. Phys. Chem. B 2002, 106, 10401–10409. [Google Scholar] [CrossRef]
  16. Špandyreva, M.; Ignatjev, I.; Matulaitienė, I.; Kuodis, Z.; Niaura, G. Sum frequency generation spectroscopy probing of formation of self-assembled monolayers from thiols with terminal phenylalanine ring and intrachain amide. Chemija 2018, 29, 219–226. [Google Scholar] [CrossRef]
  17. Vericat, C.; Vela, M.E.; Benitez, G.; Carro, P.; Salvarezza, R.C. Self-assembled monolayers of thiols and dithiols on gold: New challengers for a well-known system. Chem. Soc. Rev. 2010, 39, 1805–1834. [Google Scholar] [CrossRef]
  18. Nuzzo, R.G.; Korenic, E.M.; Dubois, L.H. Studies on temperature-dependent phase behavior of long-chain normal-alkyl thiol monolayers on gold. J. Chem. Phys. 1990, 93, 767–773. [Google Scholar] [CrossRef]
  19. Shin, H.S.; Kim, J.H.; Kim, S.B.; Jung, Y.M. Thermal characterization of self-assembled monolayers of dialkyl disulfides containing the urea moiety. Langmuir 2007, 23, 10567–10572. [Google Scholar] [CrossRef]
  20. Stoycheva, S.; Himmelhaus, M.; Fick, J.; Korniakov, A.; Grunze, M.; Ulman, A. Spectroscopic characterization of ω-substituted biophenylthiolates on gold and their use as substrates for “on-top” siloxane SAM formation. Langmuir 2006, 22, 4170–4178. [Google Scholar] [CrossRef]
  21. Nuzzo, R.G.; Dubois, L.H.; Allara, D.L. Fundamental studies of microscopic wetting on organic surfaces. 1. Formation and structural characterization of a self-consistent series of polyfunctional organic monolayers. J. Am. Chem. Soc. 1990, 112, 558–569. [Google Scholar] [CrossRef]
  22. Porter, M.D.; Bright, T.B.; Allara, D.L.; Chidsey, C.E.D. Spontaneousy organized molecular assemblies. 4. Structural caracterization of n-alkyl thiol monolayers on gold by optical ellipsometry, infrared spectroscopy, and electrochemistry. J. Am. Chem. Soc. 1987, 109, 3559–3568. [Google Scholar] [CrossRef]
  23. Laibinis, P.E.; Whitesides, G.M.; Allara, D.L.; Tao, Y.-T.; Parikh, A.N.; Nuzzo, R.G. Comparison of the structures and wetting properties of self-assembled monolayersof n-alkanethiols on the coinage metal surfaces, copper, silver, and gold. J. Am. Chem. Soc. 1991, 113, 7152–7167. [Google Scholar] [CrossRef]
  24. Snyder, R.G.; Strauss, H.L.; Elliger, C.A. Carbon-hydrogen stretching modes and the structure of n-alkyl chains. 1. Long disordered chains. J. Phys. Chem. 1982, 86, 5145–5150. [Google Scholar] [CrossRef]
  25. Bensebaa, F.; Ellis, T.H.; Badia, A.; Lennox, R.B. Thermal treatment of n-alkanethiolate monolayers on gold, as observed by infrared spectroscopy. Langmuir 1998, 14, 2361–2367. [Google Scholar] [CrossRef]
  26. Greenler, R.G. Infrared study of adsorbed moleculeson metal surfaces by reflection techniques. J. Chem. Phys. 1966, 44, 310. [Google Scholar] [CrossRef]
  27. Ramin, M.A.; Le Bourdon, G.; Daugey, N.; Bennetau, B.; Vellutini, L.; Buffeteau, T. PM-IRRAS investigation of self-assembled monolayers grafted onto SiO2/Au substrates. Langmuir 2011, 27, 6076–6084. [Google Scholar] [CrossRef]
  28. Nogues, C.; Lang, P. Self-asembled monolayers on a Zn substrate: Structure and organization. Langmuir 2007, 23, 8385–8391. [Google Scholar] [CrossRef]
  29. Zaera, F. New advances in the use of infrared absorption spectroscopy for the characterization of heterogeneous catalytic reactions. Chem. Soc. Rev. 2014, 43, 7624–7663. [Google Scholar] [CrossRef]
  30. Silva, C.B.; da Silva Filho, J.G.; Pinheiro, G.S.; Teixeira, A.M.R.; Freire, P.T.C. Vibrational and structural properties of L-Alanyl-L-Phenylalanine dipeptide by Raman spectroscopy, infrared and DFT calculations. Vibr. Spectrosc. 2018, 98, 128–133. [Google Scholar] [CrossRef]
  31. Krimm, S.; Bandekar, J. Vibrational spectroscopy and conformation of peptides, polypeptides, and proteins. Adv. Protein Chem. 1986, 38, 181–364. [Google Scholar]
  32. Jackson, M.; Mantsch, H.H. The use and misuse of FTIR spectroscopy in the determination of protein structure. Crit. Rev. Biochem. Mol. Biol. 1995, 30, 95–120. [Google Scholar] [CrossRef]
  33. Misiūnas, A.; Talaikytė, Z.; Niaura, G.; Razumas, V.; Nylander, T. Thermomyces lanuginosus lipase in the liquid-crystalline phases of aqueous phytantriol: X-ray diffraction and vibrational spectroscopy studies. Biophys. Chem. 2008, 134, 144–156. [Google Scholar] [CrossRef]
  34. Talaikis, M.; Strazdaitė, S.; Žiaunys, M.; Niaura, G. Far-of resonance: Multiwavelength Raman spectroscopy probing amide bands of amyloid-β-(37-42) peptide. Molecules 2020, 25, 3556. [Google Scholar] [CrossRef]
  35. Yatsyna, V.; Bakker, D.J.; Feifel, R.; Rijs, A.M.; Zhaunerchyk, V. Far-infrared amide IV-VI spectroscopy of isolated 2- and 4-methylacetanilide. J. Chem. Phys. 2016, 145, 104309. [Google Scholar] [CrossRef] [Green Version]
  36. Hernández, B.; Pflüger, F.; Adenier, A.; Kruglik, S.G.; Ghomi, M. Vibrational analysis of amino acids and short peptides in hydrated media. VIII. Amino acids with aromatic side chains: L-Phenylalanine, L-Tyrosine, and L-Tryptophan. J. Phys. Chem. B 2010, 114, 15319–15330. [Google Scholar] [CrossRef]
  37. Olsztynska, S.; Dupuy, N.; Vrielynck, L.; Komorowska, M. Water evaporation analysis of L-Phenylalanine from initial aqueous solutions to powder state by vibrational spectroscopy. Appl. Spectrosc. 2006, 60, 1040–1053. [Google Scholar] [CrossRef]
  38. Kocherbitov, V.; Latynis, J.; Misiūnas, A.; Barauskas, J.; Niaura, G. Hydration of lysozyme studied by Raman spectroscopy. J. Phys. Chem. B 2013, 117, 4981–4992. [Google Scholar] [CrossRef]
  39. Yokoyama, T.; Hirata, N.; Tsunoyama, H.; Eguchi, T.; Negishi, Y.; Nakajima, A. Vibrational spectra of thiolate-protected gold nanocluster with infrared reflection absorption spectroscopy: Size- and temperature-dependent ordering behavior of organic monolayer. J. Phys. Chem. C 2020, 124, 363–371. [Google Scholar] [CrossRef]
  40. Myshakina, N.S.; Ahmed, Z.; Asher, S.A. Dependence of amide vibrations on hydrogen bonding. J. Phys. Chem. B 2008, 112, 11873–11877. [Google Scholar] [CrossRef] [Green Version]
  41. Podstawka, E.; Niaura, G. Potential-dependent characterization of bombesin adsorbed states on roughened Ag, Au, and Cu electrode surfaces at physiological pH. J. Phys. Chem. B 2009, 113, 10974–10983. [Google Scholar] [CrossRef]
  42. Ignatjev, I.; Proniewicz, E.; Proniewicz, L.M.; Niaura, G. Effect of potential on temperature-dependent SERS spectra of neuromedin B on Cu electrode. Phys. Chem. Chem. Phys. 2013, 15, 807–815. [Google Scholar] [CrossRef]
  43. Clegg, R.S.; Reed, S.M.; Smith, R.K.; Barron, B.L.; Rear, J.A.; Hutchison, J.E. The interplay of lateral and tiered interactions in stratified self-assembled molecular assemblies. Langmuir 1999, 15, 8876–8883. [Google Scholar] [CrossRef]
  44. Sabapathy, R.C.; Bhattacharyya, S.; Leavy, M.C.; Cleland, W.E.; Hussey, C.L. Electrochemical and spectroscopic characterization of self-asembled monolayers of ferrocenylalkyl compounds with amide linkages. Langmuir 1998, 14, 124–136. [Google Scholar] [CrossRef]
  45. Cai, S.; Singh, B.R. Identification of b-turn and random coil amide III infrared bands for secondary structure estimation of proteins. Biophys. Chem. 1999, 80, 7–20. [Google Scholar] [CrossRef]
  46. Tam-Chang, S.-W.; Biebuyck, H.A.; Whitesides, G.M.; Jeon, N.; Nuzzo, R.A. Self-assembled monolayers on gold generated from alkanethiols with the structure RNHCOCH2SH. Langmuir 1995, 11, 4371–4382. [Google Scholar] [CrossRef]
  47. Blasi, D.; Sarcina, L.; Tricase, A.; Stefanachi, A.; Leonetti, F.; Alberga, D.; Mangiatordi, F.; Manoli, K.; Scamarcio, G.; Picca, R.A.; et al. Enhancing the sensitivity of biotynated surfaces by tailoring the design of the mixed self-assembled monolayer synthesis. ACS Omega 2020, 5, 16762–16771. [Google Scholar] [CrossRef]
  48. Magallanes, C.; Aguirre, B.M.; González, G.A.; Méndez De Leo, L.P. Interaction of aqueous Cu(II) with carboxylic acid and alcohol terminated self asembled monolayers: Surface and interfacial characterization. Surf. Sci. 2020, 692, 121529. [Google Scholar] [CrossRef]
  49. Snyder, R.G.; Maroncelli, M.; Strauss, H.L.; Hallmark, V.M. Temperature and phase behavior of infrared intensities: The poly(methylene) chain. J. Phys. Chem. 1986, 90, 5623–5630. [Google Scholar] [CrossRef]
  50. Troughton, E.B.; Bain, C.D.; Whitesides, G.M.; Nuzzo, R.G.; Allara, D.L.; Porter, M.D. Monolayer films prepared by the spontaneous self-assembly of symmetrical and unsymmetrical dialkyl sulfides from solution: Structure, properties, and reactivity of constituent functional groups. Langmuir 1988, 4, 365–385. [Google Scholar] [CrossRef]
  51. Kuttner, C. Plasmonic in sensing: From calorimetry to SERS analytics. In Plasmonics; Gric, T., Ed.; IntechOpen: London, UK, 2018; pp. 151–180. [Google Scholar] [CrossRef] [Green Version]
  52. Budvytytė, R.; Valincius, G.; Niaura, G.; Voiciuk, V.; Mickevičius, M.; Chapman, H.; Goh, H.-Z.; Shekhar, P.; Heinrich, F.; Shenoy, S.; et al. Structure and properties of tethered bilayer lipid membranes with unsaturated anchor molecules. Langmuir 2013, 29, 8645–8656. [Google Scholar] [CrossRef] [Green Version]
  53. Frisch, M.J.; Trucks, G.W.; Schlegel, H.B.; Scuseria, G.E.; Robb, M.A.; Cheeseman, J.R.; Scalmani, G.; Barone, V.; Mennucci, B.; Petersson, G.A.; et al. Gaussian 09; Revision D.01; Gaussian, Inc.: Wallingford, CT, USA, 2013. [Google Scholar]
  54. Talaikis, M.; Eicher-Lorka, O.; Valincius, G.; Niaura, G. Water-induced structural changes in the membrane-anchoring monolayers revealed by isotope-edited SERS. J. Phys. Chem. C 2016, 120, 22489–22499. [Google Scholar] [CrossRef]
  55. Matulaitienė, I.; Pociutė, E.; Kuodis, Z.; Eicher-Lorka, O.; Niaura, G. Interaction of 4-imidazolemethanol with a copper electrode revealed by isotope-edited SERS and theoretical modeling. Phys. Chem. Chem. Phys. 2015, 17, 16483–16493. [Google Scholar] [CrossRef]
  56. Morrison, J.J.; Botting, N.P. The synthesis of [phenyl-2H5]glyconasturtiin and its metabolites for metabolic studies. J. Label. Compd. Radiopharm. 2005, 48, 897–907. [Google Scholar] [CrossRef]
Figure 1. Molecular structures of multifunctional thiol compounds MOPHE (8-mercapto-N-(phenethyl)octanamide) and MOPHE-D5 (8-mercapto-N-(phenethyl)octanamide-d5).
Molecules 25 05633 g001
Figure 2. Infrared spectra of bulk MOPHE and Phe ring deuterated MOPHE-D5 compounds.
Molecules 25 05633 g002
Figure 3. Reflection absorption infrared spectroscopy (RAIRS) spectra of MOPHE adsorbed at the gold surface in the fingerprint spectral region (1100–1710 cm−1) obtained at different immersion times in ethanol solution containing 10−3 M MOPHE. Immersion time: (a) 5 s, (b) 30 s, (c) 3 min, (d) 1 h, and (e) 24 h.
Molecules 25 05633 g003
Figure 4. Dependence of parameters of RAIRS bands: (A) Amide-II (Am-II) mode wavenumber and (B) relative integrated intensity AAm-II/AAm-I ratio on immersion time in ethanol solution containing 10−3 M of MOPHE compound. The solid lines are the best fit to Equation (1) with transition inflection point values tm = 2.2 ± 0.5 min and tm = 4.7 ± 0.5 min for graphs (A) and (B), respectively.
Molecules 25 05633 g004
Figure 5. Structure of Au4−MOPHE complex optimized at DFT/B3LYP/6-311++G(2d,p) basis set for C, H, N, O, and S atoms and LANL2DZ with ECP for Au atoms and transition dipole moment (TDM) directions for Am-I, Am-II, and Phe ring F19a vibrational modes.
Molecules 25 05633 g005
Figure 6. RAIRS spectra of MOPHE adsorbed at the gold surface in the C–H stretching spectral region (2750−3150 cm−1) obtained at different immersion times in ethanol solution containing 10−3 M MOPHE. Immersion time: (a) 5 s, (b) 30 s, (c) 3 min, and (d) 1 h.
Molecules 25 05633 g006
Figure 7. Synthesis route of 8-mercapto-N-(phenethyl)octanamide (4, MOPHE).
Molecules 25 05633 g007
Figure 8. Synthesis route of 8-mercapto-N-(phenethyl)octanamide-d5 (4-d5, MOPHE-D5).
Molecules 25 05633 g008
Table 1. Frequencies (cm−1) and assignments of main infrared absorption bands of MOPHE (8-mercapto-N-(phenethyl)octanamide) and MOPHE-D5 (8-mercapto-N-(phenethyl)octanamide-d5).
Solid StateCalculatedAssignments
MOPHEMOPHE-D5MOPHEMOPHE-D5
3309 vs3309 vs35683568ν(N−H) Amide-A
3027 w2275 w31243124ν(=C–H) Phe
2926 s292630043004νas(CH2) Chain
2852 s2852 s29732973νs(CH2) Chain
2558 w2258 v26352635ν(S−H) Thiol
1640 vs1640 vs17131713ν(C=O) + δ(NH) Amide-I
1546 vs1546 vs15251525ν(C−N) + δ(NH) Amide-II
1496 m1383 m14811403ν(C=C) + β(CH) Phe (F19a) a
1465 m1465 m14661466δ(CH2) Chain (scissoring)
1454 w1383 wν(C=C) + β(CH) Phe (F19b)
1418 w1418 w13921392δ(CH2) Chain (scissoring)
1328 m1328 m13541354δ(CH2) Chain
1257 w1257 w12621262δ(CH2) Chain
1249 m1249 m12411241ν(C−N) + δ(CNH) Amide-III
1195 m1195 m12061207δ(CH2) Chain
1030 w821 w1048837β(CH) Phe (F18a)
749 s546 s763554γ(CH) Phe (F11)
707 br,m707 br, mγ(NH) Amide V
699 s447 s714452γ(CH) Phe (F4)
Abbreviations: ν, stretching; δ, deformation; β, in-plane bending; γ, out-of-plane bending; vs, very strong; s, strong; m, middle; w, weak; br, broad; s, symmetric; as, asymmetric. a The Wilson notation is used for the description the characteristic vibrational modes of the Phe ring.
Sample Availability: Samples of the compounds are not available from the authors.
Publisher’s Note: MDPI stays neutral with regard to jurisdictional claims in published maps and institutional affiliations.