Article

Ultrasound-Assisted Extraction Optimization of α-Glucosidase Inhibitors from Ceratophyllum demersum L. and Identification of Phytochemical Profiling by HPLC-QTOF-MS/MS

1
State Key Laboratory of Food Science and Technology, Nanchang University, Nanchang 330047, China
2
National R&D Center for Freshwater Fish Processing, and Engineering Research Center of Freshwater Fish High-value Utilization of Jiangxi Province, Jiangxi Normal University, Nanchang 330022, China
*
Authors to whom correspondence should be addressed.
Molecules 2020, 25(19), 4507; https://doi.org/10.3390/molecules25194507
Submission received: 31 August 2020 / Revised: 18 September 2020 / Accepted: 25 September 2020 / Published: 1 October 2020
(This article belongs to the Section Natural Products Chemistry)

Abstract

:
Ceratophyllum demersum L. (CDL) is a traditional Chinese herb to treat many diseases, but research on its anti-diabetic activity is not available. In this research, the α-glucosidase inhibitory ability and phytochemical constituents of CDL extract were firstly studied. Optimal ultrasound-assisted extraction conditions for α-glucosidase inhibitors (AGIs) were optimized by single factor experiment and response surface methodology (RSM), which was confirmed as 70% methanol, liquid-to-solid ratio of 43 (mL/g), extraction time of 54 min, ultrasonic power of 350 W, and extraction temperature of 40 °C. The lowest IC50 value for α-glucosidase inhibition was 0.15 mg dried material/mL (mg DM/mL), which was much lower than that of acarbose (IC50 value of 0.64 mg DM/mL). In total, 80 compounds including 8 organic acids, 11 phenolic acids, 25 flavonoids, 21 fatty acids, and 15 others were identified or tentatively identified from CDL extract by HPLC-QTOF-MS/MS analysis. The results suggested that CDL could be a potential source of α-glucosidase inhibitors. It can also provide useful phytochemical information for research into other bioactivities.

1. Introduction

α-Glucosidase is a vital carbohydrate hydrolase situated in the brush border surface membrane of the small intestine, which is involved in the last step of carbohydrate digestion by hydrolyzing the α-(1,4) glycosidic bond to release glucose at the non-reducing end [1]. α-Glucosidase inhibitors (AGIs) can effectively alleviate the release of glucose from dietary carbohydrates and delay the absorption of glucose by inhibiting the action of α-glucosidase, resulting in delayed postprandial blood glucose level [2]. Currently, acarbose, miglitol, and voglibose are the commonly used AGIs to treat diabetes and its complications, but these drugs exhibit toxic side effects, such as flatus, diarrhea, abdominal colic, and so on [3]. At present, numerous studies have proved that many plant extracts possess the potential to be excellent sources of AGIs, with the advantages of being natural, highly-efficient, inexpensive, and with low toxicity. Moreover, many highly active AGIs have been isolated and identified, such as flavones, phenolic acids, alkaloids, terpenes, anthocyanins, glycosides, and so on [4,5]. Zhang et al. [6] evaluated the α-glucosidase inhibitory activity of four Acer species leaves, and the IC50 values were 167–433 fold of that of acarbose; hydrolysable tannins were the major contributors. 3-Caffeyl-5-feruloylquinic acid was found to be the major AGI of Artemisia selengensis Turcz root [7]. Datura stramonium L. (Solanaceae) root extracts [8] and Ocimum gratissimum leaf extracts [9] were found to show considerable potential to control the blood glucose level of streptozocin-induced diabetic rats.
At present, the conventional extraction techniques used to extract active substances from plants are mainly solvent extraction and supercritical fluid extraction [10]. Solvent extraction takes a long time to soak, and the extraction efficiency is not high. Supercritical fluid extraction requires expensive equipment and can clog the system when water is present in the sample [11]. As an emergent non-thermal extraction technology, ultrasonic-assisted extraction (UAE) is cheap and easy to use in practice [12]. In addition, it has many physical effects on the plant materials, such as fragmentation, corrosion, ultrasonic capillary effect, acoustic pore effect, and local shear, which can reduce the particle size, increase the surface area, and destroy the cell junction structure of the plant matrix, leading to improved mass transfer efficiency and enhanced extraction rate [13]. UAE is usually performed at lower temperatures to prevent thermal degradation of bio-active compounds in the extract [14]. In addition, the recovery efficacy of active components from plants is usually influenced by many factors, such as liquid-to-solid ratio, temperature, time, ultrasonic power, and solvent polarity [15]. Therefore, in order to improve extraction efficiency, reduce extraction costs, and to obtain the most active substances, it is necessary to optimize the extraction conditions. Response surface method (RSM), a mathematical and statistical tool, is widely used to optimize the extraction process, and can elucidate the possible interactions between experimental variables in various processes, reduce experiment numbers and improve statistical interpretation [16]. Zerajic et al. [17] optimized the factors (extraction time, ethanol concentration, and extraction temperature) affecting the UAE of Calendulae officinalis L. flowers using a Box-Behnken design (BBD). Yang et al. [18] applied the BBD to optimize the factors (methanol concentration, extraction temperature, and liquid-to-solid ratio) of the UAE of kinsenoside compound from Anoectochilus roxburghii (Wall.) Lindl.
Ceratophyllum demersum L. (CDL), also known as hornwort, is a perennial submerged macrophyte commonly found in ponds, lakes, and streams. It has been traditionally used in the treatment of diarrhea, fever, wounds, hemorrhoids or piles, intrinsic hemorrhages, hyperdipsia, and hematemesis [19]. Some studies have shown that CDL extracts showed a variety of biological activities, including antioxidant [20], antifungal [21], insecticidal [22], anti-diarrhea, and wound healing [19]. Various flavonoids like tricin-7-O-β-d-glucoside, naringenin-7-O-β-d-glucoside, apigenin-7-O-glucoside, and apigenin diglycoside could be the active ingredients in CDL [23,24]. However, research on the hypoglycemic effects and related active constituents of CDL are not available.
This research optimized the extraction condition of α-glucosidase inhibitors (AGIs) from CDL using RSM and characterized its phytochemical constituents. A suitable solvent for extraction of AGIs was firstly screened by determination of α-glucosidase inhibitory ability, total phenolic content, and total flavonoid content. Methanol extract (70%) was found to show the best suppression with the lowest IC50 value of 0.17 mg DM/mL, which was 3.7 times higher than acarbose (IC50 value of 0.76 mg/mL). Then, the optimal extraction conditions of AGIs in CDL were optimized by using single factor experiments and RSM. The major phytochemical components which gave the best inhibition of the activity of α-glucosidase were identified or tentatively identified by HPLC-QTOF-MS/MS.

2. Results and Discussion

2.1. Effect of Solvent Polarity on the Recovery of AGIs

The recovery of bioactive compounds varied greatly with the changes of solvent polarity. Therefore, the influence of different concentrations of methanol on the extraction of AGIs from CDL was evaluated separately; the result is given in Figure 1. All extracts had considerable α-glucosidase inhibition in the sample concentration range of 0.17–2.5 mg DM/mL and exhibited an obvious dose—effect relationship. The 70% methanol extract possessed the best α-glucosidase inhibition with the lowest IC50 value of 0.17 mg DM/mL. The inhibition was 3.7 times higher than acarbose (0.76 mg/mL), a clinical diabetes treatment drug, indicating the hypoglycemic potential of CDL extracts (Figure 1a). Analysis of total phenolic content (TPC) and total flavonoid content (TFC) indicated that 30% methanol extract possessed the highest TPC, with the value of 3.76 mg GAE/g DM. The highest TFC was found in 70% methanol extract (27.88 mg quercetin equivalents per gram of dried material (mg QuE/g DM,)). The 10% methanol extract possessed the lowest TPC and TFC, which were only 3.11 mg gallic acid equivalents per gram of dried material (mg GAE/g DM) and 0.23 mg QuE/g DM, respectively (Figure 1b). These indicated that the medium polar solvent is more suitable for extracting phenols in CDL, and the weak polar solvent is suitable for extracting flavonoids. Correlation coefficient analysis (Table S1) revealed that the flavonoids in CDL correlated well (r = −0.648) with the α-glucosidase inhibition, so flavonoids could be the major contributor to the α-glucosidase inhibition of CDL. Thus, 70% methanol was selected for further extraction of AGIs from CDL.

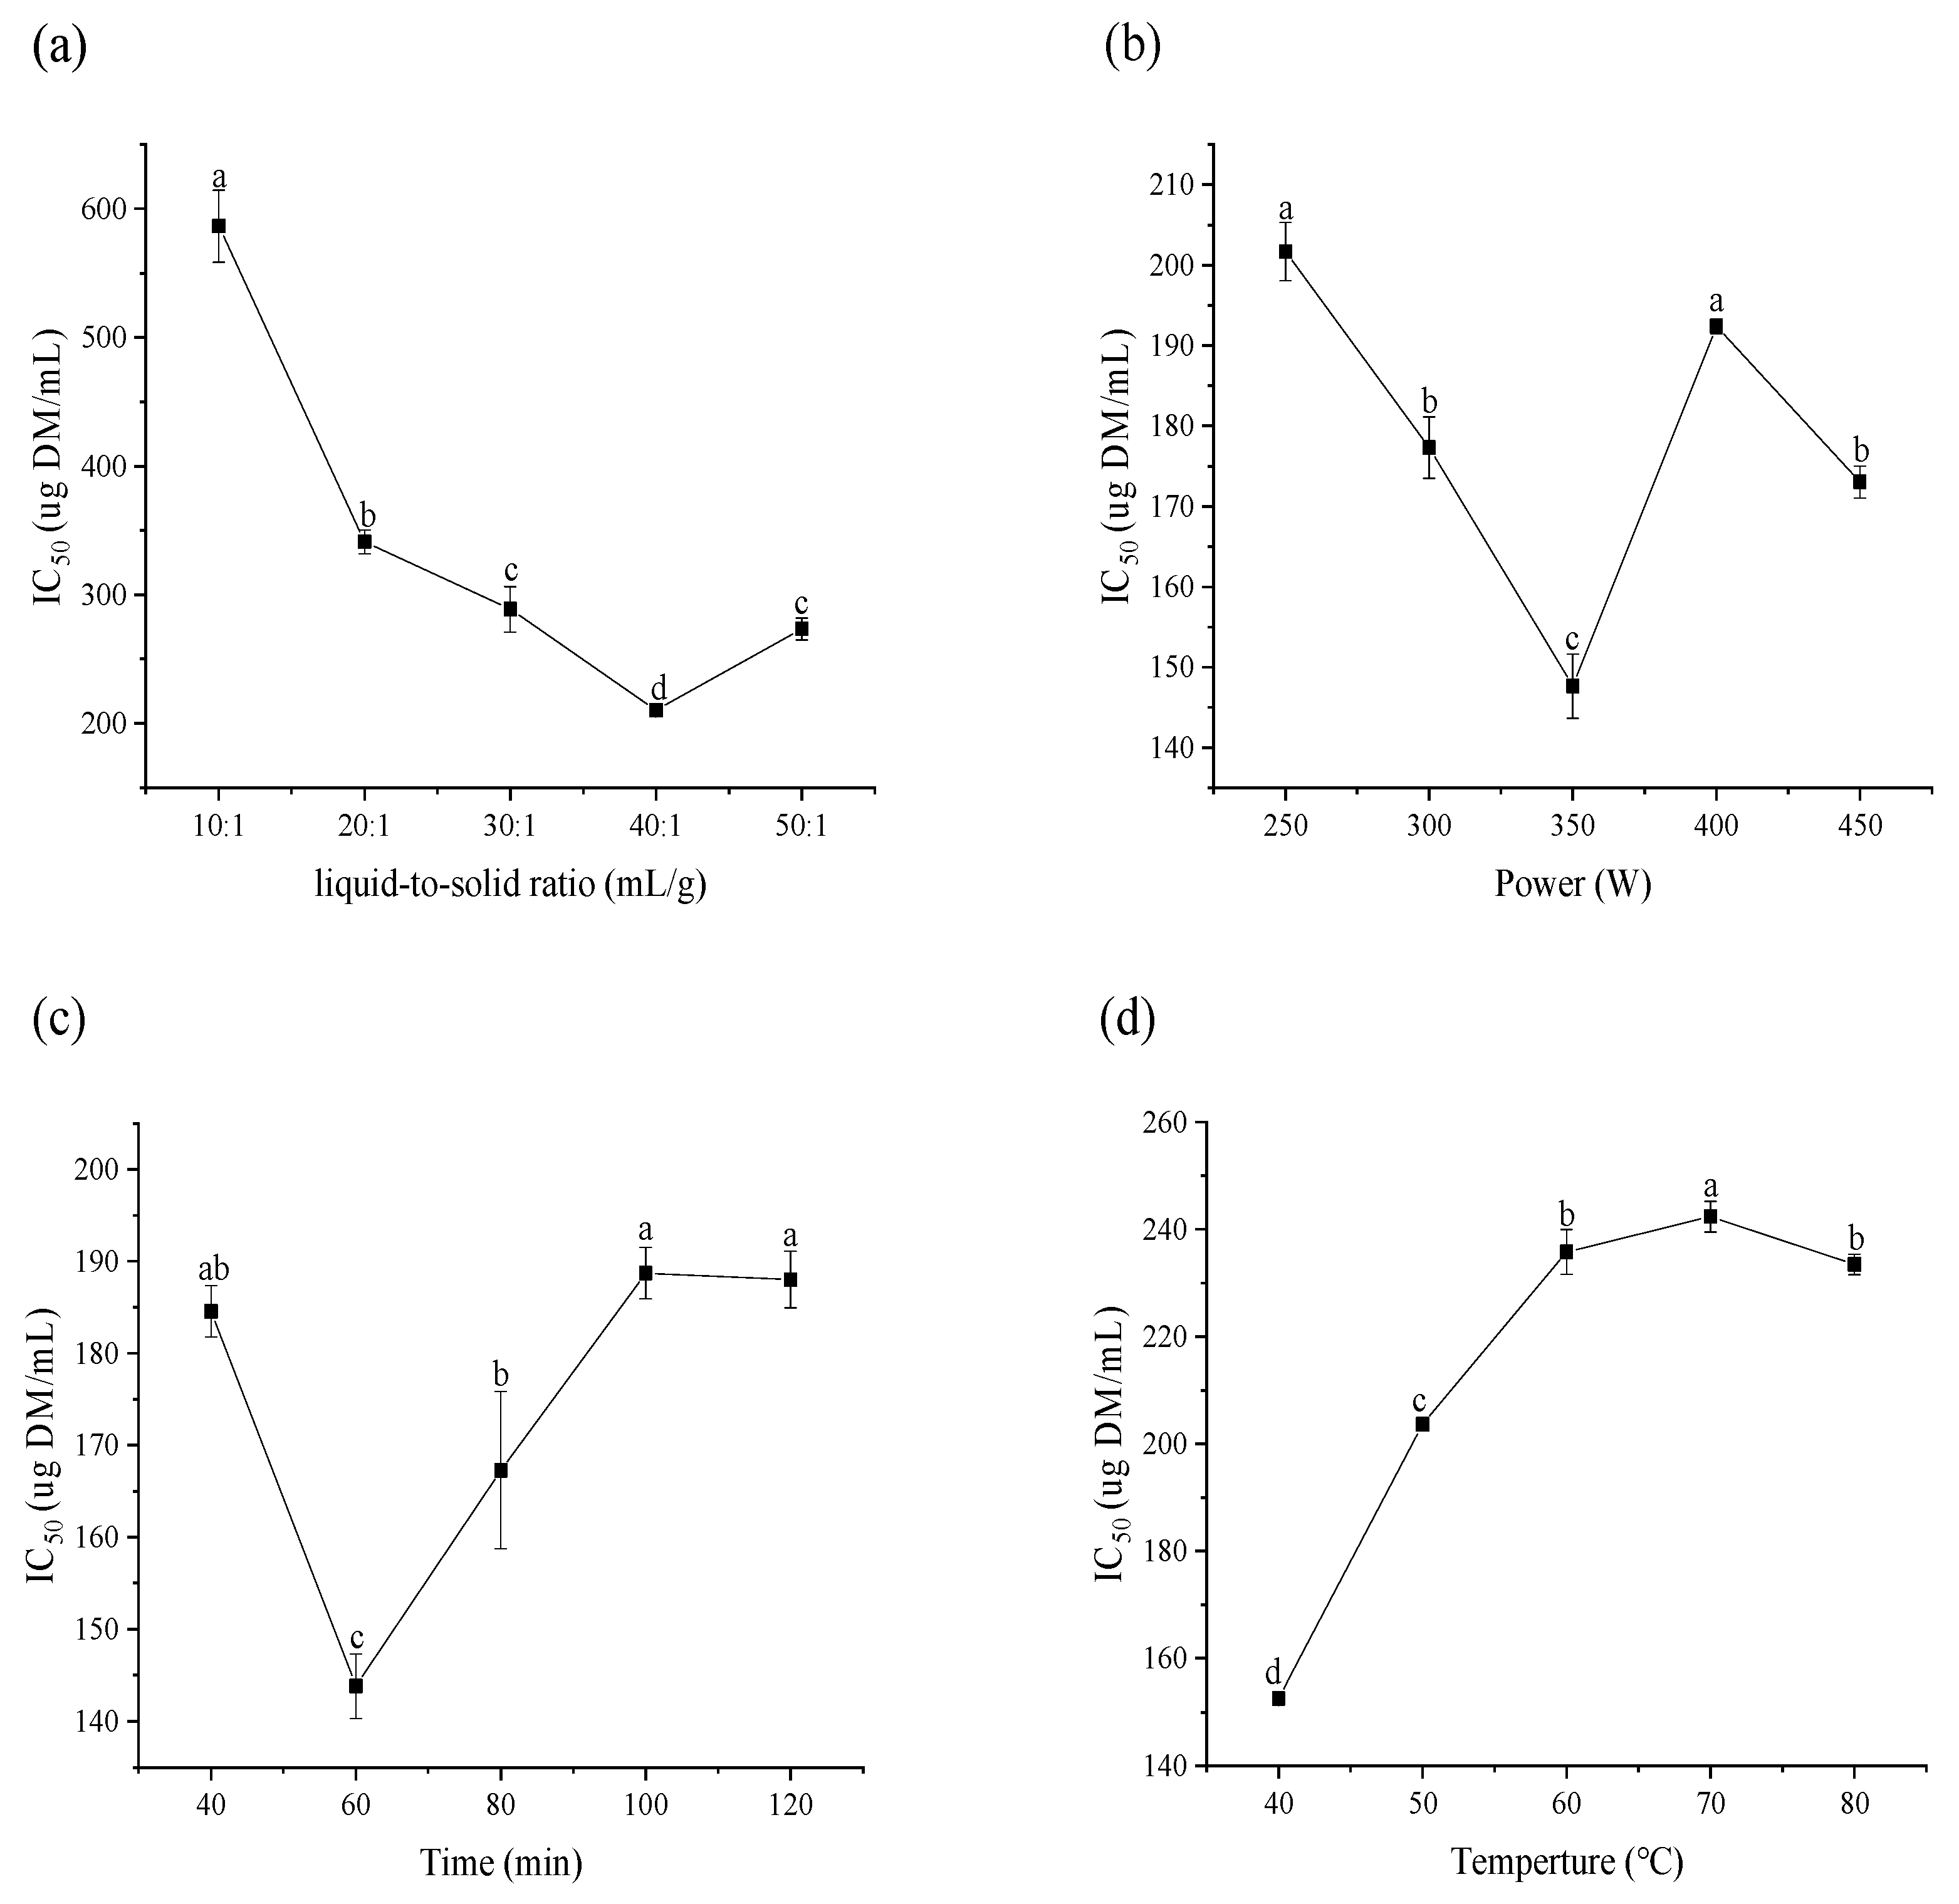
2.2. Preliminary Screening of Each Single Factor Analysis

Extraction temperature, time, ultrasound power and liquid-to-solid ratio also played an important role in the recovery of bioactive constituents. Generally, the more solvents, the higher mass transfer efficiency and extraction rate, but too many solvents cause solvent waste and increase the extraction cost [25]. As shown in Figure 2a, the IC50 value of extracts decreased with increasing liquid-to-solid ratio with the minimum value detected at 40 mL/g, but a slight increment was observed when the ratio was set at 50 mL/g. In Figure 2b, increased ultrasonic power (250–350 W) resulted in increased α-glucosidase inhibition of extracts. Further increasing ultrasonic power resulted in reduced α-glucosidase inhibition. Therefore, 350 W was considered to be the optimal ultrasound power due to the highest α-glucosidase inhibition and relatively low energy consumption. Reasonable extraction time can facilitate the contact between solvent and raw material, which is beneficial to the release of target compounds, and increase the extraction rate [26], but continuous heating is not conducive for retention of activity. As shown in Figure 2c, the sample extracted for 60 min gave the strongest α-glucosidase inhibition.
With the increase of extraction temperature from 40 °C to 70 °C, a significant increase in IC50 value was observed; the minimum α-glucosidase inhibition was detected at 70 °C (Figure 2d). Usually, a higher extraction temperature can destroy cell structure more effectively, leading to increased extraction yield [27]. However, low temperature (40 °C) is more conducive to the extraction of α-glucosidase inhibitors from CDL, therefore, 40 °C was selected as the suitable extraction temperature.

2.3. Response Surface Analysis

Based on the results of single factorial experiments, liquid-to-solid ratio, ultrasonic power, and extraction time were chosen for further RSM analysis. The experiments were performed according to Box—Behnken design (BBD), and results are presented in Table 1. The results indicate the effect of process variables on the α-glucosidase inhibition of CDL extracts. Estimated regression coefficients for the response (IC50 value) in the second order polynomial equations (Equation (1)) are as follows:
Y = 146.58 − 5.05A + 1.68B + 11.11C + 12.60A2 + 6.44B2 + 22.54C2 + 0.48AB + 8.54AC − 2.21BC
ANOVA statistics (Table 2) were generated to assess the goodness of fit, the significance of the model, coefficient of determination, and related probability values (p-value) [10]. The overall quadratic model, individual and interaction effects of liquid-to-solid ratio (mL/g), ultrasonic power (W), extraction time (min) are indicated by F and p-values. The p-value (<0.0001) showed that the model was statistically significant. At the same time, the values of R2 and Adj-R2 were 0.9798 and 0.9538, respectively, implying a strong correlation between the predicted results and actual results. Moreover, the linear effect of liquid-to-solid ratio, extraction time, and square effect of liquid-to-solid ratio, extraction power, and extraction time, were found to be significant for α-glucosidase inhibitory activity. The interaction terms of liquid-solid ratio and time have a significant effect on α-glucosidase inhibitory activity.
The interaction effects of individual process variables on dependent variable (IC50 value) were clearly studied through the pictorial representation in the form of 3D plot and 2D contour map (Figure 3). Figure 3a illustrates that there was no significant interaction between ultrasonic power and liquid-to-solid ratio. At any liquid-to-solid ratio, the α-glucosidase inhibitory activity increased with improved ultrasonic power. As revealed by Figure 3b, when the ultrasonic power was set at 350 W, the IC50 value decreased by simultaneous increase of liquid-to-solid ratio and extraction time. A higher α-glucosidase inhibition was obtained when the extraction time and liquid-solid ratio reached 53 min and 43 mL/g, respectively, which implied a significant interaction between the two parameters. In Figure 3c, within the scope of 40–54 min and 300–341 W, the inhibition ability of α-glucosidase increased with the sonication time and power increase, then decreased when beyond this range. According to the significance of regression coefficients, it was evident that extraction time was the most significant factor affecting the inhibitory activity, followed by liquid-to-solid ratio and ultrasonic power.

2.4. Optimal Extraction Conditions Analysis

To obtain the maximized response of α-glucosidase inhibition, a response optimizer tool was used to determine the optimal level of the chosen variables. The lowest IC50 value of 143.88 µg DM/mL was predicted at the optimal conditions of liquid-to-solid ratio of 43 mL/g, extraction time of 54 min, and power of 340 W. Validation experiments for the predicted optimum conditions were carried out to verify the model accuracy. However, due to the limitations of actual operating conditions, the actual parameter of each variable was adjusted to 43 (mL/g), 54 min, 350 W. The experimental IC50 value was observed to be 146.23 µg DM/mL, which fitted well (98.37%) with the predicted IC50 value. This demonstrates that the developed RSM model is practicable and can be used to describe the relationship between extraction factors and α-glucosidase suppression of CDL extracts.

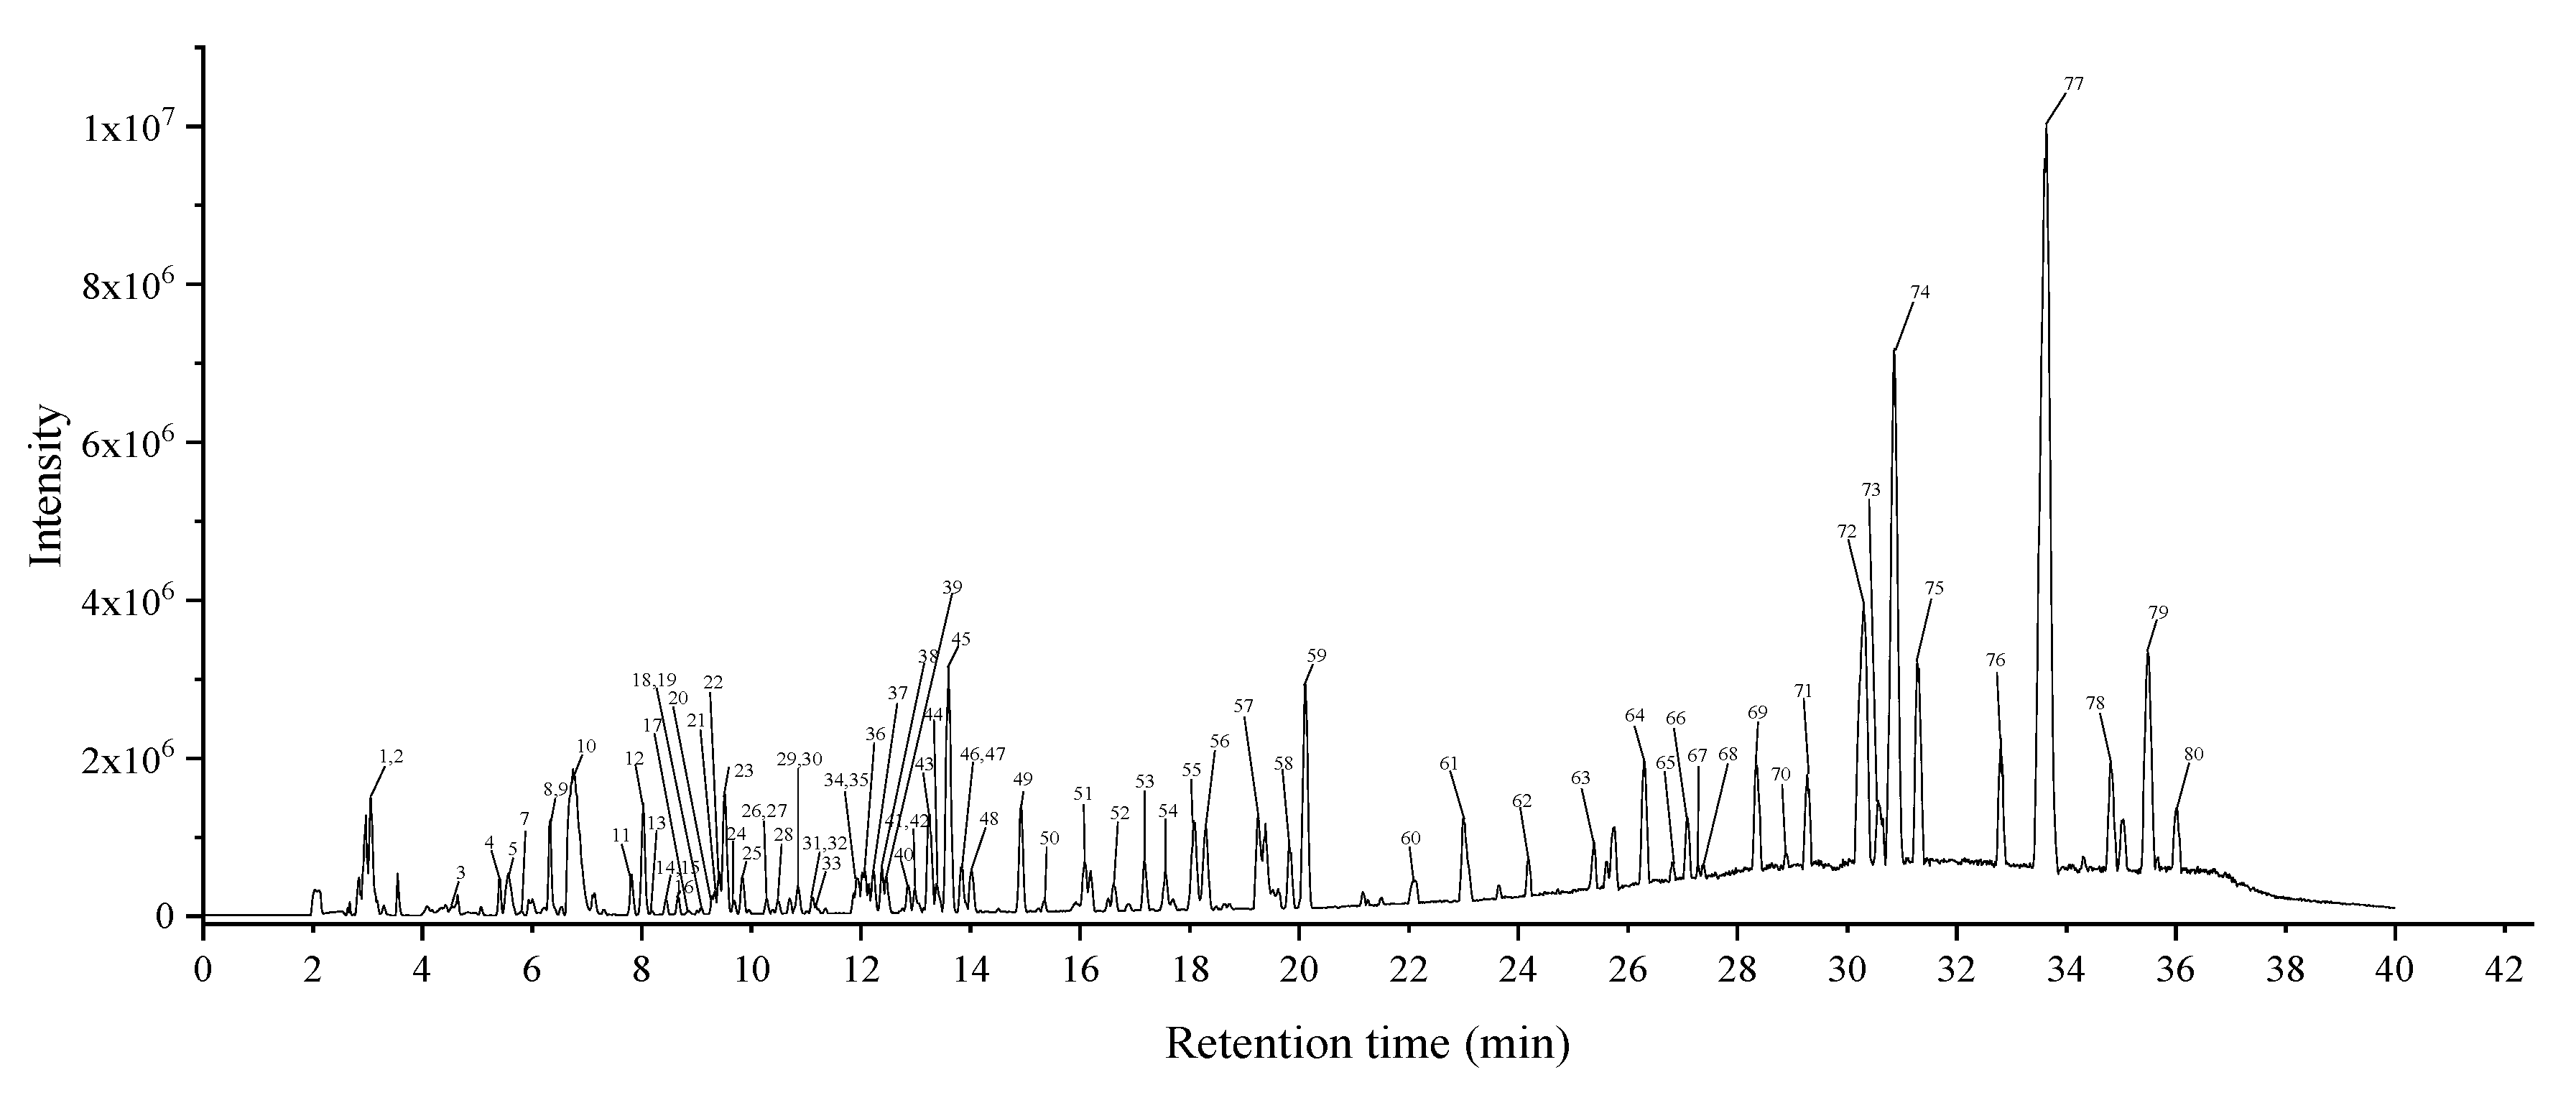
2.5. Analysis of Phytochemical Constituents

To investigate the major chemical components of the CDL extract giving the strongest α-glucosidase inhibition, HPLC-QTOF-MS/MS analysis was carried out. The base peak chromatogram (BPC) is shown in Figure 4. Identified or tentatively identified compounds are listed in Table 3; identities were confirmed by analyzing the fragmentation pattern of each deprotonated molecule, and by matching the data with that recorded in available references and databases. In total, 80 compounds were identified or tentatively identified, including 8 organic acids, 11 phenolic acids, 25 flavonoids, 21 fatty acids, and 15 other compounds.

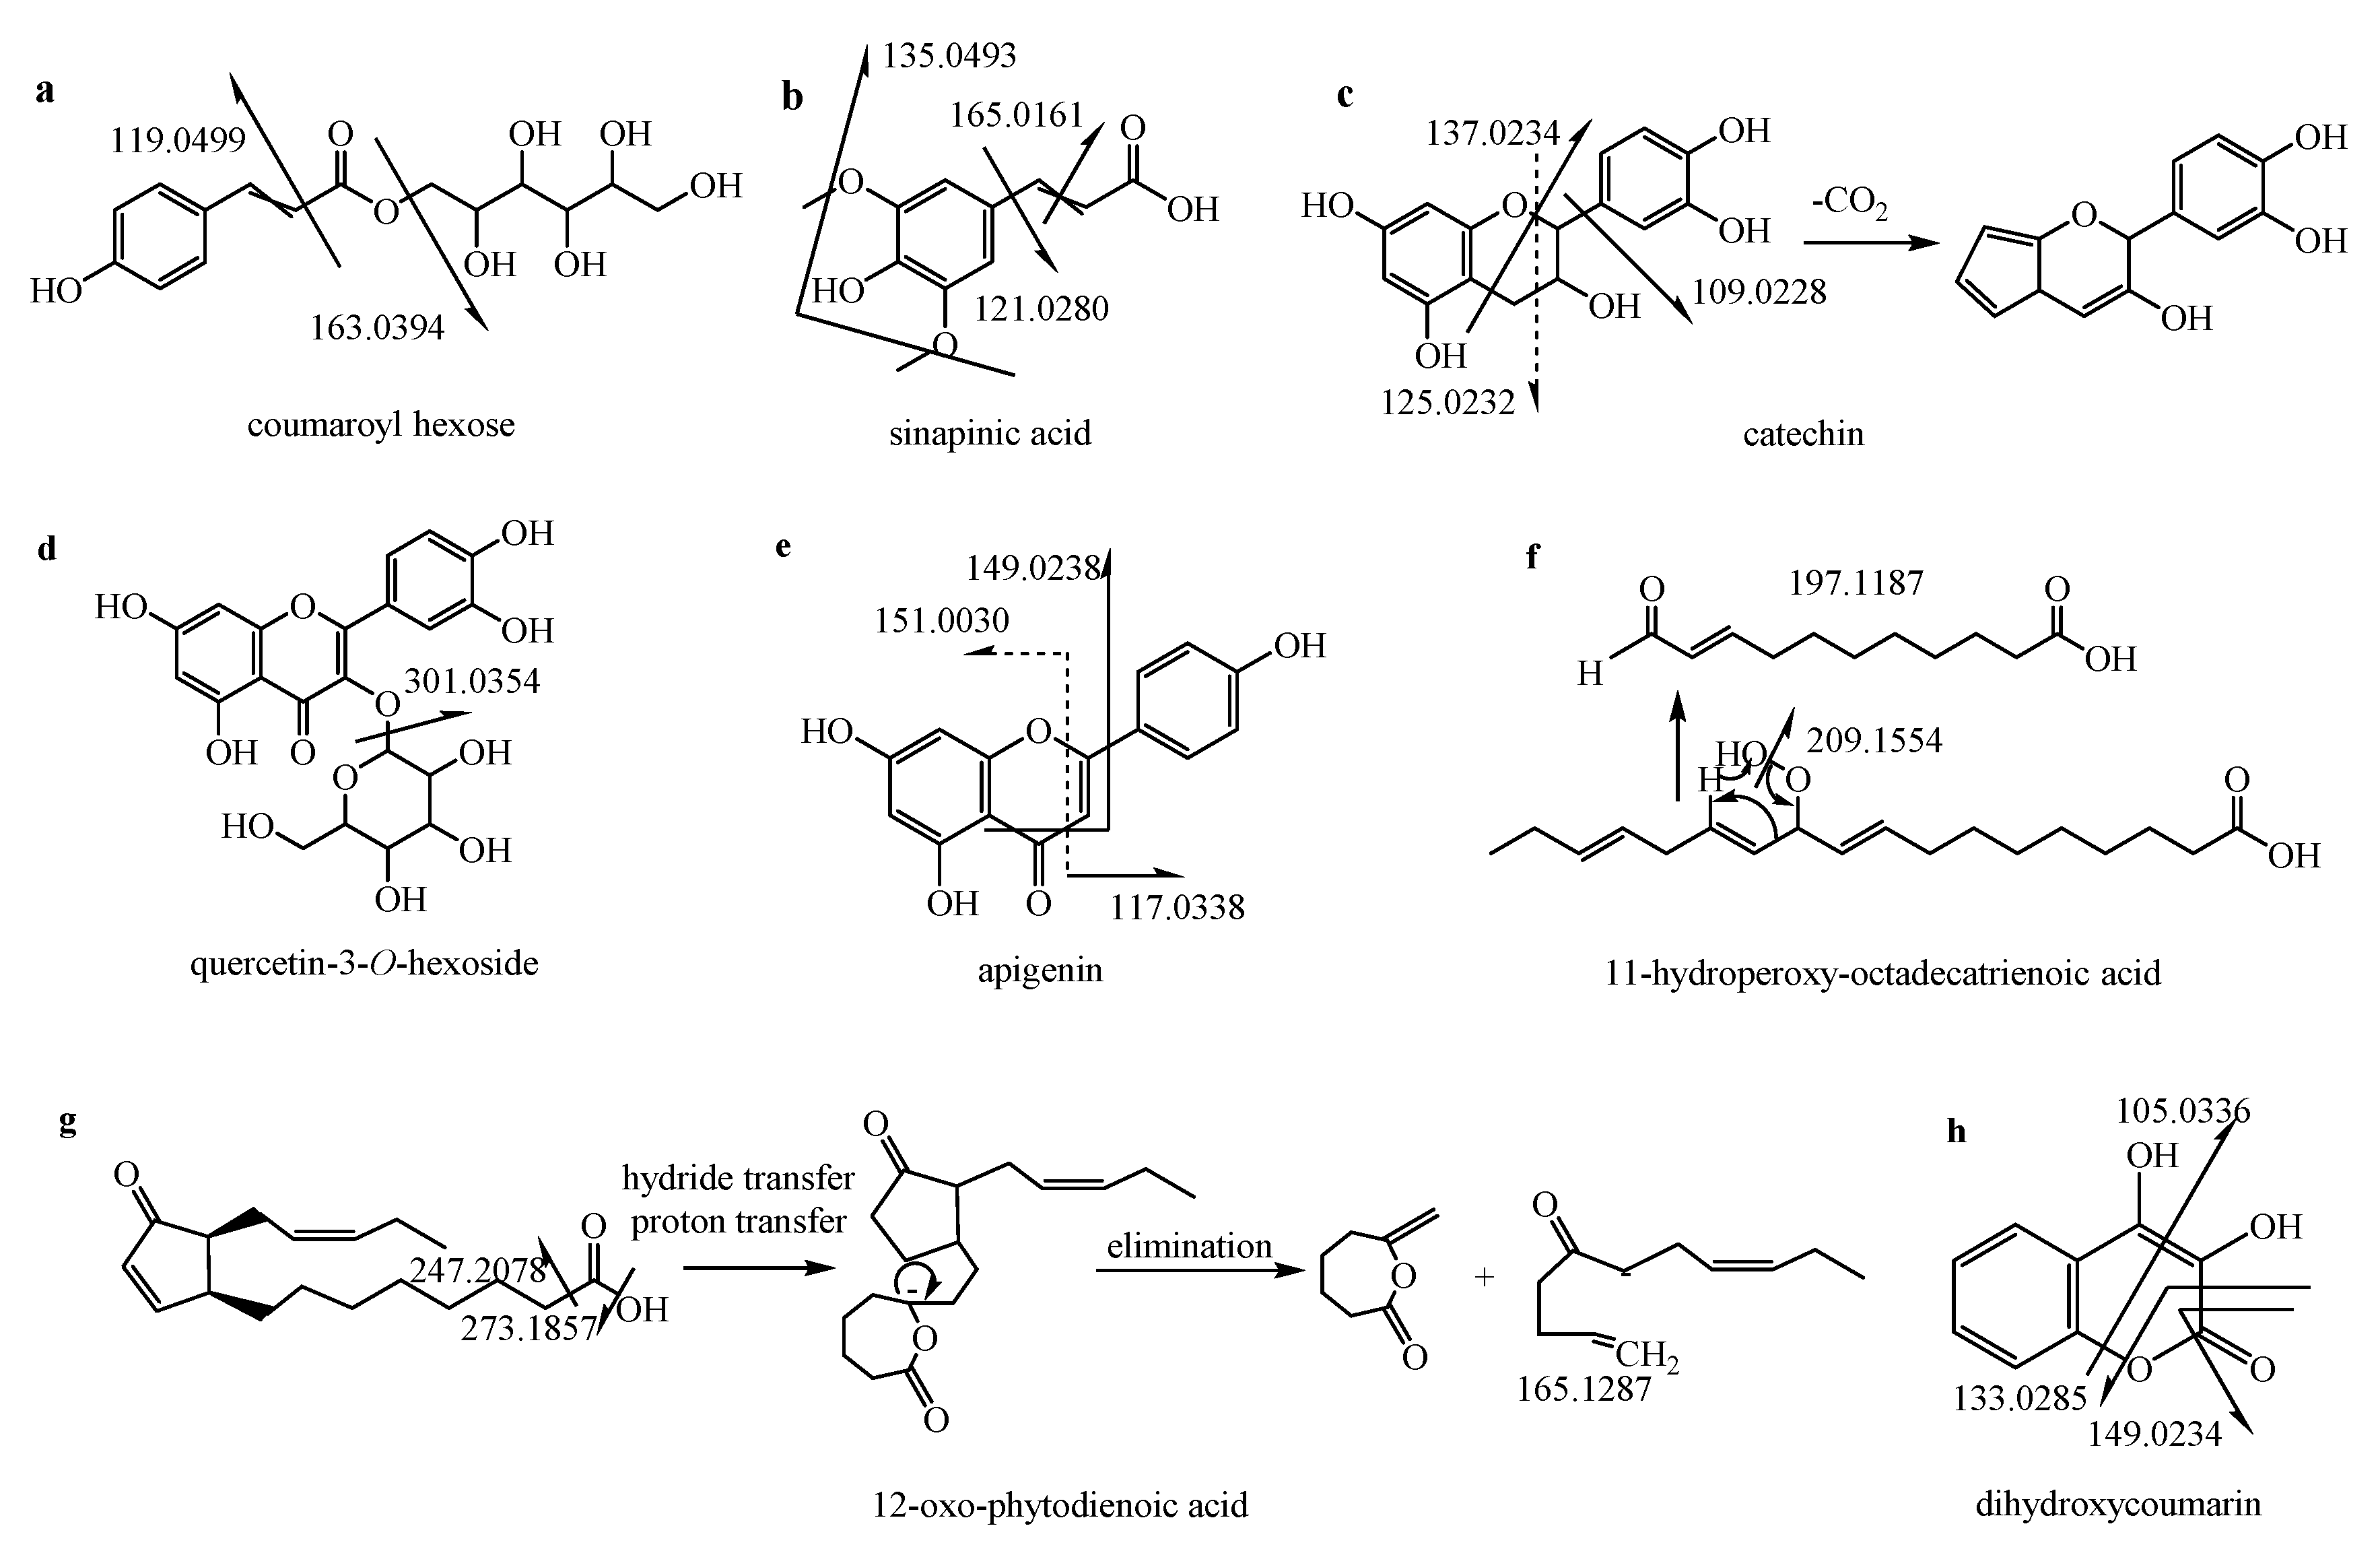
2.5.1. Organic Acids

A total of 8 organic acids were identified or tentatively identified in CDL extracts. Under negative ion mode, organic acids often show diagnostic fragment ions by losing H2O (18 Da), CO (28 Da), CO2 (44 Da), and HCOOH (46 Da). Peak 3 (195.0514, C6H12O7) was identified as gluconic acid according to reference [28]. Peaks 5, 10, 18, and 49 were individually identified as malic acid (133.0148, C4H6O5), citric acid (191.0200, C6H8O7), p-coumaric acid (163.0404, C9H8O3), and azelaic acid (187.0984, C9H16O4) due to the diagnostic MS/MS fragment ions at 115.002 [M − H − H2O], 111.0083 [M − H − CO2 − 2H2O], 119.0487 [M − H − CO2], and 125.0970 [M − H − C2H2O2], respectively [29,30]. Peaks 19, 20, and 24 (C15H18O8) showed the similar [M − H] at 325.0938 and similar fragmentation pattern, suggesting they were isomers. They were proposed as coumaroyl hexose and its isomers according to the fragment of [coumaric acid − H], [M − H − hexose − CO2], and [M − H − hexose − H2O] [31]. The detected fragmentation pattern of peak 19 is shown in Figure 5a.

2.5.2. Phenols and Derivatives

A total of 11 phenolic acids were characterized, which can be further classified into hydroxybenzoic acids and their derivatives.
Three hydroxybenzoic acid derivatives were identified. Peak 9 (329.0878, C14H18O9) was tentatively characterized as vanilloyl glucoside due to the fragment ions at m/z 167.0341 [vanillic acid − H], 152.0120 [M − H-glucose − CH3], and 123.0438 [M − H − glucose − CO2] [32]. Peaks 26 (183.0307, C8H8O5) and 42 (197.0455, C9H10O5) had similar fragment ions at 124.01 (C6H4O3), their molecular weights were 14 and 28 Da higher than gallic acid, respectively, corresponding to the augment of one and two methylene. Diagnostic MS/MS ions at 169.0138 [gallic acid − H] and 125.0235 [M − H − gallic acid − CO2] revealed the assignment of methyl gallate and ethyl gallate, respectively [6,33].
Eight hydroxycinnamic acids were identified, including caffeic acid derivatives, sinapinic acid and its derivatives, ferulic acid and its derivatives. Peaks 11 and 16 were tentatively confirmed as caffeoyl hexose (341.0884, C15H18O9) by the diagnostic MS/MS fragment ions at 179.0344 [caffeic acid − H] [32]. The fragment ions of peak 14 at 208.0322, 193.0161, and 149.0253 resulting from the loss of CH3, 2 CH3, and 2 CH3 + COOH respectively, indicating the presence of two methyl groups and one propenoic acid moiety. So it was identified as sinapinic acid [34], and the detected fragmentation pattern is given in Figure 5b. Peaks 15 and 25 gave the same parent ion ([M − H] of 385.11, C17H22O10) and product ions were identified as sinapoylglucose and its isomer [32]. MS/MS ions at 223.06, 179.07, 164.05, 149.02 resulted from the successive breakage of glucose, CO2, and CH3, and CH3. Peak 47 (193.0507, C10H10O4) with the MS/MS ions at 178.0253 [M − H − CH3], 134.0368 [M − H − CH3 − CO2], and 133.0287 [M − H − C4H4O2] was identified as ferulic acid [35]. Then peak 13 (C22H30O14) with m/z at 517.1584 was tentatively confirmed as feruloyl sucrose due to the fragment ion at 193.0506 [ferulic acid − H] [31]. Similarly, peak 23 (355.1052, C16H20O9) was identified as feruloyl glucose [32].

2.5.3. Flavonoids

In total, 25 flavonoids were found in CDL, such as quercetin, kaempferol, naringenin, apigenin, catechin, and their derivatives. Currently, tricin-7-O-β-d-glucoside, naringenin-7-O-β-d-glucoside, and apigenin-7-O-glucoside have been identified from CDL.
Apigenin, quercetin, kaempferol, naringenin, luteolin, myricetin, laricitrin, syringetin, chrysoeriol, and catechin have the typical aglycone ion (Y0-) at 269.04, 301.03, 285.04, 271.06, 285.04, 317.03, 331.05, 345.06, 299.05, and 289.07, respectively. Consequently, their derivatives will exhibit corresponding characteristic aglycone ions by losing glycoside moiety, e.g., pentosyl (132 Da), glucosyl (162 Da), hexosyl (162 Da), rhamnosyl (146 Da) or rutinosyl (308 Da). Under negative ion mode, flavonoids will exhibit typical losses of CO, CO2, C3O2, and C2H2O. Flavones are more likely to produce ions at 1,3A and 1,3B, and flavonols are easier to get fragment ions at 1,2A and 1,2B [36,37]. In addition, when the glycosidic bond is bonded to the 3-OH position of aglycone, Y0 and [Y0 − H] fragments will occur, but the intensity of [Y0 − H] is customarily higher than that of Y0 [38].
For instance, peak 17 (577.1378, C30H26O12) was tentatively identified as procyanidin dimmer due to the diagnostic ion at 289.0720 [(Epi) catechin − H] [30]. Peaks 22 and 27 with the same deprotonated ion at 289.07 and MS/MS fragment ions at 245.08 [M − H − CO2], 137.02 [1,3A], 125.02 [1,4A], and 109.02 [B-ring − H] were identified as (epi) catechin by comparing the data with those reported in reference [6]. The detected fragmentation pattern of peak 22 was shown in Figure 5c. Peaks 28, 36, and 48 with [M − H] at 463.09 were ascribed to quercetin-3-O-hexoside, the coexist of aglycone ion 301.03 and deprotonated ion 300.03 indicating the attachment of hexoside to the 3-OH [39]; the detected fragmentation pattern of peak 28 is shown in Figure 5d. Peak 32 (609.1495, C27H30O16) with fragment ion at 301.0357 resulted from the loss of rutinosyl (308 Da), thus it was identified as quercetin-3-O-rutinoside [30]. Peak 50 was identified as quercetin due to the aglycone ion at 301.0367 and MS/MS ion at 151.0027 [1,3A]. In the same way, peak 33 (593.1549, C27H30O15) was characterized as kaempferol-3-O-rutinoside due to the aglycone ion at 285.05 [30]. Peaks 41 and 46 yielded deprotonated ions at m/z 447.09 (C21H20O11), and product ions at m/z 285.05 were tentatively identified as kaempferol-3-O-hexoside [40]. Peak 51 (287.0565, C15H12O6) had two more hydrogen atoms compared with kaempferol; fragment ions at 259.0611 [M − H − CO], 151.0028 [1,3A], 125.0239 [1,4A] allowed the assignment of dihydrokaempferol. Analogously, apigenin (peak 58) and its glycosides (peaks 21, 37, 43), luteolin (peak 54) and luteolin-7-O-hexoside (peak 34), naringenin (peak 59) and its glycosides (peaks 38, 45), myricetin-3-O-hexoside (peak 30), laricitrin-3-O-hexoside (peak 35), syringetin-3-O-hexoside (peak 40), chrysoeriol-7-O-hexoside (peak 44) were proposed by matching the MS and MS/MS data with those recorded in the literature and databases [29,35,41,42]. The detected fragmentation pattern of peak 58 is shown in Figure 5e.

2.5.4. Fatty Acids

In total, 21 fatty acids were found in CDL extracts. Peaks 55 and 56 exhibited precursor ions [M-H] at m/z 327.22. Product ions at 291.19 and 229.14 resulted from the successive loss of 2H2O and 3H2O + CO2, indicating the existence of 3 hydroxy groups and one carboxyl group. Thus, they were tentatively characterized as trihydroxy octadecadienoic acid [30]. Peaks 57 and 70 (329.23, C18H34O5) were tentatively characterized as trihydroxy octadecenoic acid due to a mass difference of 2 amu with peak 55. Moreover, five isomers of hydroperoxides of octadecatrienoic acid (peaks 60, 64, 65, 66, and 68, m/z at 309.21, C18H30O4) and three isomers of hydroperoxides of octadecadienoic acid (peaks 67, 69, and 71, m/z at 311.22, C18H32O4) were found. In general, isomers can be distinguished by diagnostic ions, hydroperoxy-linoleic acid isomers with product ions at 223 [M − H − C4H6O − H2O], 183 [M − H − C7H12O2], 171 [M − H − C9H14 − H2O] or 211 [M − H − C6H12O], while hydroperoxy-linolenic acid isomers with characteristic ions at 251 [M − H − C3H5 − H2O], and 197 [M − H − C7H11 − H2O] helped to assign the position of the hydroperoxide [28]. Taking peak 65 as an example, the diagnostic fragment ion at 197.12 suggested the presence of a hydroperoxide at C11, so it was identified as 11-hydroperoxy-octadecatrienoic acid; the fragmentation pattern is shown in Figure 5f. Peaks 60, 64, and 66 with product ions at 171.10 resulted from the loss of C9H14O, indicating the hydroperoxide at C9, but this could not reveal the position of the double bonds. Peaks 67, 69, and 71 were identified as 9-hydroperoxy -octadecadienoic acid due to the MS/MS at 171.10.
Peak 72 with molecular ion at m/z 291.1980 was identified as 12-oxo-phytodienoic acid, and the fragmentation pattern is shown in Figure 5g. Its MS/MS ions at 273.1857 and 247.2078 result from the loss of a water molecule and a carboxylic residue, respectively [43]. Peak 73 (559.3142, C28H48O11) was tentatively assigned as dirhamnosyl linolenic acid, fragment ion at 277.2186 resulted from the loss of a dirhamnosyl (C10H18O9, 282 Da) [36].
In addition, five peaks with similar [M − H] at 293.21 (C18H30O3) were detected. Peaks 74 and 75 with diagnostic fragment ions at 171.1032 and 195.1387 were identified as hydroxy octadecatrienoic acid [44], while peaks 78, 79, and 80 with characteristic ions at 113.09 or 185.11 were identified as oxo-octadecadienoic acid [45]. Analogously, peak 76 (291.1977, C18H28O3) was tentatively proposed as oxo-octadecatrienoic acid [28]. Peak 77 (295.2283, C18H32O3) was proposed as 9-hydroxy-10,15-octadecadienoic acid due to the MS/MS ions at 277.2158 [M − H − H2O], 195.1387 [M − H − C6H12O], and 171.1026 [M − H − C9H16] [36].

2.5.5. Others

Another 15 compounds belonging to other category were also detected. Two saccharides (peaks 1 and 2) were tentatively identified due to the characteristic fragment ions at 179.0595 [M − H − C6H10O5] [32] and 113.0234 [M − 2H2O − CH2OH] [46]. Peak 6 (137.0247, C7H6O3) was tentatively characterized as protocatechualdehyde [30]. Peak 29 (177.0204, C9H6O4) was detected as dihydroxycoumarin [47], MS/MS ions at 149.0234, 133.0285, and 105.0336 individually corresponded to the loss of CO, CO2, and C2O3; the detected possible fragmentation pattern is given in Figure 5h. In a similar way, peaks 31 (431.1938, C20H32O10), 53 (201.1145, C10H18O4), 61 (307.1928, C18H28O4), and 62 (311.1878, C17H28O5) were tentatively identified as hydroxy-2,4,4-trimethyl-3-(3-oxobutyl)-2-cyclohexen-1-one glucoside, dibutyl oxalate, dihydrocapsiate, and dihydroartemisinin ethyl ether, respectively, by matching the MS and MS/MS data with those recorded in reference [6,30,31]. Peaks 4, 7, 8, 12, 39, 52, and 63 were not identified due to the lack of MS/MS information.

3. Material and Methods

3.1. Reagents

Acarbose, p-nitrophenyl-α-d-glucopyranoside (pNPG), α-glucosidase (yeast, EC 3.2.1.20), Folin-Ciocalteu reagent were from Sigma-Aldrich (Sigma, St. Louis, MO, USA). All other used reagents were of analytical grade and purchased from Aladdin (Shanghai, China).

3.2. Preparation of Extracts

Fresh CDL was bought in Shuyang County, Jiangshu Province, in April 2019. The CDL was dried, pulverized into powder with a high-speed disintegrator (Hangzhou, China), and sieved through a 50 mesh screen. The plant material′s moisture content was 8.2% (w/w), which was determined by measuring the weight before and after drying at 105 °C in a bake oven to a constant weight. The CDL powder was stored in a refrigerator at −20 °C until used.
Selecting a suitable solvent is very important for extracting the target product. In this research, a methanol solution was selected as the best extraction solvent after pre-experiment. The CDL powder (1 g) was suspended in 10%, 30%, 50%, 70%, and 90% methanol aqueous solution at a liquid-to-solid ratio of 20 mL/g, respectively, and then sonicated for 120 min at 50 °C, 200 W. The mixtures were centrifuged at 5000 rpm/min for 10 min, and the supernatants were collected for further analysis.

3.3. Determination of Total Phenolic and Flavonoid Content

The total flavonoid content (TFC) and total phenolic content (TPC) of different crude extracts were measured with the AlCl3 colorimetric method and the Folin—Ciocalteu method [48] with some modifications, respectively. In the experiment of measuring TFC, 0.5 mL of properly diluted sample was mixed with 100 μL of 5% NaNO2 for 6 min, followed by adding 100 μL 10% AlCl3 for 6 min, then adding 1 mL 4% NaOH and 1 mL distilled water. The mixtures were incubated at room temperature for 15 min, and 200 μL of mixtures were pipetted into a 96-well plate. The absorbance was measured at 510 nm using a microplate reader (SpectraMax M2, Molecular Devices Corp., Sunnyvale, CA, USA). In the experiment of measuring TPC, 200 μL of properly diluted sample was incubated with 100 μL of Folin—Ciocalteu reagent for 5 min, followed by adding 300 μL 20% Na2CO3 and 1 mL distilled water. The mixtures were incubated at room temperature for 30 min in the dark. After 2 min of centrifugation at 7000 rpm, 200 μL of supernatants were pipetted into a 96-well plate, and absorbance at 765 nm was read with a micro-plate reader. The TFC was expressed as mg quercetin equivalents per gram of dried material (mg QuE/g DM). The TPC was expressed as mg of gallic acid equivalents per gram of dried material (mg GAE/g DM.). All experiments were done in triplicate.

3.4. Single Factor Experiments

The liquid-to-solid ratio, ultrasonic power, extraction time, and extraction temperature were the major factors affecting the recovery of bioactive compounds from plant materials. The experiments were performed by changing the level of one factor and maintaining the other factors at a constant level of 70% methanol aqueous solvent, liquid-to-solid ratio at 40 mL/g, extraction time at 60 min, ultrasonic power at 300 W, and extraction temperature at 50 °C. Briefly, CDL was extracted with 70% methanol aqueous solvent in different liquid-to-solid ratios (from 10 to 50 mL/g) at different extraction times (from 40 to 120 min), ultrasonic powers (from 250 to 450 W), and temperatures (from 40 to 80 °C) controlled by a digitally-controlled ultrasonic bath (KQ-500DE, Kunshan ultrasonic instrument CO., LTD, Kunshan, China).

3.5. α-Glucosidase Inhibition Assay

The α-glucosidase inhibition was assessed using the method reported by reference [6]. All α-glucosidase and pNPG solutions were prepared with 0.1 M, pH 6.9 phosphate buffer. Different concentrations of samples (50 μL) and 50 μL of 0.1 U/mL α-glucosidase solution were incubated in 96-well plates at 25 °C for 10 min. Then, 50 μL of 5 mM pNPG solution was added and incubated for 15 min at 37 °C. Finally, the reaction was terminated with 100 μL of 0.2 M Na2CO3, and absorbance at 405 nm was recorded with a micro-plate reader. Acarbose was used as positive control. All experiments were done in triplicate. The concentration required to inhibit 50% activity of α-glucosidase (IC50 value) was expressed as mg dried material/mL (mg DM/mL).

3.6. Statistical Optimization of UAE

RSM with BBD was used to optimize the extraction of AGIs in CDL. As shown in Table 4, three extraction variables (ratio of material to liquid: 1:30, 1:40, and 1:50 g/mL; extraction time: 40, 60, and 80 min; ultrasonic power: 300, 350, and 400 W) were chosen to evaluate the effect on response value (α-glucosidase inhibitory ability). The response variables were fitted to the following, a second order polynomial model equation:
Y = α 0 + i = 1 k α i i X i i 2 + i k 1 j k α i j X i X j
where Y is the predicted response value (α-glucosidase inhibitory ability); Xi and Xj are independent variables; α0, αi, αii, and αij are the constant coefficient, linear coefficient, quadratic coefficient, cross-product coefficient, respectively.

3.7. HPLC-QTOF-MS/MS Analysis

For compound separation, an Agilent 1260 HPLC infinity system (Agilent, Palo Alto, CA, USA) equipped with a DAD detector, a binary pump, and a SunFire C18 column (250 × 4.60 mm, 5 μm, Waters, Milford, MA, USA) was applied. The mobile phase consisted of 0.1% formic acid in de-ionized water (A) and acetonitrile (B). The sample was eluted with a gradient from 10% B to 100% B in 35 min at a flow rate of 0.8 mL/min. The detection wavelength, column temperature, and injection volume were set at 280 nm, 35 °C, and 5 μL, respectively.
To obtain the MS and MS/MS information of detected compounds, the elutes were directly interfaced to a Hybrid Quadrupole-TOF 6600 system (AB Sciex) equipped with an electrospray ionization source (ESI). The full scan mass spectrum was detected at a mass range of m/z 100–1500 under negative ion mode. Other parameters were spray gas pressure of 50 psi, capillary voltage of 3.5 kV, ion source temperature of 550 °C, flow rate of 0.8 mL/min, and ion spray voltage floating of − 4500 V. Nitrogen and helium were used as auxiliary and collision gases, respectively. The MS data was processed by MassHunter. A molecular formula calculator was used to calculate the elemental composition of each parent and product ion. The compounds were characterized or tentatively characterized by comparing the parent ion and MS2 fragments with those in references and database.

3.8. Statistical Analysis

Statistical analyses were carried out on SPSS 17.0 (IBM, Armonk, NY, USA) and Origin 8.0 (OriginLab, Northampton, MA, USA), all data were expressed as mean ± SD (standard deviation). The statistical analysis of the proposed regression model was analyzed by Design Expert 8.0.6 (Stat-ease INC., Minneapolis, MN, USA). Significant difference among data was performed by Tukey’s-b, One-way analysis of variance (ANOVA), p < 0.05 was considered significant. The correlation between the bioactivity and content of constituents was evaluated by Pearson’s correlation analysis.

4. Conclusions

This is the first research to optimize the extraction conditions of AGIs from CDL, and to analyze the major phytochemical constituents. The optimal extraction parameters were confirmed as extraction solvent of 70% methanol, liquid-to-solid ratio of 43 (mL/g), extraction time of 54 min, ultrasonic power of 350 W, and extraction temperature of 40 °C, under which, the strongest α-glucosidase inhibition ability was achieved (IC50, 146.23 µg DM/mL). In addition, 30% and 70% methanol aqueous solutions are suitable for recovering the phenolics and flavonoids in CDL, respectively. HPLC-QTOF-MS/MS analyses permitted the identification of 80 compounds, including flavonoids, phenolic acids, fatty acids, and others. The major active compounds in CDL extract are caffeic acid derivatives, ferulic acid and its derivatives, apigenin, quercetin, kaempferol, naringenin, luteolin, and catechin and their derivatives, many of which have been reported to be promising AGIs. In addition, fatty acids with 18 carbons were also identified as the main components. This study can provide a theoretical basis for the study of CDL as a natural anti-diabetic drug, and the structure and inhibition mechanism of AGIs from CDL need further study.

Supplementary Materials

The following are available online, Table S1: Correlation analysis between bioactive compounds and α-glucosidase inhibitory activity in methanol extracts of CDL.

Author Contributions

Z.L. was in charge of literature search, figures, study design, data collection, data analysis, and writing. Z.T. and H.W. were in charge of financial support and study design. L.Z. was in charge of study design, data analysis, revision of manuscripts and financial support. All authors have read and agreed to the published version of the manuscript.

Funding

This work was supported by the National Key R&D Program of China (No. 2018YFD0901101), the Open Project Program of State Key Laboratory of Food Science and Technology, Nanchang University (No. SKLF-KF-201804), and the National Natural Science Foundation of China (No. 31860475).

Acknowledgments

Special thanks to Zhang Lu for providing support for this experiment.

Conflicts of Interest

All authors declare that there is no conflict of interest.

Abbreviations

CDLCeratophyllum demersum L
AGIsα-glucosidase inhibitors
RSMresponse surface methodology
UAEultrasonic-assisted extraction
BBDBox-Behnken design
TFCtotal flavonoid content
TPCtotal phenolic content
pNPGp-nitrophenyl-α-d-glucopyranoside
BPCbase peak chromatogram
ESIelectrospray ionization source
ANOVAone-way analysis of variance

References

  1. Leroux-Stewart, J.; Rabasa-Lhoret, R.; Chiasson, J. α-Glucosidase inhibitors. Ther. Diabetes Mellit. Relat. Disorders. 2014, 416. [Google Scholar]
  2. Kumar, V.; Prakash, O.; Kumar, S.; Narwal, S. α-glucosidase inhibitors from plants: A natural approach to treat diabetes. Pharmacogn Rev. 2011, 5, 19–29. [Google Scholar] [CrossRef] [Green Version]
  3. Razavi-Nematollahi, L.; Ismail-Beigi, F. Adverse effects of glycemia-lowering medications in type 2 diabetes. Curr. Diabetes Rep. 2019, 19, 132. [Google Scholar] [CrossRef]
  4. Zhang, L.; Tu, Z.; Yuan, T.; Wang, H.; Xie, X.; Fu, Z. Antioxidants and α-glucosidase inhibitors from Ipomoea batatas leaves identified by bioassay-guided approach and structure-activity relationships. Food Chem. 2016, 208, 61–67. [Google Scholar] [CrossRef]
  5. Zhang, L.; Tu, Z.; Yuan, T.; Ma, H.; Niesen, D.B.; Wang, H.; Seeram, N.P. New Gallotannin and other Phytochemicals from Sycamore Maple (Acer pseudoplatanus) Leaves. Nat. Prod. Commun. 2015, 10, 1977–1980. [Google Scholar] [CrossRef] [Green Version]
  6. Zhang, L.; Xu, L.; Ye, Y.; Zhu, M.; Li, J.; Tu, Z.; Yang, S.; Liao, H. Phytochemical profiles and screening of α-glucosidase inhibitors of four Acer species leaves with ultra-filtration combined with UPLC-QTOF-MS/MS. Ind. Crops Prod. 2019, 129, 156–168. [Google Scholar] [CrossRef]
  7. Wang, S.; Xie, X.; Zhang, L.; Hu, Y.; Wang, H.; Tu, Z. Inhibition mechanism of α-glucosidase inhibitors screened from Artemisia selengensis Turcz root. Ind. Crops Prod. 2020, 143, 111941. [Google Scholar] [CrossRef]
  8. Belayneh, Y.M.; Birhanu, Z.; Birru, E.M.; Getenet, G. Evaluation of in vivo antidiabetic, antidyslipidemic, and in vitro antioxidant activities of hydromethanolic root extract of Datura stramonium L.(Solanaceae). J. Exp. Med. 2019, 11, 29–38. [Google Scholar] [CrossRef] [PubMed] [Green Version]
  9. Casanova, L.M.; De Silva, D.; Sola-Penna, M.; Camargo, L.M.D.; Celestrini, D.D.; Tinoco, L.W.; Costa, S.S. Identification of chicoric acid as a hypoglycemic agent from Ocimum gratissimum leaf extract in a biomonitoring in vivo study. Fitoterapia 2014, 93, 132–141. [Google Scholar] [CrossRef] [PubMed] [Green Version]
  10. Tabaraki, R.; Nateghi, A. Optimization of ultrasonic-assisted extraction of natural antioxidants from rice bran using response surface methodology. Ultrason. Sonochem. 2011, 18, 1279–1286. [Google Scholar] [CrossRef]
  11. Camel, V. Microwave-assisted solvent extraction of environmental samples. TrAC Trends Anal. Chem. 2000, 19, 229–248. [Google Scholar] [CrossRef]
  12. Yolmeh, M.; Najafi, M.B.H.; Farhoosh, R. Optimisation of ultrasound-assisted extraction of natural pigment from annatto seeds by response surface methodology (RSM). Food Chem. 2014, 155, 319–324. [Google Scholar] [CrossRef] [PubMed]
  13. Chemat, F.; Rombaut, N.; Sicaire, A.; Meullemiestre, A.; Fabiano-Tixier, A.; Abert-Vian, M. Ultrasound assisted extraction of food and natural products. Mechanisms, techniques, combinations, protocols and applications. A review. Ultrason. Sonochem. 2017, 34, 540–560. [Google Scholar] [CrossRef]
  14. Savic Gajic, I.; Savic, I.; Boskov, I.; Žerajić, S.; Markovic, I.; Gajic, D. Optimization of ultrasound-assisted extraction of phenolic compounds from Black Locust (Robiniae Pseudoacaciae) flowers and comparison with conventional methods. Antioxidants 2019, 8, 248. [Google Scholar] [CrossRef] [PubMed] [Green Version]
  15. Ilaiyaraja, N.; Likhith, K.R.; Babu, G.R.S.; Khanum, F. Optimisation of extraction of bioactive compounds from Feronia limonia (wood apple) fruit using response surface methodology (RSM). Food Chem. 2015, 173, 348–534. [Google Scholar] [CrossRef]
  16. Benchikh, Y.; Zaoui, A.; Derbal, R.; Bey, M.B.; Louaileche, H. Optimisation of extraction conditions of phenolic compounds and antioxidant activity of Ruta chalepensis L. using response surface methodology. J. Food Meas. Charact. 2019, 13, 883–891. [Google Scholar] [CrossRef]
  17. Zerajić, S.A.; Savić-Gajić, I.M.; Savić, I.M.; Nikolić, G.S. The optimization of ultrasound-assisted extraction of total flavonoids from pot marigold (Calendulae officinalis L.) flowers. Adv. Technol. 2019, 8, 10–18. [Google Scholar] [CrossRef] [Green Version]
  18. Yang, B.; Zhang, M.; Weng, H.; Xu, Y.; Zeng, L. Optimization of ultrasound assisted extraction (UAE) of einsenoside eompound from Anoectochilus roxburghii (Wall.) Lindl by response surface methodology (RSM). Molecules 2020, 25, 193. [Google Scholar] [CrossRef] [Green Version]
  19. Taranhalli, A.D.; Kadam, A.M.; Karale, S.S.; Warke, Y.B. Evaluation of antidiarrhoeal and wound healing potentials of Ceratophyllum demersum Linn. whole plant in rats. Lat. Am. J. Pharm. 2011, 30, 297–303. [Google Scholar]
  20. Karatas, M.; Dogan, M.; Emsen, B.; Aasim, M. Determination of in vitro free radical scavenging activities of various extracts from in vitro propagated Ceratophyllum demersum L. Fresen. Environ. Bull. 2015, 24, 2946–2952. [Google Scholar]
  21. Malathy, R.; Amalan, S.S. Studies on the potential therapeutic effects on the aquatic macrophytes namely Cabomba aquatica, Ceratophyllum demersum and Hygrophila corymbosa. J. Chem. Pharm. Res. 2015, 7, 479–483. [Google Scholar]
  22. Dogan, M.; Emsen, B.; Aasim, M.; Yildirim, E. Ceratophyllum demersum L. extract as a botanical insecticide for controlling the Maize Weevil, Sitophilus zeamais Motschulsky (Coleoptera: Curculionidae). Egypt. J. Pest Control. 2017, 27, 11–15. [Google Scholar]
  23. Lu, X.; Qiao, Y.; Zhang, X.; Ma, B.; Qiu, M. Chemical constituents from Ceratophyllum demersum (Ceratophyllaceae). Aeta Bot. Yunnaniea. 2007, 29, 263–264. [Google Scholar]
  24. Bankova, V.; Ivanova, P.; Christov, R.; Popov, S.; Dimitrova-Konaklieva, S. Secondary metabolites of Ceratophyllum demersum. Hydrobiologia 1995, 316, 59–61. [Google Scholar] [CrossRef]
  25. Mohammadpour, H.; Sadrameli, S.M.; Eslami, F.; Asoodeh, A. Optimization of ultrasound-assisted extraction of Moringa peregrina oil with response surface methodology and comparison with soxhlet method. Ind. Crops Prod. 2019, 131, 106–116. [Google Scholar] [CrossRef]
  26. Tomšik, A.; Pavlić, B.; Vladić, J.; Ramić, M.; Brindza, J.; Vidović, S. Optimization of ultrasound-assisted extraction of bioactive compounds from wild garlic (Allium ursinum L.). Ultrason. Sonochem. 2016, 29, 502–511. [Google Scholar] [CrossRef]
  27. Belwal, T.; Huang, H.; Li, L.; Duan, Z.; Zhang, X.; Aalim, H.; Luo, Z. Optimization model for ultrasonic-assisted and scale-up extraction of anthocyanins from Pyrus communis Starkrimson fruit peel. Food Chem. 2019, 297, 124993. [Google Scholar] [CrossRef] [PubMed]
  28. Jiménez-Sánchez, C.; Lozano-Sánchez, J.; Rodríguez-Pérez, C.; Segura-Carretero, A.; Fernández-Gutiérrez, A. Comprehensive, untargeted, and qualitative Rp-HPLC-ESI-QTOF/MS2 metabolite profiling of green asparagus (Asparagus officinalis). J. Food Compos. Anal. 2016, 46, 78–87. [Google Scholar] [CrossRef]
  29. Luo, Y.; Wen, Q.; Lai, C.; Feng, Y.; Tan, T. Characterization of polymeric phenolic acids and flavonoids in Clerodendranthi Spicati Herba using ultrahigh-performance liquid chromatography coupled to quadrupole time-of-flight tandem mass spectrometry with target and nontarget data mining strategy. Rapid Commun. Mass Sp. 2019, 33, 1884–1893. [Google Scholar] [CrossRef]
  30. Sun, Y.; Qin, Y.; Li, H.; Peng, H.; Chen, H.; Xie, H.; Deng, Z. Rapid characterization of chemical constituents in Radix Tetrastigma, a functional herbal mixture, before and after metabolism and their antioxidant/antiproliferative activities. J. Funct. Foods. 2015, 18, 300–318. [Google Scholar] [CrossRef]
  31. Abu-Reidah, I.M.; Ali-Shtayeh, M.S.; Jamous, R.M.; Arráez-Román, D.; Segura-Carretero, A. Comprehensive metabolite profiling of Arum palaestinum (Araceae) leaves by using liquid chromatography-tandem mass spectrometry. Food Res. Int. 2015, 70, 74–86. [Google Scholar] [CrossRef]
  32. Sun, H.; Liu, J.; Zhang, A.; Zhang, Y.; Meng, X.; Han, Y.; Zhang, Y.; Wang, X. Characterization of the multiple components of Acanthopanax Senticosus stem by ultra high performance liquid chromatography with quadrupole time-of-flight tandem mass spectrometry. J. Sep. Sci. 2016, 39, 496–502. [Google Scholar] [CrossRef] [PubMed]
  33. Dong, J.; Zhu, Y.; Gao, X.; Chang, Y.; Wang, M.; Zhang, P. Qualitative and quantitative analysis of the major constituents in Chinese medicinal preparation Dan-Lou tablet by ultra high performance liquid chromatography/diode-array detector/quadrupole time-of-flight tandem mass spectrometry. J. Pharmaceut. Biomed. 2013, 80, 50–62. [Google Scholar] [CrossRef] [PubMed]
  34. Zhu, M.; Tu, Z.; Zhang, L.; Liao, H. Antioxidant, metabolic enzymes inhibitory ability of Torreya grandis kernels, and phytochemical profiling identified by HPLC-QTOF-MS/MS. J. Food Biochem. 2019, 43, e13043. [Google Scholar]
  35. Zengin, G.; Mahomoodally, M.F.; Paksoy, M.Y.; Picot-Allain, C.; Glamocilja, J.; Sokovic, M.; Diuzheva, A.; Jeko, J.; Cziaky, Z.; Rodrigues, M.J.; et al. Phytochemical characterization and bioactivities of five Apiaceae species: Natural sources for novel ingredients. Ind. Crops Prod. 2019, 135, 107–121. [Google Scholar] [CrossRef]
  36. Xie, X.; Tu, Z.; Zhang, L.; Zhao, Y.; Wang, H.; Wang, Z.; Zhang, N.; Zhong, B. Antioxidant activity, α-glucosidase inhibition, and phytochemical fingerprints of Anoectochilus roxburghii formula tea residues with HPLC-QTOF-MS/MS. J. Food Biochem. 2017, 41, e12402. [Google Scholar] [CrossRef]
  37. Fabre, N.; Rustan, I.; Hoffmann, E.; Quetin-Leclercq, J. Determination of flavone, flavonol, and flavanone aglycones by negative ion liquid chromatography electrospray ion trap mass spectrometry. J. Am. Soc. Mass Spectr. 2001, 12, 707–715. [Google Scholar] [CrossRef] [Green Version]
  38. Zhang, L.; Zhu, M.; Tu, Z.; Zhao, Y.; Wang, H.; Li, G.; Wang, H.; Sha, X. α-Glucosidase inhibition, anti-glycation and antioxidant activities of Liquidambar formosana Hance leaf, and identification of phytochemical profile. S. Afr. J. Bot. 2017, 113, 239–247. [Google Scholar] [CrossRef]
  39. Kumar, S.; Singh, A.; Kumar, B. Identification and characterization of phenolics and terpenoids from ethanolic extracts of Phyllanthus species by HPLC-ESI-QTOF-MS/MS. J. Pharm. Anal. 2017, 7, 214–222. [Google Scholar] [CrossRef]
  40. Zhang, L.; Tu, Z.; Wang, H.; Fu, Z.; Wen, Q.; Fan, D. Metabolic profiling of antioxidants constituents in Artemisia selengensis leaves. Food Chem. 2015, 186, 123–132. [Google Scholar] [CrossRef]
  41. Zhu, H.; Yin, R.; Han, F.; Guan, J.; Zhang, X.; Mao, X.; Zhao, L.; Li, Q.; Hou, X.; Bi, K. Characterization of chemical constituents in Zhi-Zi-Da-Huang decoction by ultra high performance liquid chromatography coupled with quadrupole time-of-flight mass spectrometry. J. Sep. Sci. 2014, 37, 3489–3496. [Google Scholar] [CrossRef] [PubMed]
  42. Meng, J.; Xu, T.; Qin, M.; Zhuang, X.; Fang, Y.; Zhang, Z. Phenolic characterization of young wines made from spine grape (Vitis davidii Foex) grown in Chongyi County (China). Food Res. Int. 2012, 49, 664–671. [Google Scholar] [CrossRef]
  43. Bao, J.; Gao, X.; Jones, A.D. Unusual negative charge-directed fragmentation: Collision-induced dissociation of cyclopentenone oxylipins in negative ion mode. Rapid Commun. Mass Sp. 2014, 28, 457–464. [Google Scholar] [CrossRef] [PubMed]
  44. Ludovici, M.; Ialongo, C.; Reverberi, M.; Beccaccioli, M.; Scarpari, M.; Scala, V. Quantitative profiling of oxylipins through comprehensive LC-MS/MS analysis of Fusarium verticillioides and maize kernels. Food Addit. Contam. Part. A. 2014, 31, 2026–2033. [Google Scholar] [CrossRef] [PubMed]
  45. Strassburg, K.; Huijbrechts, A.M.L.; Kortekaas, K.A.; Lindeman, J.H.; Pedersen, T.L.; Dane, A.; Berger, R.; Brenkman, A.; Hankemeier, T.; Duynhoven, J.; et al. Quantitative profiling of oxylipins through comprehensive LC-MS/MS analysis: Application in cardiac surgery. Anal. Bioanal. Chem. 2012, 404, 1413–1426. [Google Scholar] [CrossRef] [PubMed] [Green Version]
  46. Liu, M.; Tong, X.; Wang, J.; Zou, W.; Cao, H.; Su, W. Rapid separation and identification of multiple constituents in traditional Chinese medicine formula Shenqi Fuzheng Injection by ultra-fast liquid chromatography combined with quadrupole-time-of-flight mass spectrometry. J. Pharmaceut. Biomed. 2013, 74, 141–155. [Google Scholar] [CrossRef]
  47. Ammar, S.; Contreras, M.D.; Belguith-Hadrich, O.; Segura-Carretero, A.; Bouaziz, M. Assessment of the distribution of phenolic compounds and contribution to the antioxidant activity in Tunisian fig leaves, fruits, skins and pulps using mass spectrometry-based analysis. Food Funct. 2015, 6, 3663–3677. [Google Scholar] [CrossRef]
  48. Zhang, L.; Tu, Z.; Xie, X.; Lu, Y.; Wang, Z.; Wang, H.; Sha, X. Antihyperglycemic, antioxidant activities of two Acer palmatum cultivars, and identification of phenolics profile by UPLC-QTOF-MS/MS: New natural sources of functional constituents. Ind. Crops Prod. 2016, 89, 522–532. [Google Scholar] [CrossRef]
Sample Availability: Samples of the compounds are not available from the authors.
Figure 1. α-Glucosidase inhibition (a), total phenolic and total flavonoid content (b), of Ceratophyllum demersum L. (CDL) extracts prepared with different concentrations of methanol aqueous solvent.
Molecules 25 04507 g001
Figure 2. Effects of liquid-to-solid ratio (a), ultrasonic power (b), extraction time (c), extraction temperature (d), on the α-glucosidase inhibitory ability (IC50) of CDL extracts.
Molecules 25 04507 g002
Figure 3. 3D surface plot and contour map showing the interaction effects of (a) liquid-to-solid ratio and power, (b) liquid-to-solid ratio and time, (c) time and power on IC50.
Molecules 25 04507 g003
Figure 4. The base peak chromatogram of CDL extract under negative mode.
Molecules 25 04507 g004
Figure 5. Possible fragmentation pattern of coumaroyl hexose (a), sinapinic acid (b), catechin (c), quercetin-3-O-hexoside (d), apigenin (e), 11-hydroperoxy octadecatrienoic acid (f), 12-oxo-phytodienoic acid (g), and dihydroxycoumarin (h).
Molecules 25 04507 g005
Table 1. Box—Behnken design for extraction of α-glucosidase inhibitors (AGIs) from CDL by ultrasonic-assisted extraction (UAE) with the observed responses.
Std noA: Liquid-to-Solid Ratio (mL/g)B: Power (W)C: Time (min)Response: IC50 (µg DM/mL)
140:130040159.20
230:135040182.30
340:135080189.97
440:135060149.14
550:130060160.40
630:140060169.88
740:140040172.22
850:140060159.50
940:135060146.90
1030:130060172.71
1150:135080198.20
1240:140080187.48
1350:135040156.40
1440:135060148.13
1540:135060142.26
1640:130080183.31
1740:135060146.47
Table 2. ANOVA statistics for the α-glucosidase inhibitory activity of extracts.
SourceSum of SquaresdfMean SquareF Valuep-Value Prob > FSignificance
Model4764.629529.4037.69<0.0001**
A-liquid-to-solid ratio203.741203.7414.500.0066**
B-Power22.65122.651.610.2447
C-Time986.781986.7870.25<0.0001**
A2668.941668.9447.620.0002**
B2174.451174.4512.420.0097**
C22138.4712138.47152.25<0.0001**
AB0.9410.940.0670.8034
AC291.451291.4520.750.0026**
BC19.55119.551.390.2767
Residual98.32714.05
Lack of Fit70.57323.523.390.1345
Pure Error27.7546.94
Total4862.9416
R2 = 0.9798 R2Adj = 0.9538
Note: ** indicates significant difference at 0.01 level.
Table 3. The identified or tentatively identified compounds in 70% methanol extract of CDL by HPLC-QTOF-MS/MS under negative ion mode.
No.Rt (min)Found at m/zExpected at m/zError (ppm)Molecular FormulaMS/MSProposed Compounds
Organic acids
34.53195.0514195.05101.9C6H12O7-Gluconic acid
55.57133.0148133.01424.2C4H6O5115.002[M − H − H2O]Malic acid
106.75191.0200191.01971.4C6H8O7111.0083[M − H − CO2 − 2H2O]Citric acid
189.07163.0404163.04012.2C9H8O3119.0487[M − H − CO2] p-Coumaric acid
199.08325.0937325.09380.3C15H18O8163.0394[M − H − hexose], 119.0499[M − H − hexose − CO2]Coumaroyl hexose
209.32325.0939325.0942−0.8C15H18O8145.0927[M − H − hexose − H2O], 117.0342[M − H − hexose − H2O − CO]Coumaroyl hexose
249.69325.0941325.09390.7C15H18O8145.0927[M − H − hexose − H2O], 117.0342[M − H − hexose − H2O − CO]Coumaroyl hexose
4914.92187.0984187.09821.0C9H16O4125.0970[M − H − C2H2O2]Azelaic acid
Phenols acids and derivatives
96.31329.0879329.08780.3C14H18O9167.0341[M − H − glucose], 152.0120[M − H − C7H13O5], 123.0438[M − H − C7H10O7], 108.0210[M − H − C8H13O7]Vanilloyl glucoside
117.81341.0884341.08830.4C15H18O9179.0344[M − H − hexose], 161.0244[M − H − C6H12O6], 133.0293[M − H − C7H12O7], Caffeoyl-hexose
138.18517.1584517.15634.2C22H30O14193.0506[ferulic acid − H]Feruloyl sucrose
148.44223.0621223.06124.2C11H12O5208.0322[M − H − CH3],
193.0122[M − H − CH2O],
165.0175[M − H − C2H2COOH], 135.0440[M − H − C3H4O3], 121.0298[M − H − C4H6O3]
Sinapinic acid
158.44385.1159385.11404.8C17H22O10223.0606[M − H − glucose], 208.0365[M − H − C7H13O5],
193.0154[M − H − C8H16O5], 179.0714[M − H − C7H10O7],
164.0476[M − H − C8H13O7], 149.0235[M − H − C9H16O7]
Sinapoylglucose
168.66341.0886341.08811.1C15H18O9179.0354[M − H − hexose], 135.0449[M − H − C7H10O7]Caffeoyl hexose
239.51355.1052355.1035−0.2C16H20O9193.0511[M − glucose], 178.0272[M − H − C7H13O5], 149.0606[M − H − C7H10O7], 134.0372[M − H − C8H13O7]Feruloyl glucose
259.84385.1158385.11404.7C17H22O10223.0606[M − H − glucose], 208.0365[M − H − C7H13O5],
193.0154[M − H − C8H16O5], 179.0714[M − H − C7H10O7],
164.0476[M − H − C8H13O7], 149.0235[M − H − C9H16O7]
Sinapoylglucose
2610.28183.0307183.02994.3C8H8O5124.0158[M − H − C2H3O2]Methyl gallate
4213.05197.0465197.04555.0C9H10O5169.0138[M − H − C2H4], 125.0235[M − H − C3H4O2], 124.0163[M − H − C3H5O2]Ethyl gallate
4713.84193.0507193.05060.3C10H10O4178.0253[M − H − CH3], 134.0368[M − H − CH3 − CO2], 133.0287[M − H − C4H4O2]Ferulic acid
Flavonoids
178.85577.1378577.13154.7C30H26O12289.0720[(Epi) catechin − H]Procyanidin dimmer
219.32401.1471401.14534.5C18H26O10355.1037[M − H − H2O − CO], 269.1040[apigenin − H], 223.0582[M − H − C7H14O5], 161.0448[M − H − C9H20O7],Apigenin pentose
229.41289.0724289.07182.3C15H14O6245.0782[M − H − CO2], 137.0234[M − H − C8H8O3],
125.0232[M − H − C9H8O3], 109.0228[B-ring − H]
(Epi)catechin
2710.28289.0722289.07181.7C15H14O6245.0782[M − H − CO2], 137.0234[M − H − C8H8O3],
125.0232[M − H − C9H8O3],
109.0228[B-ring − H]
(Epi)catechin
2810.50463.0900463.08980.5C21H20O12463.0898[M − H],
301.0354[M − H − hexose], 300.0280[M − H − C6H11O5]
Quercetin-3-O-hexoside
3010.85479.0842479.08312.2C21H20O13259.0262[M − H − C8H12O7]Myricetin-3-O-hexoside
3211.12609.1495609.14900.5C27H30O16301.0357[M − H − rutinose]Quercetin-3-O-rutinoside
3311.14593.1549593.15460.5C27H30O15285.0411[M − H − rutinose], 284.0320[M − H − C12H21O9], 151.0027[M − H − rutinose − C8H5O]Kaempferol-3-O-rutinoside
3411.93447.0960447.0959−0.1C21H20O11447.0963[M − H],
285.0419[M − H − hexose], 284.0336[M − H − C6H11O5]
Luteolin-7-O-hexoside
3511.93493.1007493.09883.9C22H22O13331.0465[M − H − hexose], 315.0157[M − H − C6H10O6]Laricitrin-3-O-hexoside
3612.05463.0901463.08980.5C21H20O12301.0363[M − H − hexose], 300.0282[M − H − C6H11O5]Quercetin-3-O-hexoside
3712.23577.1621577.16210.0C27H30O14269.0459[M − H − rutinose], 268.0375[M − H − C12H21O9]Apigenin-7-O-rutinoside
3812.38579.1751579.17431,4C27H32O14271.0622[M − H − C12H20O9], 151.0035[M − H − C20H28O10]Naringin
4012.86507.1174507.1176−0.4C23H24O13345.0619[M − H − hexose], 344.0553[M − H − C6H11O5], 329.0309[M − H − C6H10O6], 273.0416[M − H − C8H10O8] Syringetin-3-O-hexoside
4112.98447.0951447.0953−0.4C21H20O11285.0481[M − H − hexose], 284.0339[M − H − C6H11O5], 227.0361[M − H − C8H12O7]Kaempferol-3-O-hexoside
4313.25431.1000431.09803.7C21H20O10431.0983[M − H],
269.0463[M − H − glucose], 268.0388[M − H − C6H11O5]
Apigenin-7-O-glucoside
4413.38461.1095461.10891.2C22H22O11446.0876[M − H − CH3], 299.0553[M − H − hexoside], 298.0487[M − H − C6H11O5], 283.0249[M − H − C6H10O6], 255.0305[M − H − C8H10O7] Chrysoeriol-O-hexoside
4513.60433.1157433.11403.8C21H22O10271.0622[M − H − glucose], 151.0029[M − H − C14H18O6], 119.0493[M − H − C13H14O9]Naringenin-7-O-glucoside
4613.84477.0959477.0960−0.1C21H20O11285.0412[M − H − hexoside]Kaempferol-3-O-hexoside
4814.02463.0918463.09082.2C21H20O12301.0363[M − H − hexoside]Quercetin-3-O-hexoside
5015.34301.0367301.03544.6C15H10O7301.0363[M − H], 151.0027[M − H − C8H8O3], 149.0240[M − H − C8H10O3]Quercetin
5116.08287.0565287.05611.2C15H12O6259.0611[M − H − CO], 177.0553[M − H − C5H4O3], 151.0028[M − H − C8H8O2], 125.0239[M − H − C9H6O3]Dihydrokaempferol
5417.56285.0417285.04150.8C15H10O6285.0414[M − H],
175.0400[M − H − C5H2O3], 151.0030[M − H − C8H6O2], 133.0297[M − H − C7H4O4],
Luteolin
5819.82269.0466269.04564.0C15H10O5269.0455[M − H],
151.0030[M − H − C8H6O], 149.0238[M − H − C7H4O2], 117.0338[M − H − C7H4O4]
Apigenin
5920.11271.0624271.06124.5C15H12O5151.0030[M − H − C8H8O], 119.0499[M − H − C7H4O4] Naringenin
Fatty acids
5518.08327.2186327.2183−1.3C18H32O5291.1957[M − H − 2H2O],
229.1442[M − H − 3H2O − CO2], 171.1030[M − H − C8H12O3]
Trihydroxy octadecadienoic acid
5618.29327.2177327.21814.5C18H32O5291.1971[M − H − 2H2O], 229.1442[M − H − 3H2O − CO2],
171.1032[M − H − C8H12O3]
Trihydroxy octadecadienoic acid
5719.25329.2353329.23510.7C18H34O5211.1345[M − H − C6H14O2], 171.1029[M − H − C8H14O3]Trihydroxy octadecenoic acid
6022.09309.2075309.20711.2C18H30O4291.1973[M − H − H2O], 265.2159[M − H − C3H8],
171.1018[M − H − C9H14O]
Hydroxy octadecatrienoic acid
6426.29309.2075309.20711.2C18H30O4291.1973[M − H − H2O], 185.1188[M − H − C8H12O], 171.1031[M − H − C9H14O]Hydroxy octadecatrienoic acid
6526.80309.2077309.20711.8C18H30O4209.1554[M − H − C6H12O], 197.1187[M − H − C7H12O]11-Hydroperoxy octadecatrienoic acid
6627.08309.2083309.20714.0C18H30O4291.1962[M − H − H2O], 185.1183[M − H − C8H12O], 171.1028[M − H − C9H14O]Hydroxy octadecatrienoic acid
6727.27311.2240311.22283.8C18H32O4293.2107[M − H − H2O], 185.1172[M − H − C8H14O], 171.1023[M − H − C9H16O]9-Hydroperoxy-octadecadienoic acid
6827.37309.2086309.20714.6C18H30O4211.1333[M − H − C6H12O], 197.1180[M − H − C7H11 − H2O] 11-Hydroperoxy octadecatrienoic acid
6928.35311.2241311.22284.1C18H32O4293.2138[M − H − H2O], 185.1181[M − H − C8H14O], 171.1030[M − H − C9H16O]9-Hydroperoxy-octadecadienoic acid
7028.89329.2234329.23330.3C18H34O5211.1351[M − H − C6H14O2], 171.1025[M − H − C8H14O3]Trihydroxy octadecenoic acid
7129.27311.2239311.22283.6C18H32O4293.2133[M − H − H2O], 185.1183[M − H − C8H14O], 171.1029[M − H − C9H16O]9-Hydroperoxy-octadecadienoic acid
7230.29291.1980291.19665.0C18H28O3273.1857[M − H − H2O], 247.2078[M − H − H2O − CO2]12-Oxo-phytodienoic acid
7330.56559.3142559.31243.3C28H48O11277.2186[M − H − C10H18O9]Dirhamosyl linolenic acid
7430.85293.2135293.21224.3C18H30O3275.2031[M − H − H2O], 183.1390[M − H − C7H10O], 171.1032[M − H − C9H14], Hydroxy octadecatrienoic acid
7531.29293.2135293.21224.3C18H30O3275.2016[M − H − H2O], 223.1335[M − H − C5H10], 195.1387[M − H − C6H10O]Hydroxy octadecatrienoic acid
7632.80291.1977291.19664.0C18H28O3211.1334[M − H − C6H8], 197.1183[M − H − C7H10], 185.1177[M − H − C8H10], Oxo-octadecatrienoic acid
7733.62295.2283295.22791.5C18H32O3277.2158[M − H − H2O], 195.1387[M − H − C6H12O], 171.1026[M − H − C9H16]9-Hydroxy-10, 12-octadecadienoic acid
Hydroxy octadecadienoic acid
7834.81293.2135293.21224.3C18H30O3249.2215[M − H − CO2], 195.1385[M − H − C6H10O], 179.1071[M − H − C6H10O2], 113.0965[M − H − C11H16O2]Oxo-octadecadienoic acid
7935.48293.3133293.21223.6C18H30O3185.1179[M − H − C8H12], 125.0961[M − H − C9H12O3]Oxo-octadecadienoic acid
8036.00293.2123293.21220.2C18H30O3185.1157[M − H − C8H12], 125.0963[M − H − C9H12O3]Oxo-octadecadienoic acid
Others
13.06341.1101341.10893.4C12H22O11179.0595[M − H − C6H10O5], 161.0470[M − H − C6H12O6], 113.0229[M − H − C7H16O8]Sucrose
23.06179.0566179.05612.6C6H12O6113.0234[M − 2H2O − CH2OH], Monose
45.40305.1598305.1606−2.6C14H26O7175.0250, 161.0230, 133.0296Unidentified
65.80137.0247137.02442.0C7H6O3-Protocatechualdehyde
75.80299.0783299.07723.5C13H16O7137.0270Unidentified
86.31305.1616305.16063.4C14H26O7289.1306, 272.1043, 247.1083, 148.0521, 134.0375Unidentified
128.02391.0828391.08231.3C22H16O7193.0513, 178.0272, 149.0605, 134.0374Unidentified
2910.85177.0204177.02011.8C9H6O4177.0180[M − H], 149.0234[M − H − CO], 133.0285[M − H − CO2], 105.0336[M − H − C2O3]Dihydroxycoumarin
3111.12431.1938431.19350.6C20H32O10385.1837, 223.1382, 205.1203, 163.1131, 119.0333, 113.0281, 101.0234Hydroxy-2,4,4-trimethyl-3-(3-oxobutyl)-2-cyclohexen-1-one glucoside
3912.46723.5092723.50890.4C41H72O10677.5014, 659.4905, 550.4370, 451.3300, 433.316, 367.2732, 341.2932, 309.2213, 225.1609, 207.1497, 143.0814, 125.0709, Unidentified
5216.62193.0513193.05082.4C10H10O4161.0244, 133.0296Unidentified
5317.18201.1145201.11440.2C10H18O4183.1026[M − H − H2O], 139.1128[M − H − H2O − CO2]Dibutyl oxalate
6123.00307.1928307.19154.4C18H28O4235.1346[M − H − C5H12], 211.1343, 185.1188, 137.0966Dihydrocapsiate
6224.18311.1878311.1878−0.2C17H28O5293.1750[M − H − H2O], 267.1966[M − H − CO2] Dihydroartemisinin ethyl ether
6325.37305.1770305.17584.0C18H26O4249.1499, 135.0809Unidentified
Table 4. Independent variables and their levels used for Box—Behnken design.
FactorsCoded SymbolsLevels
− 101
Liquid-to-solid ratio (mL/g)X1304050
Power (W)X2406080
Time (min)X3300350400

