Article

Potential of Thai Herbal Extracts on Lung Cancer Treatment by Inducing Apoptosis and Synergizing Chemotherapy

by
Juthathip Poofery
1,
Patompong Khaw-on
1,
Subhawat Subhawa
1,
Bungorn Sripanidkulchai
2,
Apichat Tantraworasin
3,4,
Somcharoen Saeteng
4,
Sopon Siwachat
4,
Nirush Lertprasertsuke
5 and
Ratana Banjerdpongchai
1,*
1
Department of Biochemistry, Faculty of Medicine, Chiang Mai University, Chiang Mai 50200, Thailand
2
Center for Research and Development of Herbal Health Products, Faculty of Pharmaceutical Sciences, Khon Kaen University, Khon Kaen 40002, Thailand
3
Clinical Epidemiology and Clinical Statistic Center, Faculty of Medicine, Chiang Mai University, Chiang Mai 50200, Thailand
4
Department of Surgery, Faculty of Medicine, Chiang Mai University, Chiang Mai 50200, Thailand
5
Department of Pathology, Faculty of Medicine, Chiang Mai University, Chiang Mai 50200, Thailand
*
Author to whom correspondence should be addressed.
Molecules 2020, 25(1), 231; https://doi.org/10.3390/molecules25010231
Submission received: 10 December 2019 / Revised: 3 January 2020 / Accepted: 4 January 2020 / Published: 6 January 2020
(This article belongs to the Special Issue Cytotoxic Activity of Plant Extracts)

Abstract

:
The incidence of lung cancer has increased while the mortality rate has continued to remain high. Effective treatment of this disease is the key to survival. Therefore, this study is a necessity in continuing research into new effective treatments. In this study we determined the effects of three different Thai herbs on lung cancer. Bridelia ovata, Croton oblongifolius, and Erythrophleum succirubrum were extracted by ethyl acetate and 50% ethanol. The cytotoxicity was tested with A549 lung cancer cell line. We found four effective extracts that exhibited toxic effects on A549 cells. These extracts included ethyl acetate extracts of B. ovata (BEA), C. oblongifolius (CEA), and E. succirubrum (EEA), and an ethanolic extract of E. succirubrum (EE). Moreover, these effective extracts were tested in combination with chemotherapeutic drugs. An effective synergism of these treatments was found specifically through a combination of BEA with methotrexate, EE with methotrexate, and EE with etoposide. Apoptotic cell death was induced in A549 cells by these effective extracts via the mitochondria-mediated pathway. Additionally, we established primary lung cancer and normal epithelial cells from lung tissue of lung cancer patients. The cytotoxicity results showed that EE had significant potential to be used for lung cancer treatment. In conclusion, the four effective extracts possessed anticancer effects on lung cancer. The most effective extract was found to be E. succirubrum (EE).

Graphical Abstract

1. Introduction

Lung cancer has been the leading cause of cancer-related deaths for many years and incidence and mortality statistics vary widely worldwide [1]. In both sexes combined, lung cancer is the most diagnosed cancer (11.6% of the total cases) and the leading cause of cancer death (18.4% of the total cancer deaths) worldwide [2]. Tobacco consumption is a major risk factor for lung cancer. Other factors include genetic susceptibility, diet, alcohol consumption, occupational exposures, and air pollution [3]. Indoor and outdoor air pollution create a high-risk for lung cancer in people living in several regions of Asia, including Thailand [4,5]. Surgical resection is the primary treatment of early stage lung cancer. For advanced disease (stage IIIB and stage IV) chemotherapy, radiotherapy, targeted therapy, and immunotherapy are the principle treatments, however, the 5-year survival rate of these standard treatments is only around 15% and metastasis is still one of the major causes of death. There are two main subtypes of lung cancer: Non-small cell lung cancer (NSCLC) and small cell lung cancer (SCLC). Around 80% of all lung cancers are determined to be NSCLC. This type of lung cancer is usually diagnosed at an advanced stage of metastasis. At this stage the possibility of surgery having a curative effect is lessened greatly. [6]. Moreover, drug resistance is a major cause for therapeutic failure in NSCLC leading to tumor recurrence and disease progression [7].
Several anticancer agents have been found in natural products which have been investigated and developed to become effective chemotherapeutic cancer drugs [8]. However, many of these chemotherapeutic drugs have been shown to produce significant toxic side effects and drug resistance. Thus, continued research needs to be pursued to find more effective natural products that provide fewer negative side effects [9]. In Thailand there are various herbs that possess medicinal potential for anti-cancer treatments. In this study ethyl acetate extracts and 50% ethanolic extracts from three plant species were examined for cytotoxic activity and apoptotic induction in a human lung cancer A549 cell line and were investigated the toxicity results in primary cancer cells obtained from human lung cancer tissues. The three herbal species studied were Bridelia ovata Decne, Croton oblongifolius Roxb., and Erythrophleum succirubrum Gagnep.
B. ovata and C. oblongifolius are in the Euphorbiaceae family. B. ovata is known as Ma-Ga in Thai and traditional medicine uses it as an expectorant, a laxative, and a medicinal astringent [10]. There are various phytochemicals in B. ovata that were previously identified as triterpenes and phytosterols [11,12]. A crude ethanolic extract of B. ovata was recently reported to inhibit human hepatocellular carcinoma HepG2 cell invasion and migration [13].
C. oblongifolius, or Plao-Yai in Thai, is a medicinal plant which acts as a tonic and a purgative and treats dysmenorrhea, dysentery, dyspepsia, and chronic liver enlargement. In addition, the combination of C. oblongifolius and C. sublyratus had been used as a treatment for gastric ulcers and gastric cancer in Thai traditional medicine [14]. The phytochemicals of C. oblongifolius have been reported to include megastigmane glycosides [15], diterpenoids such as labdanes [16,17], clerodanes [18,19,20], halimane [21], and cembranes [22,23,24]. Croblongifolin, the clerodane-type compound, exhibits cytotoxicity to human cancer cell lines, including HepG2, SW620, CHAGO, KATO3, and BT474 [19].
E. succirubrum belongs to the Leguminosae-Caesalpinioideae family. It is known as ‘Phan-Saat’ in Thai and is used to treat fever and skin diseases in Thai traditional medicine [25]. The cassaine diterpenoid dimers, which are isolated from the bark of E. succirubrum, have been reported to possess anti-cancer activity by the induction of apoptosis in human gastric adenocarcinoma cells [26]. Furthermore, the crude ethanolic extract of E. succirubrum exhibits moderate cytotoxicity against human hepatocellular carcinoma cells (HepG2). However, the mechanism(s) of cell death is still elusive [25].
Apoptosis, the well-known cell death mechanism, is induced by many chemotherapeutic agents. Membrane blebbing, nuclear condensation, and apoptotic bodies are unique morphology characteristics of apoptotic cells that occur without cell inflammation [27]. There are two main pathways in apoptotic signaling. The first is the intrinsic pathway which is induced by intracellular stimuli such as DNA damage or oxidative stress. The Bcl-2 family is a protein family composed of pro-apoptotic and anti-apoptotic proteins which tightly regulate the intrinsic pathway via the mitochondria. During apoptosis induction, the pro-apoptotic proteins (Noxa, Puma, Bax, and Bak) are upregulated to inhibit the function of anti-apoptotic proteins (Bcl-2, Bcl-xl, and Mcl-1), and induce the mitochondrial outer membrane premiumization (MOMP). This causes intermembranous space protein release and mitochondrial transmembrane potential loss [28]. Then, caspase 9 and caspase 3 are activated to induce cell apoptosis. The other pathway is the extrinsic pathway which is induced by death ligand-receptor binding on the cell membrane. The oligomerization of the receptors induces the formation of a protein complex in the cytosol which activates caspase 8 and caspase 3 and then induces apoptosis [29].

2. Results

2.1. Cytotoxicity Test of the Extracts Against Lung Cells

Three ethyl acetate extracts (BEA, CEA, and EEA) and three 50% ethanolic extracts (BE, CE, and EE) were examined for cytotoxicity against an A549 human lung cancer cell line by MTT assay. At 24 h incubation, the percentages of cell viability of A459 cells were significantly decreased at a dose dependent manner by treatment with BEA, CEA, EEA, and EE extracts, but not with BE and CE. Also, BEA, CEA, EEA, and EE decreased the A549 cells viability in a time dependent manner (24, 48, and 72 h), but not with BE and CE (Figure 1). Therefore, these four effective extracts (BEA, CEA, EEA, and EE) were used to determine their cytotoxicity against peripheral blood mononuclear cells (PBMCs). The results in Figure 2 showed a significant toxic effect when the cells were treated with CEA but not with BEA, EEA, and EE after treating the cells for 24 h. However, at 48- and 72-h treatments the effective extracts significantly decreased the PBMCs viability. So, 24 h treatment was used for further experiments as the least toxic on the PBMCs but still toxic on cancer cells. The IC values against A549 and PBMCs, and selectivity index (SI) of the effective extracts are shown in Table 1. The most effective inhibitory herbal extracts were EE > CEA > EEA > BEA, concerning the IC50 values at 24 h treatment.

2.2. Identification of the Phytoconstituents in the Effective Extracts by Gas Chromatography–Mass Spectrometry (GC-MS)

The chromatogram in Figure 3 showed the GC-MS results of BEA, CEA, EEA, and EE, including the structures of the three main compounds in each extract. The BEA extract contained 28.99% of friedelan-3-one, 22.52% of stigmast-5-en-3-ol, and 9.09% of palmitic acid. The main compound in the CEA extract was kaur-16-en-18-oic acid (50.24%), whereas the other two main compounds were stigmast-5-en-3-ol and benzoic acid, which were only at 3.60% and 3.24%, respectively. Even though EEA and EE were extracted from the same plant their main compounds are different. EEA extract contained 22.74% of oleic acid, 12.89% of palmitic acid, and 11.73% of pyrogallol, whereas EE extract contained 37.82% of pyrogallol, 21.75% of ethyl gallate, and 6.26% of resorcinol. Data from the active compounds in the effective extracts enabled the identification of 26 compounds from BEA, 13 compounds from CEA, 22 compounds from EEA, and 17 compounds from EE. Retention time, compound name, and the percentages of each compound in the BEA, CEA, EEA, and EE are shown in Table 2, Table 3, Table 4 and Table 5, respectively.

2.3. Combined Effects of the Effective Extracts with the Chemotherapeutic Drugs

The conventional chemotherapeutic drugs, etoposide (ETS) and methotrexate (MTX), were used as treatment on the A549 cells alone or in combination with the effective extracts. The cells viability was determined by MTT assay. The cytotoxicity results, concentrations of the effective synergy extracts and chemotherapeutic drugs, and CI values were shown in Figure 4A,C,E). The cell viability results from the chemotherapy drugs alone showed that the A549 cells tended to resist the MTX but responded to ETS at a high dose. However, the combination of MTX with BEA, MTX with EE, and ETS with EE could reduce the cell viability to be lower than drug treatment alone and displayed the synergistic effect at some concentration. The percentage of cell viability was used for calculating the fractional inhibition (Fa) and combination index (CI) by the Chou-Talalay method. The Fa-CI plots or Chou-Talalay plots for drug combination at the Figure 4B,D,F allow quantitative determination of drug interactions, where CI <1, =1, and >1 indicates synergism, additive effect, and antagonism, respectively [30]. The interpretation of CI value was shown in Table 6 which related to the results in Figure 4.

2.4. Apoptotic Induction by the Effective Extracts

The morphology of the A549 cells after treatment with the effective extracts was detected by PI staining using fluorescence microscopy. The number of cells with condensed nuclei and apoptotic bodies increased in a dose dependent manner for all of the effective extracts (Figure 5). In addition, the results from flow cytometer of the annexin V-FITC/PI assay showed a significant increase in the percentage of apoptosis cells for every effective extract as shown in Figure 6. This indicates that the effective extracts induced A549 cell apoptosis.

2.5. Reduction of Mitochondrial Transmembrane Potential (∆Ψm)

Mitochondria are the main organelles which are affected when the cell undergoes apoptosis [31]. Dysfunction of mitochondria, which occurs during apoptosis, was determined by the reduction of ∆Ψm using DiOC6 fluorescence dye staining which produces a decreasing intensity with ∆Ψm loss. The results in Figure 7 demonstrated that the effective extracts induced ∆Ψm loss in A549 cells in a dose-dependent manner. This indicates that the A549 cell apoptosis was mediated via mitochondrial dysfunction.

2.6. Intracellular Reactive Oxygen Species (ROS) Generation

Production of ROS at high levels induces mitochondrial dysfunction, cell damage, and apoptosis [32]. The results of the intracellular ROS, which were measured by DCFH-DA in Figure 8, showed that the ROS generation significantly increased after the cells were treated with the effective extracts. This indicates that the mitochondrial signaling pathway was activated by the effective extract treatments on the A549 cells.

2.7. Induction of Noxa in Both Gene and Protein Levels

Noxa is a member of the pro-apoptotic Bcl-2 family (BH3-only protein) which is upregulated during apoptosis [33]. Gene and protein levels of Noxa were determined by real-time RT-PCR and Western blot analysis, respectively. After the A549 cells were treated with the effective extracts, the results showed that both gene and protein levels were significantly increased for every effective extract (Figure 9 and Figure 10). Therefore, the effective extracts upregulated Noxa to induce mitochondria-mediated apoptosis in A549 cells.

2.8. The Effect of the Effective Extracts on Primary Lung Cells

We examined the cytotoxicity of each of the effective extracts and the conventional chemotherapy drugs (doxorubicin; DOX, etoposide; ETS, and vinblastine; VBT) against primary lung cancer cells and normal lung cells which were obtained from lung cancer patients. The patients’ characteristics are shown in Table 7. Nine samples were successfully cultured as primary cancer cells, whereas seven samples were cultured as primary normal cells. The cytotoxicity results from the MTT assay was used for calculating the IC50 of each substance (extracts and chemotherapeutic drugs) on sensitive samples as shown in Table 8. The sensitive sample and resistant sample were separated by the percentages of cell variability. The cell samples where the percentage of cell viability were reduced to less than 50% are considered to be the sensitive samples for each substance treatment. On the other hand, cell samples which possessed cell viability over 50% were identified as the resistant samples. The results showed that all of the primary lung cancer samples were sensitive to CEA and EE, but only three cancer samples were resistant to BEA and only two cancer samples were resistant to EEA. For the chemotherapy drugs, there were six sensitive samples for every drug, but they were not the same samples of each drug. In addition, most normal samples were sensitive to every substance except BEA, which was toxic to only two normal samples. The p-values in Table 8 show that the IC50 of EE against lung cancer samples was significantly lower than normal lung samples (p-value < 0.05). As shown in Table 9, the mean difference of each substance demonstrates both quantity and direction and was compared between lung cancer samples and normal lung samples. Only the EE treatment showed an IC50 (at 4.38 µg/mL) against lung cancer samples that is significantly less than the normal lung samples with 95% confidence.

3. Discussion

Herbs are the main sources for drugs. Many herbs are used in traditional medicine and have been developed to become therapeutic drugs [34]. B. ovata, C. oblongifolius, and E. succirubrum are Thai herbs in the plant genetic conservation project under the Royal Initiative of Her Royal Highness Princess Maha Chakri Sirindhorn (RSPG). This project aims to develop plant genetic resources for the maintenance of plant varieties, and for the potential to develop future advances for the farming and business sector in Thailand. In this study we investigated the effects of these Thai herbal extracts in order to analyze their potential use in future alternative treatments for lung cancer.
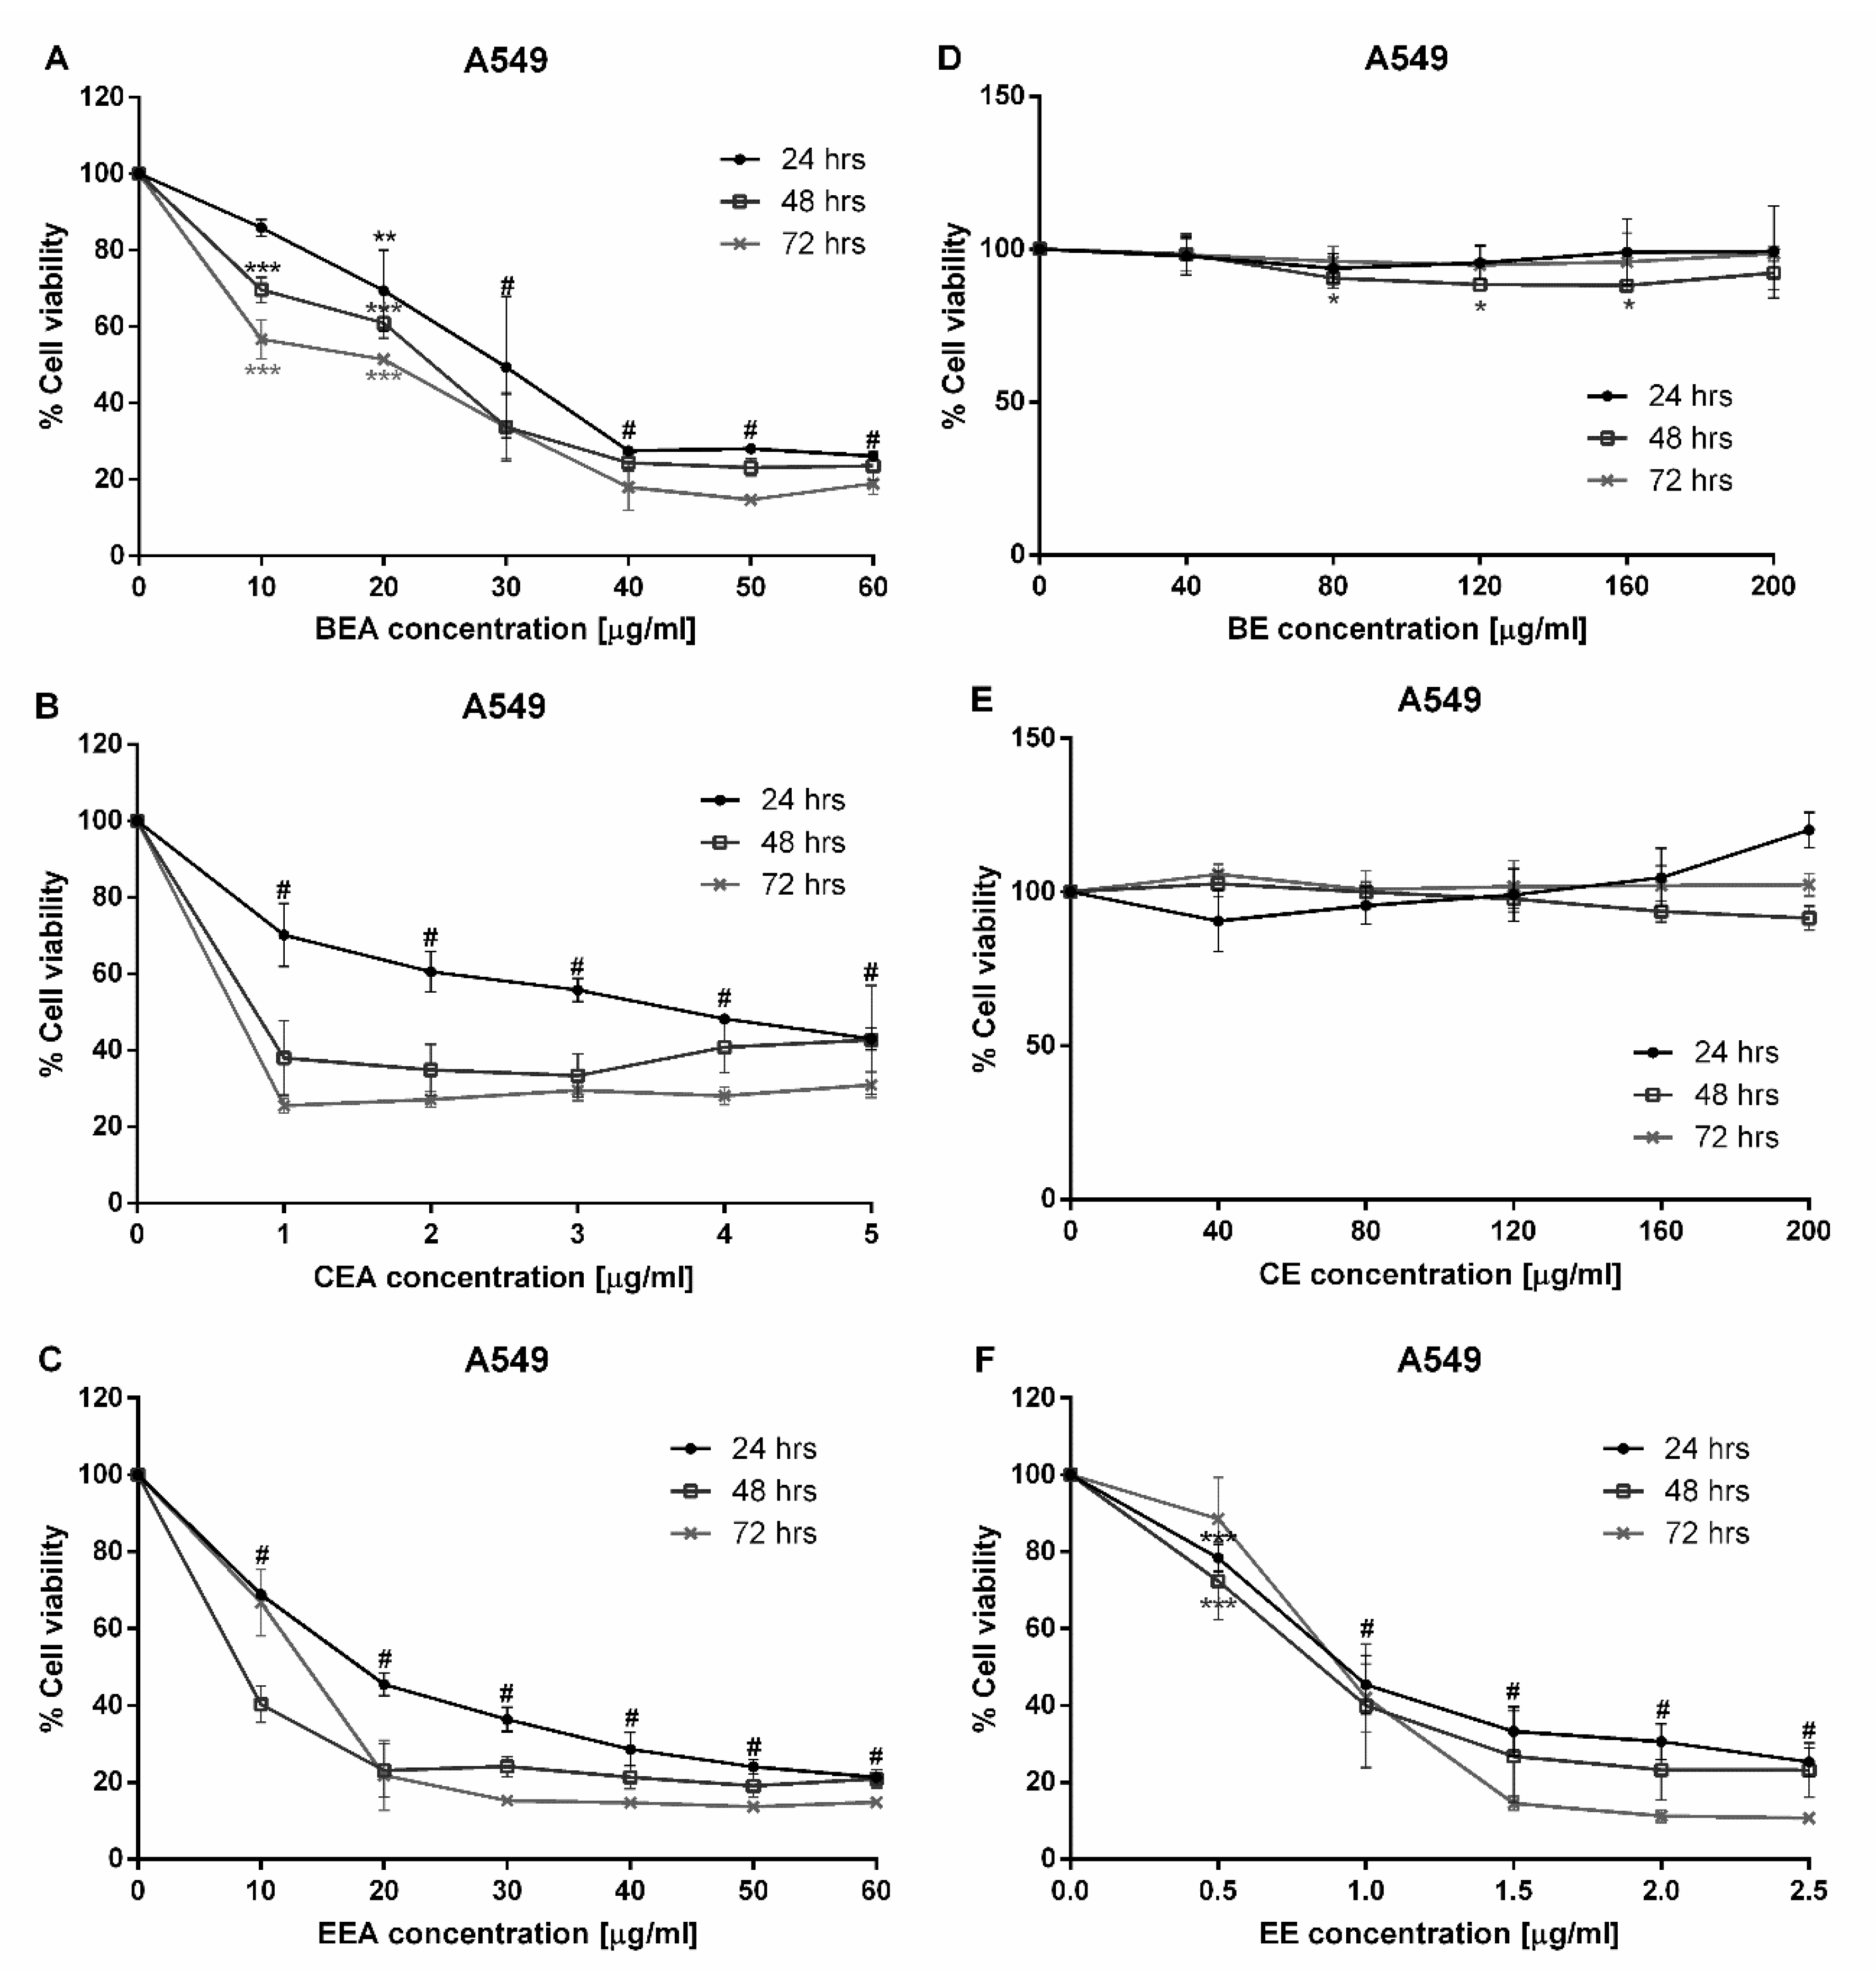
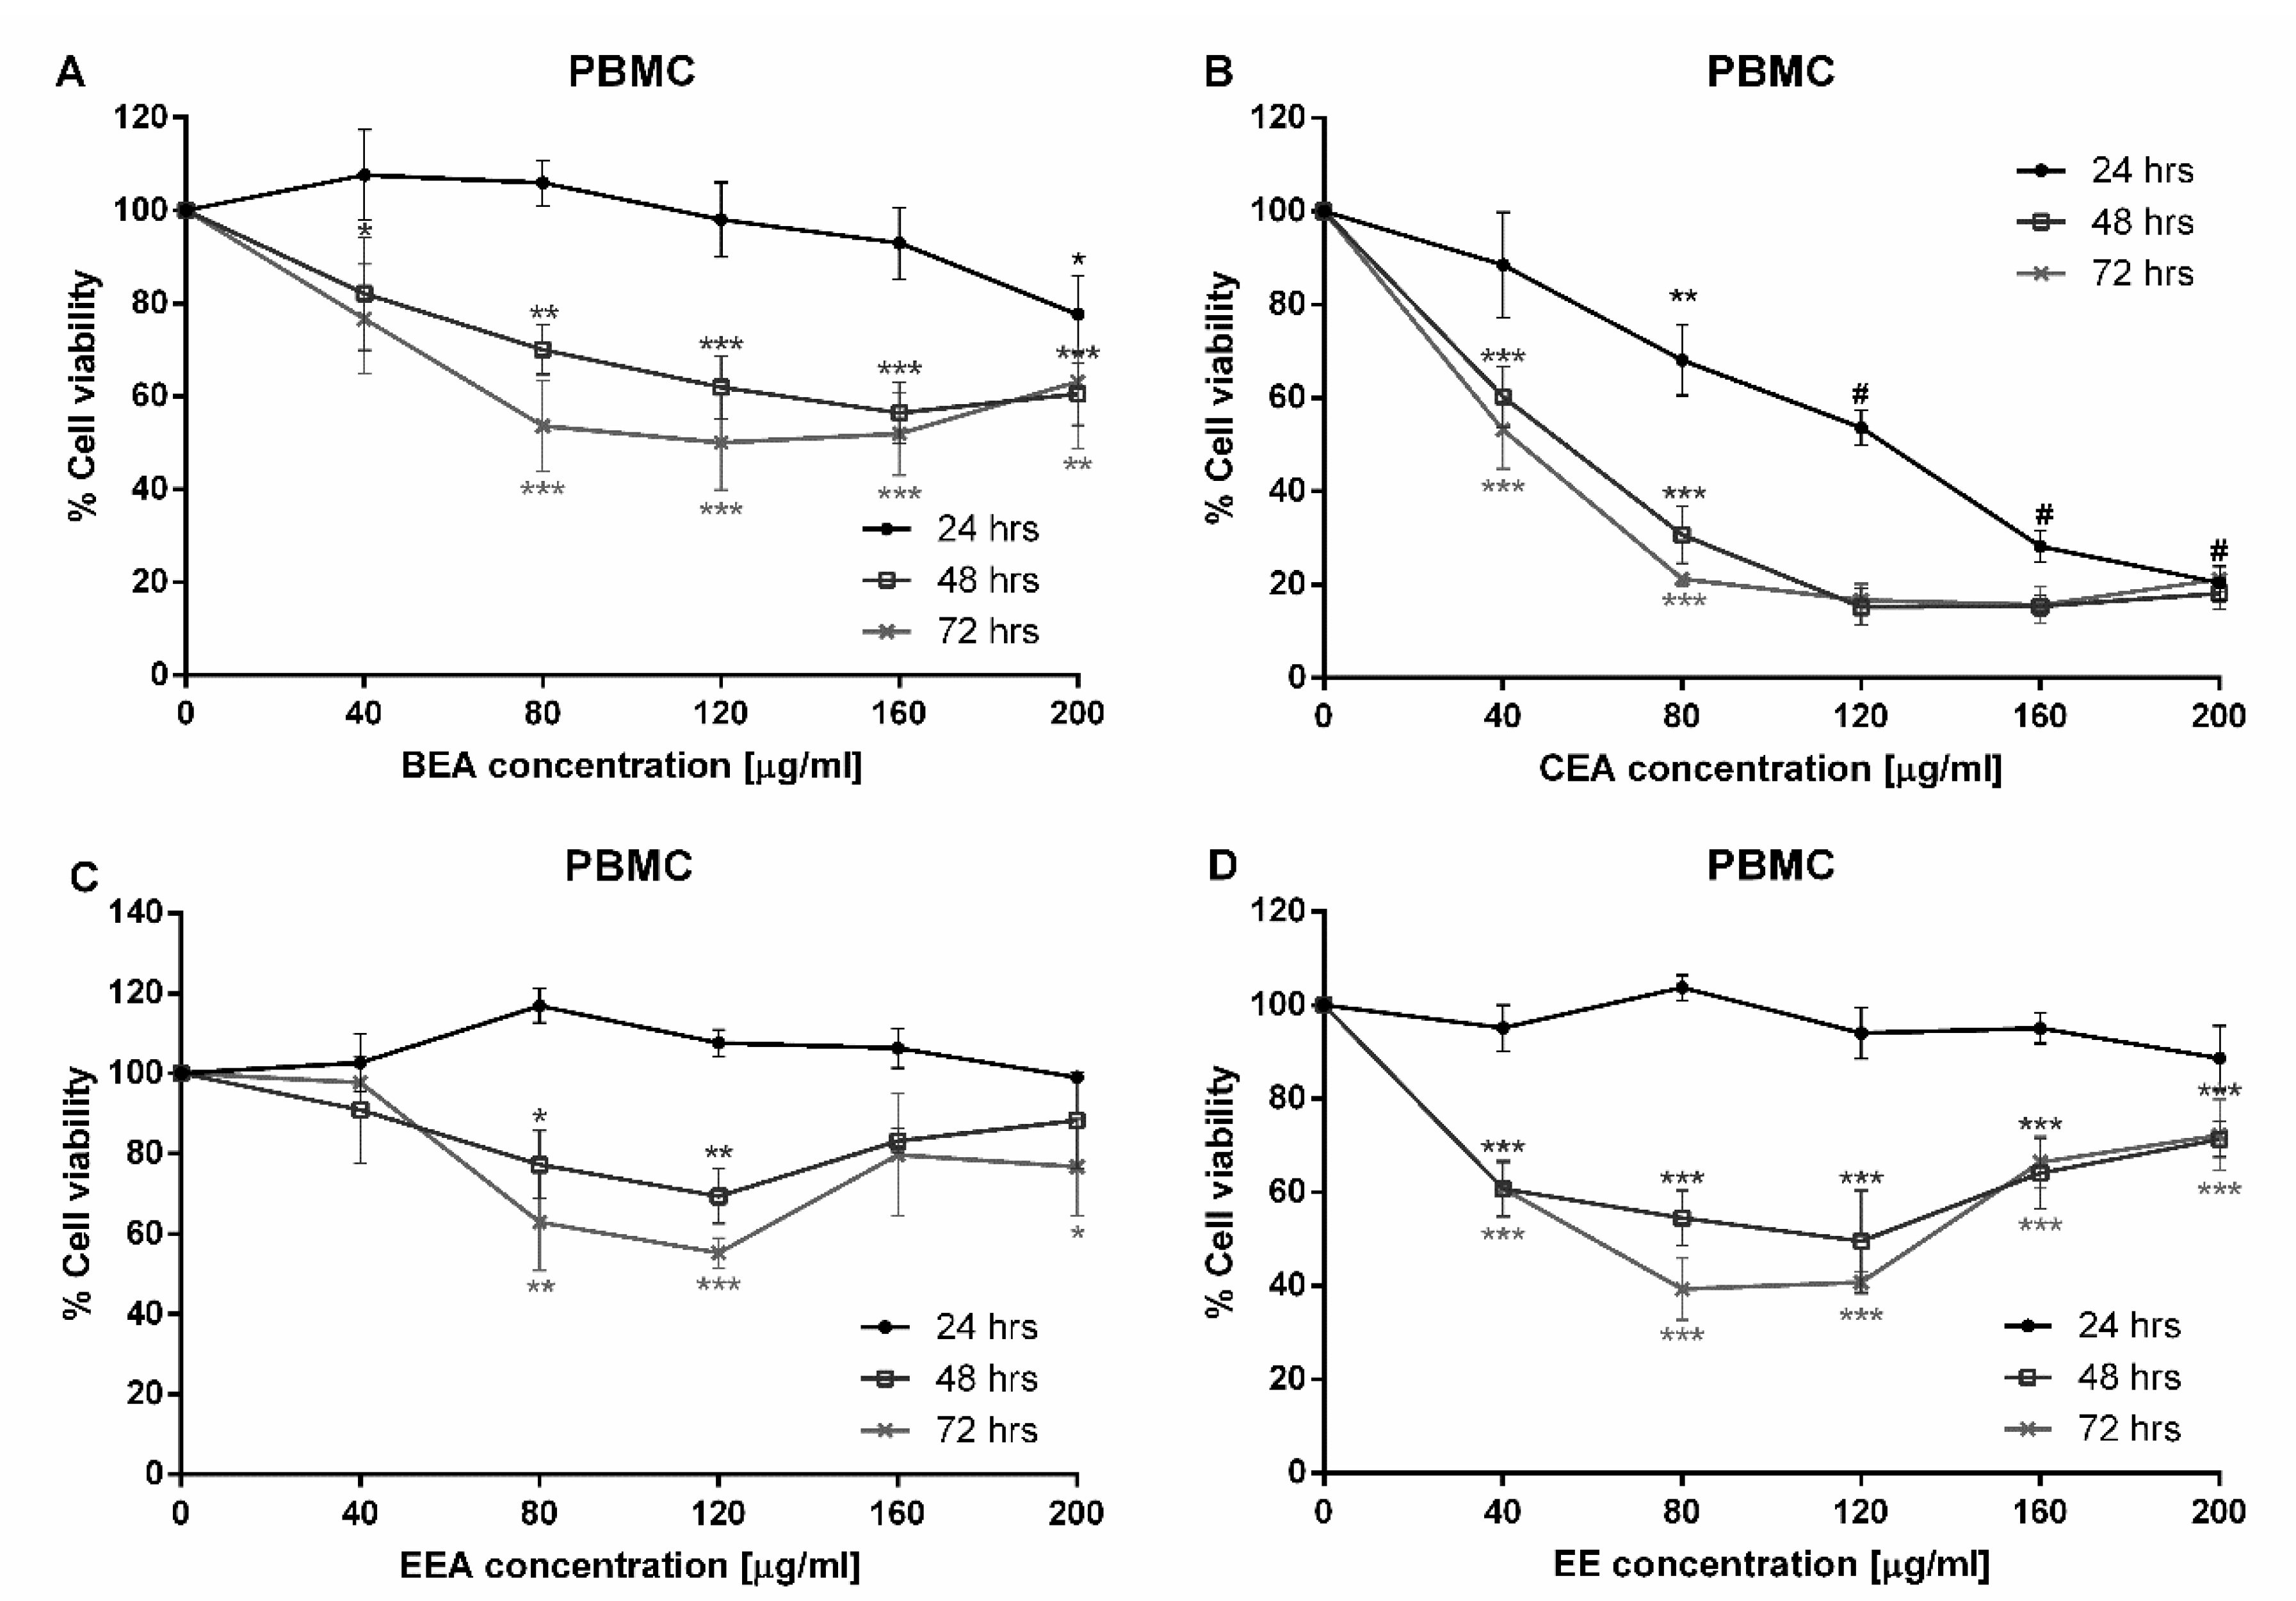
Since a major subgroup of lung cancer is NSCLC, A549 cells were used in this study. The A549 cell line is made up of adenocarcinoma from human alveolar basal epithelial cells which are commonly used as a model for the study of lung cancer and for the development of drug therapies [35]. This study began with a cytotoxicity test of three plants which were extracted with two different solvents, ethyl acetate and 50% ethanol. Six extracts were tested against A549 cells. The cytotoxicity results demonstrated that BEA, CEA, EEA, and EE extracts exhibited toxicity towards A549 cells at 24 h incubation. Although these four effective extracts were toxic to PBMCs, the IC50 of PBMCs was significantly greater than that of A549 cells. Therefore, the concentrations of each effective extract used for treating cancer cells are not toxic to normal PBMCs. The SI values of these four effective extracts were more than three, which indicates a high selectivity of the effective extracts tested on the A549 cells [36,37].
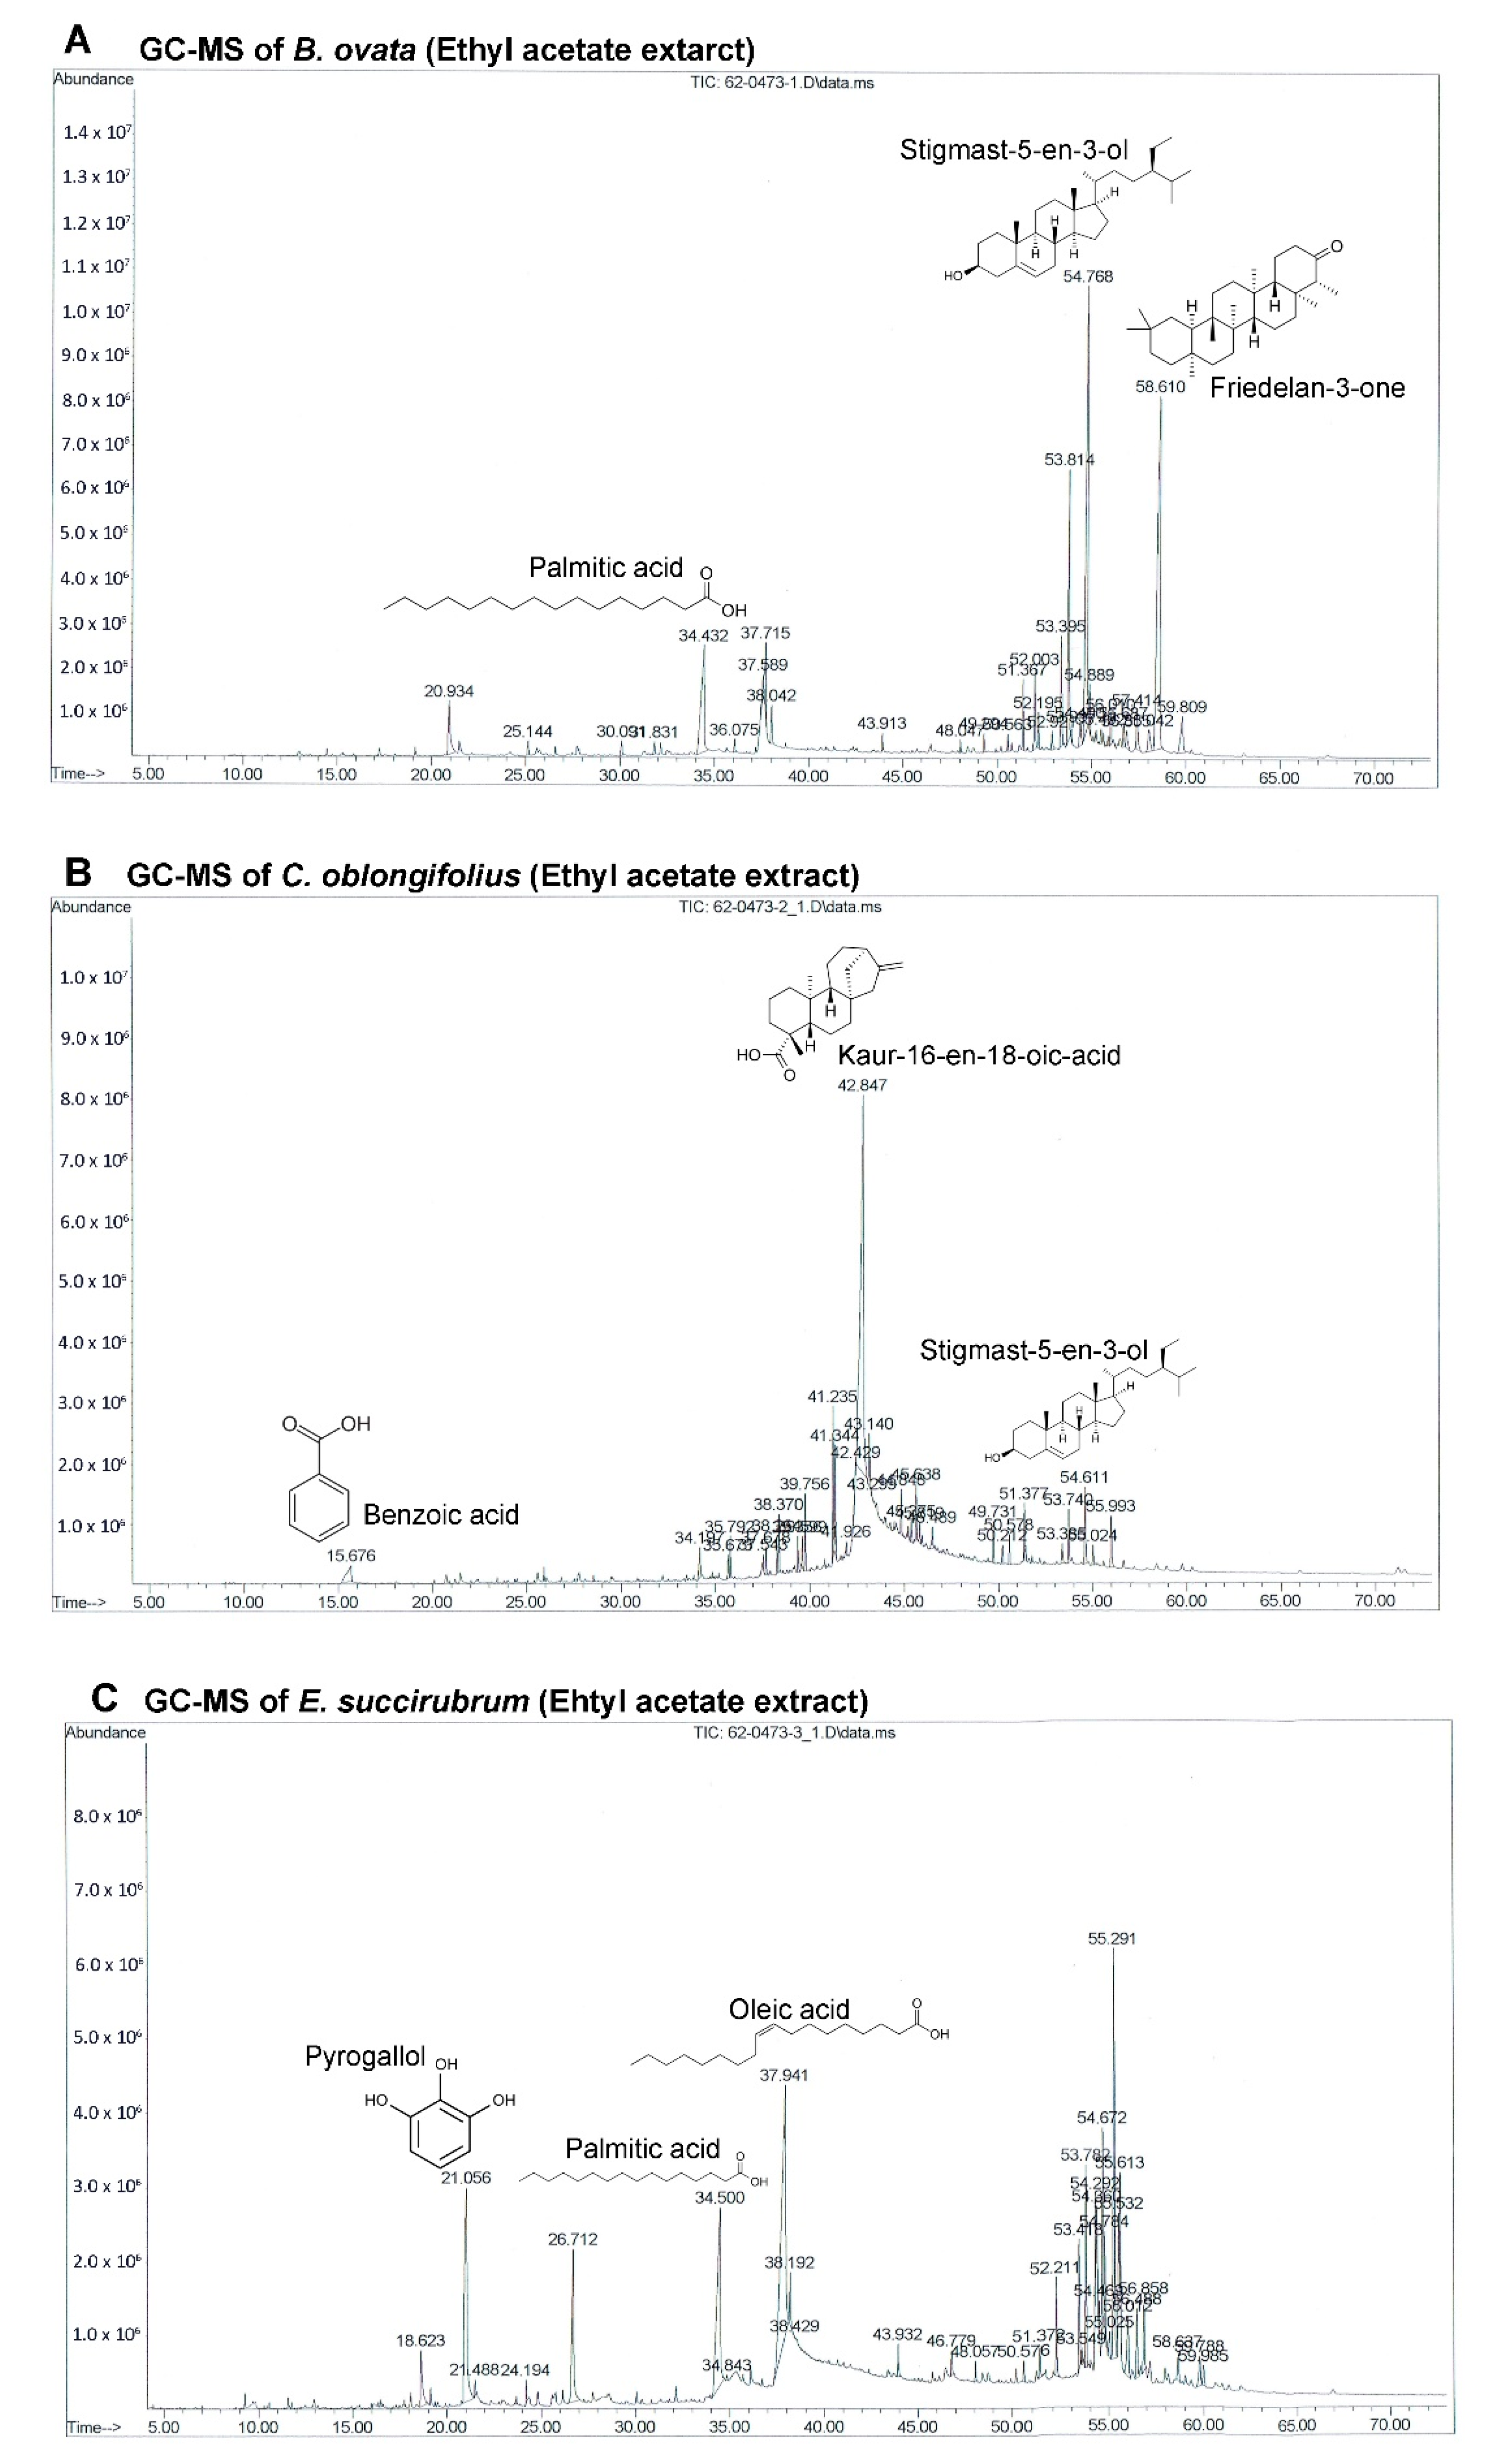
The GC-MS chromatograms of the effective extracts showed many different peaks for the active compounds. Only the structures of the three most abundant compounds were displayed in Figure 4. Even though B. ovata and C. oblongifolius are plants from the same family (Euphorbiaceae) and phytosterols were identified in both BEA and CEA (campesterol, stigmasterol, and stigmast-5-en-3-ol), the main compounds in these plants are different. Friedelan-3-one (28.99%) and Stigmast-5-en-3-ol (22.52%) are the main compounds in BEA. Friedelan-3-one, or friedelin, is a triterpenoid which has been reported to have anti-tumor activities against various cancer types, including human malignant melanoma A375, human cervical tumor HeLa, human macrophage tumor THP-1, and mouse lung epithelial tumor L929 cells [38]. The inhibitory effect of friedelan-3-one on VEGF-induced Kaposi’s sarcoma cell proliferation via apoptotic cell death induction [39] and on breast cancer MCF-7 cell growth associated with p53 and caspase activation [40] were also reported. Stigmast-5-en-3-ol is the second most abundant compound in both BEA (22.52%) and CEA (3.60%). The apoptotic and antiproliferative effects against human leukemia HL-60 and MCF-7 cells were also demonstrated [41].
However, the main compound of CEA is kaur-16-en-18-oic acid, which makes up 50.24% of the total constituents in CEA but was not found in BEA. This may be the reason that CEA possessed more effective activity comparing with BEA. Kaur-16-en-18-oic acid is a kaurane-type diterpenoid which has anticancer potential [42]. It has been reported that kaur-16-en-18-oic acid induces apoptosis cell death in HL-60 [43], HeLa and CaSki cervical cancer cell lines [44], including a significant anti-cancer effect against an A549 cell line [45].
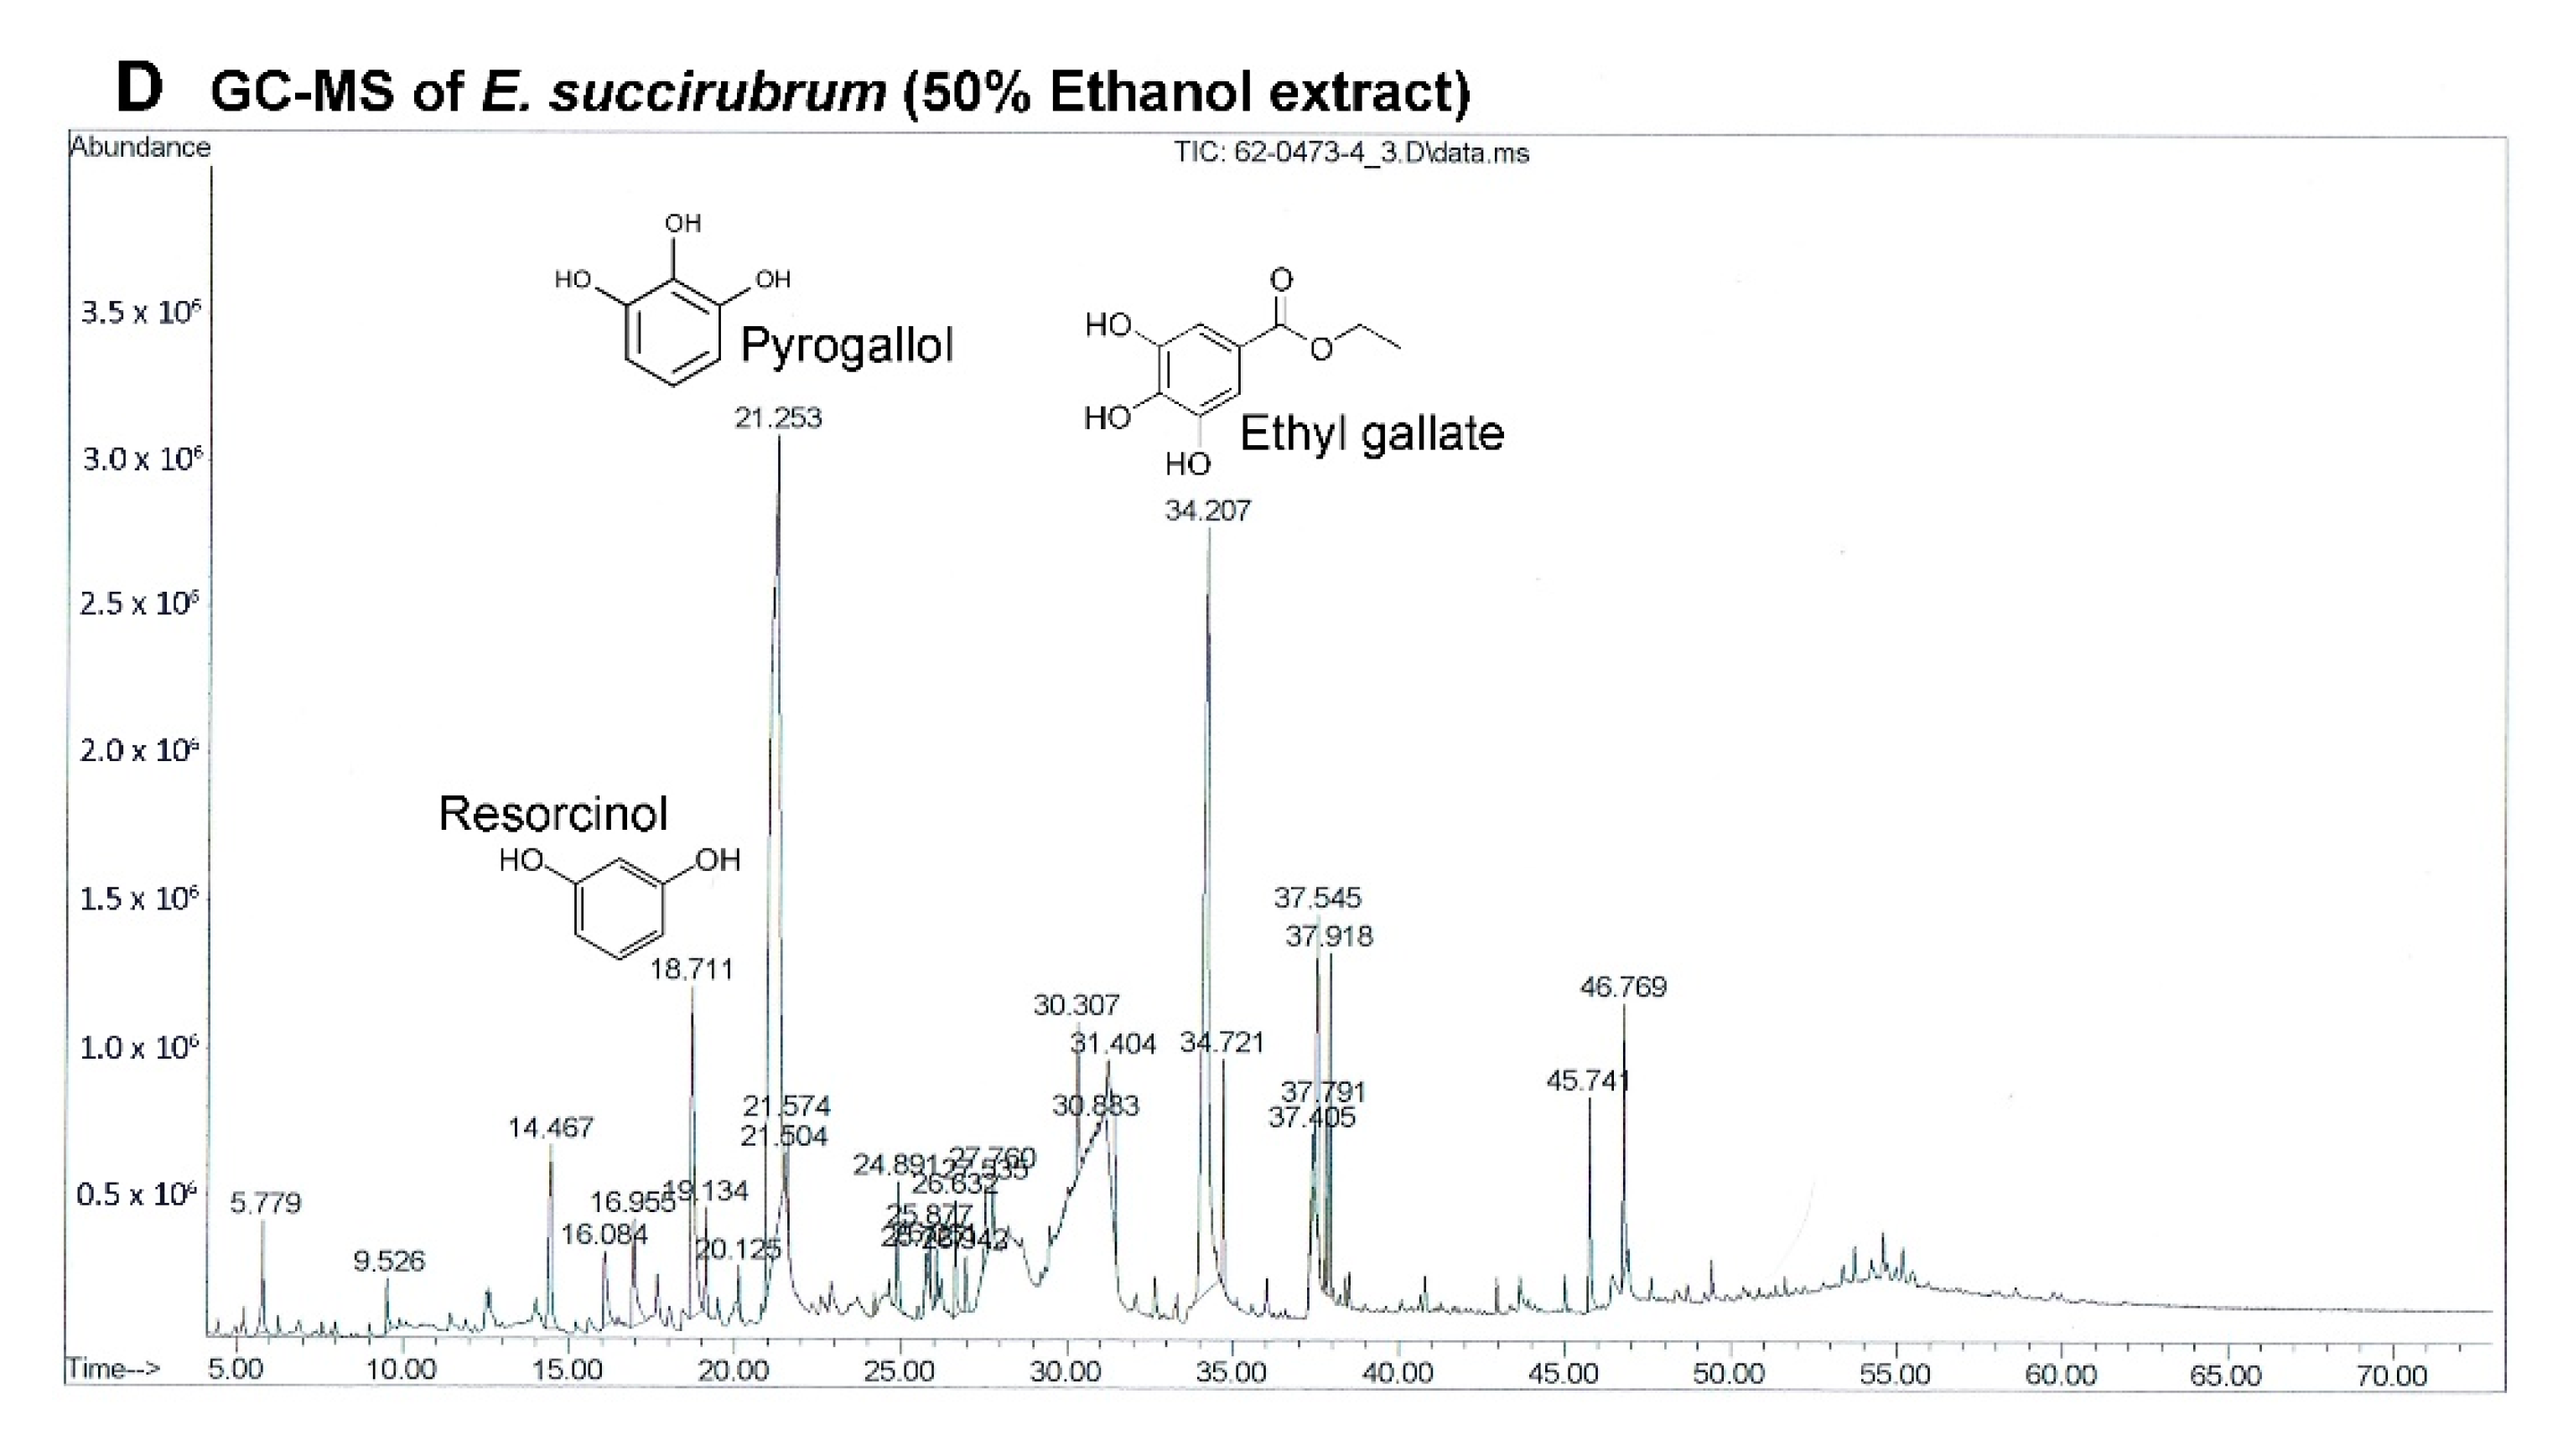
The most effective extract against A549 cells and the only extract that had a significant effect on primary lung cancer cells was EE. Although the extracts of E. succirubrum (both ethyl acetate and ethanol) are effective on A549 cells, EE remarkably produced a more significant effect than EEA. The main compounds in EE are pyrogallol (37.82%) and ethyl gallate (21.75%). Pyrogallol, a catechin compound, is known as superoxide anion generator. It induces GSH depletion-mediated cell death in several cell types including lung cancer cells [46]. Previous studies have reported that pyrogallol has highly cytotoxic effects on human lung cancer cell lines. Cell growth of A549, squamous cell lung carcinoma H520, and lung adenocarcinoma H441 cells were inhibited by pyrogallol via cell cycle arrest [47,48]. In addition, pyrogallol inhibits human lung adenocarcinoma Calu-6 cell via caspase-dependent apoptosis and cell cycle arrest [49,50]. Moreover, ethyl gallate, which is a phenolic compound, has been reported to exhibit anticancer activity against many cell lines such as human prostate cancer PC3, cervical cancer HeLa and CaSki, human hepatocellular carcinoma Hep3B and HepG2 cells [51]. In previous studies ethyl gallate induces HL-60 apoptosis via the mitochondria-mediated pathway. It also suppresses proliferation and invasion of breast cancer via Akt-NF-kB signaling, and inhibits patient-derived esophageal tumor growth in an in vivo mouse model via ERK1/2 inhibition [52,53,54]. Therefore, the two most abundant compounds, pyrogallol and ethyl gallate, might possess significant anticancer activity in EE.
EEA contains oleic acid (22.74%) and palmitic acid (12.89%) which are the two most abundant compounds. They are well known fatty acids which have unclear activities on cancer cells. There are some reports about oleic acid that demonstrate that they possess anti-tumor activity depending on the type of cancer, and are linked to the inhibition of angiogenesis [55], metastasis [56], and apoptosis induction [57]. Alternatively, oleic acid has been reported to promote cell proliferation and migration in aggressive metastatic cancer cells via enhanced β-oxidation mediated by AMPK activation [58]. There are similar issues in palmitic acid which has been reported to reduce and induce cancer cell growth [59,60]. The third most abundant compound in EEA is pyrogallol (11.73%) which is also the most abundant compound in EE.
Currently, chemotherapy is the main treatment for lung cancer and is a palliative remedy for patients. However, some patients do not respond well. This generally leads to an increase in the dosage of drugs which increases the potential for adverse side effects. Moreover, some patients are resistant to chemotherapy. Therefore, a combination of chemotherapy is commonly used for cancer treatment [61]. The main purpose of using drug combination therapies is to create a synergistic therapeutic effect that allows for a reduction of the dosage of the chemotherapy drugs. This potentially lessens adverse side effects while reversing drug resistance [62]. The level of synergism is quantified by the drug combination index (CI) which is calculated by the Chou and Talalay’s method [
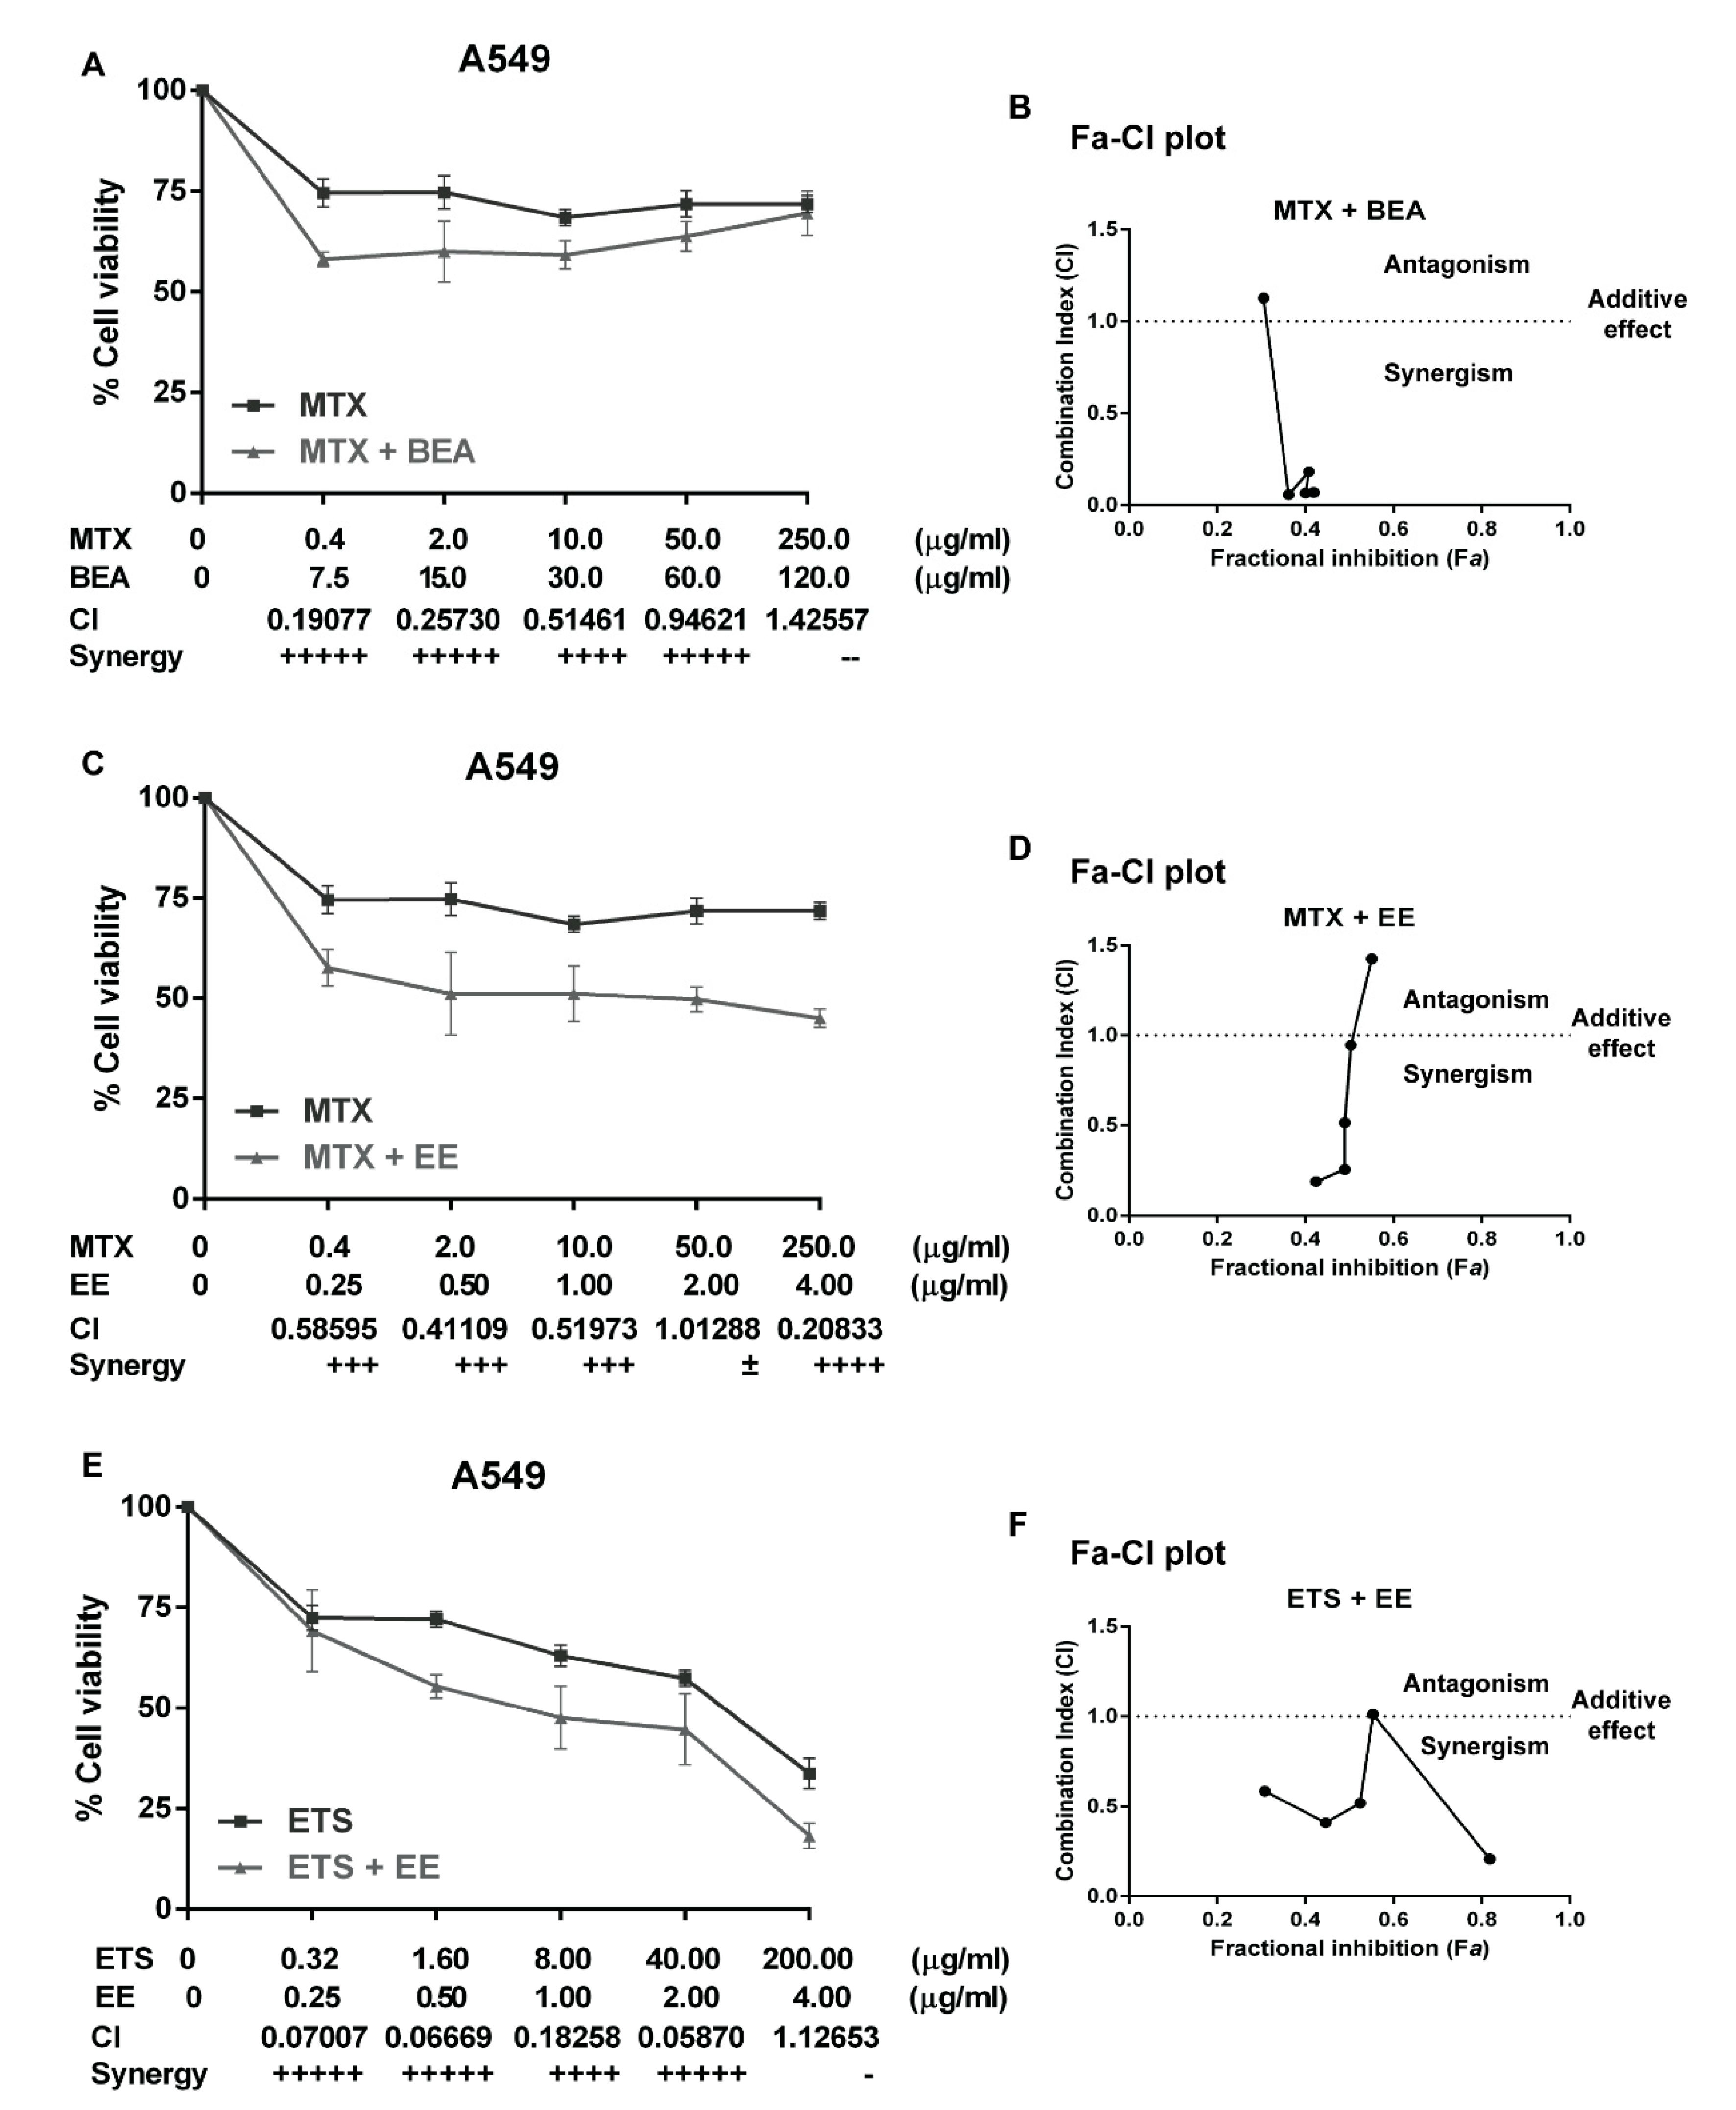
63]. The CI offers a quantitative definition for the additive effect (CI = 1), synergism (CI < 1), and antagonism (CI > 1) in drug combinations. In this study, A549 cells were treated with carboplatin, methotrexate, vinorelbine, or etoposide alone, then treated with a combination of each drug with each effective extract, but the results show only the synergistic combination. We found three synergistic combinations, which are BEA with MTX (Figure 3A,B), EE with MTX (Figure 3C,D), and EE with EPS (Figure 3E,F). A549 cells did not respond well to EPS (Figure 3E) and were resistant to MTX (Figure 3A,C). The combinations of MTX with BEA and MTX with EE showed synergistic effects at low concentrations of MTX. Therefore, EE and BEA can sensitize A549 cells to MTX. However, a high concentration of MTX (250 µg/mL) can increase the CI value to more than one in both combinations with BEA (CI = 1.12653) and EE (CI = 1.42557). This means that the combination treatments possess a level of antagonism if used with a high dose of MTX. Therefore, it is more effective to treat A549 cells with lower concentrations of MTX combined with BEA or EE. These combination treatments can reduce the dose of MTX and feasibly decrease side effects in further clinical studies.
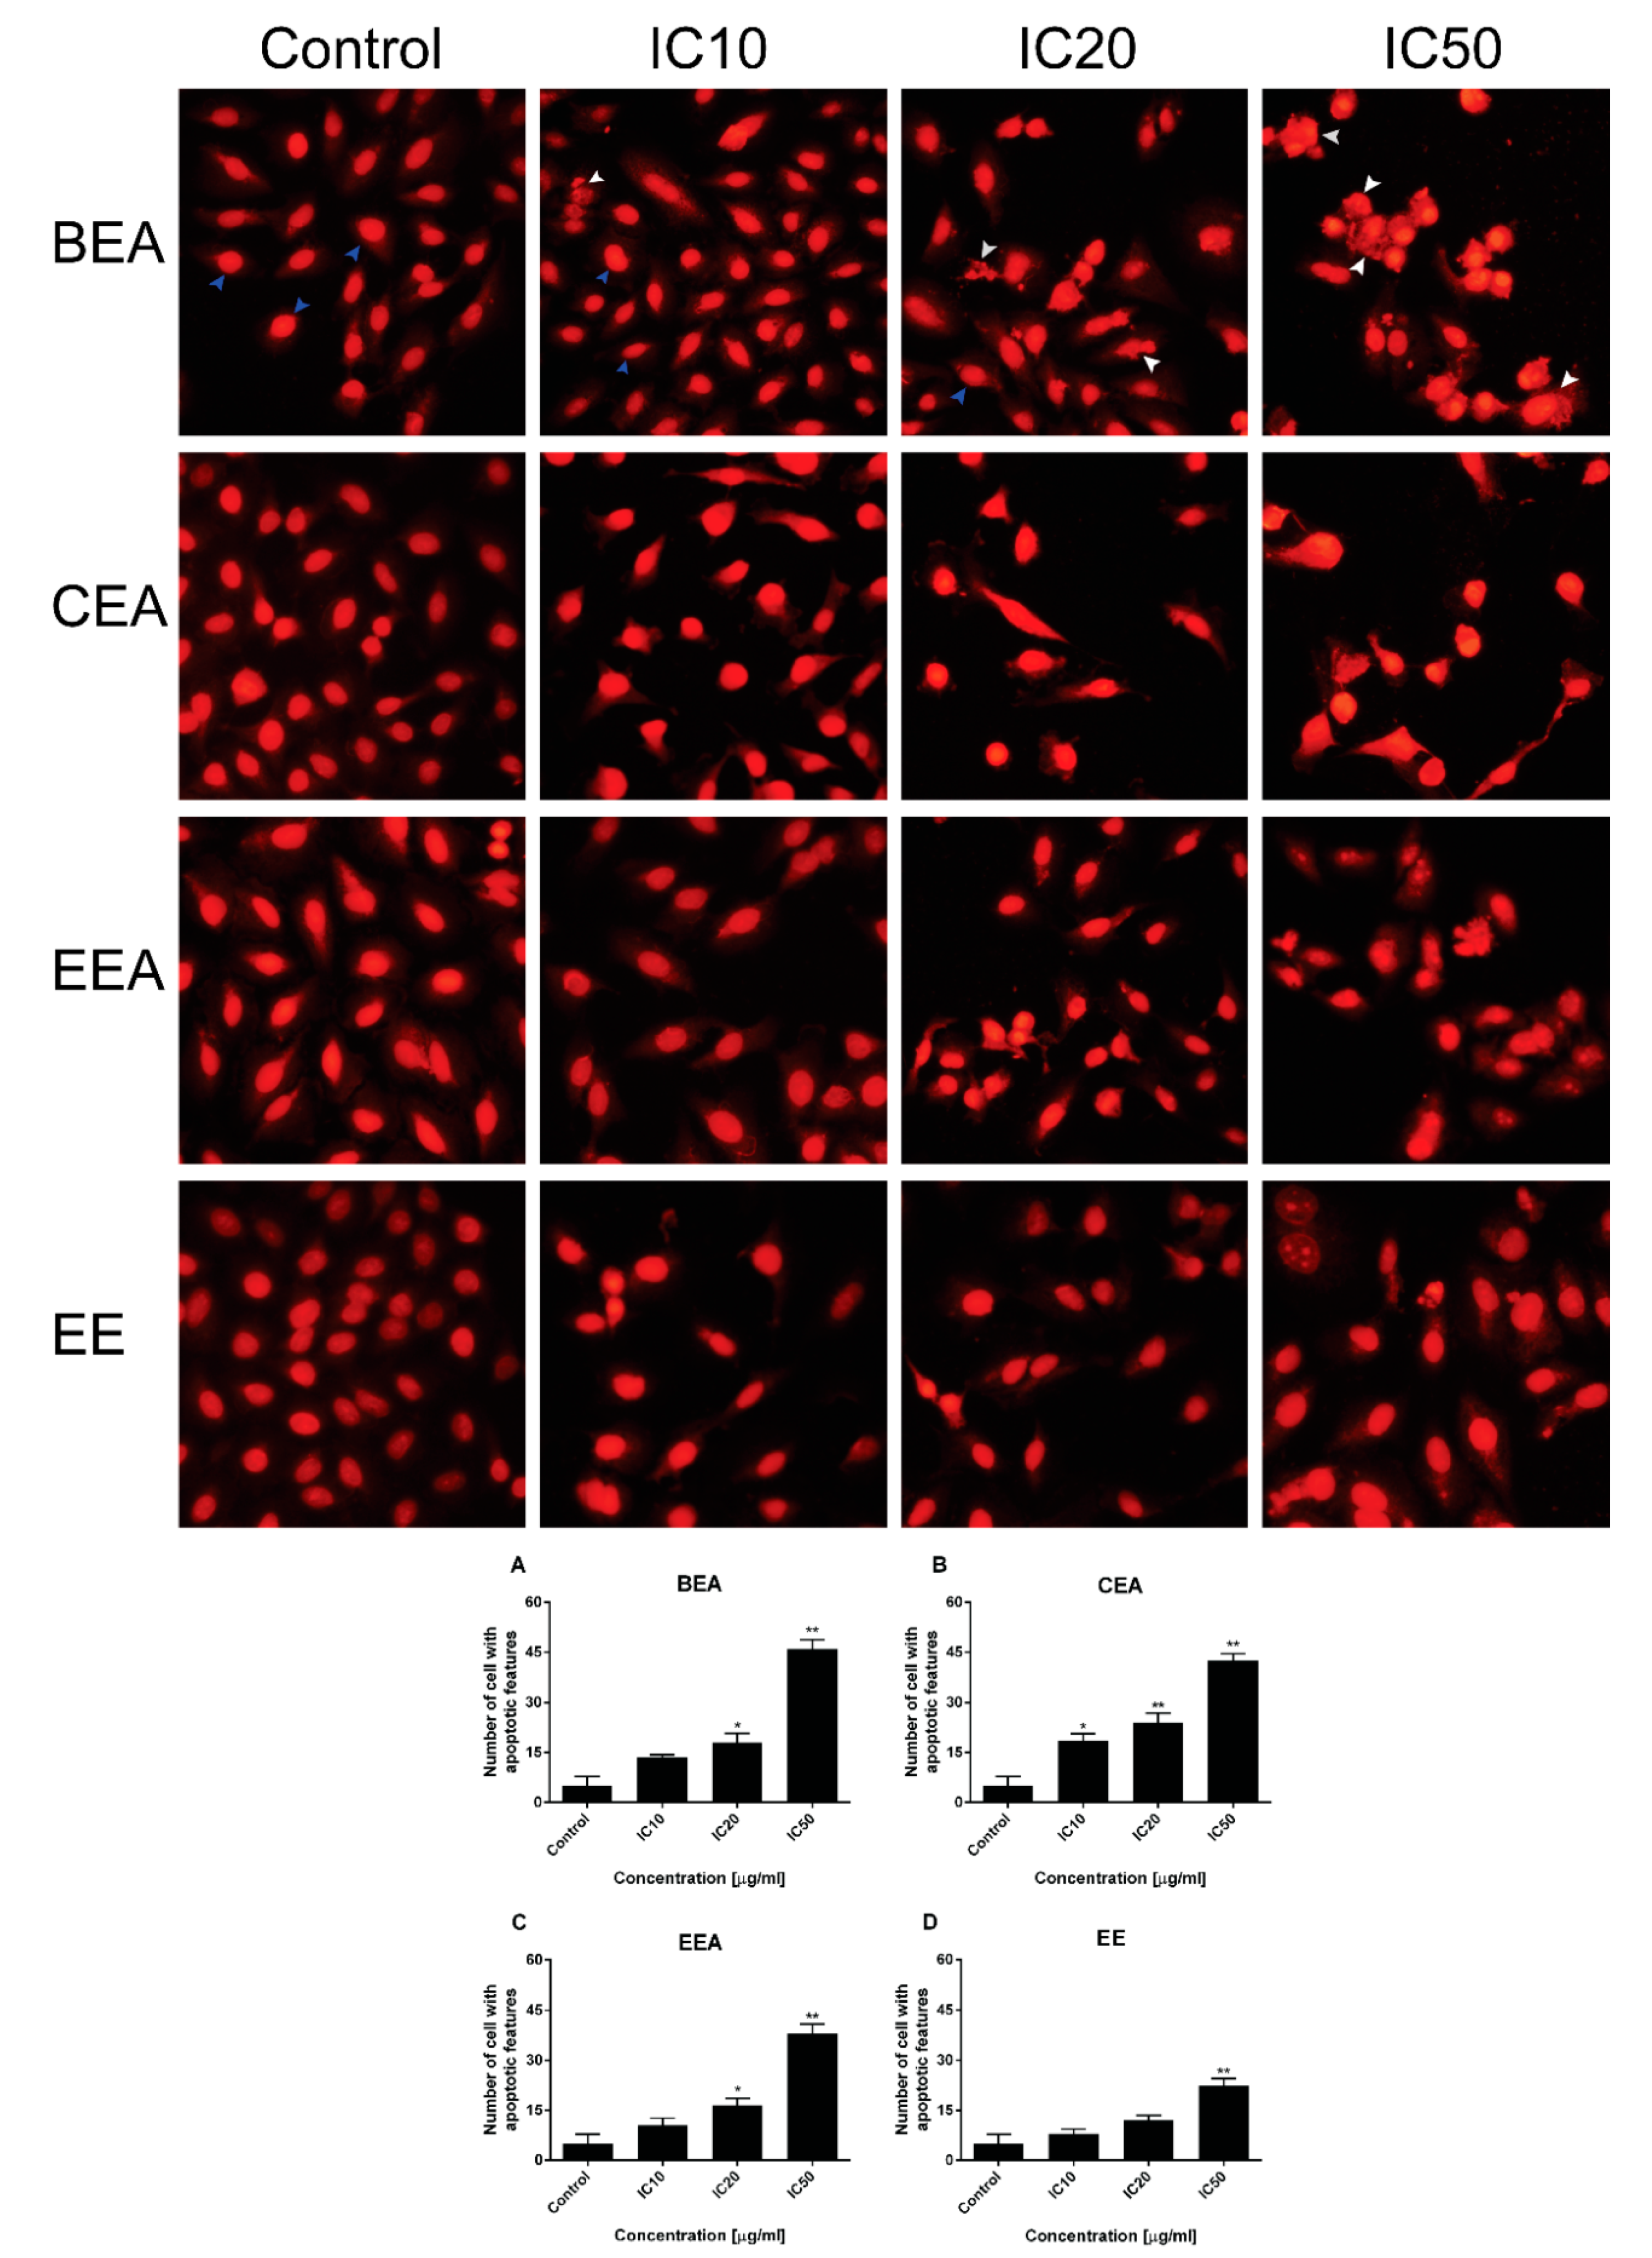
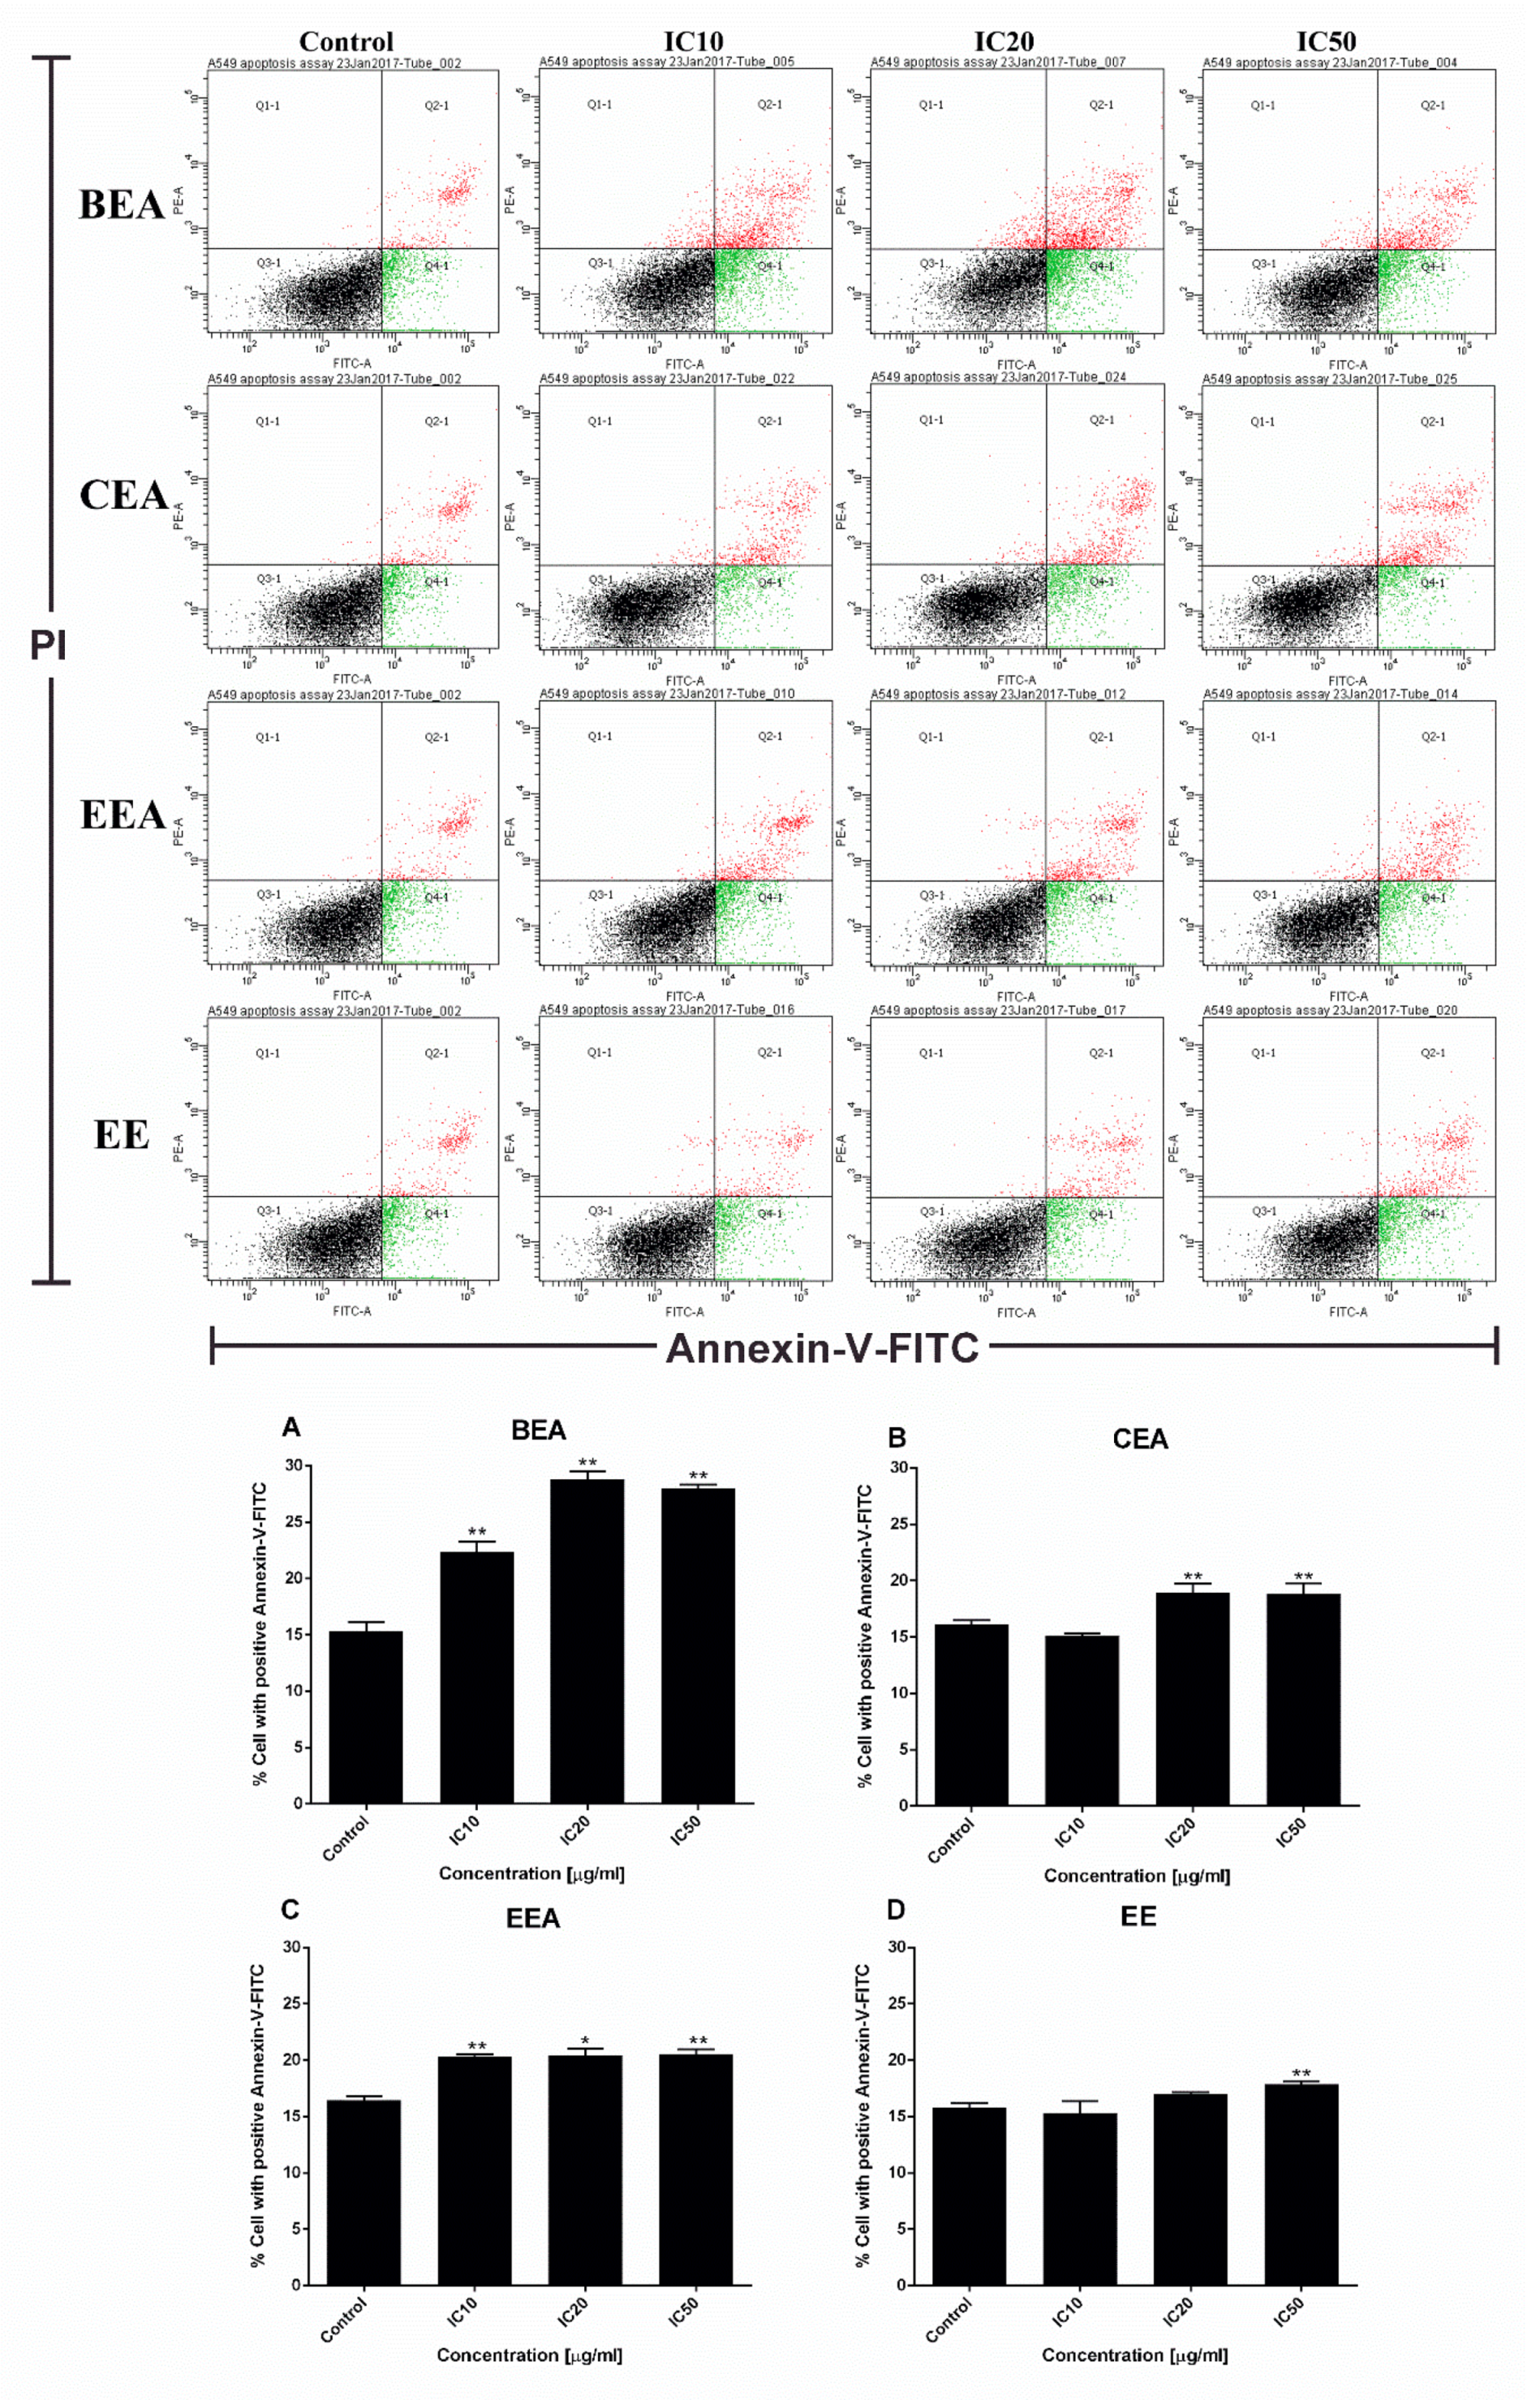
The mode of cancer cell death was determined by fluorescence microscopy and flow cytometry. Although there are a number of molecular markers for the cell death mechanism, morphological criteria is still the standard for defining the mode of cell death [64]. PI staining was used for nuclear change observation. The results show apoptotic morphology with bright red, condensed nuclei (intact or fragmented). The formation of apoptotic bodies was compared to the control cells that are displayed as round, intact, red nuclei (Figure 5A). Apoptotic cells and apoptotic bodies increased in a dose-dependent manner compared to the control after treating the cells with these four effective extracts. The quantification of apoptosis was obtained by flow cytometry. During apoptosis, phosphatidylserine (PS) becomes exposed on the outside of the membrane. The detection of PS by annexin V-FITC is used for the estimation of the incidence of both early (Annexin V+/PI) and late (Annexin V+/PI+) apoptosis [65]. The flow cytometry results confirmed that the effective extracts induced A549 cell apoptosis (Figure 6). Therefore, apoptosis cell death was the mode of cell death that was triggered by these four effective extracts.
Mitochondrial disturbances occurred during apoptosis in several ways, including through a loss of ∆Ψm, a release of apoptotic proteins from the intermembranous space into the cytosol, and a generation of ROS [66]. A reduction of ∆Ψm was determined and it was found that the percentage of cells with a loss of ∆Ψm increased after treatment of A549 with the effective extracts. Moreover, ROS generation increased in extract-treated cells compared to the control cells. This suggests that the effective extracts induced A549 apoptosis, which involved a disruption of the mitochondria and intracellular oxidative stress.
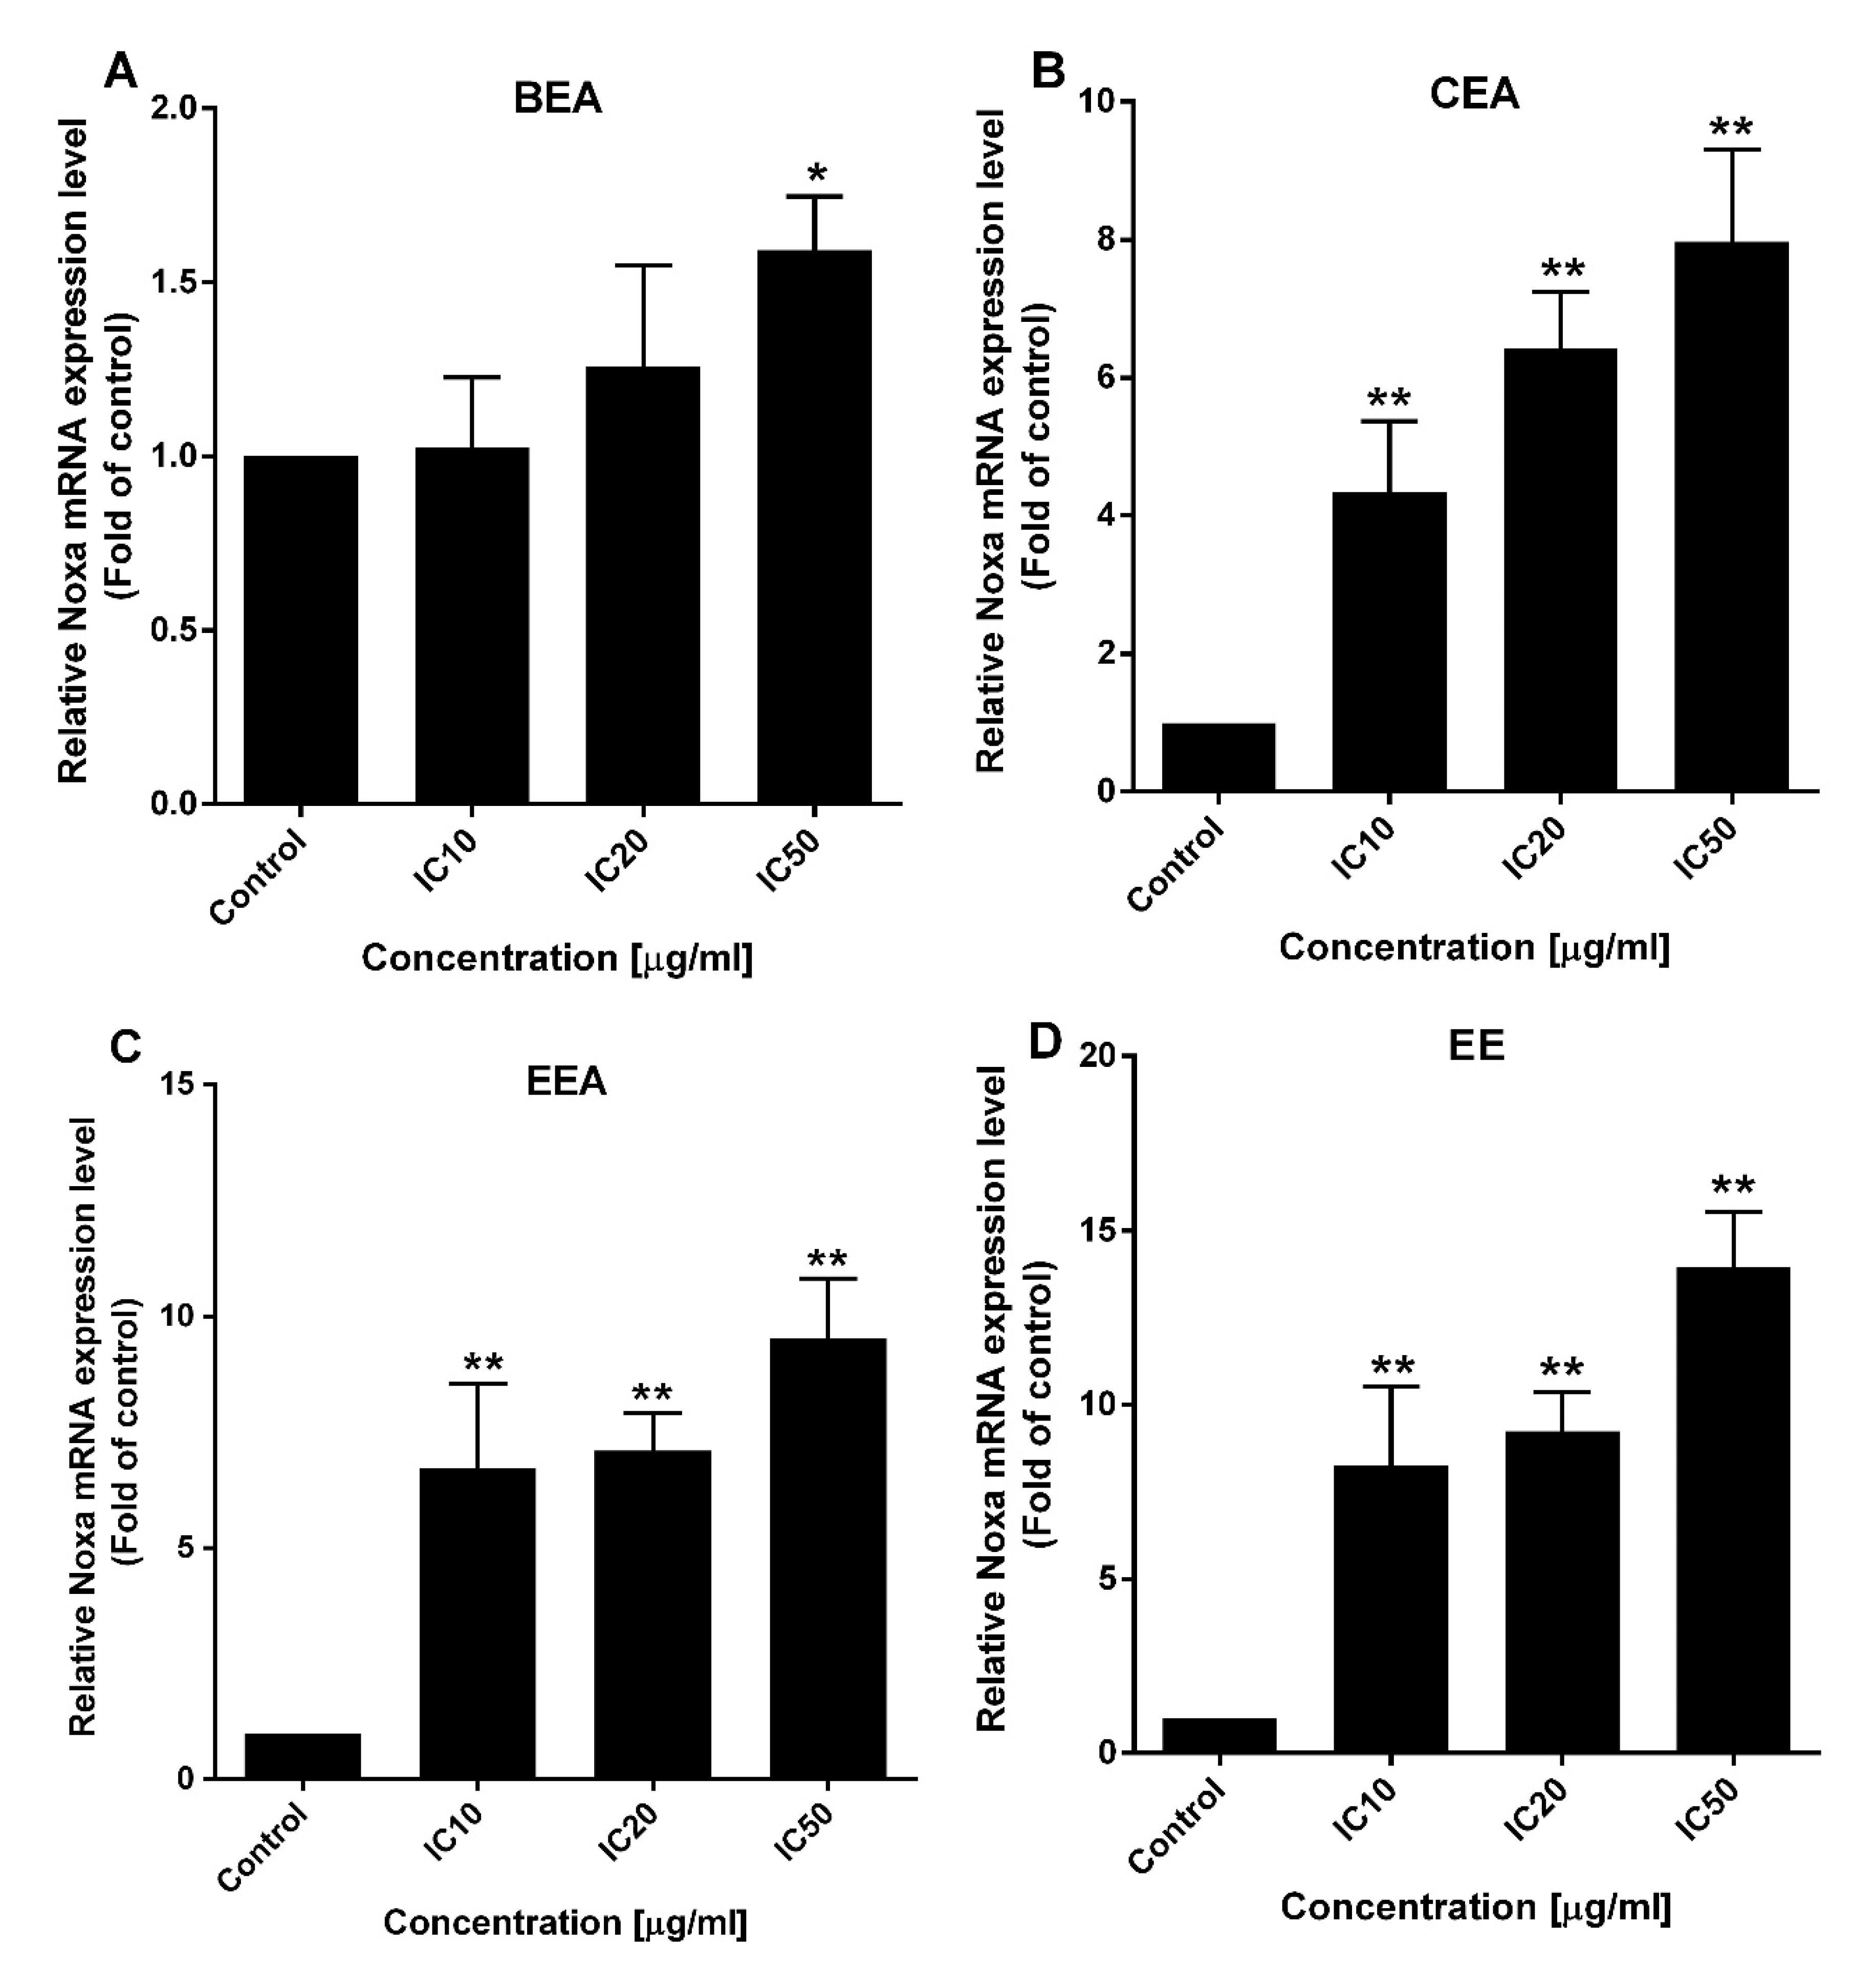
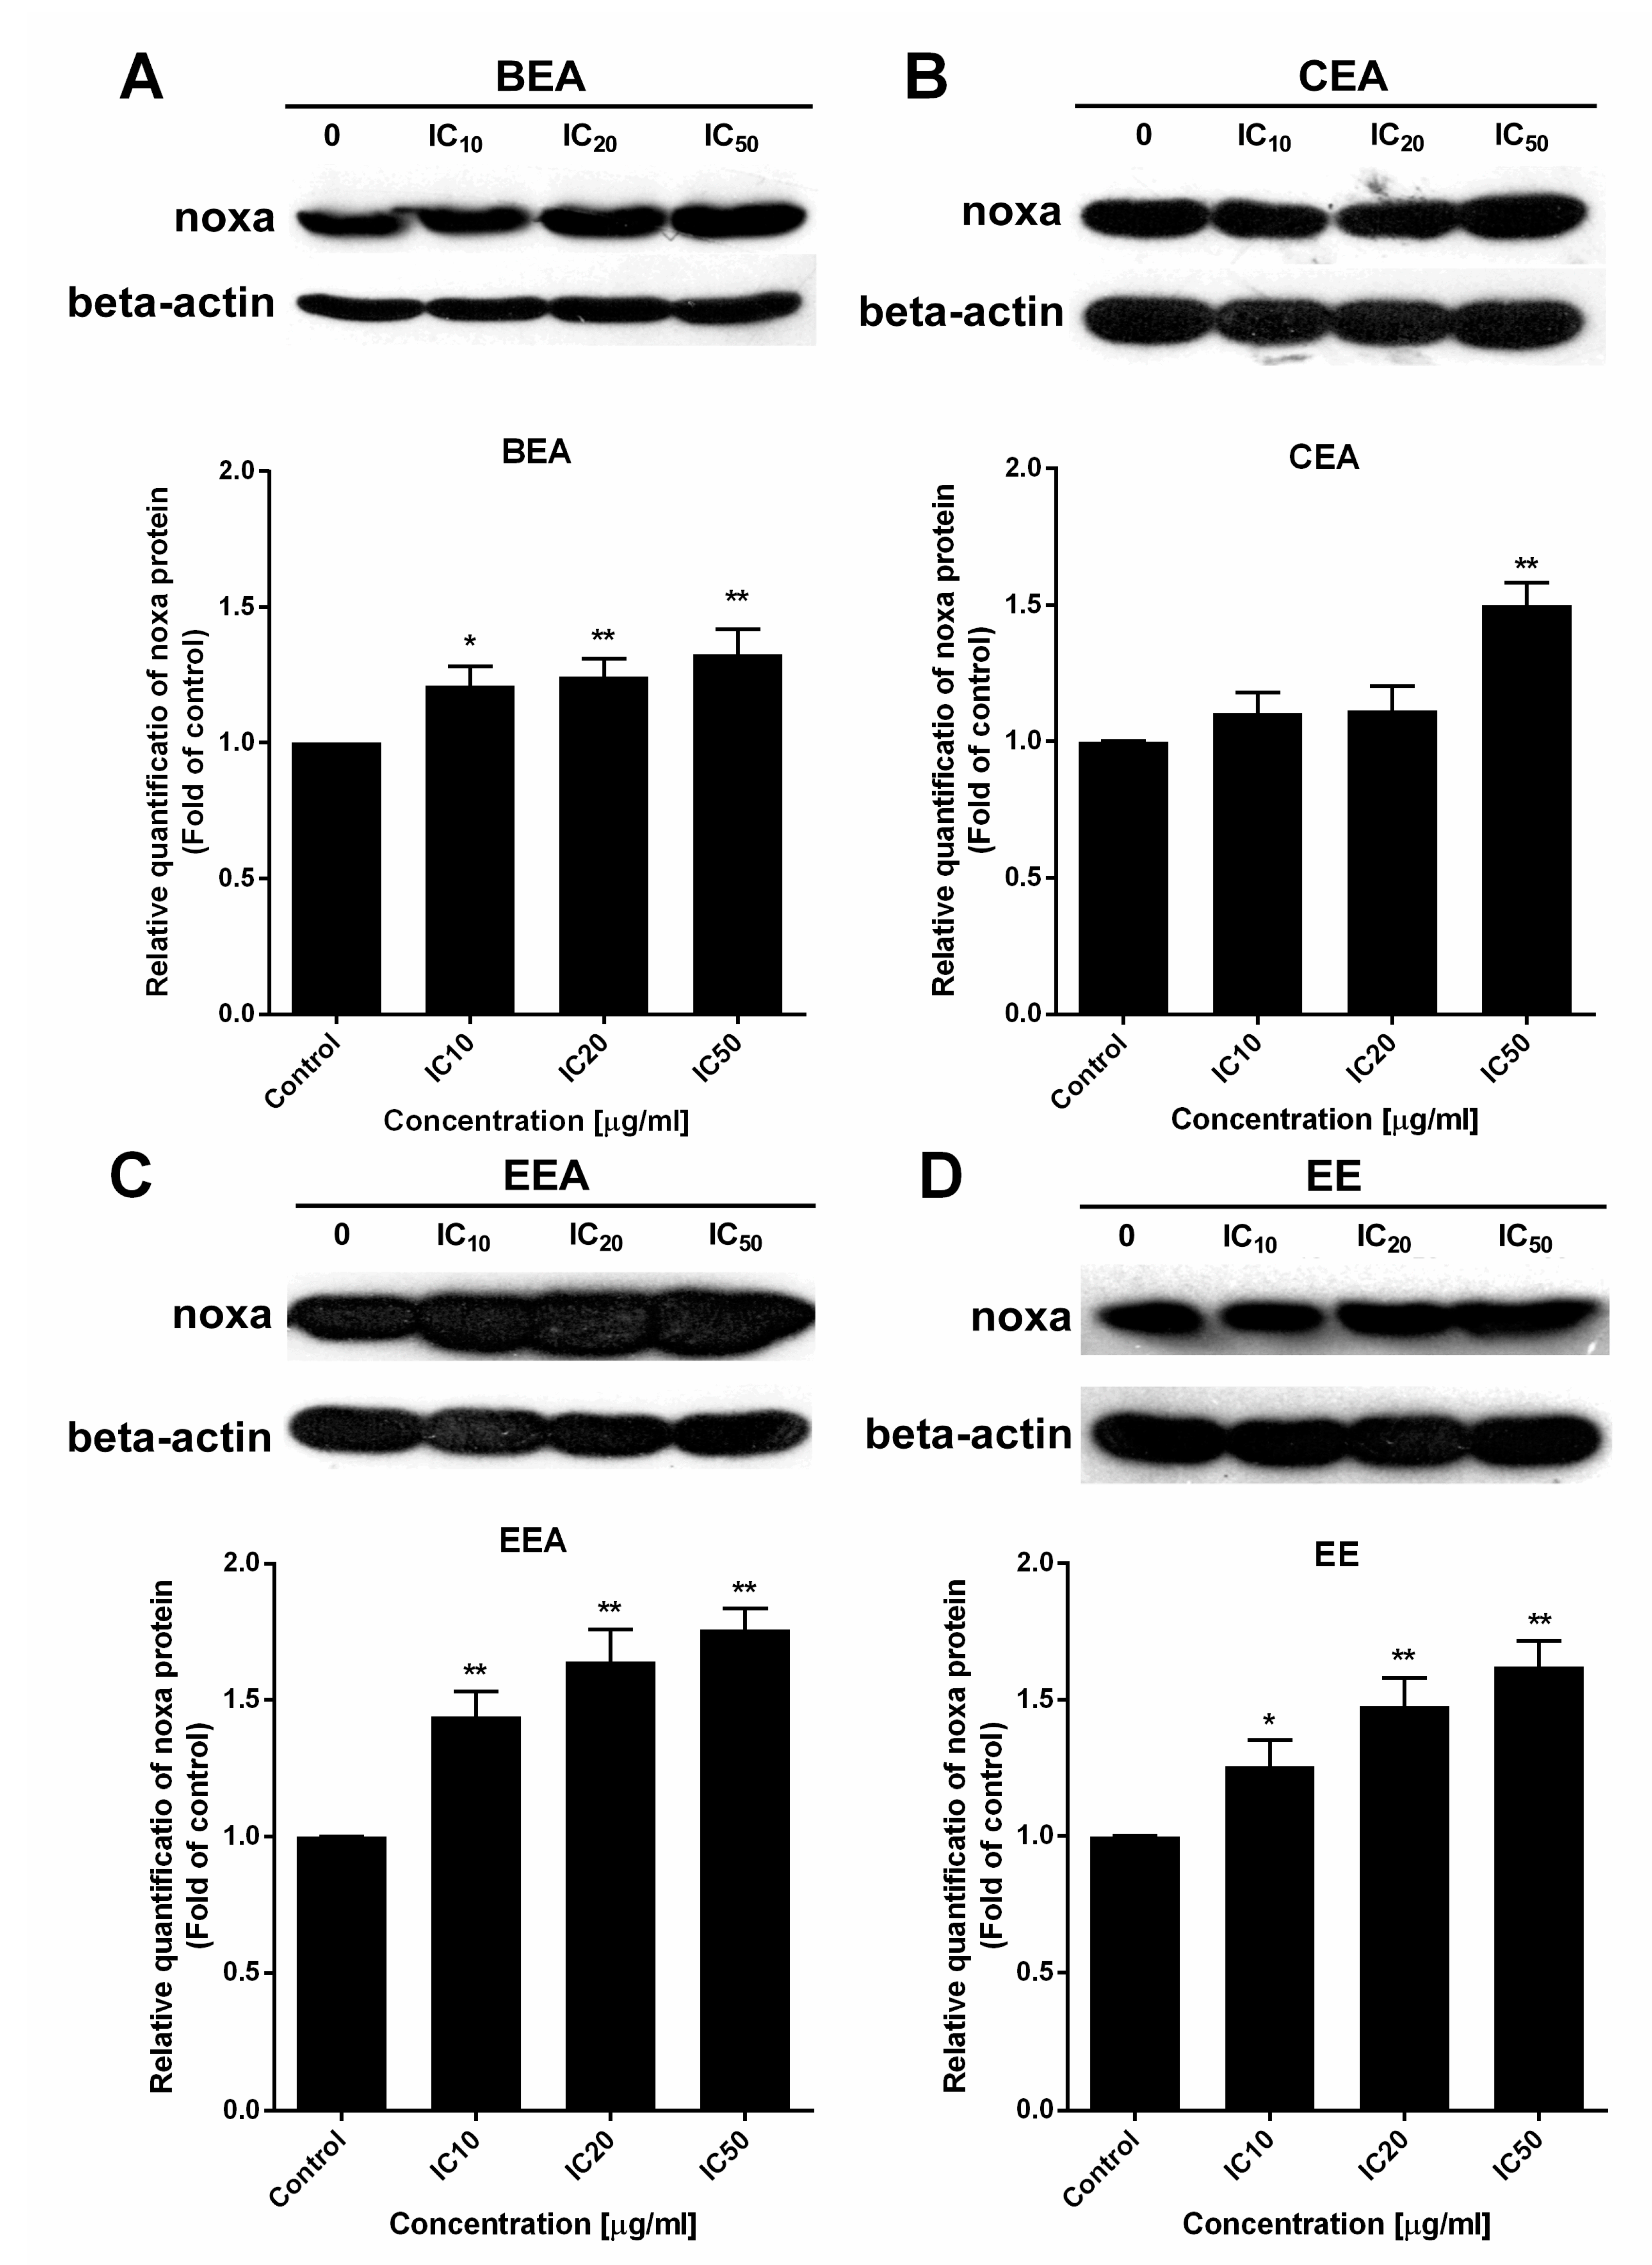
Apoptotic pathways require several protein functions. The Bcl-2 family proteins play important roles in the apoptosis pathway. The two main types of these proteins are pro-apoptotic and anti-apoptotic. There are two different subgroups of pro-apoptotic protein, activator and effector. The BH3-only activators promote the multidomain effector forming of pores on the mitochondrial outer membrane leading to ∆Ψm loss and initiating the apoptotic programmed cell death [67]. Noxa, a BH3-only activator, was examined for the upregulation of both gene and protein expression levels to indicate the ∆Ψm loss and cell apoptosis resulting from the function of the Bcl-2 family. The effective extracts induced ROS generation and Noxa upregulation in A549 cells leading to a loss of ∆Ψm and apoptotic cell death via the mitochondrial pathway.
Human cancer-derived cells are elementarily used as a model to study cancer biology and to analyze the efficacy of therapeutic anti-cancer agents. These cells are effective because they can be easily cultured and they have a long lifespan [68]. However, cancer cells possess a high heterogeneity. Cancer cell lines may have a limitation in representing these complicated cancer diseases [69]. Primary cancer cells are used to mimic the in vivo cancer cells better than cancer cell lines. These compounds have more predictive values and can be more useful in new drug discovery [70,71]. In this study we established both primary lung cancer cells and normal lung cells were obtained from the same patients in a cultured model in the mimicry of in vivo. The normal histology and cancer tissue pathology were proved by a pathologist from the Department of Pathology, Maharaj Nakorn Chiang Mai Hospital, Faculty of Medicine, Chiang Mai University, Chiang Mai, Thailand. The patients’ characteristics are shown in Table 7. The molecular test of EGFR mutation predicted the response rates of tyrosine kinase inhibitors (TKIs) treatment in the lung cancer patients. The overexpression of EGFR has been reported in many cancers including NSCLC, which leads to cell proliferation and anti-apoptosis [72]. Therefore, the studies of a subset of NSCLC patients with EGFR mutant tumors, and initial therapy with TKIs appears to be a significant survival advantage [73]. Greater than 90% of EGFR mutation in NSCLC occurs as short in frame shift deletions in exon 19 or as point mutations in exon 21 [74]. In this study there were three patients with EGFR wild types, three patients with EGFR mutations and another three with an unknown EGFR status as shown in Table 7.
The primary cells were collected and were determined as either sensitive or resistant samples towards the inhibitory growth effect of lung cancers and normal lung cells. This indicated the effectiveness of each substance at IC50. The number of sensitive samples showed that CEA and EE were effective against cancer samples from every patient, but no sample was sensitive to BEA and EEA. The IC50 values in cancer cells showed that EE was the most effective extract (lowest IC50) in primary lung cancer cells, which corresponded to the A549 cell line result in this study. The IC50 of the substances against primary cells have a wide range of SD because the primary cells possessed various considerable heterogeneous properties, such as the expression levels of oncogenes, tumor suppressor genes, and multi-drug resistance genes. Moreover, comparing IC50 values of cancer and normal samples using the p-value in Table 8 demonstrated that the IC50 of EE against cancer samples was significantly different from that of the normal samples (p < 0.05). However, the data in Table 8 is a univariate analysis without confounding variable control and univariate analyses can yield misleading results. In this case, the multivariate analysis was more appropriate [75]. The multi-level random effects model was used for calculating the mean difference of IC50 comparing cancer samples and normal samples. Mean differences of IC50 for EE, and Doxorubicin and Vinblastine against cancer were less than those of normal samples (negative values) but only the p-value of EE (p-value = 0.04) exhibited a significant result (p < 0.05). There are many factors in the primary culture which made the results hard to be interpreted and repeated. The primary cell culture is difficult to establish without contamination. It is hard to obtain and has a limitation for cultured cell passages. Hence, there was no further examination for the modes of cell death in the primary cancer cells or in the normal lung cells due to such limiting factors.
In this study, EE exhibited the highest effect according to the lowest IC50 against A549 cell line and primary lung cancer cells. Also, it induced the synergistic effect in combined treatment with ETS or MTX. However, the effect of EE in apoptosis induction and ∆Ψm reduction was less effective than the other three effective extracts, whereas EE induced ROS generated around 1.5-fold of control which was the same as the other three extracts. This suggests the cytotoxicity of EE may be the result of EE induced in other mechanism(s) over mitochondrial apoptosis. Although, Noxa gene expression was at different levels between each extract, the protein which is the functional molecule, was increased in the similar level in each extract. This indicates Noxa might not be the key different effect of these four effective extracts. Therefore, more details of the mechanisms inducing lung cancer cell death by each extract need to be investigated in further studies.

4. Experimental Sections

4.1. Plant Materials

Twigs of the three herbs were collected and authenticated by Professor Dr. Bungorn Sripanidkulchai, Center for Research and Development of Herbal Health Products, Department of Pharmaceutical Chemistry, Faculty of Pharmaceutical Sciences, Khon Kaen University, Khon Kaen, Thailand. The voucher numbers are TT-OC-SK-1253, TT-OC-SK- 1215, and TT-OC-SK-1082 for B. ovata, C. oblongifolius, and E. succirubrum, respectively. The herbs were washed, cut, dried, and mashed. The herb powders were macerated with 50% ethanol or ethyl acetate at room temperature for 72 h. Then, the plant macerations were filtered and centrifuged at 500× g for 10 min and the supernatant was collected. The supernatant extracts were concentrated under rotary evaporator.

4.2. Reagents

Dulbecco’s Modified Eagle Medium (DMEM), Roswell Park Memorial Institute (RPMI)-1640, fetal bovine serum (FBS), phosphate-buffered saline (PBS), trypsin-EDTA solution, penicillin, and streptomycin were purchased from GIBCO-Invitrogen (Carlsbad, CA, USA). Small Airway Epithelial Cell Growth Medium (SAGM) and its supplement; bovine pituitary extract (BPE), insulin, hydrocortisone, gentamicin-amphotericin (GA)-1000, retinoic acid, bovine serum albumin-fatty acid free (BSA-FAF), transferrin, triiodothyronine, epinephrine, and human epidermal growth factor (hEGF) were purchased from Lonza (Walkersville, MD, USA). Collagenase and elastase were obtained from Worthington Biochemical (Lakewood, NJ, USA). Histopaque-1077, 3-(4,5-dimethyl-2-thiazolyl)-2,5-diphenyltetrazolium bromide (MTT), 3,3′-dihexyloxacarbocyanine iodide (DiOC6), propidium iodide (PI), and 2′,7′-dichlorodihydrofluoresceine diacetate (DCFH-DA) were purchased from Sigma Chemica (St. Louis, MO, USA). Annexin V-FITC/PI kit was obtained from Roche, Mannheim, Germany. Tiangen RNA prep pure kit was purchased from Tiangen Biotech (Beijing, China). SensiFAST SYBR Lo-ROX kit from Bioline (Taunton, MA, USA). RevertAid first-strand cDNA synthesis kit and primers were obtained from Thermo Fisher Scientific (Waltham, MA, USA). Antibodies against Noxa and β-Actin, and HRP-conjugated secondary antibody were purchased from Abcam (Cambridge, UK). SuperSignal West Pico Chemiluminecent Substrate was obtained from Pierce (Rockford, IL, USA).

4.3. Cells Culture

A549 is the human adenocarcinoma cell line that was obtained from American Type Culture Collection (ATCC, Manassas, VA, USA). The cells were cultured in DMEM supplemented with 10% FBS, 100 Units/mL penicillin, and 100 µg/mL streptomycin. Cells were grown at 37 °C in a 5% CO2 atmosphere.
PBMCs were obtained from a buffy coat bag from volunteers at Blood Bank Unit, with the informed consent signed, whereas the approval was available from the Ethic Committee of the Maharaj Nakorn Chiang Mai Hospital, Faculty of Medicine, Chiang Mai University as the project code BIO-2558-03332. The cells in the buffy coat were separated by histopaque-1077 following density gradient centrifugation standard protocol. The PBMCs were cultured in RPMI-1640 medium and supplemented with 10% FBS, 2 mM glutamine, 100 Units/mL penicillin, and 100 µg/mL streptomycin at 37 °C in a 5% CO2 atmosphere [76].

4.4. Cytotoxicity Test

The cytotoxicity of the extracts and chemotherapy drugs was determined to analyze their inhibitory effects on A549 cells and PBMCs growth by MTT assay as previously described [77]. The cells were treated with the extracts and/or chemotherapy drugs at various concentrations for 24 h, and more 48- and 72-h treatment for the cytotoxicity screening of the extracts. The treatments used a final concentration of DMSO of less than 0.2% to avoid DMSO vehicle toxicity. The percentages of reduction in cell viability were compared to untreated control cells and then the inhibitory concentration (IC) values were calculated. The combined effects of the extracts and chemotherapeutic drugs were determined by the Chou-Talalay method on CompuSyn software using the cell viability results from MTT assay [62].

4.5. GC-MS Analysis

The GC-MS analysis of the effective extracts (BEA, CEA, EEA, and EE) were performed with Agilent technology GC 7890A coupled to Agilent technology MSD 5975C (EI) (Agilent, Santa Clara, CA, USA). The extracts were separated in a DB-5MS fused silica capillary column (30 m × 0.25 mm, 0.25 µm film thickness). The conditions of the GC were maintained operating at a temperature held at 50 °C for 3 min, and increased from 50 to 300 °C at a rate of 5 °C/min. The final isothermal was held for 20 min. The injector temperature was set at 250 °C with a 1.0 µL injection volume in 1:1 split mode. The detector temperature was set at 280 °C. Helium was used as a carrier gas with a 1 mL/min flow rate. The mass spectrometer was operated in electron impact mode at 70 eV and scanned from 50 to 550 amu. The compounds were identified by a comparison of the mass spectra and retention times through computer matching to the National Institute Standard and Technology (NIST) library (Gaithersburg, MD, USA) as well as with literature data.

4.6. Detection of Apoptotic Cell Morphology

Cell morphology was determined by PI staining, which stains the nuclei to observe the condensed nuclei and fragmented or apoptotic bodies. The cells were cultured on a coverslip and then treated with the effective extracts at IC10, IC20, and IC50 for 24 h. The cells were stained with the PI method as previously described [78]. Then, the cells were examined under a fluorescence microscope (Olympus, Japan). A total of 200 cells (condensed nuclei and fragmented cells) per slide were recorded for apoptotic cells.

4.7. Apoptosis Determination Method

The Annexin V-FITC/PI assay is used to investigate cells which undergo apoptosis. Apoptosis cells are positive for annexin V (early apoptosis) or annexin V with PI (late apoptosis/necrosis) and are detected by a flow cytometer. After the cells were treated with the effective extracts at IC10, IC20, and IC50 for 24 h, they were stained with annexin V-FITC and PI for 15 min. The stained cells were measured by a flow cytometer (Becton Dickinson, Frankin Lakes, NJ, USA) and analyzed with Cell Quest software program [79].

4.8. Assessment of Mitochondrial Depolarization

Depolarization of the ∆Ψm occurs during apoptosis. The changing of ∆Ψm is determined by DiOC6, which is a cationic fluorescence dye. The cells were treated with the effective extracts at IC10, IC20, and IC50 for 24 h and then stained with DiOC6 at a final concentration of 40 nM for 15 min. Then, the cells were washed and analyzed by a flow cytometer (Becton Dickinson, Frankin Lakes, NJ, USA) [80].

4.9. Measurement of Intracellular ROS Generation

The intracellular ROS levels were measured by a fluorescence dye called DCFH-DA. After treatment with the effective extracts at IC10, IC20, and IC50 and 0.3% of H2O2 (positive control) for 4 h, the cells were stained with DCFH-DA at a final concentration of 2 µM for 30 min. Then, fluorescence was detected using a fluorescence microplate reader, and was measured at 485 nm excitation and 525 nm emission wavelengths [81].

4.10. Gene Expression Analysis

After treatment of the cells with the effective extracts at IC10, IC20, and IC50 for 24 h, the total RNA was extracted using Tiangen RNAprep pure kit and then reverse transcribed to cDNA using a RevertAid first-strand cDNA synthesis kit. The mRNA expressions of Noxa were quantified by SensiFAST SYBR Lo-ROX on a 7500 Fast Real-time PCR system. The relative gene expression level was analyzed by 2−∆∆Ct, using GAPDH as a housekeeping gene. The primers of Noxa that were used: F-5′GCTGGAAGTCGAGTGTGCTA3′ and R-5′CCTGAGCAGAAGAGTTTGGA3′; and GAPDH: F-5′TGCACCACCAACTGCTTAGC3′ and R-5′GGCATGGACTGTGGTCATGAG3′ [82].

4.11. Protein Expression Analysis

The cells were treated with the effective extracts at IC10, IC20, and IC50 for 24 h. Then, the proteins were determined at the concentration previously described [82]. Western blot analysis was conducted by the method described previously [78]. Briefly, protein extracts were subjected to 15% SDS-PAGE and blotted onto 0.45 µM nitrocellulose membranes which were incubated with Noxa antibody overnight. Then, after incubation with HRP-conjugated secondary antibody, protein bands were developed with chemiluminescence substrate and X-ray film exposure. The protein band intensity was analyzed by ImageJ software and β-actin was normalized and used as a protein loading control.

4.12. Lung Sample Processing

Normal lung tissue (n = 7) and cancer lung tissues (n = 9) were collected by Assistant Professor Apichat Tantraworasin, M.D., and his team of surgeons, General Thoracic Surgery Unit, Department of Surgery, Faculty of Medicine, Chiang Mai University, Chiang Mai, Thailand. The patients were informed and consent forms were signed before lung cancer tissues and normal tissues were obtained at the Operation Room, Department of Surgery, Maharaj Nakorn Chiang Mai Hospital, Faculty of Medicine, Chiang Mai University with the approval of the ethics committee referenced with the ethics number REC-25600901-11296 and project code BIO-2558-03332.
The lung tissues were immediately put into RPMI-1640 media and supplemented with 100 U/mL penicillin G and 100 µg/mL streptomycin. They were then transported to the lab. The blood clots, blood vessels and connective tissue were removed from the tissues, and then washed with sterile PBS twice. Next, they were cut into small pieces (~1 mm3) using a scalpel. The small pieces of tissues were incubated with collagenase at 50 units/mL and elastase at 10 units/mL at 37 °C and gently shaken every 15 min for 2 h. The digested tissues were passed through a 38 µm mesh sieve to collect the cells. Then, the cell suspension was washed twice by PBS and centrifuged at 300× g for 10 min. The cells were cultured in a Small Airway Epithelial Cell Growth Medium (SAGM) supplemented with bovine pituitary extract 2.0 mL, insulin 0.5 mL, hydrocortisone 0.5 mL, GA-1000 0.5 mL, retinoic acid 0.5 mL, bovine serum albumin-fatty acid free 5 mL, transferrin 0.5 mL, triiodothyronine 0.5 mL, epinephrine 0.5 mL, and hEGF 0.5 mL. The cultures were maintained at 37 °C in a humidified incubator with 5% CO2 [83,84]. The primary cells were cultured until passage 3 then the cells were treated with the effective extracted and chemotherapeutics drugs for 24 h and tested the cytotoxicity by MTT assay.

4.13. Statistical Analysis

The data was presented as a mean ± SD from three independent experiments. Statistical differences between the control (non-treatment) and treatment groups were determined by one-way ANOVA (Dunnett’s multiple comparisons test). The statistical significance is expressed as * p < 0.05, ** p < 0.01, *** p < 0.001. For primary cells the data in normal distribution was reported as a mean ± SD and was compared to the difference between cancer groups and normal groups by an unpaired t-test. Alternatively, non-normal distribution data was reported in median (interquartile range) and the statistical difference between groups was determined by a Wilcoxon rank-sum test. Lung cancer tissue and normal tissue were collected from the same patients. Therefore, the data was comparably correlated. The mean difference of the correlated data was analyzed by a multi-level random effects model which adjusted the IC50 by age, gender, cell type, and tumor size.

5. Conclusions

In summary, we investigated the potential of three Thai medicinal plants to be used for lung cancer treatment. B. ovata, C. oblongifolius, and E. succirubrum were extracted using ethyl acetate and ethanol as solvents to obtain BEA, CEA, and EEA and to get BE, CE, EE from all three herbs. Four of these extracts (BEA, CEA, EEA, and EE) induced human lung cancer cell apoptosis in the A549 cell line. Apoptotic induction occurred through the mitochondrial pathway which was evidenced by the ∆Ψm loss, ROS generation and upregulation of Noxa gene and Noxa pro-apoptotic protein. Moreover, the combination treatment between the extracts and conventional chemotherapeutic drugs showed a synergism of the three in combination, which were MTX with BEA, MTX with EE, and ETS with EE. We also investigated the cytotoxicity of the effective extracts against primary lung cancer cells. A significant result occurred when treating the cells with EE, the ethanolic extract of E. succirubrum. This was the most effective extract against both the A549 cancer cell line and the primary lung cancer cells. This suggests that further investigation should be further performed on this EE extract to explore its potential use as an anticancer agent in an in vivo model.

Author Contributions

J.P. and R.B. designed the study. J.P., P.K.-o. and S.S. (Subhawat Subhawa) performed the biochemistry experiments. J.P. wrote the manuscript. B.S. collected and identified the herbs and took responsibility for the extraction. A.T., S.S. (Somcharoen Saeteng) and S.S. (Sopon Siwachat) collected the lung tissues from lung cancer patients, analyzed the patients’ results with appropriate statistical analysis. N.L. reported patients’ characteristic tissue pathology and status of EGFR gene. R.B. is the corresponding author. All authors have read and agreed to the published version of the manuscript.

Funding

This work was supported by Research and Researchers for Industries (RRi) for Juthathip Poofery (PHD58I0008), Endowment Research Fund of Faculty of Medicine, Chiang Mai University (038/2018) for Ratana Banjerdpongchai; Graduate Student Supportive Fund from Faculty of Medicine, Chiang Mai University for Juthathip Poofery, and National Research Council of Thailand (NRCT).

Acknowledgments

We would like to thank the Medical Science Research Equipment Center (MSREC), Faculty of Medicine, Chiang Mai University for its experimental facilities.

Conflicts of Interest

All authors declare no known conflict of interest associated with this publication and there has been no significant financial support for this work that could have influenced its outcome.

References

  1. Barta, J.A.; Powell, C.A.; Wisnivesky, J.P. Global Epidemiology of Lung Cancer. Ann. Glob. Health 2019, 85. [Google Scholar] [CrossRef] [PubMed] [Green Version]
  2. Bray, F.; Ferlay, J.; Soerjomataram, I.; Siegel, R.L.; Torre, L.A.; Jemal, A. Global cancer statistics 2018: GLOBOCAN estimates of incidence and mortality worldwide for 36 cancers in 185 countries. CA Cancer J. Clin. 2018, 68, 394–424. [Google Scholar] [CrossRef] [PubMed] [Green Version]
  3. Malhotra, J.; Malvezzi, M.; Negri, E.; La Vecchia, C.; Boffetta, P. Risk factors for lung cancer worldwide. Eur. Respir. J. 2016, 48, 889–902. [Google Scholar] [CrossRef] [PubMed] [Green Version]
  4. Lam, W.K.; White, N.W.; Chan-Yeung, M.M. Lung cancer epidemiology and risk factors in Asia and Africa. Int. J. Tuberc. Lung Dis. 2004, 8, 1045–1057. [Google Scholar] [PubMed]
  5. Rankantha, A.; Chitapanarux, I.; Pongnikorn, D.; Prasitwattanaseree, S.; Bunyatisai, W.; Sripan, P.; Traisathit, P. Risk patterns of lung cancer mortality in northern Thailand. BMC Public Health 2018, 18, 1138–1146. [Google Scholar] [CrossRef]
  6. Matsuda, T.; Machii, R. Morphological distribution of lung cancer from Cancer Incidence in Five Continents Vol. X. Jpn. J. Clin. Oncol. 2015, 45, 404. [Google Scholar] [CrossRef] [Green Version]
  7. Sosa Iglesias, V.; Giuranno, L.; Dubois, L.J.; Theys, J.; Vooijs, M. Drug Resistance in Non-Small Cell Lung Cancer: A Potential for NOTCH Targeting? Front. Oncol. 2018, 8, 267. [Google Scholar] [CrossRef] [Green Version]
  8. Rayan, A.; Raiyn, J.; Falah, M. Nature is the best source of anticancer drugs: Indexing natural products for their anticancer bioactivity. PLoS ONE 2017, 12, e187925. [Google Scholar] [CrossRef]
  9. Amaral, R.G.; dos Santos, S.A.; Andrade, L.N.; Severino, P.; Carvalho, A.A. Natural Products as Treatment against Cancer: A Historical and Current Vision. Clin. Oncol. 2019, 4, 1–5. [Google Scholar]
  10. Chotchoungchatchai, S.; Saralamp, P.; Jenjittikul, T.; Pornsiripongse, S.; Prathanturarug, S. Medicinal plants used with Thai Traditional Medicine in modern healthcare services: A case study in Kabchoeng Hospital, Surin Province, Thailand. J. Ethnopharmacol. 2012, 141, 193–205. [Google Scholar] [CrossRef]
  11. Boonyaratavej, S.; Tantayanontha, S.; Kitchanachai, P.; Chaichantipyuth, C.; Chittawong, V.; Miles, D.H. trans-Triacontyl-4-hydroxy-3-methoxycinnamate, a New Compound from the Thai Plant Bridelia ovata. J. Nat. Prod. 1992, 55, 1761–1763. [Google Scholar] [CrossRef]
  12. Thongkorn, N. Chemical Constituents of the Leaves of Bridelia ovata Decne. Ph.D. Thesis, Chulalongkorn University, Bangkok, Thailand, 1994. [Google Scholar]
  13. Baig, H.; Diskul-Na-Ayudthaya, P.; Weeraphan, C.; Paricharttanakul, M.; Svasti, J.; Srisomsap, C. Inhibitory effect of Bridelia ovata Decne extract on HepG2 cell migration and invasion stimulated by fibroblast-conditioned media. Naresuan Phayao J. 2015, 1, 6–10. [Google Scholar]
  14. Salatino, A.; Salatino, M.L.F.; Negri, G. Traditional uses, Chemistry and Pharmacology of Croton species (Euphorbiaceae). J. Braz. Chem. Soc. 2007, 18, 11–33. [Google Scholar] [CrossRef]
  15. Takeshige, Y.; Kawakami, S.; Matsunami, K.; Otsuka, H.; Lhieochaiphant, D.; Lhieochaiphant, S. Oblongionosides A-F, megastigmane glycosides from the leaves of Croton oblongifolius Roxburgh. Phytochemistry 2012, 80, 132–136. [Google Scholar] [CrossRef] [PubMed]
  16. Roengsumran, S.; Petsom, A.; Kuptiyanuwat, N.; Vilaivan, T.; Ngamrojnavanich, N.; Chaichantipyuth, C.; Phuthong, S. Cytotoxic labdane diterpenoids from Croton oblongifolius. Phytochemistry 2001, 56, 103–107. [Google Scholar] [CrossRef]
  17. Sommit, D.; Petsom, A.; Ishikawa, T.; Roengsumran, S. Cytotoxic activity of natural labdanes and their semi-synthetic modified derivatives from Croton oblongifolius. Planta Med. 2003, 69, 167–170. [Google Scholar] [CrossRef] [PubMed]
  18. Pudhom, K.; Sommit, D. Clerodane diterpenoids and a trisubstituted furan from Croton oblongifolius. Phytochem. Lett. 2011, 4, 147–150. [Google Scholar] [CrossRef]
  19. Roengsumran, S.; Musikul, K.; Petsom, A.; Vilaivan, T.; Sangvanich, P.; Pornpakakul, S.; Puthong, S.; Chaichantipyuth, C.; Jaiboon, N.; Chaichit, N. Croblongifolin, a new anticancer clerodane from Croton oblongifolius. Planta Med. 2002, 68, 274–277. [Google Scholar] [CrossRef]
  20. Youngsa-ad, W.; Ngamrojanavanich, N.; Mahidol, C.; Ruchirawat, S.; Prawat, H.; Kittakoop, P. Diterpenoids from the roots of Croton oblongifolius. Planta Med. 2007, 73, 1491–1494. [Google Scholar] [CrossRef]
  21. Roengsumran, S.; Pornpakakul, S.; Muangsin, N.; Sangvanich, P.; Nhujak, T.; Singtothong, P.; Chaichit, N.; Puthong, S.; Petsom, A. New halimane diterpenoids from Croton oblongifolius. Planta Med. 2004, 70, 87–89. [Google Scholar] [CrossRef]
  22. Pudhom, K.; Vilaivan, T.; Ngamrojanavanich, N.; Dechangvipart, S.; Sommit, D.; Petsom, A.; Roengsumran, S. Furanocembranoids from the stem bark of Croton oblongifolius. J. Nat. Prod. 2007, 70, 659–661. [Google Scholar] [CrossRef] [PubMed]
  23. Roengsumran, S.; Achayindee, S.; Petsom, A.; Pudhom, K.; Singtothong, P.; Surachetapan, C.; Vilaivan, T. Two new cembranoids from Croton oblongifolius. J. Nat. Prod. 1998, 61, 652–654. [Google Scholar] [CrossRef]
  24. Roengsumran, S.; Singtothong, P.; Pudhom, K.; Ngamrochanavanich, N.; Petsom, A.; Chaichantipyuth, C. Neocrotocembranal from Croton oblongifolius. J. Nat. Prod. 1999, 62, 1163–1164. [Google Scholar] [CrossRef] [PubMed]
  25. Weerapreeyakul, N.; Junhom, C.; Barusrux, S.; Thitimetharoch, T. Induction of apoptosis in human hepatocellular carcinoma cells by extracts of Lannea coromandelica (Houtt.) Merr. and Diospyros castanea (Craib) Fletcher. Chin. Med. 2016, 11, 1–10. [Google Scholar] [CrossRef] [Green Version]
  26. Miyagawa, T.; Ohtsuki, T.; Koyano, T.; Kowithayakorn, T.; Ishibashi, M. Cassaine diterpenoid dimers isolated from Erythrophleum succirubrum with TRAIL-resistance overcoming activity. Tetrahedron Lett. 2009, 50, 4658–4662. [Google Scholar] [CrossRef] [Green Version]
  27. Elmore, S. Apoptosis: A review of programmed cell death. Toxicol. Pathol. 2007, 35, 495–516. [Google Scholar] [CrossRef]
  28. Tokar, T.; Ulicny, J. The mathematical model of the Bcl-2 family mediated MOMP regulation can perform a non-trivial pattern recognition. PLoS ONE 2013, 8, e81861. [Google Scholar] [CrossRef]
  29. Hongmei, Z. Extrinsic and Intrinsic Apoptosis Signal Pathway Review. In Apoptosis and Medicine; Ntuli, T., Ed.; IntechOpen: London, UK, 2012. [Google Scholar] [CrossRef] [Green Version]
  30. Chou, T.C. Preclinical versus clinical drug combination studies. Leuk Lymphoma 2008, 49, 2059–2080. [Google Scholar] [CrossRef]
  31. Ravagnan, L.; Roumier, T.; Kroemer, G. Mitochondria, the killer organelles and their weapons. J. Cell. Physiol. 2002, 192, 131–137. [Google Scholar] [CrossRef]
  32. Nita, M.; Grzybowski, A. The Role of the Reactive Oxygen Species and Oxidative Stress in the Pathomechanism of the Age-Related Ocular Diseases and Other Pathologies of the Anterior and Posterior Eye Segments in Adults. Oxid. Med. Cell. Longev. 2016, 2016, 1–23. [Google Scholar] [CrossRef] [Green Version]
  33. Campbell, K.J.; Tait, S.W.G. Targeting BCL-2 regulated apoptosis in cancer. Open Biol. 2018, 8, 1–11. [Google Scholar] [CrossRef] [PubMed]
  34. Moraes, D.F.C.; de Mesquita, L.S.S.; do Amaral, F.M.M.; de Sousa Ribeiro, M.N.; Malik, S. Anticancer Drugs from Plants. In Biotechnology and Production of Anti-Cancer Compounds; Malik, S., Ed.; Springer International Publishing: Cham, Switzerland, 2017; pp. 121–142. [Google Scholar] [CrossRef]
  35. Kaplan, A.; Akalin Ciftci, G.; Kutlu, H.M. The apoptotic and genomic studies on A549 cell line induced by silver nitrate. Tumour Biol. 2017, 39, 1–12. [Google Scholar] [CrossRef] [PubMed] [Green Version]
  36. Badisa, R.B.; Darling-Reed, S.F.; Joseph, P.; Cooperwood, J.S.; Latinwo, L.M.; Goodman, C.B. Selective cytotoxic activities of two novel synthetic drugs on human breast carcinoma MCF-7 cells. Anticancer Res. 2009, 29, 2993–2996. [Google Scholar] [PubMed]
  37. Prayong, P.; Barusrux, S.; Weerapreeyakul, N. Cytotoxic activity screening of some indigenous Thai plants. Fitoterapia 2008, 79, 598–601. [Google Scholar] [CrossRef]
  38. Lu, B.; Liu, L.; Zhen, X.; Wu, X.; Zhang, Y. Antitumour activity of triterpenoid-rich extract from bamboo shavings (Caulis bamfusae in Taeniam). Afr. J. Biotechnol. 2010, 9, 6430–6436. [Google Scholar]
  39. Martucciello, S.; Balestrieri, M.L.; Felice, F.; Estevam Cdos, S.; Sant’Ana, A.E.; Pizza, C.; Piacente, S. Effects of triterpene derivatives from Maytenus rigida on VEGF-induced Kaposi’s sarcoma cell proliferation. Chem. Biol. Interact. 2010, 183, 450–454. [Google Scholar] [CrossRef]
  40. Subash-Babu, P.; Li, D.K.; Alshatwi, A.A. In vitro cytotoxic potential of friedelin in human MCF-7 breast cancer cell: Regulate early expression of Cdkn2a and pRb1, neutralize mdm2-p53 amalgamation and functional stabilization of p53. Exp. Toxicol. Pathol. 2017, 69, 630–636. [Google Scholar] [CrossRef]
  41. Fernando, I.P.S.; Sanjeewa, K.K.A.; Ann, Y.S.; Ko, C.I.; Lee, S.H.; Lee, W.W.; Jeon, Y.J. Apoptotic and antiproliferative effects of Stigmast-5-en-3-ol from Dendronephthya gigantea on human leukemia HL-60 and human breast cancer MCF-7 cells. Toxicol. In Vitro 2018, 52, 297–305. [Google Scholar] [CrossRef]
  42. Ghisalberti, E.L. The Biological Activity of Naturally Occurring Kaurane Diterpenes. Fitoterapia 1997, 68, 303–325. [Google Scholar]
  43. Cavalcanti, B.C.; Bezerra, D.P.; Magalhães, H.I.F.; Moraes, M.O.; Lima, M.A.S.; Silveira, E.R.; Câmara, C.A.G.; Rao, V.S.; Pessoa, C.; Costa-Lotufo, L.V. Kauren-19-oic acid induces DNA damage followed by apoptosis in human leukemia cells. J. Appl. Toxicol. 2009, 29, 560–568. [Google Scholar] [CrossRef]
  44. Rocha, S.; Cardoso, P.; Bahia, M.O.; Pessoa, C.D.O.; Soares, P.C.; Rocha, S.M.D.; Burbano, R.M.R.; Rocha, C. Effect of the kaurenoic acid on genotoxicity and cell cycle progression in cervical cancer cells lines. Toxicol. In Vitro 2019, 57, 126–131. [Google Scholar] [CrossRef] [PubMed]
  45. Cuca, L.E.; Coy, E.D.; Alarcon, M.A.; Fernandez, A.; Aristizabal, F.A. Cytotoxic effect of some natural compounds isolated from Lauraceae plants and synthetic derivatives. Biomedica 2011, 31, 335–343. [Google Scholar] [CrossRef] [PubMed] [Green Version]
  46. Han, Y.H.; Moon, H.J.; You, B.R.; Kim, S.Z.; Kim, S.H.; Park, W.H. Pyrogallol-induced endothelial cell death is related to GSH depletion rather than ROS level changes. Oncol. Rep. 2010, 23, 287–292. [Google Scholar] [PubMed]
  47. Han, Y.H.; Kim, S.H.; Kim, S.Z.; Park, W.H. Pyrogallol inhibits the growth of human pulmonary adenocarcinoma A549 cells by arresting cell cycle and triggering apoptosis. J. Biochem. Mol. Toxicol. 2009, 23, 36–42. [Google Scholar] [CrossRef]
  48. Yang, C.J.; Wang, C.S.; Hung, J.Y.; Huang, H.W.; Chia, Y.C.; Wang, P.H.; Weng, C.F.; Huang, M.S. Pyrogallol induces G2-M arrest in human lung cancer cells and inhibits tumor growth in an animal model. Lung Cancer 2009, 66, 162–168. [Google Scholar] [CrossRef] [PubMed]
  49. Han, Y.H.; Kim, S.Z.; Kim, S.H.; Park, W.H. Pyrogallol inhibits the growth of human lung cancer Calu-6 cells via arresting the cell cycle arrest. Toxicol. In Vitro 2008, 22, 1605–1609. [Google Scholar] [CrossRef]
  50. Han, Y.H.; Kim, S.Z.; Kim, S.H.; Park, W.H. Pyrogallol inhibits the growth of lung cancer Calu-6 cells via caspase-dependent apoptosis. Chem. Biol. Interact. 2009, 177, 107–114. [Google Scholar] [CrossRef]
  51. Sánchez-Carranza, J.N.; Alvarez, L.; Marquina-Bahena, S.; Salas-Vidal, E.; Cuevas, V.; Jiménez, E.W.; Veloz, G.; Carraz, M.; González-Maya, L. Phenolic Compounds Isolated from Caesalpinia coriaria Induce S and G2/M Phase Cell Cycle Arrest Differentially and Trigger Cell Death by Interfering with Microtubule Dynamics in Cancer Cell Lines. Molecules 2017, 22, 666. [Google Scholar] [CrossRef] [Green Version]
  52. Kim, W.-H.; Song, H.-O.; Choi, H.-J.; Bang, H.-I.; Choi, D.-Y.; Park, H. Ethyl gallate induces apoptosis of HL-60 cells by promoting the expression of caspases-8, -9, -3, apoptosis-inducing factor and endonuclease G. Int. J. Mol. Sci. 2012, 13, 11912–11922. [Google Scholar] [CrossRef]
  53. Liu, F.; Zu, X.; Xie, X.; Liu, K.; Chen, H.; Wang, T.; Liu, F.; Bode, A.M.; Zheng, Y.; Dong, Z.; et al. Ethyl gallate as a novel ERK1/2 inhibitor suppresses patient-derived esophageal tumor growth. Mol. Carcinog. 2019, 58, 533–543. [Google Scholar] [CrossRef]
  54. Cui, H.; Yuan, J.; Du, X.; Wang, M.; Yue, L.; Liu, J. Ethyl gallate suppresses proliferation and invasion in human breast cancer cells via Akt-NF-κB signaling. Oncol. Rep. 2015, 33, 1284–1290. [Google Scholar] [CrossRef] [PubMed] [Green Version]
  55. Lamy, S.; Ouanouki, A.; Beliveau, R.; Desrosiers, R.R. Olive oil compounds inhibit vascular endothelial growth factor receptor-2 phosphorylation. Exp. Cell. Res. 2014, 322, 89–98. [Google Scholar] [CrossRef] [PubMed]
  56. Suzuki, I.; Iigo, M.; Ishikawa, C.; Kuhara, T.; Asamoto, M.; Kunimoto, T.; Moore, M.A.; Yazawa, K.; Araki, E.; Tsuda, H. Inhibitory effects of oleic and docosahexaenoic acids on lung metastasis by colon-carcinoma-26 cells are associated with reduced matrix metalloproteinase-2 and -9 activities. Int. J. Cancer 1997, 73, 607–612. [Google Scholar] [CrossRef]
  57. Menendez, J.A.; Vellon, L.; Colomer, R.; Lupu, R. Oleic acid, the main monounsaturated fatty acid of olive oil, suppresses Her-2/neu (erbB-2) expression and synergistically enhances the growth inhibitory effects of trastuzumab (Herceptin) in breast cancer cells with Her-2/neu oncogene amplification. Ann. Oncol. 2005, 16, 359–371. [Google Scholar] [CrossRef]
  58. Li, S.; Zhou, T.; Li, C.; Dai, Z.; Che, D.; Yao, Y.; Li, L.; Ma, J.; Yang, X.; Gao, G. High metastaticgastric and breast cancer cells consume oleic acid in an AMPK dependent manner. PLoS ONE 2014, 9, e97330. [Google Scholar] [CrossRef]
  59. Binker-Cosen, M.J.; Richards, D.; Oliver, B.; Gaisano, H.Y.; Binker, M.G.; Cosen-Binker, L.I. Palmitic acid increases invasiveness of pancreatic cancer cells AsPC-1 through TLR4/ROS/NF-kappaB/MMP-9 signaling pathway. Biochem. Biophys. Res. Commun. 2017, 484, 152–158. [Google Scholar] [CrossRef]
  60. Zafaryab, M.; Fakhri, K.U.; Khan, M.A.; Hajela, K.; Rizvi, M.M.A. In vitro assessment of cytotoxic and apoptotic potential of palmitic acid for breast cancer treatment. Int. J. Life Sci. Res. 2019, 7, 166–174. [Google Scholar]
  61. Shanker, M.; Willcutts, D.; Roth, J.A.; Ramesh, R. Drug resistance in lung cancer. Lung Cancer 2010, 1, 23–36. [Google Scholar]
  62. Chou, T.C. Drug combination studies and their synergy quantification using the Chou-Talalay method. Cancer Res. 2010, 70, 440–446. [Google Scholar] [CrossRef] [Green Version]
  63. Chou, T.C.; Talalay, P. Quantitative analysis of dose-effect relationships: The combined effects of multiple drugs or enzyme inhibitors. Adv. Enzyme Regul. 1984, 22, 27–55. [Google Scholar] [CrossRef]
  64. Wlodkowic, D.; Telford, W.; Skommer, J.; Darzynkiewicz, Z. Apoptosis and beyond: Cytometry in studies of programmed cell death. Methods Cell. Biol. 2011, 103, 55–98. [Google Scholar] [CrossRef] [PubMed] [Green Version]
  65. Wlodkowic, D.; Skommer, J.; Darzynkiewicz, Z. Flow cytometry-based apoptosis detection. Methods Mol. Biol. 2009, 559, 19–32. [Google Scholar] [CrossRef] [Green Version]
  66. Cossarizza, A.; Salvioli, S. Analysis of mitochondria during cell death. Methods Cell. Biol. 2001, 63, 467–486. [Google Scholar] [PubMed]
  67. Gross, A.; McDonnell, J.M.; Korsmeyer, S.J. BCL-2 family members and the mitochondria in apoptosis. Genes Dev. 1999, 13, 1899–1911. [Google Scholar] [CrossRef] [PubMed] [Green Version]
  68. Gillet, J.P.; Varma, S.; Gottesman, M.M. The clinical relevance of cancer cell lines. J. Natl. Cancer Inst. 2013, 105, 452–458. [Google Scholar] [CrossRef] [Green Version]
  69. Janik, K.; Popeda, M.; Peciak, J.; Rosiak, K.; Smolarz, M.; Treda, C.; Rieske, P.; Stoczynska-Fidelus, E.; Ksiazkiewicz, M. Efficient and simple approach to in vitro culture of primary epithelial cancer cells. Biosci. Rep. 2016, 36, 1–12. [Google Scholar] [CrossRef] [Green Version]
  70. Cree, I.A.; Glaysher, S.; Harvey, A.L. Efficacy of anti-cancer agents in cell lines versus human primary tumour tissue. Curr. Opin. Pharmacol. 2010, 10, 375–379. [Google Scholar] [CrossRef]
  71. Eglen, R.; Reisine, T. Primary cells and stem cells in drug discovery: Emerging tools for high-throughput screening. Assay Drug Dev. Technol. 2011, 9, 108–124. [Google Scholar] [CrossRef]
  72. Bethune, G.; Bethune, D.; Ridgway, N.; Xu, Z. Epidermal growth factor receptor (EGFR) in lung cancer: An overview and update. J. Thorac. Dis. 2010, 2, 48–51. [Google Scholar]
  73. da Cunha Santos, G.; Shepherd, F.A.; Tsao, M.S. EGFR mutations and lung cancer. Annu. Rev. Pathol. 2011, 6, 49–69. [Google Scholar] [CrossRef] [Green Version]
  74. Ladanyi, M.; Pao, W. Lung adenocarcinoma: Guiding EGFR-targeted therapy and beyond. Mod. Pathol. 2008, 21 (Suppl. 2), S16–S22. [Google Scholar] [CrossRef] [Green Version]
  75. Huberty, C.J.; Morris, J.D. Multivariate analysis versus multiple univariate analyses. Psychol. Bull. 1989, 105, 302–308. [Google Scholar] [CrossRef]
  76. Banjerdpongchai, R.; Kongtawelert, P.; Khantamat, O.; Srisomsap, C.; Chokchaichamnankit, D.; Subhasitanont, P.; Svasti, J. Mitochondrial and endoplasmic reticulum stress pathways cooperate in zearalenone-induced apoptosis of human leukemic cells. J. Hematol. Oncol. 2010, 3, 1–16. [Google Scholar] [CrossRef] [PubMed] [Green Version]
  77. Khaw-on, P.; Banjerdpongchai, R. Induction of intrinsic and extrinsic apoptosis pathways in the human leukemic MOLT-4 cell line by terpinen-4-ol. Asian Pac. J. Cancer Prev. 2012, 13, 3073–3076. [Google Scholar] [CrossRef] [PubMed] [Green Version]
  78. Banjerdpongchai, R.; Yingyurn, S.; Kongtawelert, P. Sesamin Induces Human Leukemic Cell Apoptosis via Mitochondrial and Endoplasmic Reticulum Stress Pathways. World J. Oncol. 2010, 1, 78–86. [Google Scholar] [CrossRef] [PubMed] [Green Version]
  79. van Engeland, M.; Ramaekers, F.C.; Schutte, B.; Reutelingsperger, C.P. A novel assay to measure loss of plasma membrane asymmetry during apoptosis of adherent cells in culture. Cytometry 1996, 24, 131–139. [Google Scholar] [CrossRef]
  80. Cottet-Rousselle, C.; Ronot, X.; Leverve, X.; Mayol, J.F. Cytometric assessment of mitochondria using fluorescent probes. Cytometry A 2011, 79, 405–425. [Google Scholar] [CrossRef]
  81. Dikalov, S.; Griendling, K.K.; Harrison, D.G. Measurement of reactive oxygen species in cardiovascular studies. Hypertension 2007, 49, 717–727. [Google Scholar] [CrossRef] [Green Version]
  82. Khaw-On, P.; Pompimon, W.; Banjerdpongchai, R. Apoptosis Induction via ATM Phosphorylation, Cell Cycle Arrest, and ER Stress by Goniothalamin and Chemodrugs Combined Effects on Breast Cancer-Derived MDA-MB-231 Cells. Biomed. Res. Int. 2018, 2018, 1–15. [Google Scholar] [CrossRef]
  83. Si, L.L.; Lv, L.; Zhou, W.H.; Hu, W.D. Establishment and identification of human primary lung cancer cell culture in vitro. Int. J. Clin. Exp. Pathol. 2015, 8, 6540–6546. [Google Scholar]
  84. Wang, P.; Gao, Q.; Suo, Z.; Munthe, E.; Solberg, S.; Ma, L.; Wang, M.; Westerdaal, N.A.; Kvalheim, G.; Gaudernack, G. Identification and characterization of cells with cancer stem cell properties in human primary lung cancer cell lines. PLoS ONE 2013, 8, e57020. [Google Scholar] [CrossRef] [PubMed]
Sample Availability: Samples of the compounds are not available from the authors.
Figure 1. Cytotoxicity of the herbal extracts against the human lung cancer A549 cell line. Percent cell viability of A549 cells is shown on the Y-axis. The cells were determined after treatment with (A) BEA, (B) CEA, (C) EEA, (D) BE, (E) CE, and (F) EE for 24, 48, and 72 h at indicated concentrations as shown on the X-axis. The data are reported as mean ± SD of three independent experiments and was carried out in triplicate, * p < 0.05, ** p < 0.01, *** p < 0.001, and # p < 0.001 for all incubation times compared to the control condition.
Molecules 25 00231 g001
Figure 2. Cytotoxic effect of the effective extracts against PBMCs. PBMCs were separated and treated with the effective extracts; (A) BEA, (B) CEA, (C) EEA, and (D) EE for 24, 48, and 72 h at various concentrations on the X-axis. The data are reported as mean ± SD of three independent experiments carried out in triplicate, * p < 0.05, ** p < 0.01, *** p < 0.001 and # p < 0.001 for all incubation times compared to the control condition.
Molecules 25 00231 g002
Figure 3. GC-MS chromatograms of the bioactive compounds are presented from the effective extracts. The four effective extracts were analyzed using Agilent Technology 7890A GC interfaced with Agilent technology 5975C (EI) MS. Their identification and characterization were based on their elution order in a DB-5MS column. The chemical structures of three major compounds in (A) BEA, (B) CEA, (C) EEA, and (D) EE are presented.
Molecules 25 00231 g003aMolecules 25 00231 g003b
Figure 4. The synergistic combination of chemotherapy drugs with the effective extracts against A549 cells. (A,C,E) The cytotoxicity plots show the percentage of cell viability of A549 cells on the Y-axis. The cells were treated with MTX or ETS alone, and combination of MTX + BEA, MTX + EE, and ETS + EE. The concentration of MTX, ETS, BEA, and EE were indicated at the X-axis which also showed CI values and their synergy interpretation of each combined concentration. The explanation of the synergy level and symbol are showed in the Table 6. The data are reported as mean ± SD of three independent experiments and was carried out in triplicate. (B,D,F) The combination index (CI) plots correspond to the cell viabilities of each combination and were interpreted by CompuSyn software analysis.
Molecules 25 00231 g004
Figure 5. The effective extracts induced an A549 cell apoptotic feature. Morphology of the A549 cells was determined and quantified after treatment with (A) BEA, (B) CEA, (C) EEA, and (D) EE for 24 h. Apoptotic bodies and condensed nuclei appeared after staining with propidium iodide. White arrows represent apoptotic cells, whereas blue arrows represent non-apoptotic cells. The number of cells with an apoptotic feature was shown in the bar graphs for 200 total cells counting. Significant results were compared with the control (without treatment) and are shown by * p < 0.05, ** p < 0.01.
Molecules 25 00231 g005
Figure 6. Effective extracts induced A549 cell apoptosis detected by flow cytometry. A549 cells were stained with annexin V-FITC and PI after treatment with the effective extracts for 24 h. Dot plots show annexin V-FITC+/PI− as early apoptotic cells and annexin V-FITC+/PI+ as late apoptotic cells. Early and late apoptotic cells accumulated as a percentage of cell apoptosis in the bar graphs of each extract; (A) BEA, (B) CEA, (C) EEA, and (D) EE. The data were reported as a mean ± SD of three independent experiments carried out in triplicate, * p < 0.05 and ** p < 0.01 compared to the control condition.
Molecules 25 00231 g006
Figure 7. The effective extracts induced ∆Ψm reduction in A549 cells. Histograms (upper) show the reduced fluorescence intensity of DiOC6 after treatment with the effective extracts. The percent of the cells with ∆Ψm loss after cells which were treated by (A) BEA, (B) CEA, (C) EEA, and (D) EE are shown on the bar graphs (lower). The data are the mean ± SD of three independent experiments carried out in duplicate, * p < 0.05 and ** p < 0.01 with respect to the control condition.
Molecules 25 00231 g007
Figure 8. ROS generation in A549 cells after treatment with the effective extracts. The level of intracellular ROS was determined by DCFH-DA fluorescence dye. The increase of fluorescence intensity, which indicates that ROS are generated, is shown on the bar graphs after treatment with (A) BEA, (B) CEA, (C) EEA, and (D) EE for 4 h. H2O2 0.3% was used as a positive control for ROS production. The data were a mean ± SD of three independent experiments carried out in duplicate, * p < 0.05, ** p < 0.01 with respect to the control condition.
Molecules 25 00231 g008
Figure 9. The effect of the effective extracts on Noxa mRNA expression level. Quantitative RT-PCR of the mRNA expression of Noxa mRNA was measured by a 7500 Fast Real-time PCR system. A549 cells were treated with (A) BEA, (B) CEA, (C) EEA, and (D) EE at the indicated concentrations. The relative gene expression level was analyzed by 2−∆∆Ct, using GAPDH as a housekeeping gene. * p < 0.05, ** p < 0.01, treatment group vs. control un-treatment groups.
Molecules 25 00231 g009
Figure 10. The effect of the effective extracts on Noxa protein expression level. Representations of Noxa protein bands after A549 cells were treated with (A) BEA, (B) CEA, (C) EEA, and (D) EE at indicated concentrations as shown in different lanes. The density of each band was measured and calculated for the relative protein level using beta-actin as an internal control (bar graphs). * p < 0.05, ** p < 0.01, treatment group vs. control un-treatment groups.
Molecules 25 00231 g010
Table 1. The IC values of the effective extracts at 24-, 48-, and 72-h incubation time against A549 cells and PBMCs, and SI of each extract.
BEA (µg/mL)CEA (µg/mL)EEA (µg/mL)EE (µg/mL)
24 h: A549: IC108.84 ± 3.580.30 ± 0.132.75 ± 0.130.19 ± 0.03
IC2014.29 ± 4.630.69 ± 0.285.79 ± 0.250.37 ± 0.06
IC5028.84 ± 5.144.12 ± 0.1018.45 ± 1.401.02 ± 0.16
PBMCs: IC50>200118.41 ± 8.07>200>200
SI * >6.9328.74>10.84>196.07
48 h: A549: IC5022.02 ± 2.340.86 ± 0.189.08 ± 1.060.89 ± 0.26
PBMCs: IC50>20051.25 ± 9.41>200125.92 ± 17.15
SI>9.0859.59>22.02141.48
72 h: A549: IC5017.39 ± 1.88 0.66 ± 0.0112.38 ± 2.570.96 ± 0.14
PBMCs: IC50>20041.09 ± 5.82>200133.70 ± 12.43
SI>11.5062.26>16.16139.27
* Selectivity index (SI) is the ratio between IC50 of PBMCs and that of A549 cells.
Table 2. Retention time, name, and percentage of the total of the enabling identification compounds from BEA.
No.Retention TimeName of Compounds% of Total
120.934Pyrogallol3.09
225.144Elemicin0.44
330.091Myristic acid0.52
431.831Oxacyclotetradecane-2,11-dione, 13-methyl-0.34
534.432Palmitic acid9.09
636.075Heptadecanoic acid0.34
737.589Linoleic acid0.60
837.715Petroselinic acid2.28
938.042Stearic acid1.09
1043.9131,2-Benzenedicarboxylic acid0.29
1148.047Squalene0.24
1249.2941-Nonadecene0.44
1352.0031-Tricosene2.36
1452.195alpha-Tocopherol0.86
1552.921Cirsilineol0.61
1653.395Campesterol3.74
1753.937Stigmast-22-en-3-ol, (3α,5α,22E,24ξ)0.24
1854.400Hebesterol1.11
1954.768Stigmast-5-en-3-ol22.52
2054.889Fucosterol1.23
2156.010Stigmasta-3,5-dien-7-one0.98
2256.687Stigmast-4-en-3-one0.81
2356.855Citrostadienol0.81
2458.042Epifriedelanol1.37
2558.610Friedelan-3-one28.99
2659.8092,7-dihydroxy-5-methoxy-3-methylanthraquinone2.51
Table 3. Retention time, name, and percentage of the total of the enabling identification compounds from CEA.
No.Retention TimeName of Compounds% of Total
115.676Benzoic acid3.24
234.197Palmitic acid1.75
335.792Kaur-16-ene1.31
438.2642,3,3-Trimethyl-2,3-dihydro-4h-furo [3,2-C][1]benzopyran-4-One1.26
538.370Androst-5-en-3beta-ol1.80
642.429Benz [a] anthracenone0.14
742.847Kaur-16-en-18-oic acid50.24
843.140(4-beta)-Kaur-16-en-18-oic acid2.28
949.731Aflatoxin G11.40
1053.385Campesterol0.98
1153.740Stigmasterol2.06
1254.611Stigmast-5-en-3-ol3.60
1355.993Stigmasta-3,5-dien-7-one2.61
Table 4. Retention time, name, and percentage of the total of the enabling identification compounds from EEA.
No.Retention TimeName of Compounds% of Total
118.623Resorcinol2.18
221.056Pyrogallol11.73
321.488Vanillin0.27
424.1942,4-Di-tert-butylphenol0.30
534.500Palmitic acid12.89
637.941Oleic acid22.74
738.192Stearic acid1.08
843.9321,2-Benzenedicarboxylic acid0.58
946.779beta-Glyceryl monostearate0.50
1048.057Squalene0.30
1152.211alpha-Tocopherol1.70
1253.418Campesterol2.92
1353.54914-Methylergosta-8,24(28)-dien-3-ol0.26
1453.782Stigmasterol4.24
1554.3604,14-Dimethylergosta-8,24(28)-dien-3-ol0.69
1654.4695,8-Dimethoxy-2-methyl-4H-naphtho[2,3-b] pyran-4,6,9-trione0.54
1754.672Stigmast-5-en-3-ol4.14
1854.784beta-Amyrone1.90
1955.532alpha-Amyrone0.42
2056.48824-Methylenecycloartan-3-one1.70
2156.85824-Methylenecycloartanol1.72
2259.985Octadecyl 3-(3,5-di-tert-butyl-4-hydroxyphenyl) propionate0.60
Table 5. Retention time, name, and percentage of the total of the enabling identification compounds from EE.
No.Retention TimeName of Compounds% of Total
116.084Pyrocatechol1.40
216.9555-Hydroxymethyl-2-farancarboxaldehyde2.18
318.711Resorcinol6.26
419.1342-Methoxy-4-vinylphenol0.82
520.1252,6-Dimethoxyphenol0.34
621.253Pyrogallol37.82
724.8914-Hydroxy-3-methoxyphenethanol1.33
825.877Benzoic acid0.58
926.6323,4,5-Trimethoxyhenol0.99
1034.207Ethyl gallate21.75
1134.721Ethyl hexadecanoate1.34
1237.405Linoleic acid0.90
1337.545Oleic acid3.15
1437.791Ethyl linoleate1.18
1537.918Ethyl oleate2.44
1645.7412,6-Diphenylimidazo[1,2-b]-[1,2,4]-triazine1.94
1746.769beta-Glyceryl monostearate2.03
Table 6. The classification of the combination index (CI), their indication, and symbols in drug combination studies analyzed with the CI method which is based on those described by Chou and Talalay and the CompuSyn software of Chou and Martin.
CI RangeDescriptionSymbol *
<0.10Very strong synergism+++++
0.10–0.30Strong synergism++++
0.30–0.70Synergism+++
0.70–0.85Moderate synergism++
0.85–0.90Slight synergism+
0.90–1.10Nearly additive±
1.10–1.20Slight antagonism-
1.20–1.45Moderate antagonism--
1.45–3.30Antagonism---
3.30–10.00Strong antagonism----
>10.00Very strong antagonism-----
* The symbol is demonstrated the level of synergism or antagonism and mentioned in the Figure 4.
Table 7. Patient characteristics (nine patients).
VariablesN or Mean ± SD
Age63.00 ± 6.12
Gender
Female7
Male2
Success culture
Cancer cells9
Normal cells7
Histology
Adenocarcinoma7
Squamous cell carcinoma2
Cell differentiation
Well4
Moderate 2
Severe3
Staging (8th edition of TNM)
IA32
IB1
IIB4
IIIA1
IIIB1
Tumor size, mm55 (35–70)
Intratumoral lymphatic invasion8
Intratumoral vascular invasion2
Tumor necrosis3
Molecular testing
EGFR * mutation
Wildtype 3
Exon 19 deletion1
Exon 21 L858R1
Exon 19 deletion and Exon 21 L858R1
Unknown3
* EGFR = Epidermal growth factor receptor gene.
Table 8. IC50 of each substance (extracts or drugs) and p-value compared the IC50 or sample number between lung cancer samples and normal lung samples.
SubstancesIC50, Mean ± SD or Median (Interquartile Range) *p-Value
Cancer Samples (n = 9)Normal Samples (n = 7)
BEA (µg/mL)139.10 ± 34.60143.78 ± 75.850.901 *
Sensitive cell (n)620.315 **
Resistant cell (n)35
CEA (µg/mL)127.79 ± 54.25132.37 ± 9.520.833
Sensitive cell (n)960.437
Resistant cell (n)01
EEA (µg/mL)60.79 (35.61–120.52)47.98 (44.33–60.66)0.775
Sensitive cell (n)761.000
Resistant cell (n)21
EE (µg/mL)8.26 (4.05–13.15)16.39 (13.27–18.05)0.013 ***
Sensitive cell (n)960.437
Resistant cell (n)01
Doxorubicin (µM)3.54 (1.28–7.53)2.36 (1.13–12.25)0.886
Sensitive cell (n)670.212
Resistant cell (n)30
Etoposide (µM)13.36 ± 4.6311.96 ± 5.210.632
Sensitive cell (n)660.585
Resistant cell (n)31
Vinblastine (nM)11.79 (6.36–12.68)9.20 (4.16–17.01)0.775
Sensitive cell (n)670.212
Resistant cell (n)30
* Normal distribution data were reported the IC50 as mean ± SD and p-values were calculated by unpaired t-test. Whereas, non-normal distribution data were reported the IC50 in median (interquartile range) and p-values were determined by the Wilcoxon rank-sum test. ** p-values of the sensitive cell were calculated by Fisher exact test for comparing the proportions of the number of cancer and normal in sensitive group. *** p < 0.05; significant at 95% confidence interval.
Table 9. Mean difference of IC50 compared to cancer samples and normal samples, 95% confidence interval and p-value.
Mean Difference *95% Confidence Intervalp-Value
BEA+63.93−21.05, +148.920.140
CEA+0.87−41.70, +43.430.968
EEA+6.98−32.39, +46.340.728
EE−4.38−8.57, −0.180.041 **
Doxorubicin−3.39−9.50, +2.720.277
Etoposide+0.74−6.49, +7.970.841
Vinblastine−5.24−11.69, +1.210.112
* Mean difference was analyzed by multi-level random effect model in which IC50 values were adjusted by age, gender, cell type, and tumor size. ** p < 0.05; significant at 95% confidence interval.

