Article

Separation of Five Iridoid Glycosides from Lonicerae Japonicae Flos Using High-Speed Counter-Current Chromatography and Their Anti-Inflammatory and Antibacterial Activities

1
Key Laboratory of Natural Pharmaceutical Chemistry, Shandong University of Traditional Chinese Medicine, Jinan 250200, China
2
School of Biological Science and Technology, University of Jinan, Jinan 250022, China
*
Authors to whom correspondence should be addressed.
These authors contributed equally to this work.
Molecules 2019, 24(1), 197; https://doi.org/10.3390/molecules24010197
Submission received: 12 December 2018 / Revised: 27 December 2018 / Accepted: 28 December 2018 / Published: 7 January 2019
(This article belongs to the Section Natural Products Chemistry)

Abstract

:
A high-speed counter-current chromatography (HSCCC) method, using a two-phase solvent system composed of ethyl acetate/n-butanol/methanol/water (5:1:1:5, v/v/v/v), was successfully established to separate the five iridoid glucosides 7-O-ethyl sweroside (1), secologanin dimethylacetal (2), adinoside F (3), (7R)-secologain n-butyl methyl acetal (4) and adinoside G (5) from Lonicerae Japonicae Flos. Their purities were 96.8%, 98.5%, 93.3%, 98.0% and 99.9%, respectively. All the iridoid glucosides were identified by HR-ESI-MS, 1D and 2D NMR. Compounds 3 and 5 are new iridoid glucosides. The anti-inflammatory tests showed that compounds 15 all expressed moderate inhibitory effects on β-glucuronidase release in rat polymorphonuclear leukocytes (PMNs) induced by platelet-activating factor (PAF) with IC50 values ranging from 4.52 to 6.50 µM, while the antibacterial assays demonstrated that all the compounds displayed mild inhibitory activities against Staphylococcus aureus ATCC 25923 with MIC values ranging from 13.7 to 26.0 µg/mL.

1. Introduction

Lonicerae Japonicae Flos, known as Jinyinhua in the Chinese Pharmacopeia, refers to the dried flower buds or the initial flowers of Lonicera japonica Thunb. It has been widely used in traditional Chinese medicine to treat various diseases, such as cough, thirst, arthritis, fever, sore throat, and influenza infection [1]. In addition, it can also been used in functional foods, cosmetics and other applications [2]. Modern phytochemistry and pharmacology studies have shown that chlorogenic acids, iridoid glucosides, polyphenols, flavonoids, triterpenoid saponins, organic acids and volatile oils were the active ingredients in Lonicera Species [3,4,5]. Iridoid glucosides, as a special class of monoterpenoids, have been frequently reported to display a variety of pharmacological properties such as anti-inflammatory [6], antibacterial [7], anti-virus [8], anti-allergic [9], and hepatoprotective effects [10], and play important roles in the known effects of L. Japonicae Flos.
The conventional methods to isolate iridoid glucosides from L. Japonicae Flos include silica gel chromatography, polyamide column chromatography and others, but most of these methods lead to low yields and unideal recoveries due to the repeated chromatographic steps and the adsorption of samples on the solid supports [11]. Considering these problems, it is necessary to develop a fast and more efficient method to isolate and separate iridoid glucosides from L. Japonicae Flos. High-speed counter-current chromatography (HSCCC) was first developed in the early 1980s [12]. It is a kind of chromatographic technology based on the theory of liquid-liquid distribution, and has been widely used in the isolation of natural products for its advantages of high recovery, simple sample preparation, high efficiency as well as ideal repeatability [13]. However, as far as we know, there have been no reports on the isolation and separation of iridoid glucosides by HSCCC from L. Japonicae Flos. In our present study, five iridoid glucosides (Figure 1), 7-O-ethyl sweroside (1), secologanin dimethylacetal (2), adinoside F (3), (7R)-secologain n-butyl methyl acetal (4) and adinoside G (5), were successfully isolated and separated from L. Japonicae Flos by a HSCCC method, and compounds 3 and 5 were identified as new iridoid glucosides.

2. Results and Discussion

2.1. Selection of Two-Phase Solvent Systems

In the HSCCC separation, it is particularly important to choose a solvent system with suitable K values (0.5 < K < 2.0) for target compounds [14]. In the present study, two groups of solvent systems (ethyl acetate/n-butanol/water and ethyl acetate/n-butanol/methanol/water) with different proportions were tested. The results are listed in Table 1.
It proved hard to isolate and separate target compounds when solvent systems composed of ethyl acetate/n-butanol/water (2:1:3, 4:1:5 and 11:1:12, v/v/v) were used, as the K values were small, especially for compounds 1, 2 and 3. Then, systems composed of ethyl acetate/n-butanol/methanol/water (from 11:0.5:0:5:11 to 5:1:1:5, v/v/v/v) were tested. The K values of compounds 1 and 2 were less than 0.5 with the ratios of 11:0.5:0.5:11 and 11:0.5:1:11 (v/v/v/v), resulting in a poor partition of target compounds in the mobile phase. The K value of compound 5 was too large with the ratio of 11:3:0.5:11 (v/v/v/v), which might lead to a long elution time. When the ratio was adjusted to 5:1:1:5 (v/v/v/v), the K values of all the target compounds fell into a suitable range. In addition, the retention of the stationary phase was 48.5% in this system, indicating that there was sufficient stationary phase to allow the sample to be distributed. The HSCCC chromatogram was listed in Figure 2, where compounds 1 (peak I, collected during 127–136 min, 23 mg), 2 (peak II, collected during 148–159 min, 28 mg), 3 (peak III, collected during 287–311 min, 15 mg), 4 (peak IV, collected during 358–393 min, 9 mg) and 5 (peak V, collected during 497–550 min, 27 mg) were obtained from 150 mg of crude sample in one step within 11 h. However, peaks 200 and 250 min contained more than one compound by HPLC analysis.
The HPLC chromatograms of the crude sample and all the target compounds were shown in Figure 3. The purities of compounds 15 were recorded as 96.8%, 98.5%, 93.3%, 98.0% and 99.9%, respectively, according to the HPLC peak-area percentages. The results of this study thus showed that HSCCC can successfully isolate and separate compounds 15 from L. Japonicae Flos.

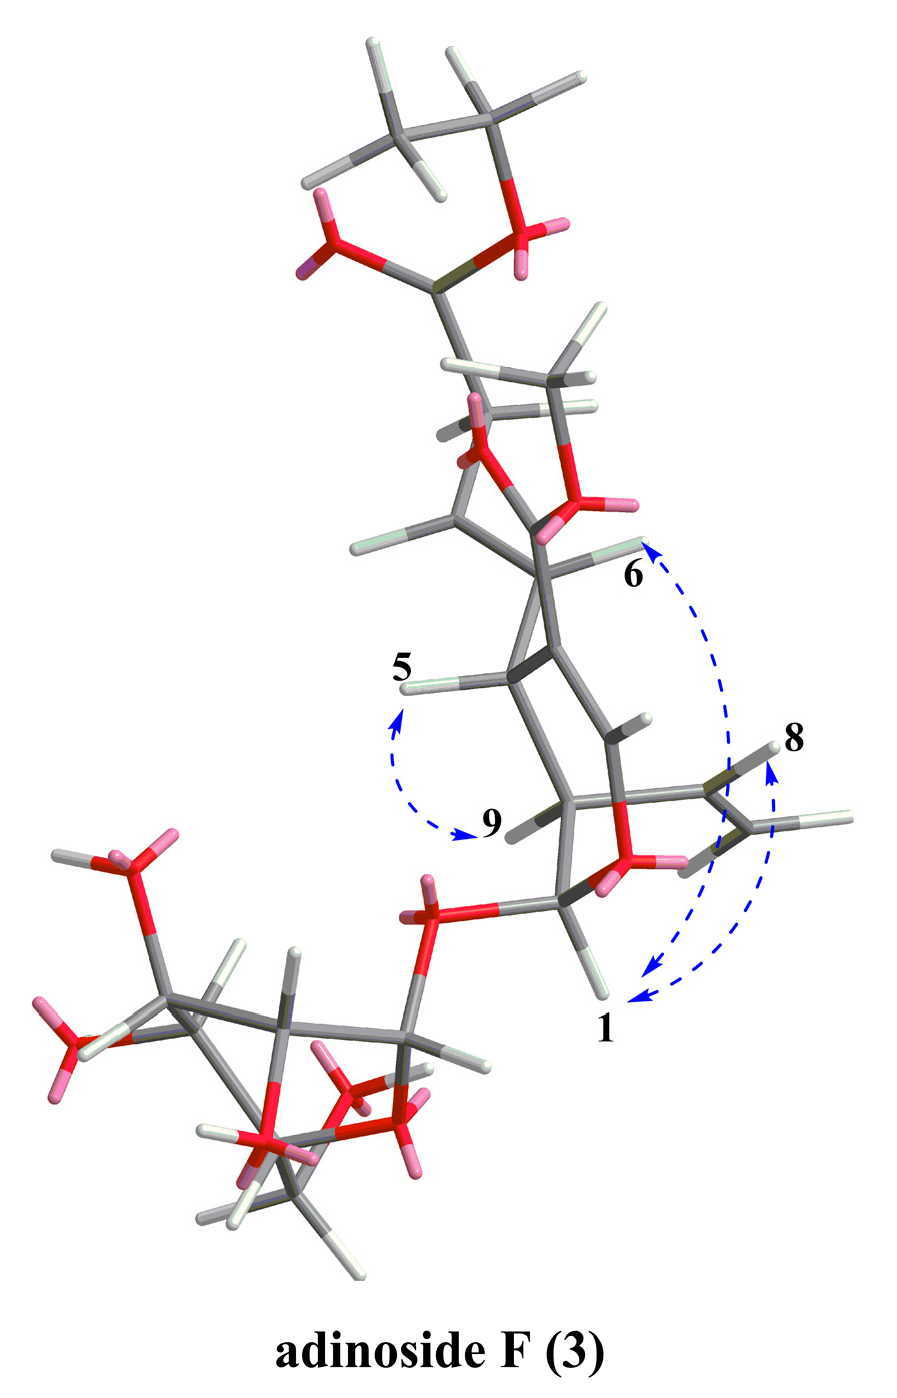
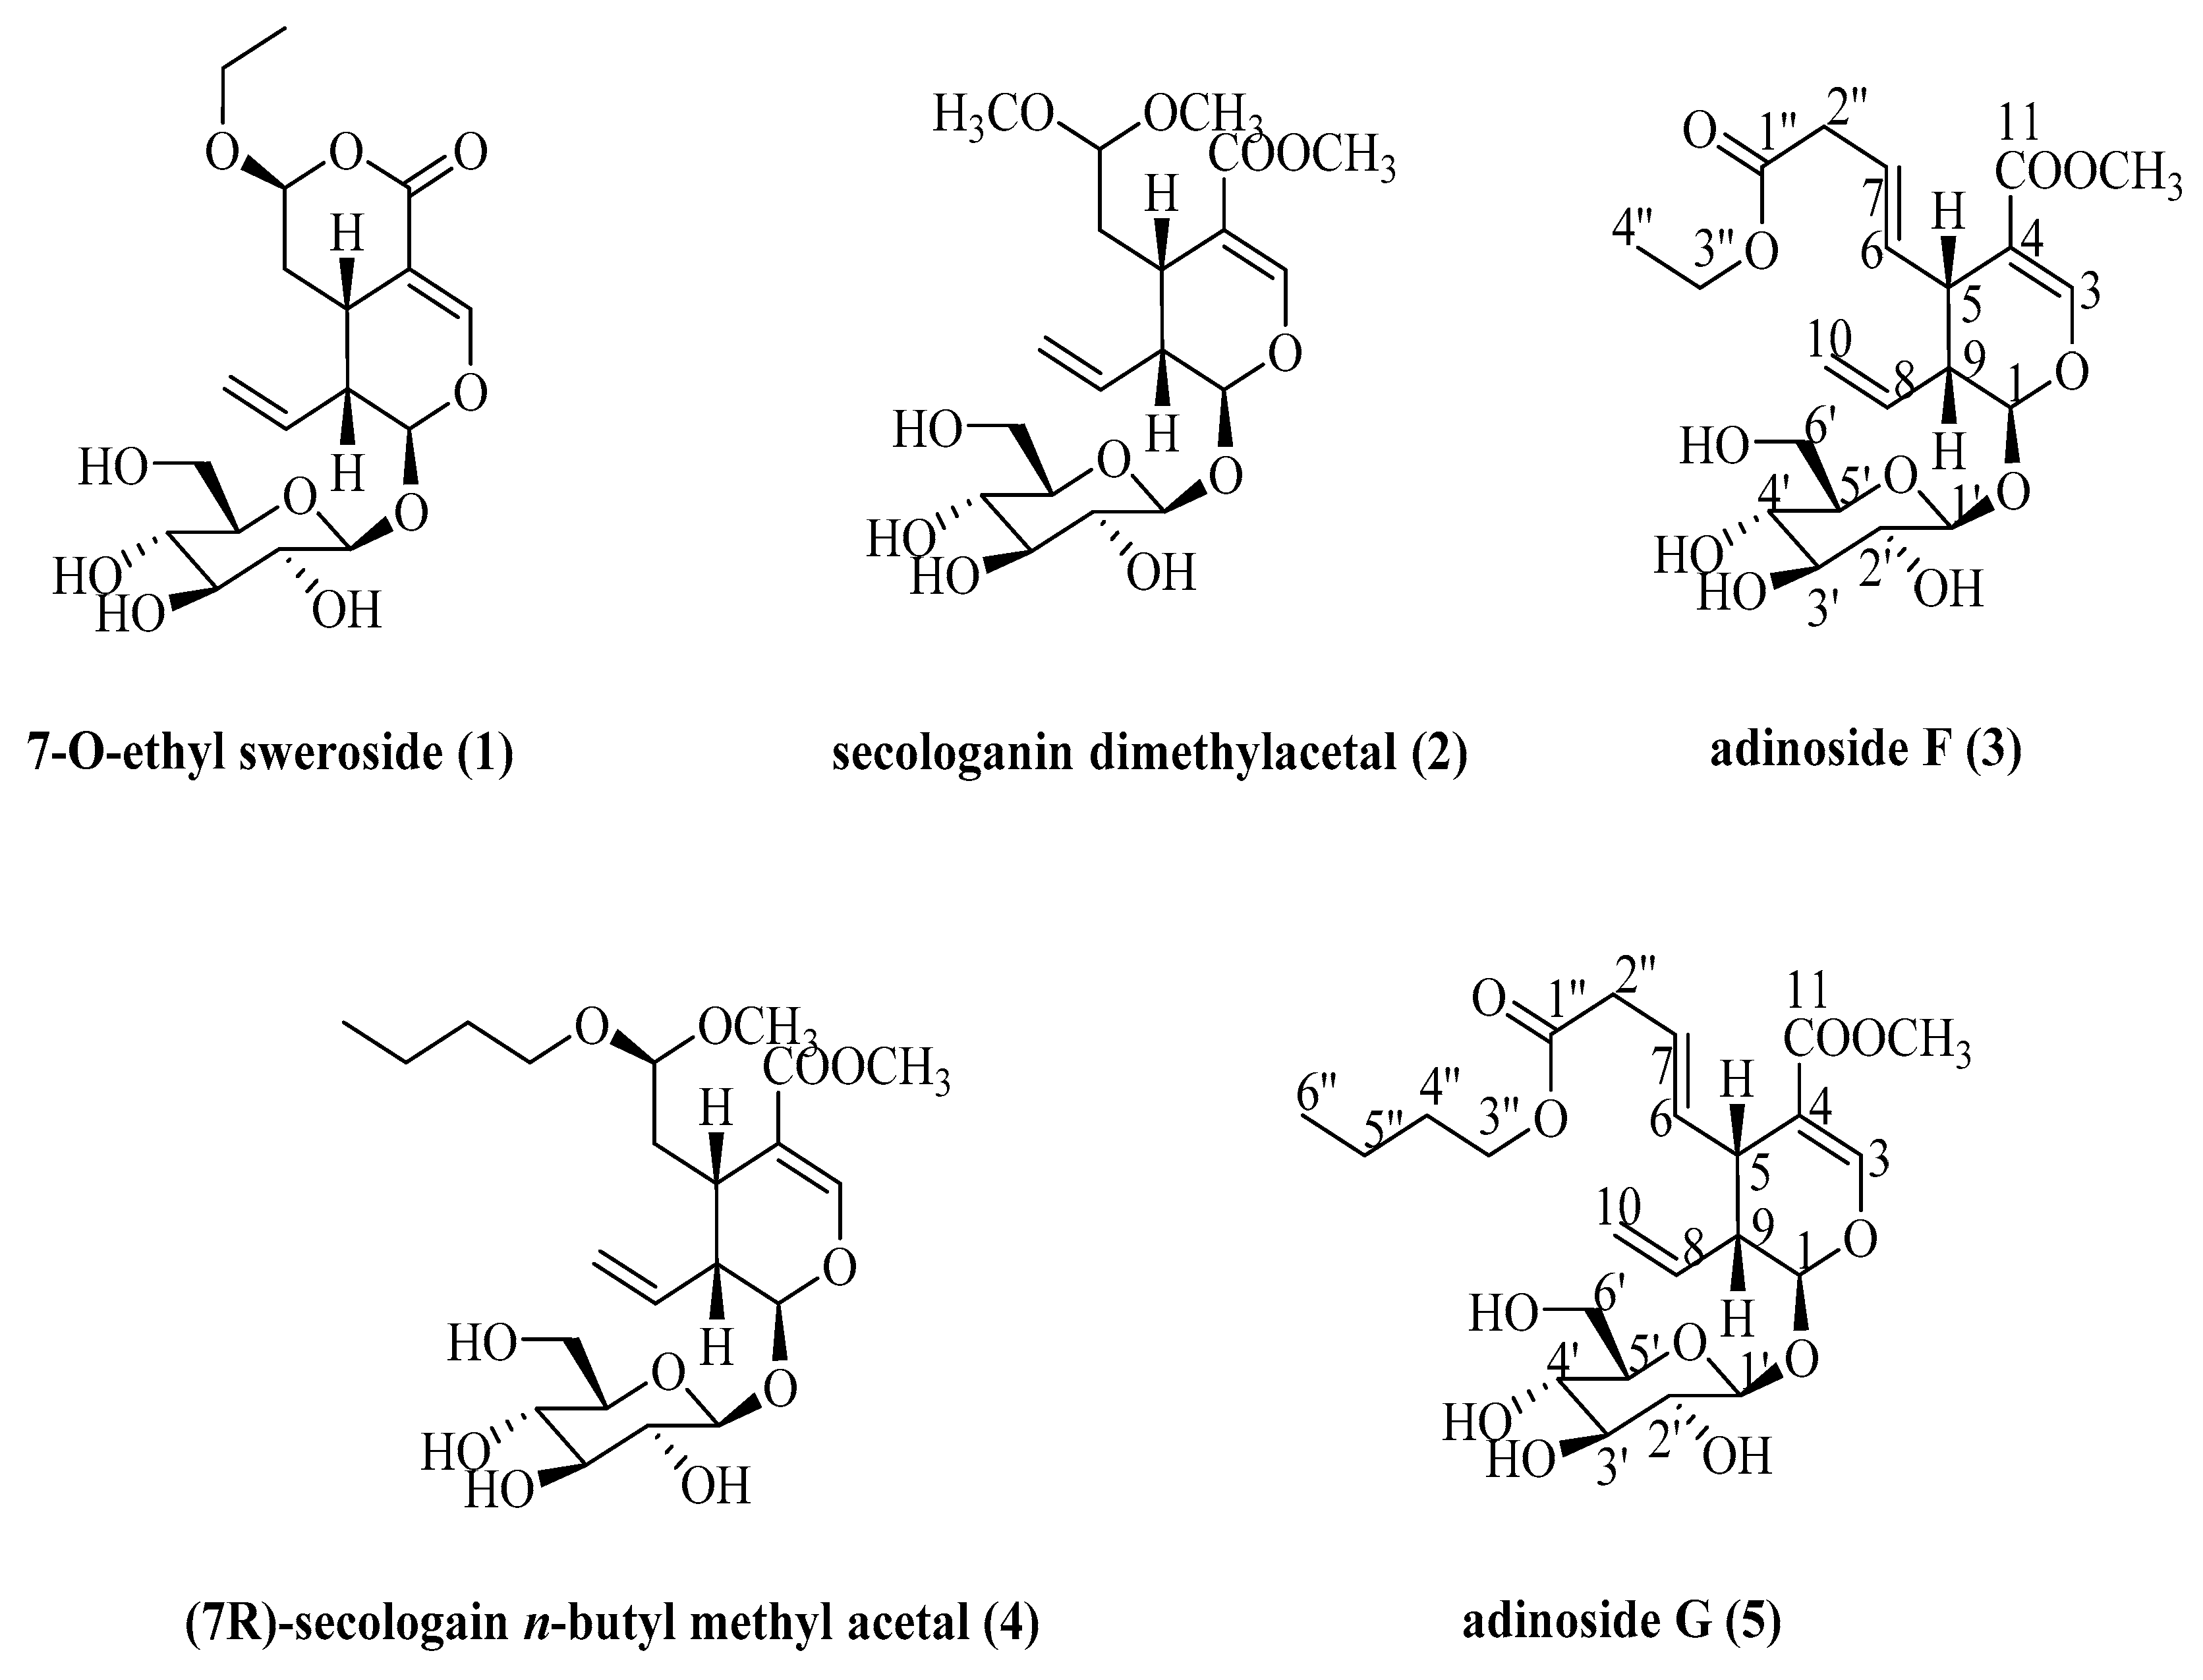
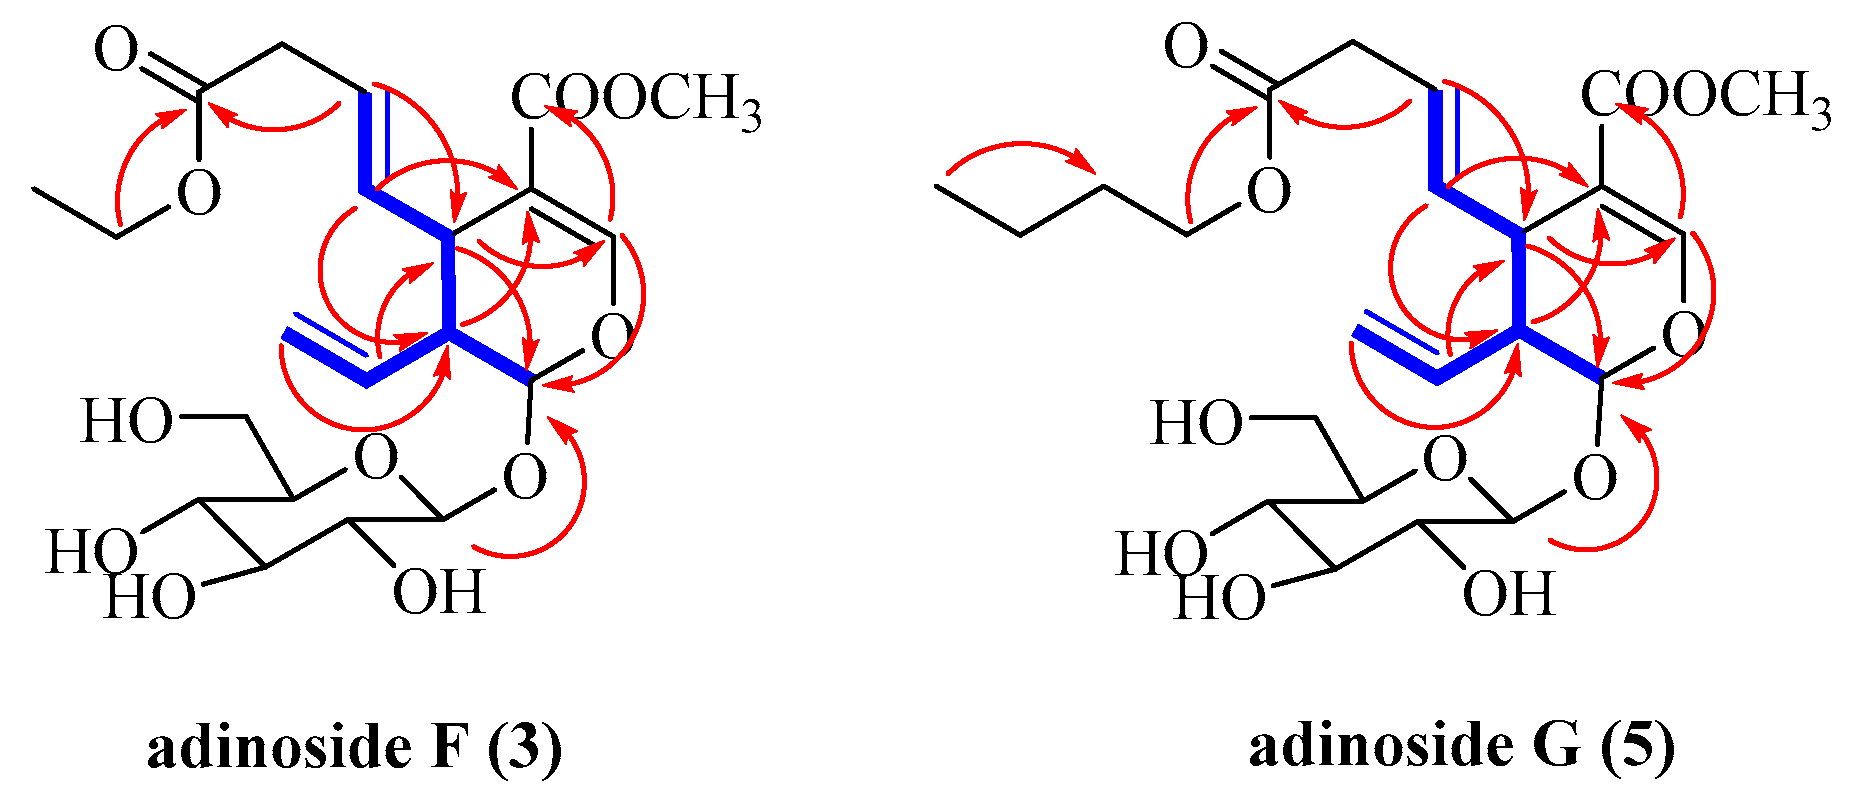
2.2. Identification of Compounds

Two new iridoid glucosides, adinoside F (3) and adinoside G (5), together with three known ones (1, 2, and 4), were determined by the HR-ESI-MS, 1D and 2D NMR data (see supplementary materials).
Adinoside F (3) was separated as a yellow crystalline solid with [α]25D − 109.3 (CH3OH, c = 1.0). Its molecular formula was deduced by HR-ESI-MS at m/z 481.1680 [M + Na]+ (calculated for C21H30NaO11, 481.1686). Its IR spectrum displayed absorption bands of hydroxyl (3441 cm−1) and carbonyl (1712 cm−1) groups. Its 1H and 13C-NMR spectra (Table 2 and Table 3) were closely similar to those of adinoside A [15], except for the presence of an ethoxy group in 3 [δH 1.24 (t, J = 7.4 Hz, H-4′′) and 4.11 (m, H-3′′); δC 14.5 (C-4′′) and 61.8 (C-3′′)]. The location of the ethoxy group was determined by the correlations from H-3′′ to C-1′′ in the HMBC spectrum (Figure 4). The correlations of H-1/H-6, H-8 and H-5/H-9 in the NOESY spectrum (Figure 5) suggested H-5 and H-9 were on the same side, while H-1 on the other side. Therefore, compound 3 had the same relative configurations with secologanin [16] and can be named as adinoside F.
Adinoside G (5) was obtained as yellow powder with [α]25D − 56.1 (CH3OH, c = 0.6). Its molecular formula was indicated from HR-ESI-MS at m/z 509.1990 [M + Na]+ (calculated for C22H34NaO11, 509.1999). Its IR absorption bands showed the existence of hydroxyl (3428 cm−1) and carbonyl (1712 cm−1) moieties. Its 1H and 13C-NMR spectral features (Table 2 and Table 3) of 5 were very similar to compound 3. The difference between them was the replacement of the ethoxy group in 3 by an n-butyl group in 5, as supported by the HMBC correlations from H-3′′ to C-1′′ and from H-6′′ to C-4′′ (Figure 4). Furthermore, the NOESY correlations in suggested that its relative configurations were the same with compound 3. Thus, compound 5 was named as adinoside G.
The three known ones were identified as 7-O-ethyl sweroside (1) [17], secologanin dimethylacetal (2) [18] and (7R)-secologain n-butyl methyl acetal (4) [19] by comparing their spectroscopic data with the literature.

2.3. Anti-Inflammatory and Antibacterial Activities

All the compounds were evaluated for anti-inflammatory and antibacterial activities. Compounds 15 all exhibited moderate anti-inflammatory activities to suppress the release of β-glucuronidase with IC50 values ranging from 4.52 to 6.50 µM (Table 4), while they also displayed mild antibacterial activities against Staphylococcus aureus ATCC 25923 with MIC values ranging from 13.7 to 26.0 µg/mL (Table 5).

3. Materials and Methods

3.1. Plant Materials and Reagents

Fresh L. Japonicae Flos samples were collected at Jinan, Shandong Province, China, in 2017, and identified by Professor Jia Li (Shandong University of Traditional Chinese Medicine). A voucher specimen (No JYH-201705) was stored in the Key Laboratory of Pharmaceutical Chemistry, University of Jinan, China. Methanol (HPLC grade) was obtained from the Oceanpak company (Goteborg, Sweden). Distilled water was prepared using a Milli-Q system (Billerica, MA, USA). Other reagents including ethyl acetate, dichloromethane, n-butanol, ethanol and methanol of analytical grade were purchased from Fuyu Chemical Factory (Tianjin, China).

3.2. Instruments

The TBE-300C HSCCC instrument (Shanghai Tauto Biotech Co., Ltd., Shanghai, China) used in our present study was equipped with a sample loop (volume: 20 mL) and a three preparative polytetrafluoroethylene coils (volume: 300 mL, radius: 1.3 mm). The β value of the multilayer coil ranged from 0.5 to 0.8 at the internal and external, respectively (β= r/R, where R is the distance of the centrifuge from holder axis to central axis, and r is the spacing between the coil and holder shaft). The revolution speed can be regulated from 0 to 900 rpm. In addition, a TBP-5002S constant flow pump, a TBD2000 UV monitor, a DC-0506 constant low-temperature bath as well as a HW-2000 workstation were all provided by Tauto Biotech Co., Ltd. (Shanghai, China).
An Agilent 1260 system (Agilent Technologies, Santa Clara, USA) was used in the HPLC analysis. It was equipped with a G1316A column thermostat, a G1314B UV-vis photodiode array detector) and a G1313A auto-sampler. An Agilent Technologies 6250 Q-TOF LC/MS was used to detect HR-ESI-MS data. A Rudolph VI digital polarimeter (Rudolph Research Analytical, Hackettstown, USA) was employed to record optical rotation data. In addition, an AVANCE DRX (600 MHz) (Bruker, Billerica, MA, USA) nuclear magnetic resonance (NMR) spectrometer was used to obtain 1D and 2D NMR spectra.

3.3. Preparation of Crude Sample

Firstly, the fresh flowers were treated with a vacuum freeze-drier, and then the freeze-dried materials (6 kg) were extracted with 95% ethanol (30 L) at room temperature. After being concentrated in vacuo, the ethanol extract (0.9 kg) was suspended in water and extracted with ethyl acetate (10 L) and n-butanol (12 L). The n-butanol soluble fraction (64.5 g) was first separated over a macroporous adsorbent resin column. The column was eluted with water-ethanol (100:0, 70:30, 50:50, 30:70, 10:90, v/v), yielding five fractions. Then the 50% ethanol eluate (7.5 g) was ready to be separated by HSCCC.

3.4. Selection of Two-Phase Solvent Systems and Preparation of the Sample Solution

The selection of solvent system is based on the partition coefficient (K) value, which can be measured by HPLC as follows. A bit of sample was dissolved with equal amounts of the upper and lower phases of the solvent system, and then, the same amounts of upper and lower solutions were taken for HPLC analysis, respectively. The peak areas of target compound in upper and lower phases were recorded as Aupper and Alower, respectively, and the K value was calculated as Aupper/Alower. In this work, the optimal solvent system composed of ethyl acetate/n-butanol/methanol/water (5:1:1:5, v/v/v/v) was prepared to obtain the upper and lower phases. Then, 150 mg of dried sample was dissolved with solvent mixture which containing 7.5 mL of upper phase and the same volume of lower phase.

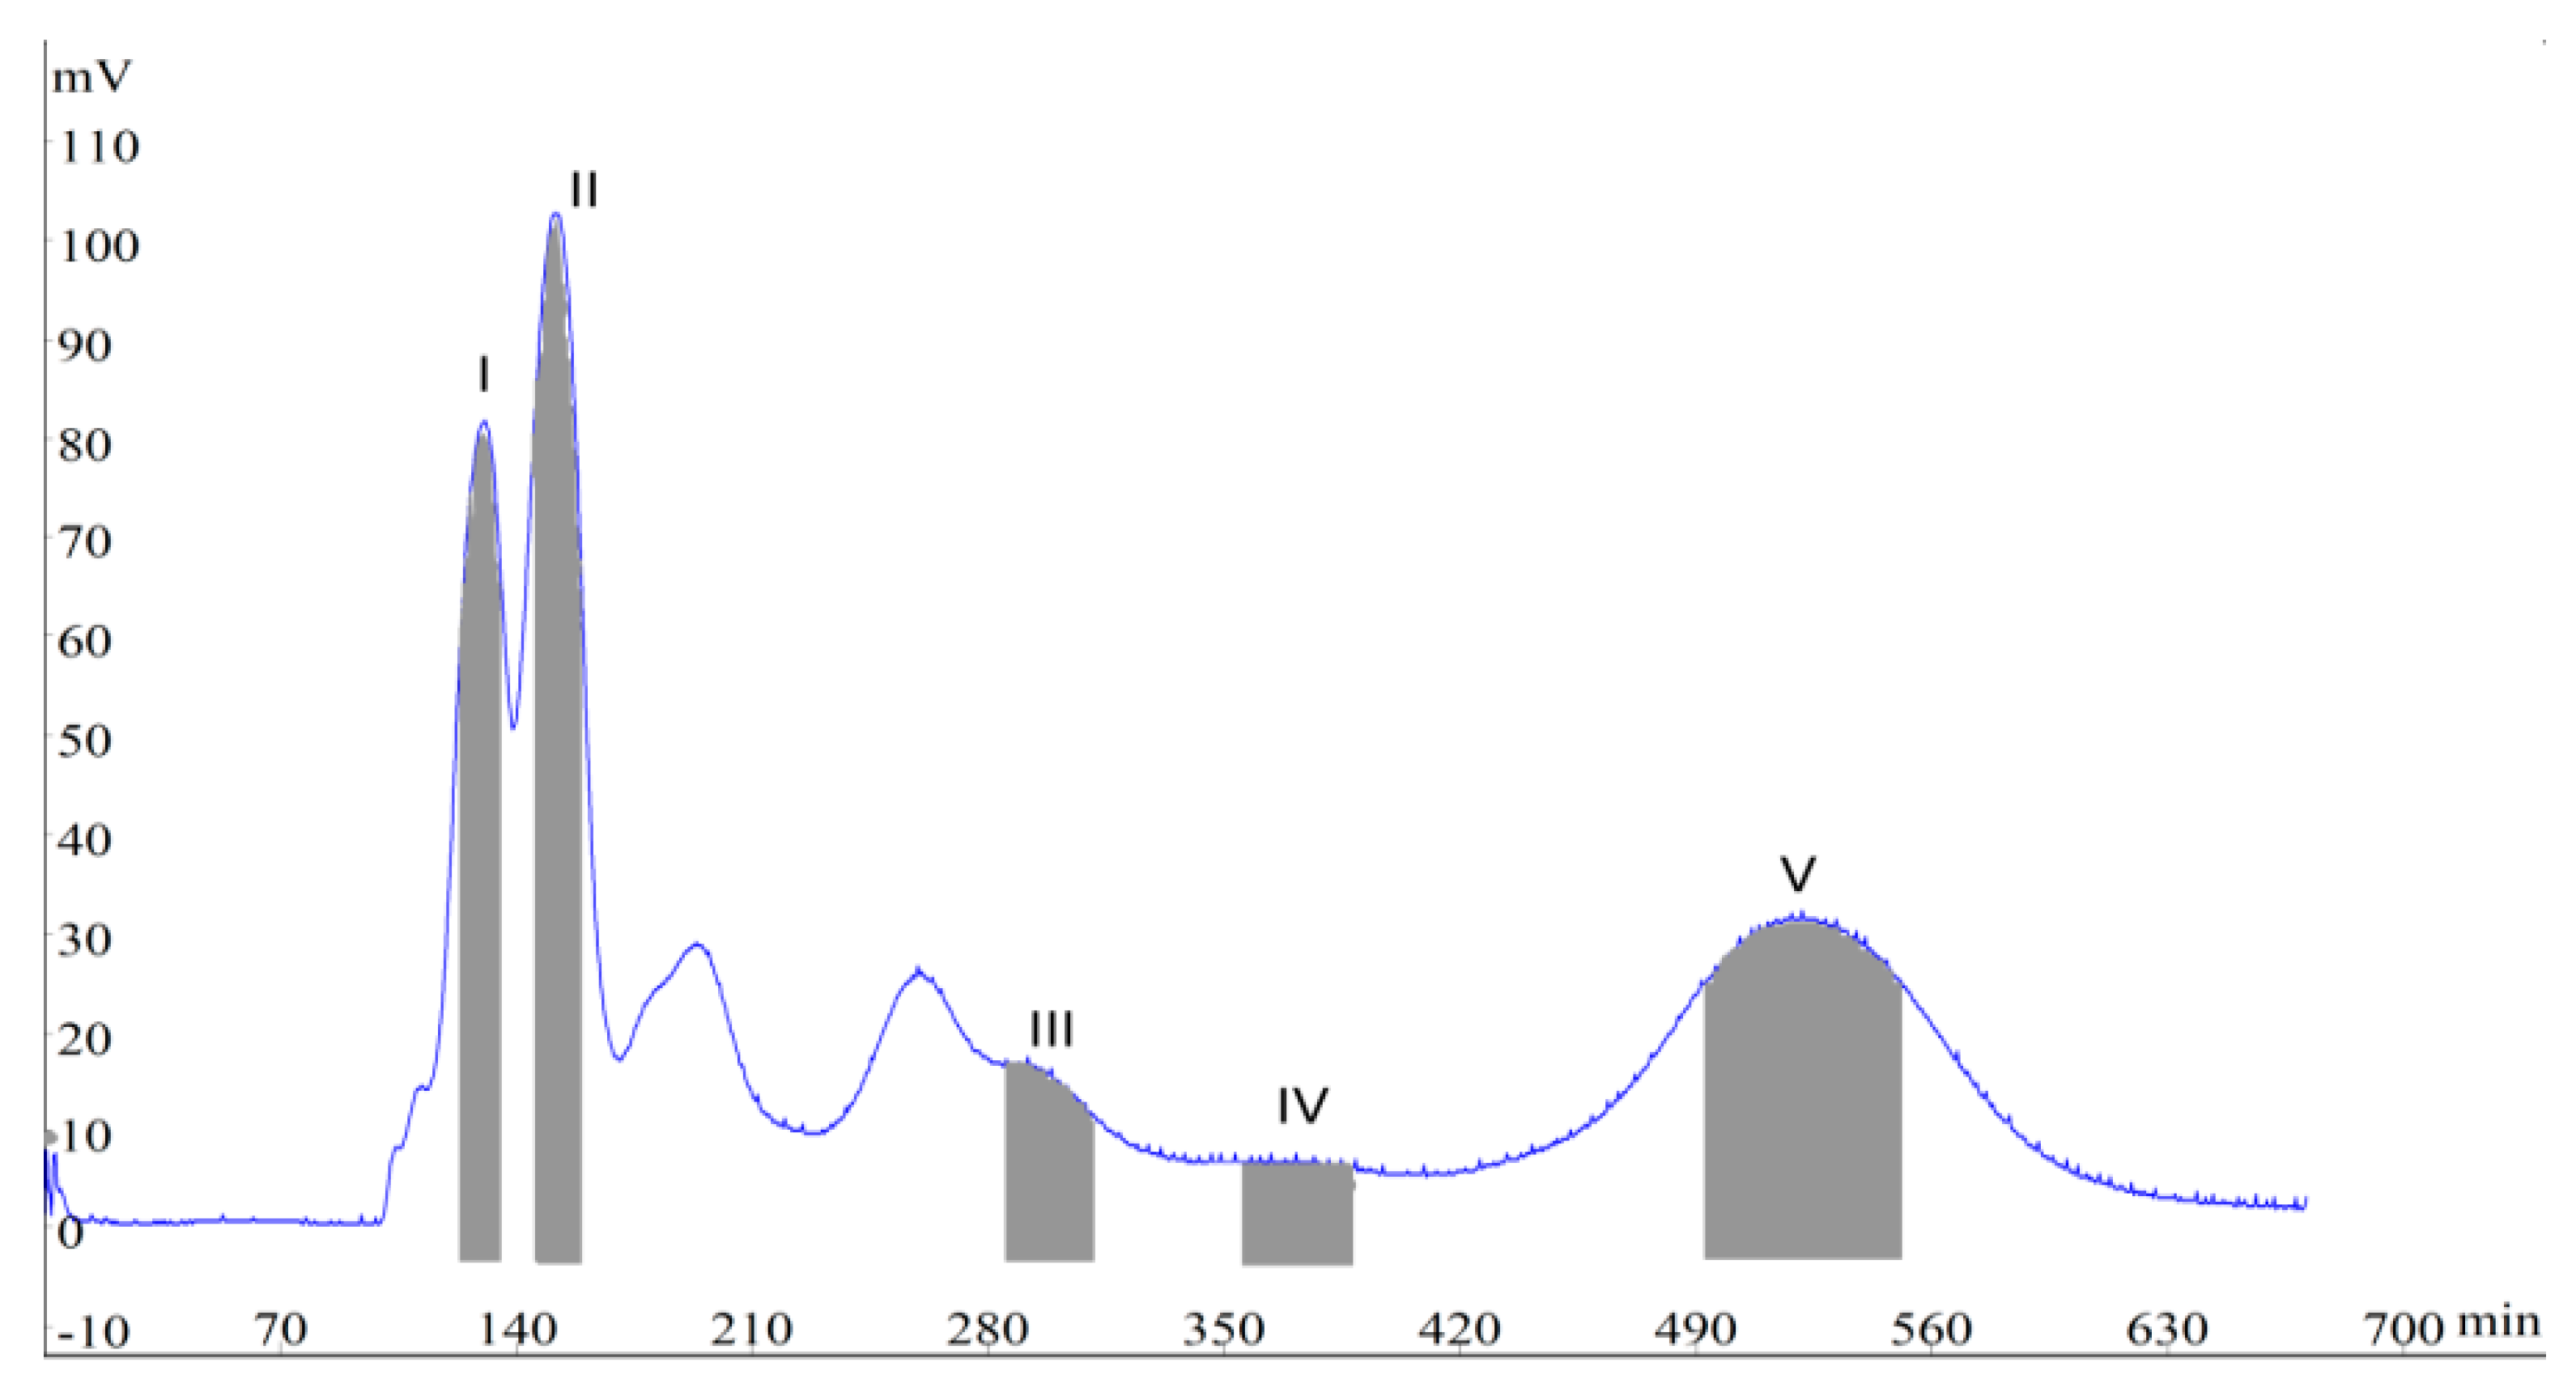
3.5. Procedure of HSCCC Separation

Firstly, the stationary phase (upper phase) was pumped into the multilayer coil with a flow rate of 50 mL/min, and then the operating speed was adjusted at 850 rpm. Next, the mobile phase (lower phase) was pumped at a flow rate of 2.0 mL/min. When the hydrodynamic equilibrium was reached, the sample solution was injected into the apparatus. The peak fractions were collected according to elution profiles at 230 nm. In the end of the process, the retention of the stationary phase was recorded as A1/A2, where A1 was the volume of the stationary phase pumped out from the column, and A2 was the total column volume.

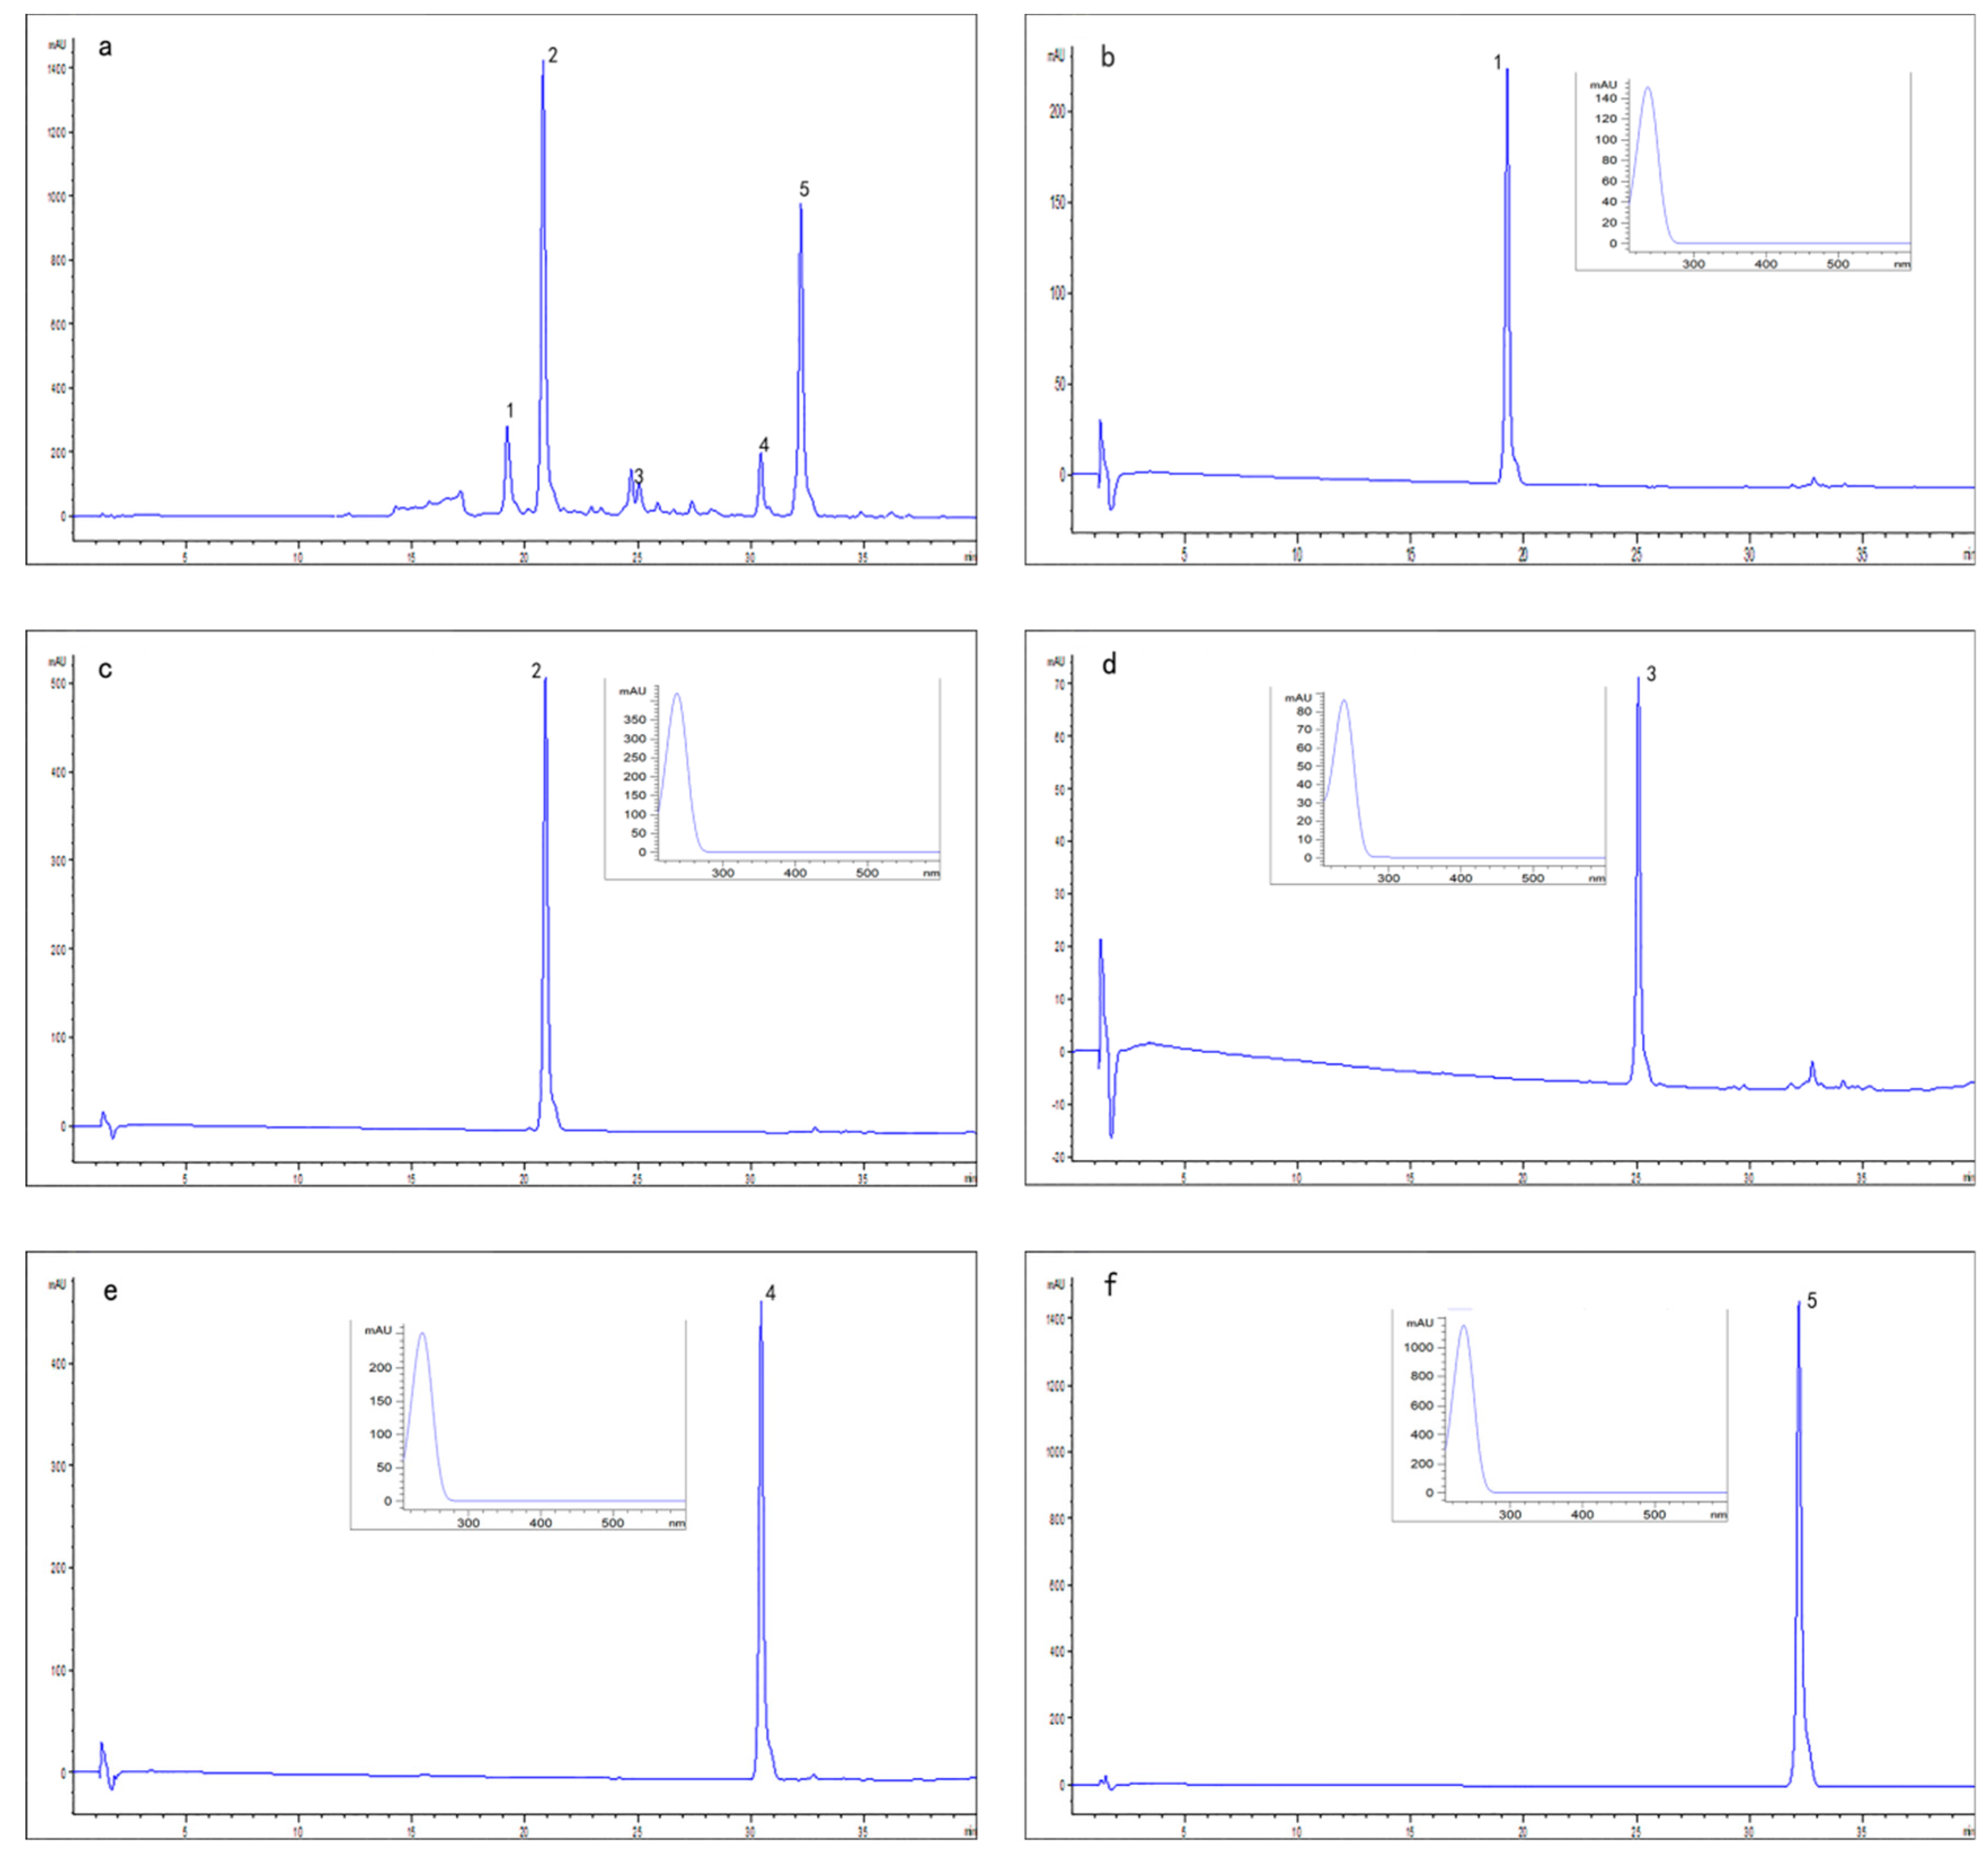
3.6. Analysis and Identification of Peak Fractions

The HPLC analysis of the crude sample and each peak fraction were performed as follows: an YMC-Pack ODS-A column (5 μm, 100 × 4.6 mm) was used with gradient elution at a flow rate of 1.0 mL/min. The mobile phase was methanol (A) and water (B) (0–0 min, 10–80% A). The work of identification was carried out by HR-ESI-MS and NMR data.

3.7. Anti-Inflammatory Assay

Anti-inflammatory activities were evaluated as the inhibition of β-glucuronidase release caused by platelet activating factor (PAF) in rat polymorphonuclear leukocytes (PMNs). The test sample was prepared with a concentration of 0.1 M, and then diluted to 1 mM. Then the test sample (5 µL) and rat PMNs suspension (2.5 × 10⁶ cell/mL, 245 µL) were added into a test tube, and the tube was incubated at 37 °C for 20 min. Subsequently, 1 mM cytochalasin B (2.5 µL) was added into the tube with incubation for 10 min, and then 0.2 mM PAF (2.5 µL) was added for another 10 min. The reaction was terminated by transferring the tube to an ice bath. The mixture was centrifuged at 4000 rpm for 5 min, and the supernatant was obtained [20].
The supernatant (25 µL) and 2.5 mM phenolphthalein glucuronic acid (25 µL) were added into a 96-well plate, and 0.1 M HOAc (100 µL) was used as buffer in each well. The plate was incubated in 37 °C for 18 h. The reaction was stopped by adding 0.3 M NaOH solution (150 µL). The results were read at 550 nm, and the absorption values of PAF, test samples and control samples were recorded as APAF, At, and Ac, respectively. Inhibition rate (IR) was calculated as IR (%) = (APAF − At) − (APAF − Ac) × 100%. The IC50 value was defined as the half maximal inhibitory concentration and Ginkgolide B was used as the reference.

3.8. Antibacterial Assay

Antibacterial activities were tested with gram-positive strains (Staphylococcus aureus ATCC 25923, Mycobacterium smegmatis ATCC 607) and gram-negative strains (Pseudomonas aeruginosa ATCC 27853, Escherichia coli ATCC 25922). Penicillin was used as the positive control group. Firstly, all the strains were inoculated on LB medium with 37 °C for 24 h. Then the cell density was diluted to 1 × 10⁵ cfu/mL. The sample solution was added into the bacterial suspension in 96-well plate and the mixture was incubated for 24 h at 37 °C. Each sample solution was tested in dilution series ranging from 100 to 0.20 µg/mL. The optical density was measured at 600 nm with a Tecan Spark microplate reader (Tecan Trading Co., Ltd., Shanghai, China). The minimum inhibitory concentration (MIC) values for the tested strains were recorded [21].

4. Conclusions

In conclusion, a HSCCC method, using a two-phase solvent system composed of ethyl acetate/n-butanol/methanol/water (5:1:1:5, v/v/v/v), was successfully established to isolate and separate iridoid glucosides from L. Japonicae Flos. Five iridoid glucosides, containing two new ones (3: adinoside F and 5: adinoside G), were obtained in one step, and their purities were 96.8%, 98.5%, 93.3%, 98.0% and 99.9%, respectively. All the five iridoid glucosides showed moderate anti-inflammatory effects and mild inhibitory activities against Staphylococcus aureus ATCC 25923. This study provided a faster and more efficient method to isolate and separate bioactive iridoid glucosides from L. Japonicae Flos, and that will be helpful in our further research.

Supplementary Materials

The following are available online: Figure S1–S3: HS-ESI-MS, 1H and 13C-NMR spectra of compound 1; Figure S4–S6: HS-ESI-MS, 1H and 13C-NMR spectra of compound 2; Figure S7–S14: UV, HS-ESI-MS, 1D and 2D NMR spectra of compound 3; Figure S15–S17: HS-ESI-MS, 1H and 13C-NMR spectra of compound 4; Figure S18–S25: UV, HS-ESI-MS, 1D and 2D NMR spectra of compound 5.

Author Contributions

R.Y. and L.F. performed the experiments, analyzed the data and wrote the manuscript. J.L. and Z.Z. revised the manuscript. H.Z. and Y.Z. designed the experiments. All authors approved the final manuscript.

Funding

This work was financially supported by the Standardization Project Fund of Administration of Traditional Chinese Medicine (ZYBZH-Y-SD-32), Postdoctoral Science Foundation of China (2017M622268), Specialized Fund for Dependent Innovation of Shandong Province (2016GSF202009), and the Youth Foundation of Shandong University of Traditional Chinese Medicine (2018ZK07).

Acknowledgments

The authors express their gratitude to Shandong University of Traditional Chinese Medicine for the donation of L. Japonicae Flos samples.

Conflicts of Interest

The authors report no conflicts of interest.

References

  1. Pharmacopoeia. Chinese Pharmacopoeia; China Medical Science Press: Beijing, China, 2015; p. 221. [Google Scholar]
  2. Deng, M.; Feng, J.; Song, F.; Pan, Y. The Preparation of Honeysuckle and Astragalus Anti-aging Mask. Guangdong Chem. Industry 2018, 45, 96–97. [Google Scholar]
  3. Wang, L.; Jiang, Q.; Hu, J.; Zhang, Y.; Li, J. Research Progress on Chemical Constituents of Lonicerae japonicae flos. Biomed. Res. Int. 2016, 2016, 8968940. [Google Scholar] [CrossRef] [PubMed]
  4. Zhou, W.; Shan, J.; Wang, S.; Cai, B.; Di, L. Transepithelial transport of phenolic acids in Flos Lonicerae Japonicae in intestinal Caco-2 cell monolayers. Food Funct. 2015, 6, 3072–3080. [Google Scholar] [CrossRef] [PubMed]
  5. Zhou, Y.; Zhou, T.; Pei, Q.; Liu, S.; Yuan, H. Pharmacokinetics and tissue distribution study of chlorogenic Acid from lonicerae japonicae flos following oral administrations in rats. Evid. Based Complement. Alternat. Med. 2014, 2014, 979414. [Google Scholar] [CrossRef] [PubMed]
  6. Han, M.H.; Lee, W.S.; Nagappan, A.; Hong, S.H.; Jung, J.H.; Park, C.; Kim, H.J.; Kim, G.Y.; Kim, G.; Jung, J.M.; et al. Flavonoids Isolated from Flowers of Lonicera japonica Thunb. Inhibit Inflammatory Responses in BV2 Microglial Cells by Suppressing TNF-alpha and IL-beta Through PI3K/Akt/NF-kb Signaling Pathways. Phytother. Res. 2016, 30, 1824–1832. [Google Scholar] [CrossRef] [PubMed]
  7. Obied, H.K.; Karuso, P.; Prenzler, P.D.; Robards, K. Novel Secoiridoids with Antioxidant Activity from Australian Olive Mill Waste. J. Agric. Food Chem. 2007, 55, 2848. [Google Scholar]
  8. Li, H.B.; Yu, Y.; Mei, Y.D.; Meng, Z.Q.; Wang, Z.Z.; Huang, W.Z.; Xiao, W.; Yao, X.S. A new hetero dimeric terpenoid derivative, japonicaside C, from the flower buds of Lonicera japonica. Nat. Prod. Res. 2017, 31, 143–148. [Google Scholar] [CrossRef] [PubMed]
  9. Tian, J.; Che, H.; Ha, D.; Wei, Y.; Zheng, S. Characterization and anti-allergic effect of a polysaccharide from the flower buds of Lonicera japonica. Carbohydr. Polym. 2012, 90, 1642–1647. [Google Scholar] [CrossRef] [PubMed]
  10. Park, H.S.; Park, K.I.; Lee, D.H.; Kang, S.R.; Nagappan, A.; Kim, J.A.; Kim, E.H.; Lee, W.S.; Shin, S.C.; Hah, Y.S.; et al. Polyphenolic extract isolated from Korean Lonicera japonica Thunb. induce G2/M cell cycle arrest and apoptosis in HepG2 cells: involvements of PI3K/Akt and MAPKs. Food Chem. Toxicol. 2012, 50, 2407–2416. [Google Scholar] [CrossRef] [PubMed]
  11. Wang, Y.; Chen, Y.; Deng, L.; Cai, S.; Liu, J.; Li, W.; Du, L.; Cui, G.; Xu, X.; Lu, T. Systematic separation and purification of iridoid glycosides and crocetin derivatives from Gardenia jasminoides Ellis by high-speed counter-current chromatography. J. Chromatogr. A 2015, 26, 202–208. [Google Scholar]
  12. Ito, Y. New continous extraction method with a coil planet centrifuge. J. Chromatogr. A 1981, 207, 161–169. [Google Scholar] [CrossRef]
  13. Sutherland, I.A.; Fisher, D. Role of counter-current chromatography in the modernisation of Chinese herbal medicines. J. Chromatogr. A 2009, 1216, 740–753. [Google Scholar] [CrossRef] [PubMed]
  14. Yue, H.L.; Zhao, X.H.; Wang, Q.L.; Tao, Y.D. Separation and purification of water-soluble iridoid glucosides by high speed counter-current chromatography combined with macroporous resin column separation. J. Chromatogr. B 2013, 936, 57–62. [Google Scholar] [CrossRef] [PubMed]
  15. Itoh, A.; Fujii, K.; Tomatsu, S.; Takao, C.; Tanahashi, T.; Nagakura, N.; Chen, C.C. Six secoiridoid glucosides from Adina racemosa. J. Nat. Prod. 2003, 66, 1212–1216. [Google Scholar] [CrossRef] [PubMed]
  16. Zheng, Z.F.; Zhang, Q.J.; Chen, R.Y.; Yu, D.Q. Four new N-contained iridoid glycosides from flower buds of Lonicera japonica. J. Asian Nat. Prod. Res. 2012, 14, 729–737. [Google Scholar] [CrossRef] [PubMed]
  17. Chen, J.; Song, Y.; Li, P. Capillary high-performance liquid chromatography with mass spectrometry for simultaneous determination of major flavonoids, iridoid glucosides and saponins in Flos Lonicerae. J. Chromatogr. A 2007, 1157, 217–226. [Google Scholar] [CrossRef] [PubMed]
  18. Machida, K.; Asano, J.; Kikuchi, M. Caeruleosides A and B, bis-iridoid glucosides from Lonicera caerulea. Phytochemistry 1995, 39, 111–114. [Google Scholar] [CrossRef]
  19. Kanno, M.; Kakuda, R.; Kikuchi, M. Studies on the Constituents of Hydrangea Species, II. On the Chemical Constituents of the Leaves of Hydrangea macrophylla subsp. serrata (THUNB.) MAKINO. J. Tohoku Pharm. Univ. 2007, 54, 57–61. [Google Scholar]
  20. Fang, L.; Fang, Z.-Y.; Zhou, P.; Bao, J.; Yu, J.-H.; Song, J.-T.; Zhou, J.; Zhang, H. Anti-inflammatory lignans from Melodinus suaveolens. Phytochem. Lett. 2018, 26, 134–137. [Google Scholar] [CrossRef]
  21. Wang, P.; Yu, J.H.; Zhu, K.; Wang, Y.; Cheng, Z.Q.; Jiang, C.S.; Dai, J.G.; Wu, J.; Zhang, H. Phenolic bisabolane sesquiterpenoids from a Thai mangrove endophytic fungus, Aspergillus sp. xy02. Fitoterapia 2018, 127, 322–327. [Google Scholar] [CrossRef] [PubMed]
Sample Availability: Samples of the compounds 15 are available from the authors.
Figure 1. Chemical structures of compounds 15.
Molecules 24 00197 g001
Figure 2. HSCCC chromatogram of the crude sample from L. Japonicae Flos. Two-phase solvent system: ethyl acetate/n-butanol/methanol/water (5:1:1:5, v/v/v/v); stationary phase: upper phase; mobile phase: lower phase; flow-rate: 2.0 mL/min; revolution speed: 850 rpm; detection wavelength: 230 nm; separation temperature: 25 °C.
Molecules 24 00197 g002
Figure 3. (a) HPLC analysis of the crude sample; (bf) HPLC chromatograms and UV spectra of compounds 15. Column: YMC-Pack ODS-A column (5 μm, 100 × 4.6 mm); mobile phase: methanol (A)-water (B) (0–40 min, 10–80% A); flow rate: 1.0 mL/min; detection wavelength: 230 nm; column temperature: 25 °C.
Molecules 24 00197 g003
Figure 4. 1H-1H COSY (blue bold bonds) and key HMBC correlations (red arrows) of compounds 3 and 5.
Molecules 24 00197 g004
Figure 5. Key NOEs (blue dashed arrows) in compound 3.
Molecules 24 00197 g005
Table 1. K values of target compounds in different solvent systems.
Solvent SystemsRatio (v/v)K
12345
ethyl acetate/n-butanol/water2:1:30.0920.1020.2100.3200.535
ethyl acetate/n-butanol/water4:1:50.1540.1610.2870.3510.710
ethyl acetate/n-butanol/water11:1:120.1220.1230.2250.3970.641
ethyl acetate/n-butanol/methanol/water11:0.5:0.5:110.1110.3680.4910.6410.697
ethyl acetate/n-butanol/methanol/water11:0.5:1:110.1730.4190.5360.8751.355
ethyl acetate/n-butanol/methanol/water11:3:0.5:110.6770.8591.0851.9103.352
ethyl acetate/n-butanol/methanol/water5:1:1:50.5100.7191.0901.5812.210
Table 2. 1H (600 MHz) NMR data of compound 1a and compounds 25 b (δ in ppm, J in Hz).
No12345
15.40 s5.50 d (5.4)5.51 d (8.2)5.50 d (5.2)5.50 d (8.2)
37.63 d (1.2)7.42 d (1.2)7.57 s 7.42 d (0.9)7.56 s
4-----
53.30 m2.91 m3.38 m2.93 m3.37 m
61.72 m, 1.82 m1.63 ddd (12.8, 8.0, 4.5), 2.06 m5.54 m1.63 m, 2.07 m 5.54 m
75.41 s4.49 dd (7.1, 4.5)5.55 m4.54 dd (6.8, 4.8)5.50 m
85.48 ddd (17.3, 10.5, 9.9)5.73 ddd (17.4, 10.2, 9.0)5.72 ddd (17.3, 10.3, 8.5)5.72 ddd (17.2, 10.3, 9.0)5.71 ddd (17.3, 10.5, 8.6)
92.63 m2.67 m2.59 m2.67 m2.58 m
105.27 m, 5.29 m5.26 brd (10.2), 5.30 brd (17.4)5.19 brd (10.6), 5.22 brd (17.3)5.26 brd (10.2), 5.30 brd (17.2)5.18 brd (10.5), 5.22 brd (17.3)
11-----
1′4.74 d (7.9)4.67 d (7.9)4.73 d (7.8)4.67 d (7.9)4.72 d (7.7)
2′3.45 m3.19 dd (8.7, 7.9)3.20 dd (8.8, 7.8)3.18 dd (8.9, 7.9)3.19 dd (8.8, 7.6)
3′3.60 t (8.5)3.10–3.40 m3.10–3.45 m3.10–3.40 m3.10–3.45 m
4′3.41 t (8.5)3.10–3.40 m3.10–3.45 m3.10–3.40 m3.10–3.45 m
5′3.65 m3.10–3.40 m3.10–3.45 m3.10–3.40 m3.10–3.45 m
6′3.66 m, 3.97 m3.66 dd (12.0, 6.0), 3.89 dd (12.0, 2.1)3.67 m, 3.89 dd (11.8, 1.7)3.65 dd (11.9, 6.0), 3.89 dd (11.9, 2.0)3.66 m, 3.88 dd (11.9, 1.8)
11-OMe-3.69 s3.68 s3.69 s3.67 s
1′′3.92 m, 3.87 m--3.60 m, 3.40 m-
2′′--3.06 m, 3.05 m1.54 m3.06 m
3′′--4.13 m, 4.11 m1.41 m4.07 m
4′′--1.24 t (7.4)0.94 t (7.4)1.61 m
5′′----1.39 m
6′′----0.95 t (7.4)
7-OMea-3.28 s-3.29 s-
7-OMeb-3.29 s---
a NMR data were obtained in chloroform-d. b Data were measured in methanol-d4.
Table 3. 13C (150 MHz) NMR data of compound 1a and compounds 25 b (δ in ppm).
No12345No12345
197.197. 897. 497. 997.44′70.271. 571. 571. 671.5
3152.3153. 2154.2153. 3154.25′76.178. 478. 578. 478.5
4104.7111.7109.5111.7109.56′65.362.8 62.8 62.8 62.8
522.029. 439.629. 339.611-OMe-51.751.851.751.7
629.533. 2133. 533. 1133.41′′62.3-173.566.3173.6
7100.1104.4126.6104.0126.62′′15.2-38.633.738.6
8131.6135. 8135. 8135. 8135.83′′--61.820.565.6
942.445.346.345.446.34′′--14.514.331.8
10121.2119. 8118. 8119. 8118.85′′----20.2
11169.1169. 1168. 8169. 1168.76′′----14.1
1′98.8100.1100.2100.1100.27-OMea-53.9-53.8-
2′73.574. 674. 774. 774.87-OMeb-52.5---
3′75.878. 078. 078. 178.0
a NMR data were obtained in chloroform-d. b Data were measured in methanol-d4.
Table 4. Anti-inflammatory activities of compounds 15.
Compound IC50 (µM)
15.90 ± 0.71
26.50 ± 1.10
34.52 ± 0.55
46.11 ± 0.93
55.35 ± 0.51
Ginkgolide B2.21 ± 0.40
Table 5. Antibacterial activities of compounds 15 against Staphylococcus aureus ATCC 25923.
CompoundMIC (µg/mL)
117.5 ± 3.1
223.4 ± 4.0
315.4 ± 2.1
426.0 ± 3.7
513.7 ± 1.9
Penicillin0.4 ± 0.1

