Article

Sphingolipidomic Profiling of Rat Serum by UPLC-Q-TOF-MS: Application to Rheumatoid Arthritis Study

1
School of Chemistry and Molecular Engineering, East China University of Science and Technology, Shanghai 200237, China
2
Shanghai Key Laboratory of New Drug Design, School of Pharmacy, East China University of Science and Technology, Shanghai 200237, China
*
Authors to whom correspondence should be addressed.
Molecules 2018, 23(6), 1324; https://doi.org/10.3390/molecules23061324
Submission received: 1 May 2018 / Revised: 14 May 2018 / Accepted: 21 May 2018 / Published: 31 May 2018

Abstract

:
Sphingolipids (SPLs) are biologically important molecules, but the structural diversity and complexity of SPLs brings significant analytical challenges for their study. In this paper, we have developed an UPLC-Q-TOF-MS-based sphingolipidomic approach for the comprehensive identification and quantification of SPLs in rat serum. A total of 120 SPLs covering seven subcategories were identified for the first time. Method validations including linearity, sensitivity, reproducibility, and recovery were also evaluated. This method was exemplarily applied to characterize the SPL alterations in rheumatoid arthritis (RA) rats and the intervention effects of indomethacin (IDM). Partial least squares-discriminant analysis (PLS-DA) showed that the model group was well separated from the control group, whereas the IDM-treated group exhibited a trend to recover the controls. Twenty-six significantly changed SPL markers were explored, and the levels of ceramides (Cers) and their metabolites were found to be reversed by IDM treatment. These results indicate that IDM exerts anti-arthritic effects through the suppression of Cer-mediated COX-2 activation and resulting PEG2 liberation. The present study demonstrates a promising potential of this method for the understanding of RA and the anti-arthritic mechanisms of relevant drugs.

Graphical Abstract

1. Introduction

Sphingolipids (SPLs) represent the largest class of bioactive lipids involved in many aspects of cell structure, metabolism, and regulation [1]. Dysregulation of SPL homeostasis has been implicated in various diseases, including inflammation, cancer, obesity, and neurodegenerative disorders [2,3,4,5]. All SPLs share the common backbones of sphingoid bases, a set of aliphatic amino alcohols that contains sphingosine (So) and sphinganine (Sa) (Figure 1). As the simplest type, sphingoid bases can be amide-linked with a fatty acid to convert into ceramide (Cer). These basic SPLs can be further derivatized to: (i) phosphates, e.g., sphingosine-1-phosphate (S1P) and ceramide-1-phosphate (C1P); (ii) phosphosphingolipids, e.g., sphingomyelin (SM); and (iii) glycosphingolipids, e.g., glucosylceramide (GlcCer) and lactosylceramide (LacCer). The structural diversity and complexity of SPLs, due to the numerous variations in sphingoid backbones, fatty acid chains, and head groups, brings significant analytical challenges for their study. Therefore, the introduction of “sphingolipidomics” aims for comprehensive analysis of all SPLs present in a biological system, and is urgently required to understand the roles of SPLs in biology and disease [1].
Nowadays, liquid chromatography-mass spectrometry (LC-MS) has become the most powerful technique for sphingolipidomic analysis owing to its high sensitivity, specificity, and throughput capabilities [6]. Nevertheless, because of the extreme complexity of SPLs, there are still several difficulties in current LC-MS methods using triple-quadrupole mass spectrometry (QQQ-MS) in multiple reaction monitoring (MRM) mode [6,7]. A key limitation is that the existing methods for SPL profiling often suffer from isomeric, isobaric, or isotopic interferences, leading to a failure in detection of the low-abundance but biologically important SPLs. To solve this problem, the latest methodology developed by our group is mainly based on ultra-performance liquid chromatography coupled with quadrupole time-of-flight mass spectrometry (UPLC-Q-TOF-MS) [8]. UPLC provides sufficient separation of the interfering species. High resolution Q-TOF-MS offers accurate mass measurements at both MS and MS/MS level, permitting a reliable identification for subsequent quantification. This strategy appears promising for sphingolipidomic studies, including the discovery of disease biomarkers, as well as the evaluation of therapeutic effects of drug [8,9].
Rheumatoid arthritis (RA) is a chronic, destructive, and autoimmune disease characterized by inflammation in movable joints [10]. Growing evidence shows the significant role of SPLs in the pathogenesis of RA, and also demonstrates their potential as therapeutic targets for RA treatment [10,11]. However, until now, there has been no sphingolipidomic study focusing on this area. Herein, we firstly report an UPLC-Q-TOF-MS-based sphingolipidomic approach for the comprehensive identification and quantification of SPLs in rat serum. The developed method was fully validated and applied to RA study. Serum samples collected from rats in control, model, and indomethacin (IDM)-treated groups were comparatively analyzed. Partial least squares-discriminant analysis (PLS-DA) was further employed to identify the arthritis-related lipid alterations and explore the anti-arthritic mechanism of IDM.

2. Results and Discussion

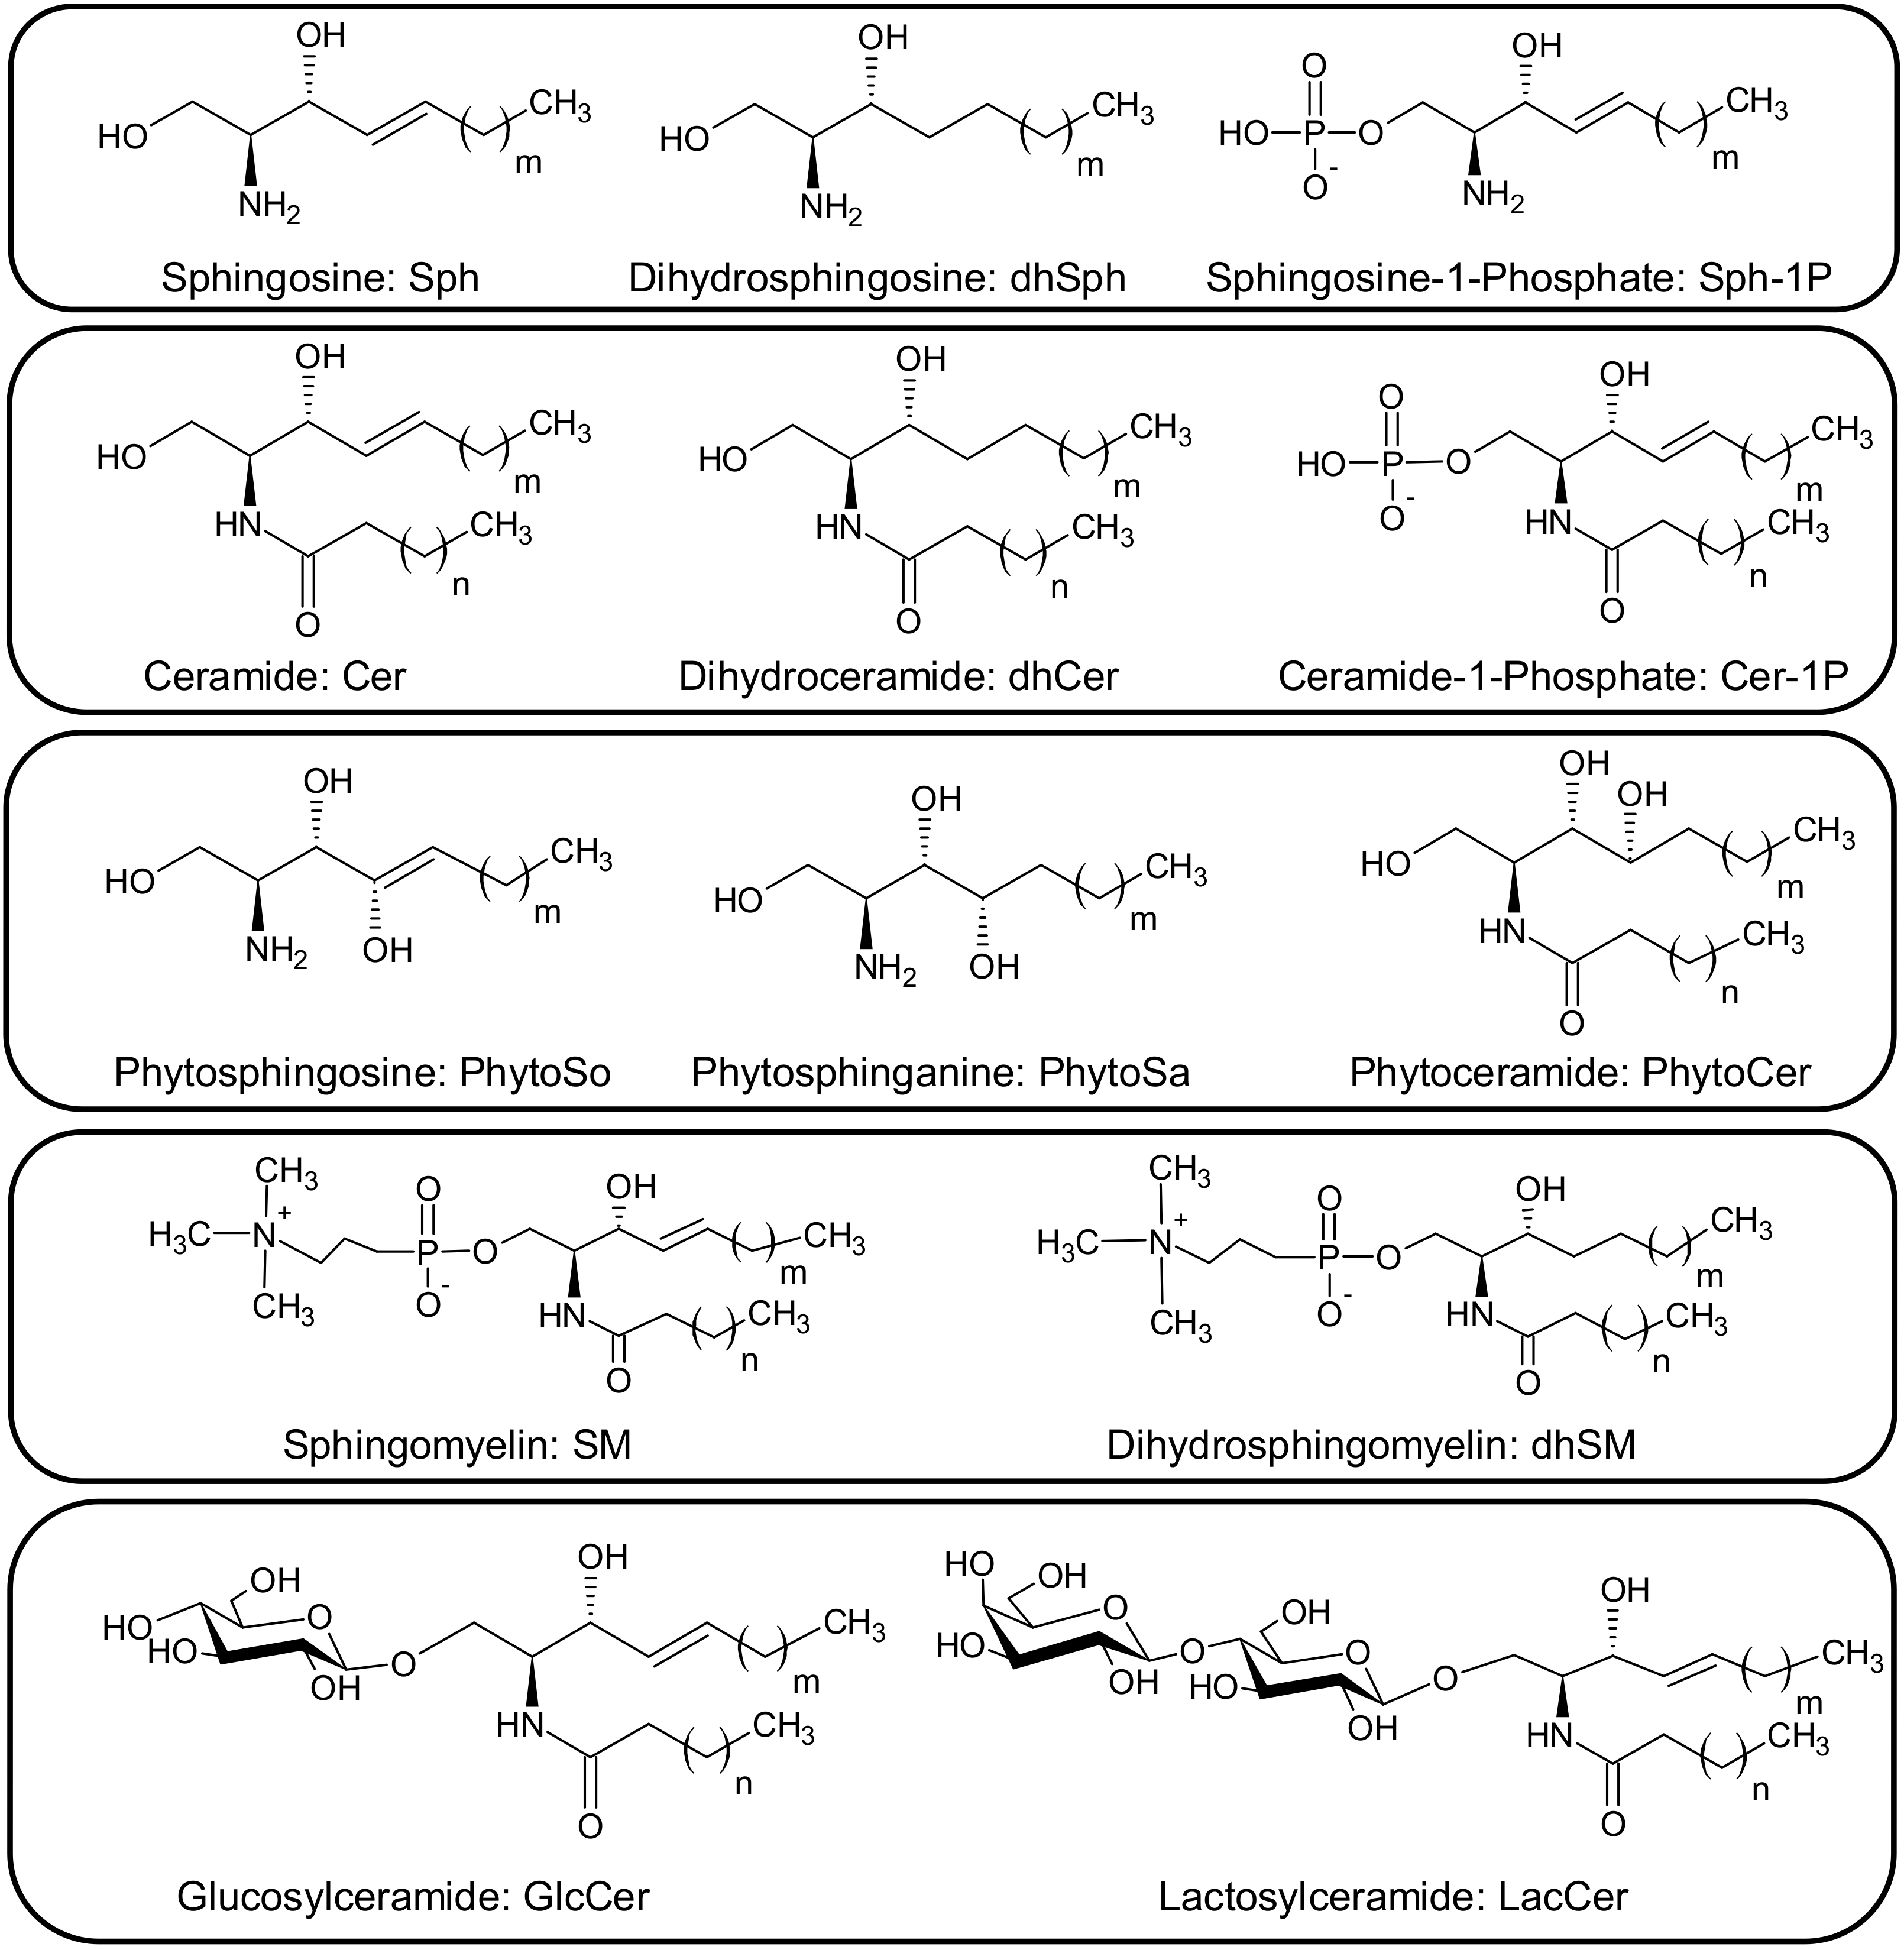
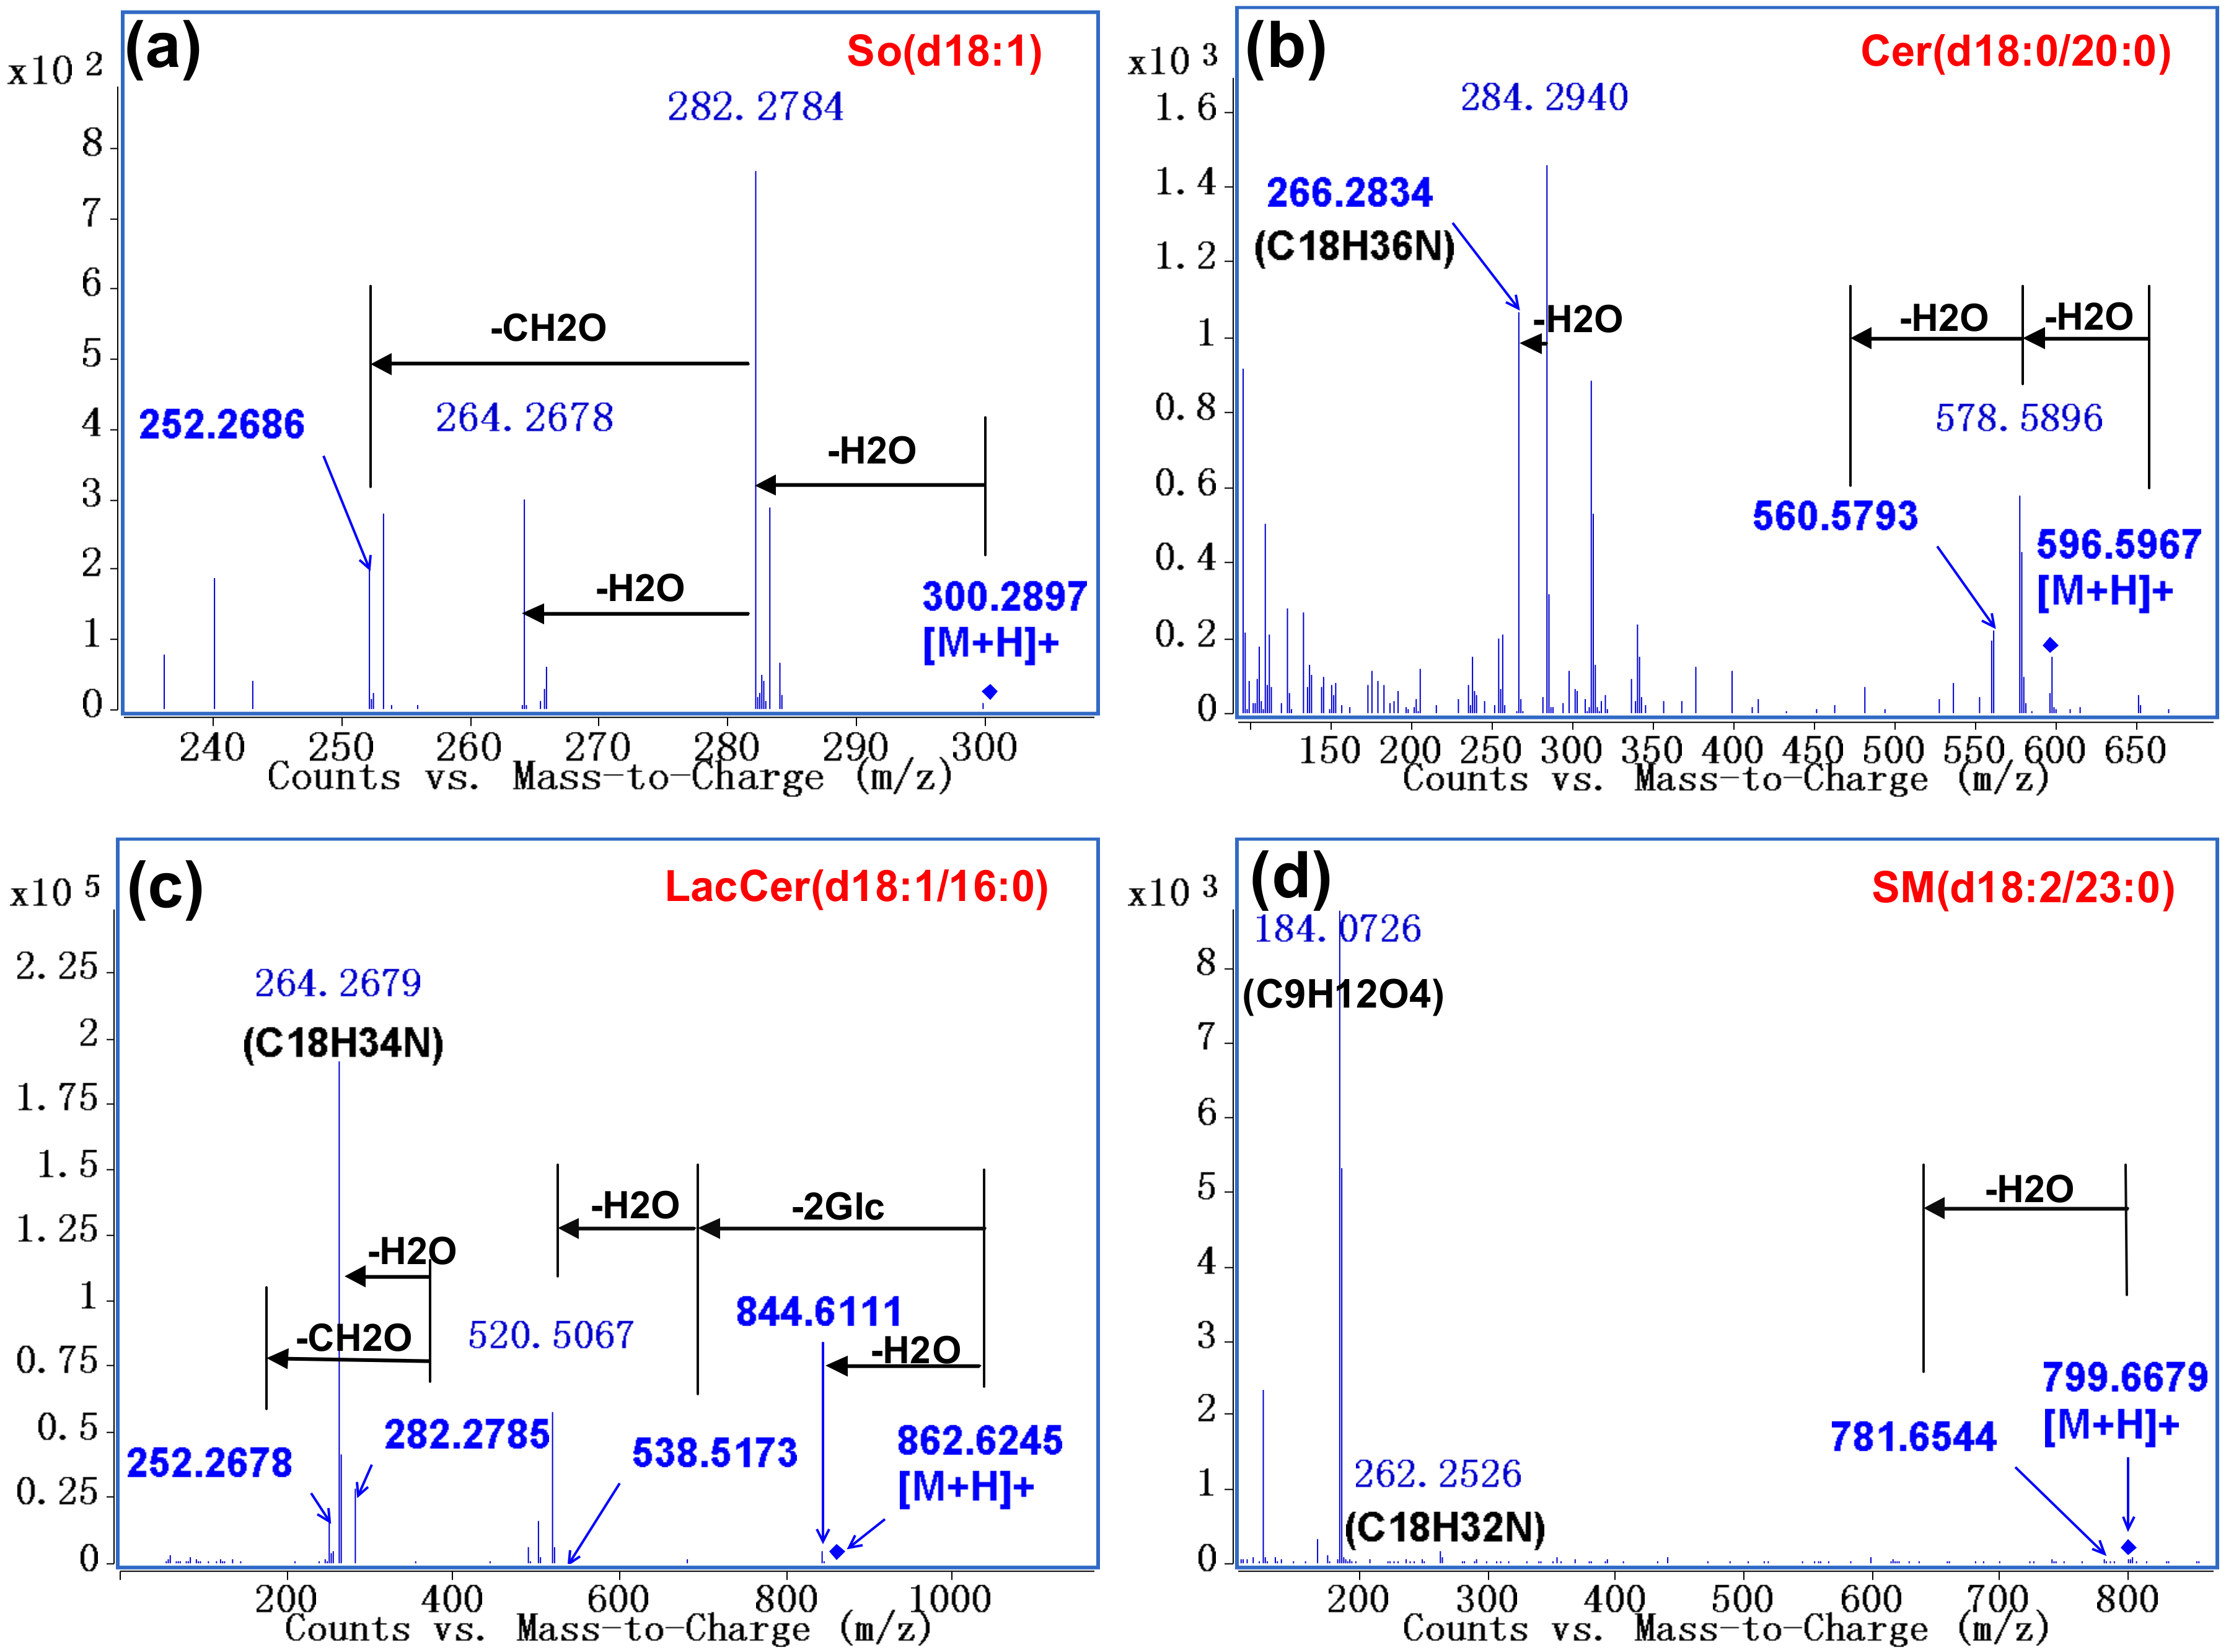
2.1. Comprehensive Identification of SPLs in Rat Serum

UPLC-Q-TOF-MS is a useful analytical tool to separate and identify SPLs in complex matrices. The targeted-MS/MS analysis offered by Q-TOF-MS provides the accurate mass of both molecular and fragment ions, which are informative for SPL identification. Taking m/z 300.2897 (So), 596.5967 (Cer), 862.6245 (LacCer), and 799.6679 (SM) as examples, the fragmentation patterns of each species were summarized, as shown in Figure 2. The neutral loss of H2O and/or HCHO observed from MS/MS spectra corresponds to the hydroxyl group in sphingoid backbone. The characteristic ions specific to sphingoid backbone are decisive for the structural elucidation of SPLs, e.g., m/z 266.2834, 264.2679, and 262.2526 ions for the assignment of d18:0, d18:1, and d18:2 backbones, respectively [6,8]. Additionally, the abundant phosphocholine ion at m/z 184.0726 is regarded as the diagnostic fragment for the confirmation of SMs [6]. For complex glycosphingolipids, the neutral loss of sugar units reflects their sugar residue compositions, e.g., two 162 u gaps from the ions of m/z 862.6245 to 538.5173 suggesting the sequential loss of two glucosyl groups. Based on these fragmentation rules mentioned above, a total of 120 SPLs were identified in rat serum samples, covering seven subcategories (i.e., So and Sa, S1P, Cer, C1P, hexosylceramide (HexCer), LacCer, and SM) with various sphingoid and fatty acid chain compositions (Table 1 and Figure S1). It is worth mentioning that HexCer includes GlcCer and galactosylceramide (GalCer), which cannot be distinguished by this method.
In the current analysis, MS signals might be interfered by isomeric or isobaric ions. A major interference in SPL identification is the isomeric species that have same molecular formula, thus, MS/MS data are necessary for discrimination. For example, the extracted ion chromatogram of m/z 652.6602 (mass accuracy within 5 ppm) yielded two Cer peaks at 20.3 and 20.9 min, respectively (Figure 3a). Further checking their MS/MS spectra revealed characteristic product ions corresponding to d18:0 (m/z 266.2839) and d20:0 (m/z 294.3151) backbones, providing evidence for the differentiation of the two isomers. Another issue is the isobaric interference from sodium adduct ions of SPLs. As seen in Figure 3b, the [M + H]+ ion of SM (d18:2/24:2) (calculated m/z 809.6533) coincides exactly with the m/z for [M + Na]+ ion of SM (d18:1/22:0) (calculated m/z 809.6516). In this case, the “real” [M + H]+ ion could be unambiguously assigned by the observation of its corresponding [M + Na]+ ion. Compared with other SPLs, identification of SMs is relatively difficult because they are more prone to form sodium adducts. It should be noticed that sufficient chromatographic separation aids in the elimination of isomeric/isobaric interferences and, therefore, facilitates accurate characterization and quantification of these species.
On the basis of optimized separation, linear regression models were constructed by plotting carbon number vs. retention time of SPLs sharing the same sphingoid backbone and unsaturated degree (Figure S2) [7,8]. Goodness of fit (R2 > 0.998 for each series) implies its capability for predicting retention behavior of the species given its chain composition, as well as for aiding in identification. This is also beneficial for the analysis of other biological samples enriched in SPLs, such as neural cells and tissues.

2.2. Method Validation for Quantitative Profiling

The established UPLC-Q-TOF-MS method was further validated for SPL quantification [7]. Aliquots of pooled serum from control rats were utilized for the method validation. Linearity was determined by spiking eight internal standards (IS) into samples prior to extraction at a series of spiked levels from 0.0167 to 25 µmol/L. Each sample was prepared in duplicate and measured twice. Calibration curves were constructed by linear regression. A wide dynamic range over three orders of magnitude was achieved for all IS with correlation coefficients (R2) better than 0.995. Limit of detection (LOD) and limit of quantification (LOQ) were defined as the lowest concentration when signal-to-noise ratio (S/N) of three and 10 were obtained, respectively. As shown in Table S1, the LOD and LOQ values of 8 IS ranged from 0.11–2.80 nmol/L and 0.36–9.33 nmol/L, respectively.
Intraday reproducibility was assessed by analyzing six replicates of the serum samples at different times within one day. For interday reproducibility, nine replicates of samples were measured during three consecutive days (each day three samples were prepared and analyzed). Endogenous SPLs belonging to different subcategories were randomly selected and relative standard deviations (RSDs) were used to evaluate the reproducibility. As seen in Figure S3, the RSDs of intraday and interday variations for eleven representative SPLs were lower than 4.6% and 8.8%, respectively. Recovery was verified by comparing peak areas of IS spiked into samples before and after SPL extraction at three different levels (5, 50, and 500 pmol). At each spiked level, triplicates of samples were prepared and analyzed. The extraction recoveries of all IS were between 91.3% and 108.5% with RSDs less than 12.5% (Table S2). All above results demonstrated that the proposed method was acceptable for routine SPL profiling.

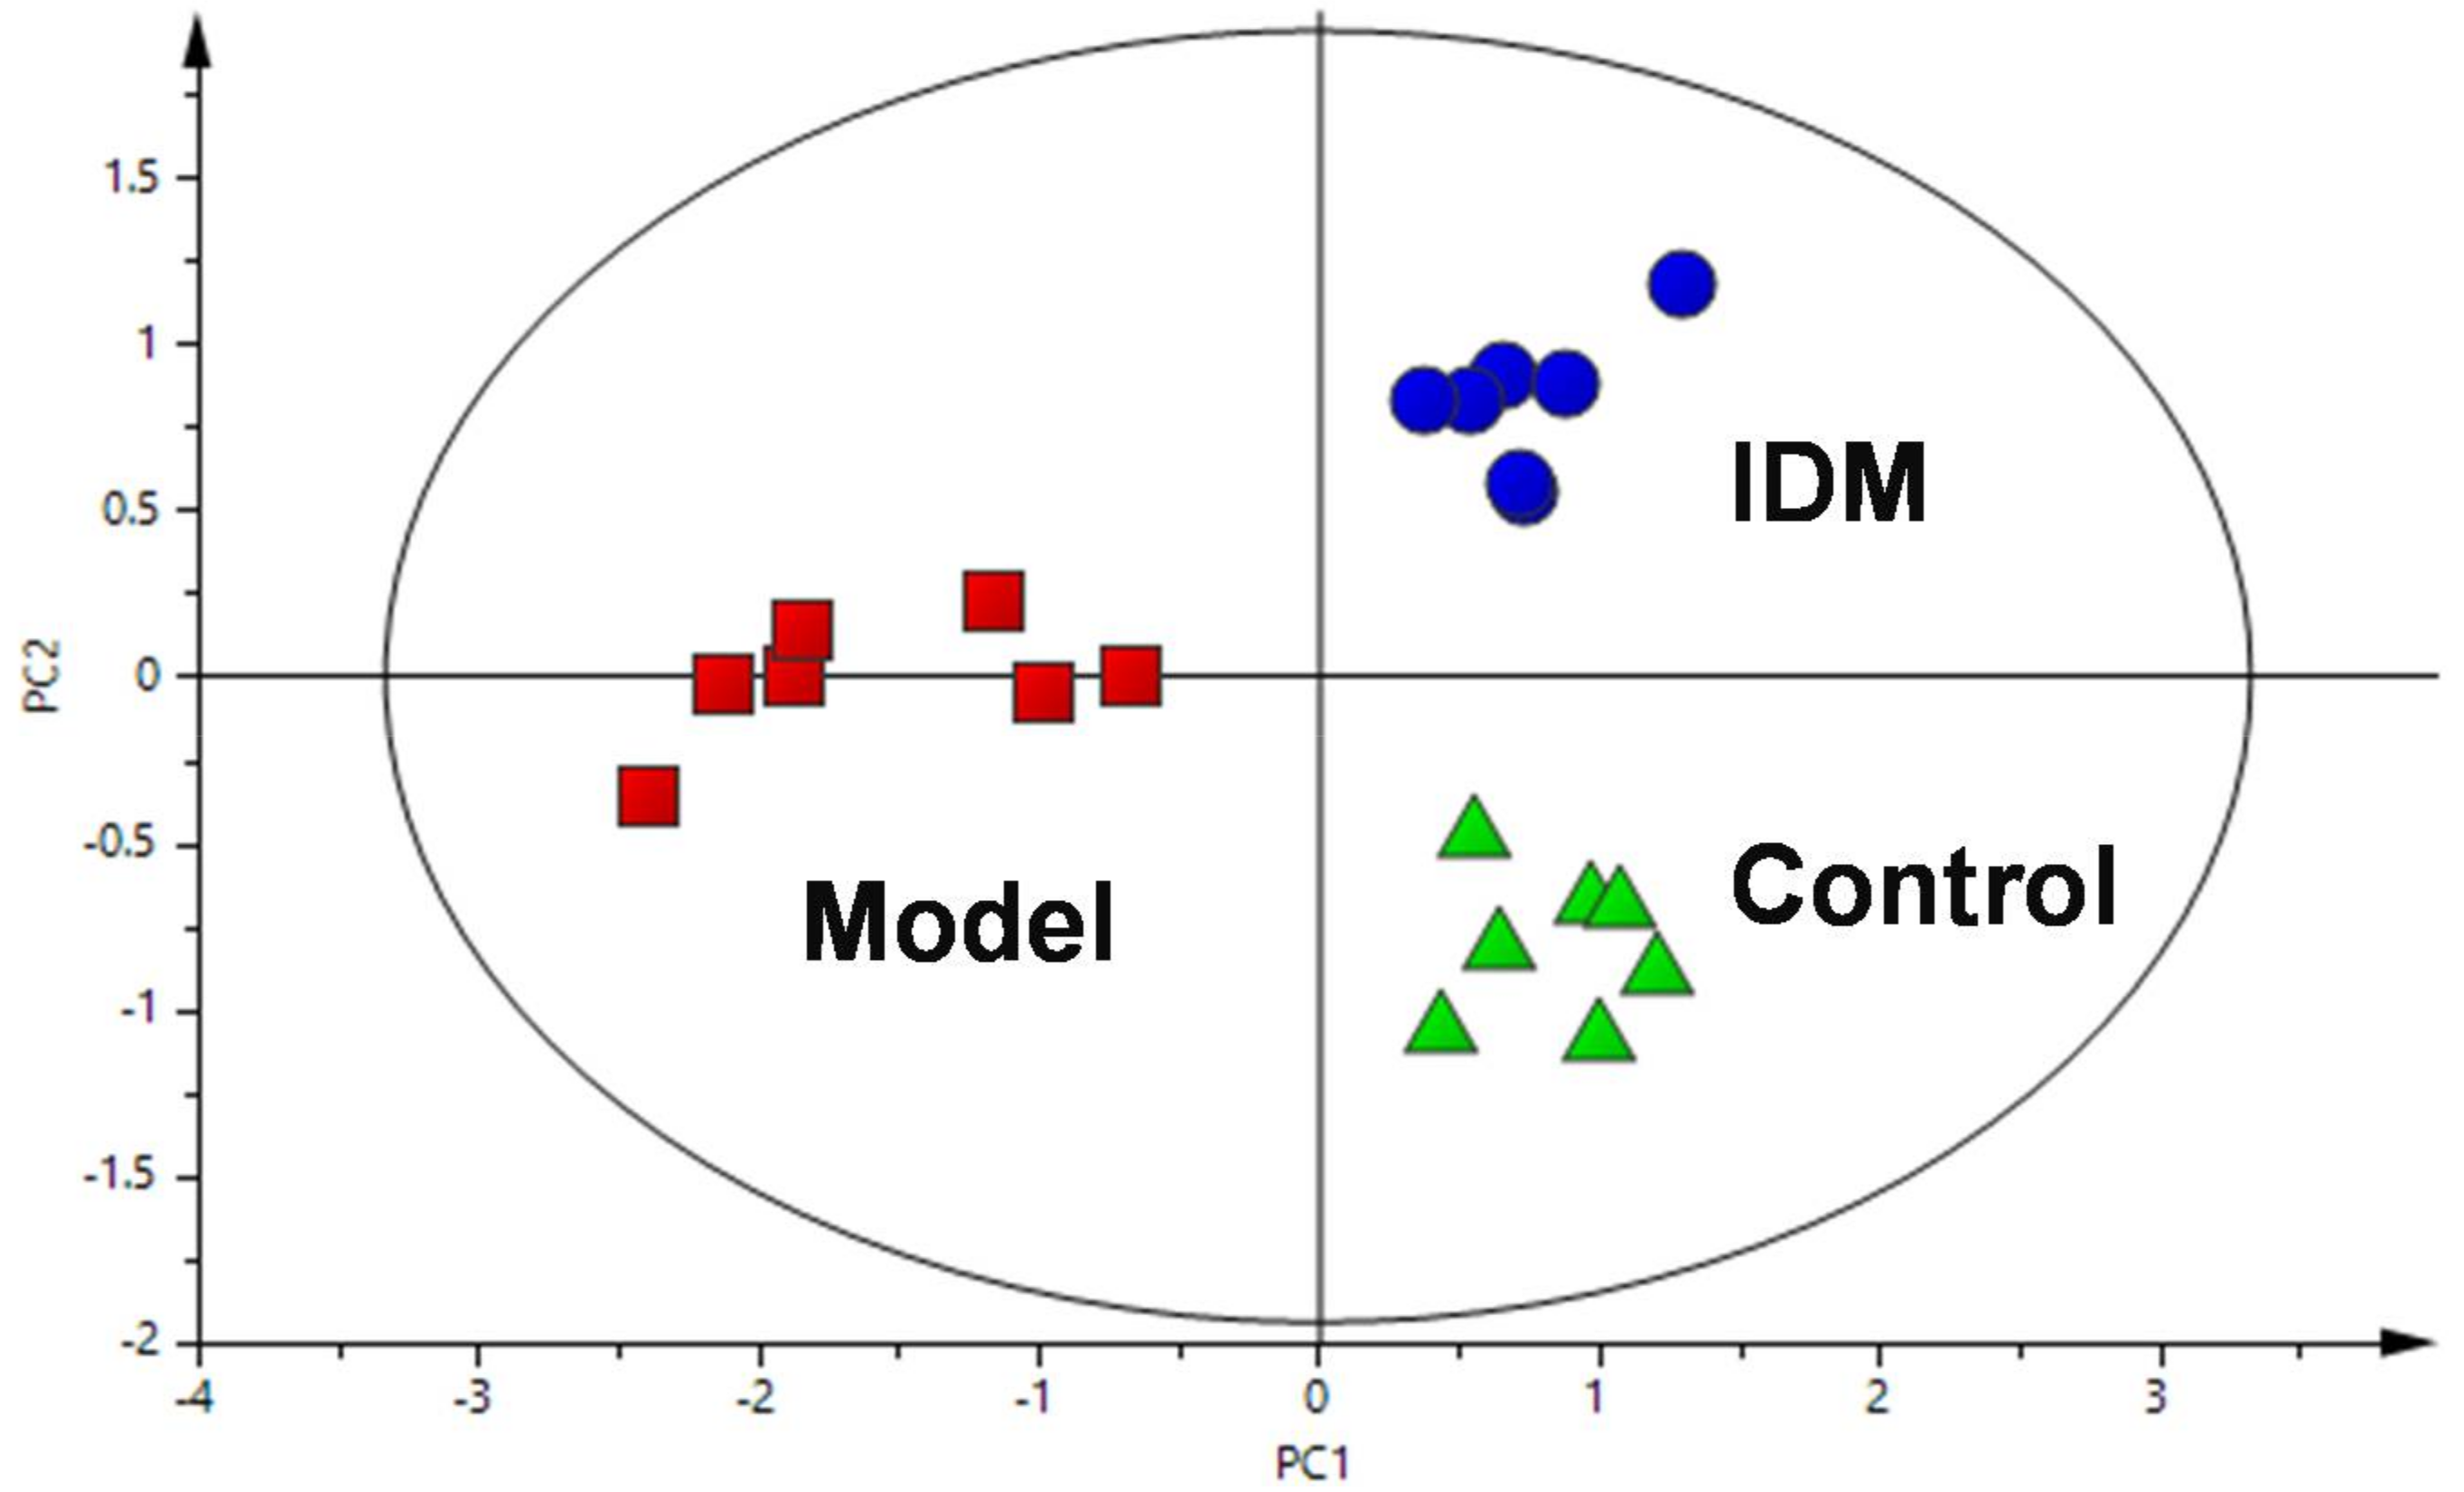
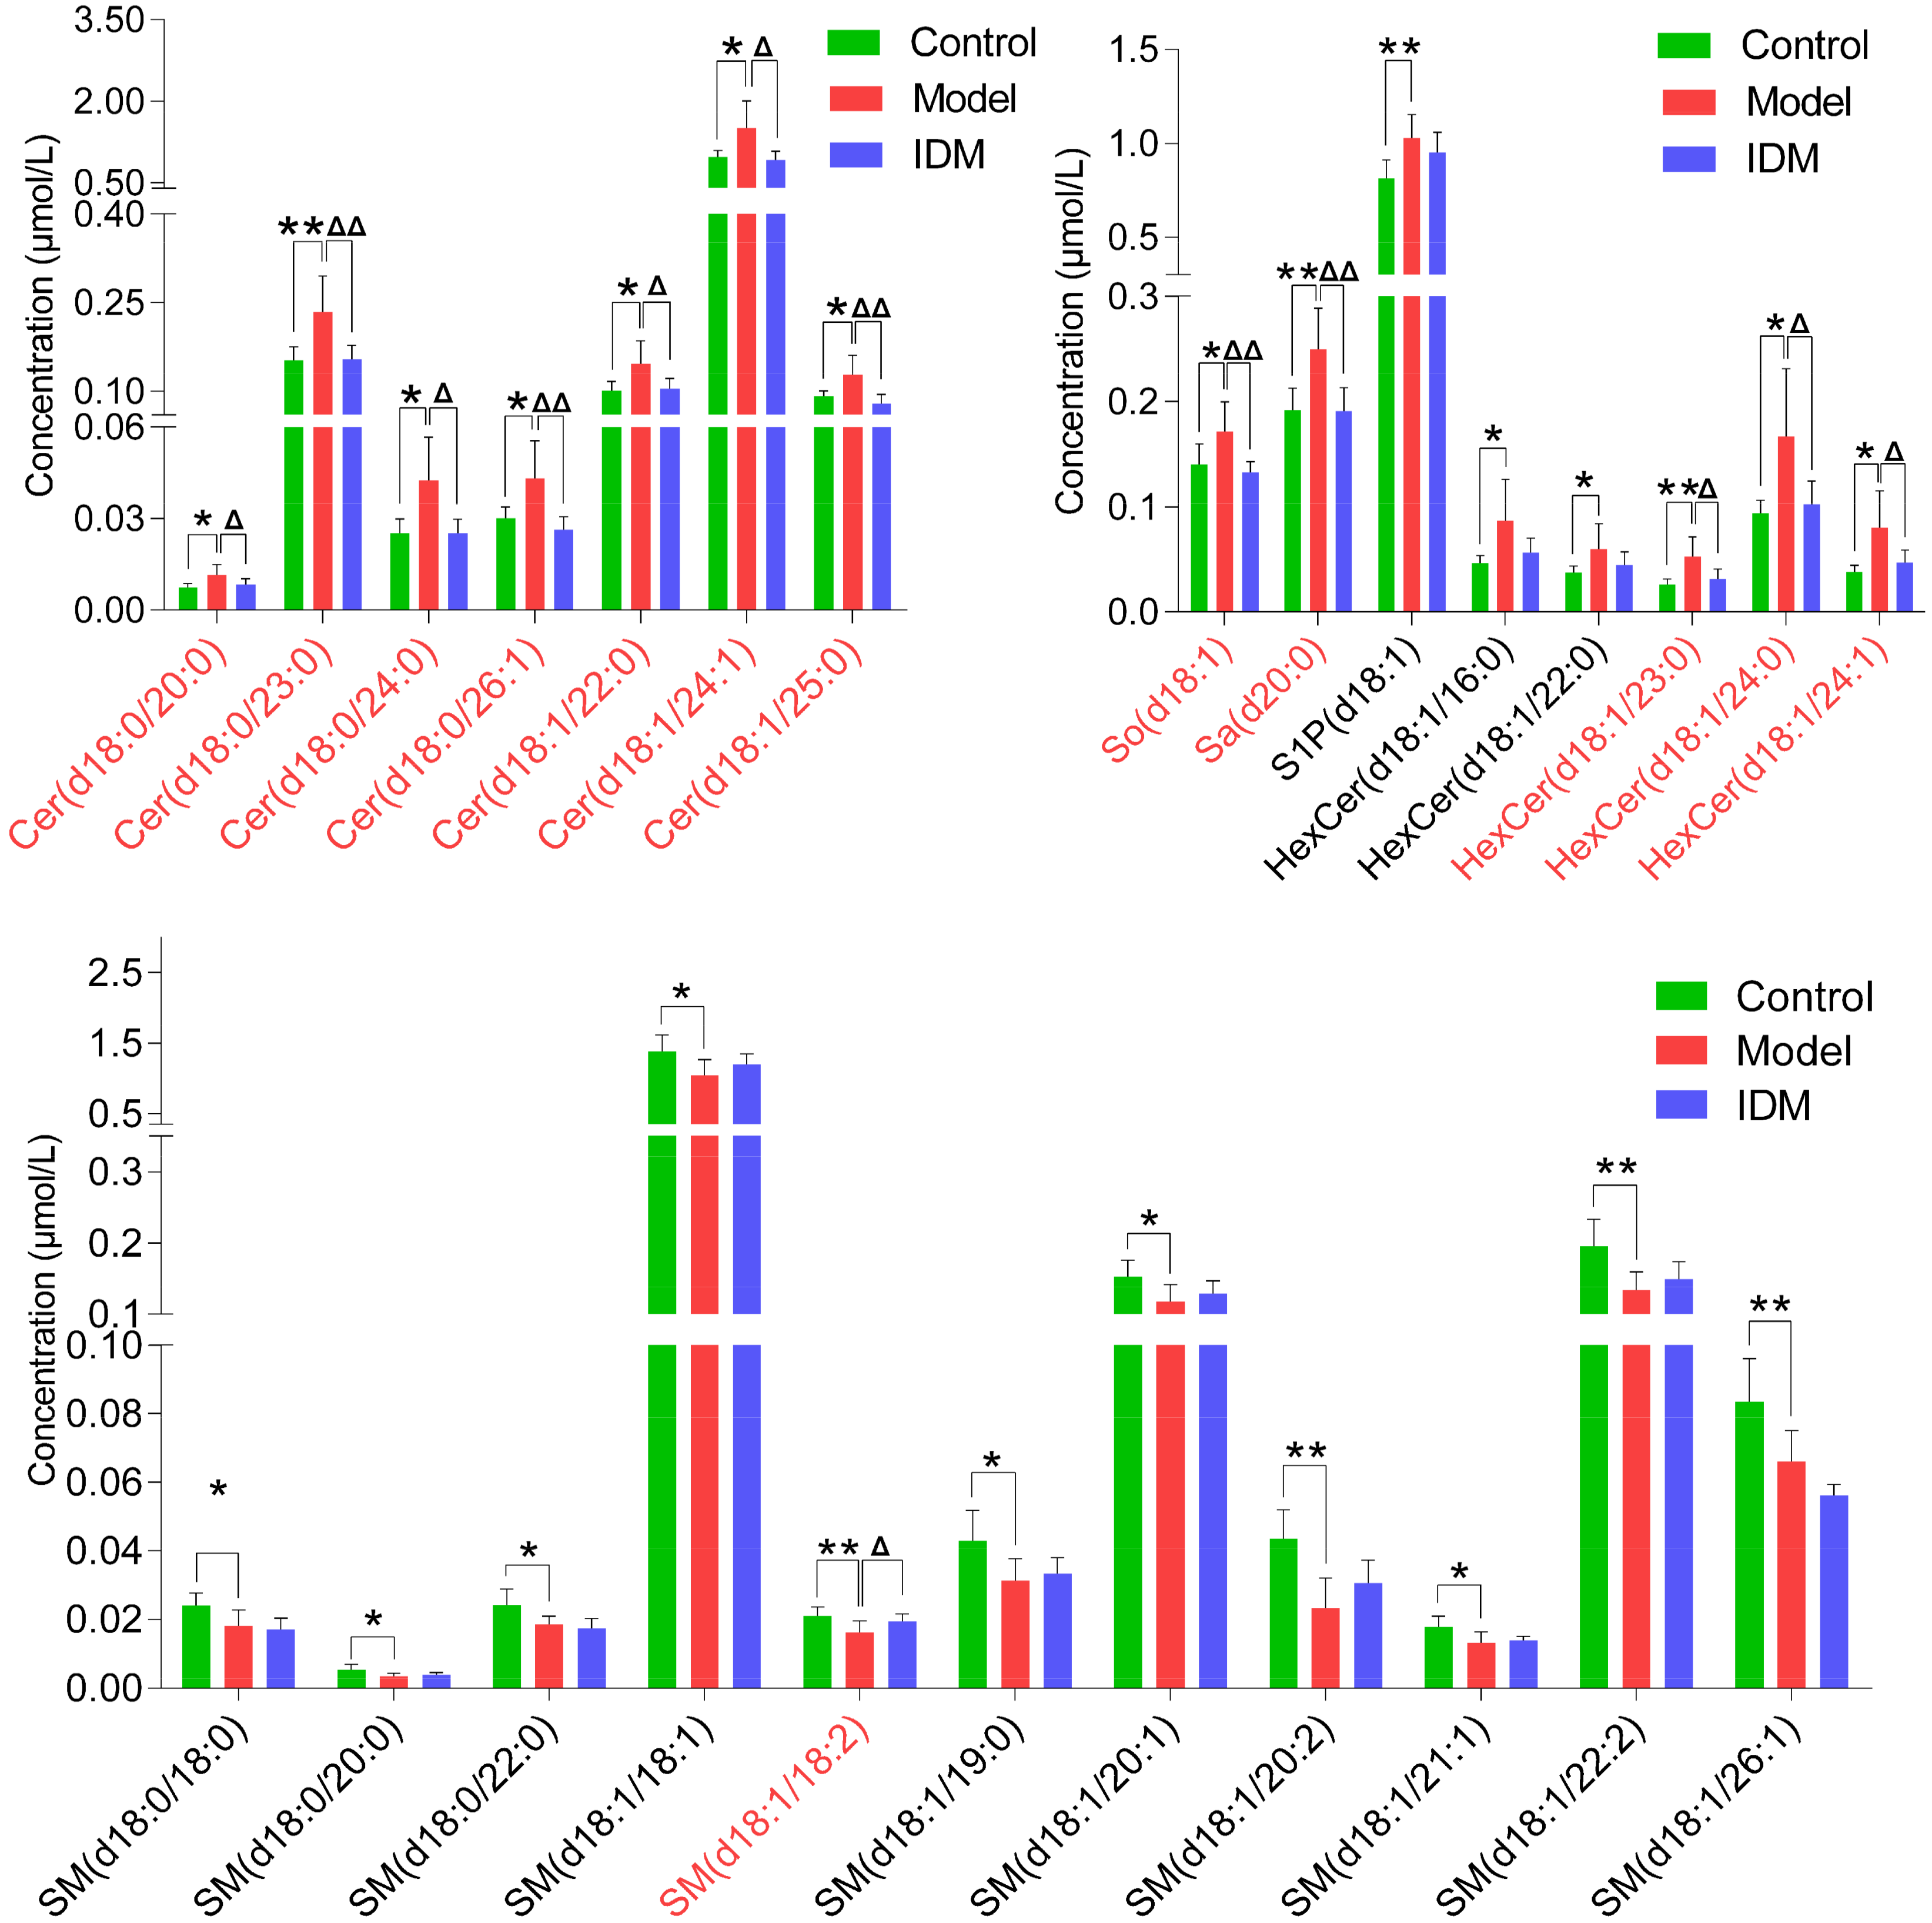
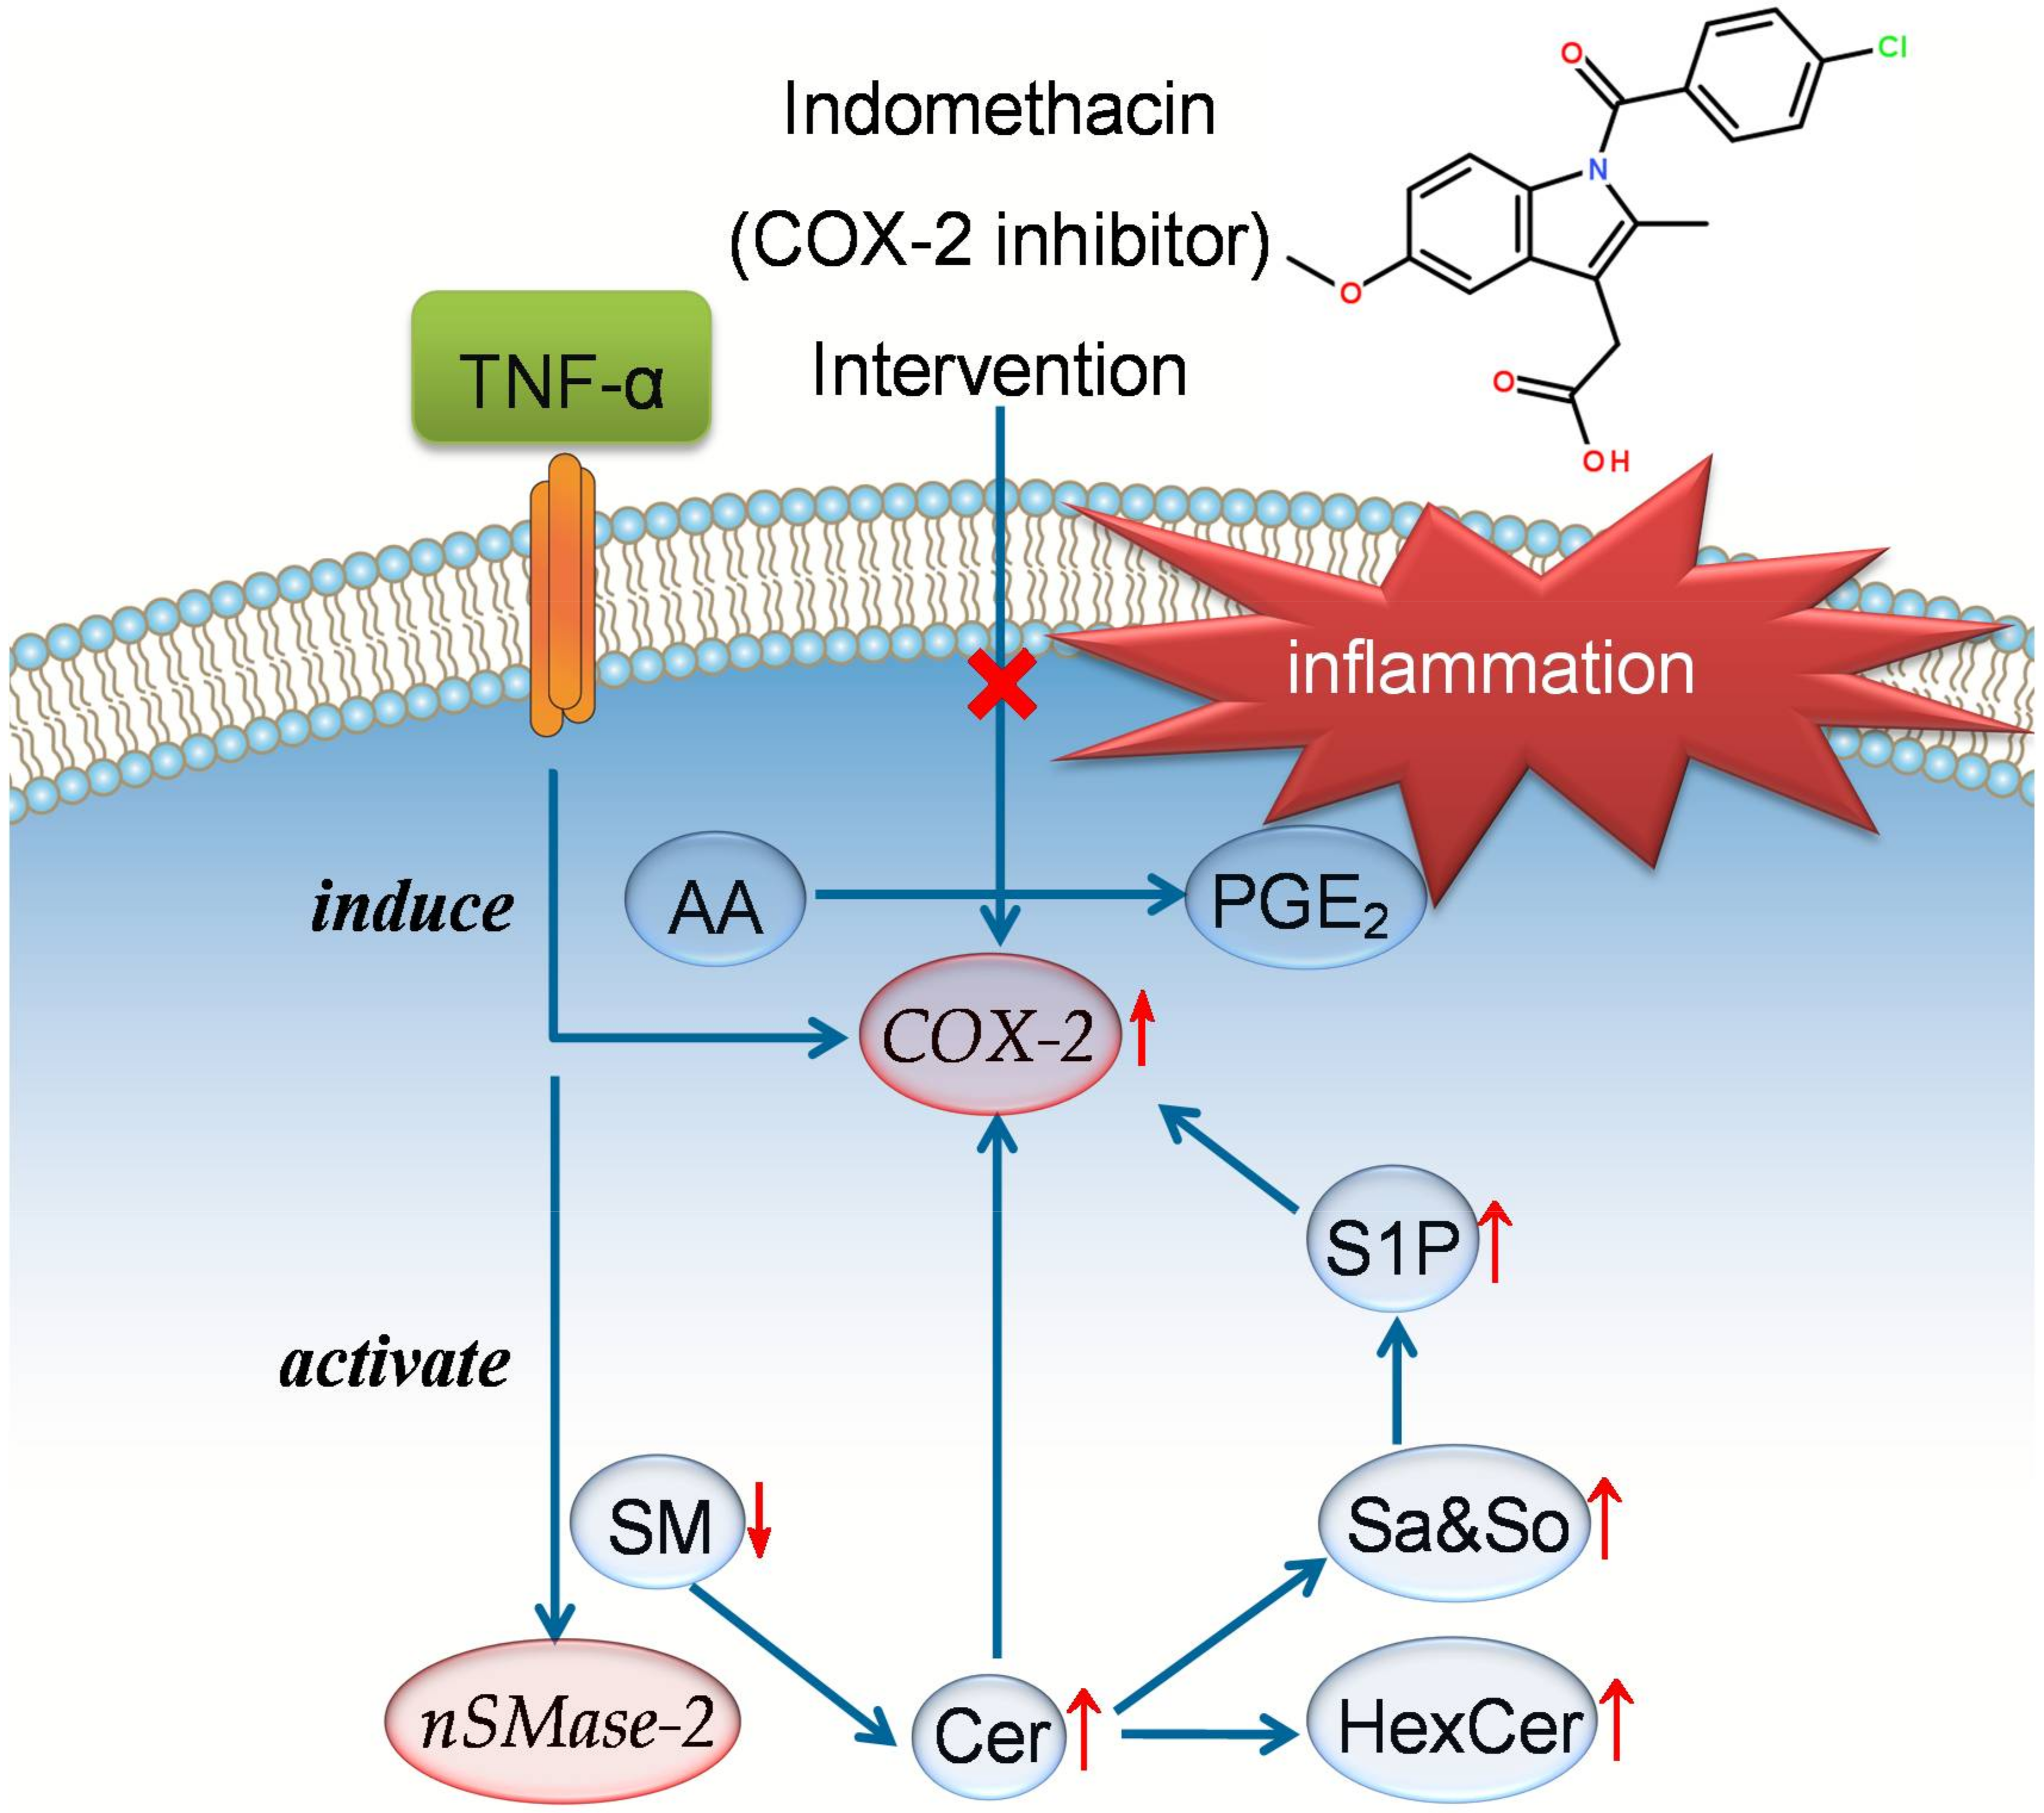
2.3. Application in Study of RA and IDM Intervention in Rats

To show the potential of the developed method, sphingolipidomic profiling was applied to rat serum samples obtained from control, model, and IDM-treated groups. A PLS-DA method was then used to visualize the lipid variations among these samples (Figure 4). The score plot showed a clear separation between the control and model groups in the first dimension, indicating a distinct arthritis induced by CFA. After the treatment of IDM, the serum SPL profiles were found to move away from the models and exhibit a tendency to restore to the controls, reflecting a protective effect of IDM against RA. Additionally, alterations of differential SPLs contributing to the classification were also investigated via one-way ANOVA analysis. Twenty-six SPLs were, therefore, selected as potential inflammatory markers, as shown in Figure 5.
In the identified markers, Cers, HexCers, So, Sa, and S1P displayed up-regulation in the arthritic model rats, while SMs were down-regulated. These results suggest that an impaired SPL metabolism is involved in RA (Figure 6). During inflammation, the key cytokine TNF-α can induce the overexpression of cyclooxygenase-2 (COX-2) and promote the release of pro-inflammatory prostaglandin E2 (PGE2) [2,12]. TNF-α also stimulates specific SPL metabolic enzymes, including ceramidase (CDase) and sphingosine kinase (SphK), to increase the levels of Cers and S1P [13,14]. As the structural core of SPLs, Cer is thought to have crucial roles in the development of inflammation Recent evidence has revealed that Cer accumulation enhances the COX-2 expression and PEG2 liberation, giving rise to various inflammatory diseases [15,16]. In addition to Cer, S1P is also able to activate the COX-2 enzyme and trigger the production of PEG2 [14]. SphK activation and high S1P levels have been reported in the synovial fluids of patients with RA [17]. Therefore, our findings of significant increment of Cers (together with their metabolites HexCers or So) and S1P in arthritic rats indicate an involvement of TNF-α-mediated inflammation in RA. Furthermore, neutral sphingomyelinase-2 (nSMase-2), which hydrolyzes SM into Cer, plays an important role in the inflammatory process. This enzyme has been shown to be activated by TNF-α, resulting in a reduction in SMs and of elevation of Cers observed in this study [18]. We here propose that the increased activities of nSMase-2 and accelerated SM hydrolysis are also contributed to the pathogenesis of RA.
The present work further demonstrated that IDM administration could ameliorate the CFA-induced RA in rats. IDM is a common nonsteroidal anti-inflammatory drug that has been effectively used in the management of arthritis disease. Its mechanism of action is through inhibition of COX-2 activity to block the biosynthesis of PEG2 [19]. As seen in Figure 5, the levels of specific SPL markers, including Cers and their metabolites, were significantly reversed by IDM treatment. These results indicate that IDM exerts anti-arthritic effects by down-regulating Cer synthesis, leading to the suppression of COX-2 activation and resulting PEG2 production in RA (Figure 6). In contrast, no significant intervention effects were observed for most SMs, suggesting that IDM has less impact on the nSMase-2-activated SM hydrolysis pathway. Our sphingolipidomic data, thus, affirm and extend previous research on the therapeutic actions of IDM.

3. Materials and Methods

3.1. Chemicals and Materials

The IS mixture (25 µmol/L for each SPLs in ethanol, catalog LM-6005) was purchased from Avanti Polar Lipids (Alabaster, AL, USA). It was composed of uncommon SPLs including So (d17:1), Sa (d17:0), S1P (d17:1), Cer (d18:1/12:0), C1P (d18:1/12:0), GlcCer (d18:1/12:0), and LacCer (d18:1/12:0), and SM (d18:1/12:0). Complete Freund’s adjuvant (CFA), ammonium acetate (NH4Ac) and formic acid (HCOOH) were purchased from Sigma-Aldrich (St. Louis, MO, USA). LC-MS-grade methanol (MeOH), chloroform (CHCl3), and isopropanol (IPA) were purchased from Merck (Darmstadt, Germany). Ultrapure water (18.2 MΩ) was purified with a Milli-Q system (Millipore, Burlington, MA, USA). All other chemicals used were of analytical grade. Indomethacin (IDM) was obtained from Shanghai Shyndec Pharmaceutical Co., Ltd. (Shanghai, China).

3.2. Animal Experiment

All experimental procedures were approved by the Ethics Committee of the Laboratory Animal Center of East China University of Science and Technology (project code: 20160917-2, approved date: 17 September, 2016). A total of 21 male SD rats (180 ± 10 g) were purchased from Shanghai SLAC Laboratory Animal Co., Ltd. (Shanghai, China). All animals were housed in an air-conditioned room at temperature of 25 ± 1 °C, relative humidity of 50 ± 10%, and 12 h dark/light cycle. The rats were fed with certified standard chow and tap water ad libitum. After one week of acclimation, rats were randomly divided into three groups as follows: the control, model, and IDM groups (n = 7 in each group). The model rats and IDM treated rats were injected intradermally with CFA (0.1 mL) for 20 days to induce arthritis. The control rats received an equal amount of physiological saline during the whole experiment. From days 11 to 20, the IDM group was injected intraperitoneally with IDM at a dose of 3 mg/kg body weight. At the end of the period, all animals were sacrificed and the sera were obtained for the following analysis.

3.3. Sample Pretreatment

The extraction of rat serum SPLs was according to our established procedures with minor modifications [8]. Briefly, 0.75 mL of MeOH:CHCl3 (2:1, v/v) and 10 µL of IS (each of 50 pmol amount) were added into 100 µL of rat serum. After sonication for 30 s, the mixture was incubated at 48 °C for 12 h. After cooling, 75 µL of KOH (1 mol/L in MeOH) was added and then incubated at 37 °C for 2 h. After cooling to room temperature, 3 µL of acetic acid was added to neutralize the mixture. The single-phase mixture was centrifuged and the supernatants were collected. The residue was re-extracted with 1 mL of MeOH:CHCl3 (1:2, v/v), centrifuged, and the supernatants were combined. The residue was dissolved in 0.4 mL of MeOH:CHCl3 (2:1, v/v) and 1 mL of CHCl3 and 2 mL of H2O was added followed by vortex mixing for 1 min. After centrifugation, the lower phase extract was collected and incorporated. The upper phase fraction was re-extracted with 1 mL of CHCl3, which was also combined with the extract. After extraction, the extract was evaporated to dryness under a gentle stream of nitrogen. The dried residue was reconstituted in 150 µL of MeOH, sonicated for 30 s, and filtered through a 0.22 µm syringe filter (Millipore, Burlington, MA, USA) into vials (Agilent, Santa Clara, CA, USA) for UPLC-MS analysis.

3.4. Chromatography and Mass Spectrometry

An optimized UPLC-Q-TOF-MS condition established by our group was employed with several revisions [8]. Briefly, chromatographic separation was performed on a Zorbax Eclipse Plus C18 column (100 × 2.1 mm, 1.8 µm, Agilent, Santa Clara, CA, USA) using an Agilent 1290 UPLC system (Santa Clara, CA, USA), equipped with a binary solvent delivery system and a high-performance auto-sampler. The mobile phase consisted of (A) MeOH:H2O:HCOOH (60:40:0.2, v/v/v) and (B) MeOH:IPA:HCOOH (10:90:0.2, v/v/v), both containing 10 mM NH4Ac. The gradient was as follows (flow rate of 0.35 mL/min): 0–3 min, 0% to 10% B; 3–5 min, 10% to 40% B; 5–5.3 min, 40% to 55% B; 5.3–8 min, 55% to 60% B; 8–8.5 min, 60% to 80% B; 8.5–10.5 min, 80% to 80% B; 10.5–16 min, 80% to 90% B; 16–19 min, 90% to 90% B; 19–22 min, 90% to 100% B; 22–26 min, 100% to 100% B. The column temperature was maintained at 40 °C and the injection volume was 2 µL.
Both qualitative and quantitative analysis was carried out using an Agilent 6530 Q-TOF mass spectrometer (Santa Clara, CA, USA), equipped with an electrospray ionization (ESI) source. The instrument was operated under 4 GHz mode to obtain high resolution data. ESI conditions were as follows: positive ion mode, capillary voltage 3500 V, nebulizer 35 psi, drying gas 10 L/min, gas temperature 350 °C, skimmer voltage 65 V, octopole RF voltage 750 V, fragmentor voltage 150 V. The collision energies (CEs) of targeted-MS/MS analysis were set at 10, 20, and 40 eV, respectively. Mass spectra were recorded over a range of m/z 50–1500. A reference solution was sprayed as continuous calibration using the following reference masses: m/z 121.0509 and 922.0098. All MS and MS/MS data was processed with MassHunter Workstation Software (version B.06.00, Agilent, Santa Clara, CA, USA).

3.5. Data Processing and Statistics

Agilent MassHunter Workstation software (version B.06.00) was employed for data processing. Identification of SPLs in rat serum were based on their accurate MS and MS/MS data. Relative quantification was carried out under MS mode and peak areas of the extracted ion chromatograms (EICs) for each SPL were integrated. The quantitative results were obtained by IS normalization and calculated as follows: Concentration of target SPL (µmol/L) = (Area of target SPL/Area of corresponding IS) × spiked concentration of IS. Eight IS corresponding to each subcategory are listed in Table 1. All quantitative data were converted to Microsoft Excel format and imported into SIMCA-P+ 13.0 software (Umetrics, Umea, Sweden) for PLS-DA analysis. Statistical tests for identifying differentially expressed SPLs were performed with SPSS software (version 22.0, SPSS Inc., Chicago, IL, USA). Group variations were compared using one-way ANOVA analysis with a critical p value set to 0.05.

4. Conclusions

In summary, an UPLC-Q-TOF-MS-based sphingolipidomic approach was developed for the comprehensive identification and quantification of SPLs in rat serum. The benefits from the optimized LC-MS conditions, isomeric/isobaric interferences were reduced and a total of 120 SPLs covering seven subcategories were identified. The method was validated and demonstrated good reproducibility (overall RSDs ≤ 8.8%) and accuracy (overall recoveries ≥ 91.3%) with a wide linear range. This method was then applied to investigate the SPL alterations in RA rats and the intervention effects of IDM. PLS-DA analysis showed a clear separation of the model and control groups, while the IDM group exhibited a trend to recover to the controls. Twenty-six significantly changed SPL markers were explored, and levels of Cers and their metabolites were found to be reversed by IDM treatment. The therapeutic effects of IDM may be attributed to the inhibition of Cer-mediated COX-2 activation and resulting PEG2 liberation in RA. All of the above results show the promising potential of this method for understanding RA and the anti-arthritic mechanisms of relevant drugs.

Supplementary Materials

The following are available online, Figure S1. Characteristic MS/MS spectra of all identified SPLs by targeted-MS/MS analysis; Figure S2. Linear regression models constructed by plotting carbon number vs. retention time for SPLs; Figure S3. Intra- and inter-day RSDs of randomly selected SPLs in rat serum samples; Table S1. Linearity and sensitivity testing results of eight IS spiked in rat serum extracts; Table S2. Recovery testing results of eight IS spiked in rat serum extracts.

Author Contributions

Conceptualization: H.Z. and P.H.; Methodology: F.Q.; Software: M.Z.; Validation: F.Q., H.Z. and P.H.; Formal Analysis: M.Z.; Investigation: F.Q.; Resources: M.Z.; Data Curation: M.Z.; Writing—Original Draft Preparation: F.Q.; Writing—Review and Editing: H.Z.; Visualization: H.Z.; Supervision: H.Z. and P.H.; Project Administration: H.Z. and P.H.; Funding Acquisition: H.Z. and P.H.

Funding

This research was funded by the National Natural Science Foundation of China (No. 81202493), the Opening Project of Shanghai Key Laboratory of New Drug Design (No. 17DZ2271000), the Fundamental Research of Funds from the Central Universities.

Acknowledgments

We express our gratitude to Yue-Rong Wang (East China University of Science and Technology, Shanghai, China) for technical support in the UPLC-Q-TOF-MS analysis.

Conflicts of Interest

The authors declare no conflict of interest.

References

  1. Merrill, A.H. Sphingolipid and glycosphingolipid metabolic pathways in the era of sphingolipidomics. Chem. Rev. 2011, 111, 6387–6422. [Google Scholar] [CrossRef] [PubMed]
  2. Maceyka, M.; Spiegel, S. Sphingolipid metabolites in inflammatory disease. Nature 2014, 510, 58–67. [Google Scholar] [CrossRef] [PubMed]
  3. Ryland, L.K.; Fox, T.E.; Liu, X.; Loughran, T.P.; Kester, M. Dysregulation of sphingolipid metabolism in cancer. Cancer Biol. Ther. 2011, 11, 138–149. [Google Scholar] [CrossRef] [PubMed]
  4. Hojjati, M.; Li, Z.Q.; Zhou, H.W.; Tang, S.S.; Huan, C.M.; Ooi, E.; Lu, S.D.; Jiang, X.C. Effect of myriocin on plasma sphingolipid metabolism and atherosclerosis in apoE-deficient mice. J. Biol. Chem. 2005, 280, 10284–10289. [Google Scholar] [CrossRef] [PubMed]
  5. He, X.X.; Huang, Y.; Li, B.; Gong, C.X.; Schuchman, E.H. Deregulation of sphingolipid metabolism in Alzheimer’s disease. Neurobiol. Aging 2010, 31, 398–408. [Google Scholar] [CrossRef] [PubMed]
  6. Shaner, R.L.; Allegood, J.C.; Park, H.; Wang, E.; Kelly, S.; Haynes, C.A.; Sullards, M.C.; Merrill, A.H. Quantitative analysis of sphingolipids for lipidomics using triple quadrupole and quadrupole linear ion trap mass spectrometers. J. Lipid Res. 2009, 50, 1692–1707. [Google Scholar] [CrossRef] [PubMed]
  7. Li, J.; Hu, C.X.; Zhao, X.J.; Dai, W.D.; Chen, S.L.; Lu, X.; Xu, G.W. Large-scaled human serum sphingolipid profiling by using reversed-phase liquid chromatography coupled with dynamic multiple reaction monitoring of mass spectrometry: Method development and application in hepatocellular carcinoma. J. Chromatogr. A 2013, 1320, 103–110. [Google Scholar] [CrossRef] [PubMed]
  8. Wang, J.R.; Zhang, H.Y.; Yau, L.F.; Mi, J.N.; Lee, S.; Lee, K.C.; Hu, P.; Liu, L.; Jiang, Z.H. Improved sphingolipidomic approach based on ultra-high performance liquid chromatography and multiple mass spectrometries with application to cellular neurotoxicity. Anal. Chem. 2014, 86, 5688–5696. [Google Scholar] [CrossRef] [PubMed]
  9. Xie, L.M.; Yau, L.F.; Jiang, Z.H.; Zhang, L.Y.; Xia, Y.; Wang, J.R. Sphingolipidomic study of davidiin-treated HepG2 human hepatocellular carcinoma cells using UHPLC-MS. RSC Adv. 2017, 7, 55249–55256. [Google Scholar] [CrossRef]
  10. Bollag, W.B. Potential role of sphingosine 1-phosphate in the pathogenesis of rheumatoid arthritis. J. Lipid Res. 2008, 49, 2281–2282. [Google Scholar] [CrossRef] [PubMed]
  11. Hu, P.F.; Chen, Y.; Cai, P.F.; Jiang, L.F.; Wu, L.D. Sphingosine-1-phosphate: A potential therapeutic target for rheumatoid arthritis. Mol. Biol. Rep. 2011, 38, 4225–4230. [Google Scholar] [CrossRef] [PubMed]
  12. Hoxha, M. A systematic review on the role of eicosanoid pathways in rheumatoid arthritis. Adv. Med. Sci. 2018, 63, 22–29. [Google Scholar] [CrossRef] [PubMed]
  13. Hannun, Y.A.; Obeid, L.M. Principles of bioactive lipid signalling: Lessons from sphingolipids. Nat. Rev. Mol. Cell Biol. 2008, 9, 139–150. [Google Scholar] [CrossRef] [PubMed]
  14. Wollny, T.; Watek, M.; Durnas, B.; Niemirowicz, K.; Piktel, E.; Zendzian-Piotrowska, M.; Gozdz, S.; Bucki, R. Sphingosine-1-phosphate metabolism and its role in the development of inflammatory bowel disease. Int. J. Mol. Sci. 2017, 18, 741. [Google Scholar] [CrossRef] [PubMed]
  15. Zhang, H.N.; Li, J.F.; Li, L.H.; Liu, P.S.; Wei, Y.X.; Qian, Z.J. Ceramide enhances COX-2 expression and VSMC contractile hyperreactivity via ER stress signal activation. Vasc. Pharmacol. 2017, 96, 26–32. [Google Scholar] [CrossRef] [PubMed]
  16. Claycombe, K.J.; Wu, D.Y.; Nikolova-Karakashian, M.; Palmer, H.; Beharka, A.; Paulson, K.E.; Meydani, S.N. Ceramide mediates age-associated increase in macrophage Cyclooxygenase-2 expression. J. Biol. Chem. 2002, 277, 30784–30791. [Google Scholar] [CrossRef] [PubMed]
  17. Kitano, M.; Hla, T.; Sekiguchi, M.; Kawahito, Y.; Yoshimura, R.; Miyazawa, K.; Iwasaki, T.; Sano, H.; Saba, J.D.; Tam, Y.Y. Sphingosine 1-phosphate/sphingosine 1-phosphate receptor 1 signaling in rheumatoid synovium: Regulation of synovial proliferation and inflammatory gene expression. Arthritis Rheumatol. 2006, 54, 742–753. [Google Scholar] [CrossRef] [PubMed]
  18. Wu, B.X.; Clarke, C.J.; Hannun, Y.A. Mammalian neutral sphingomyelinases: Regulation and roles in cell signaling responses. Neuromol. Med. 2010, 12, 320–330. [Google Scholar] [CrossRef] [PubMed]
  19. Nalamachu, S.; Wortmann, R. Role of indomethacin in acute pain and inflammation management: A review of the literature. Postgrad. Med. 2014, 126, 92–97. [Google Scholar] [CrossRef] [PubMed]
Sample Availability: Samples of the rat serum and IS mixture used in this study are available from the authors.
Figure 1. General structures, nomenclatures, and abbreviations for SPLs. m, carbon number of the sphingoid base backbone; n, carbon number of the fatty acid chain.
Molecules 23 01324 g001
Figure 2. Characteristic MS/MS spectra of (a) So (d18:1); (b) Cer (d18:0/20:0); (c) LacCer (d18:1/16:0); and (d) SM (d18:2/23:0) by Q-TOF-MS analysis. So, sphingosine; Cer, ceramide; LacCer, lactosylceramide; SM, sphingomyelin.
Molecules 23 01324 g002
Figure 3. (a) Differentiation of SPL isomers by targeted-MS/MS analysis. Two peaks in EIC of m/z 652.6602 showed characteristic fragment ion corresponding to Cer (d18:0/24:0) (m/z 266.2839) and Cer (d20:0/22:0) (m/z 294.3151); (b) Differentiation of [M + H]+ of SM (d18:2/24:2) and [M + Na]+ of SM (d18:1/22:0) that with the same exact m/z. The “real” [M + H]+ of SM (d18:2/24:2) was assigned by the observation of its corresponding [M + Na]+ ion. Cer, ceramide; SM, sphingomyelin.
Molecules 23 01324 g003
Figure 4. PLS-DA scores plot of rat serum data in control group (green triangles, n = 7), model group (red squares, n = 7), and IDM group (blue dots, n = 7).
Molecules 23 01324 g004
Figure 5. Altered levels of SPL markers in the control, model and IDM-treated rats. Data are represented as mean ± SD (n = 7 in each group). *, Δ p < 0.05 and **, ΔΔ p < 0.01 from one-way ANOVA analysis. The markers colored in red indicate their levels were significantly reversed by IDM treatment. Cer, Ceramide; So, sphingosine; Sa, sphinganine; S1P, sphingoid-1-phosphate; HexCer, hexosylceramide; SM, sphingomyelin.
Molecules 23 01324 g005
Figure 6. Proposed mechanistic pathways for the inflammation in RA and anti-arthritic effects of IDM. Upward and downward arrows represent up-regulation and down-regulation, respectively. Abbreviations: TNF-α, tumor necrosis factor-α; AA, arachidonic acid; PGE2, prostaglandin E2; COX-2, cyclooxygenase-2; SM, sphingomyelin; nSMase, neutralsphingomyelinase; Cer, ceramide; Sa&So, sphinganine and sphingosine; S1P, sphingosine-1-phosphate; HexCer, hexosylceramide.
Molecules 23 01324 g006
Table 1. Identification of SPLs in rat serum by using UPLC-Q-TOF-MS.
Class 1No.Name 2FormulaRT (min)[M + H]+ m/zScoreMS/MS Fragments (m/z)
So&Sa1Sa (d14:0)C14H31NO22.26246.242299.89228.2315, 210.2193, 198.2673
2So (d14:1)C14H29NO22.60244.227199.86226.2156,208.1987, 196.2034
3So (t14:2)C14H27NO34.45258.206482.76240.1939, 222.1958
4So (d15:1)C15H31NO24.74258.242899.74240.2315, 222.2216, 210.2192
5Sa (d16:0)C16H35NO25.08274.273999.91256.2627, 238.2575
6So (d16:1)C16H33NO24.92272.258486.47254.2476, 236.2378
7Sa (t16:0)C16H35NO35.12290.267799.91272.2571, 254.2487, 242.2472
8Sa (d18:0)C18H39NO26.15302.305398.75284.2943, 266.2811
9So (d18:1)C18H37NO29.85300.289799.56282.2796, 264.2728, 252.2642
10So (d18:2)C18H35NO29.40298.274585.01280.2625, 262.2540
11Sa (d19:0)C19H41NO211.91316.320999.22298.3109
12So (d19:1)C19H39NO210.91314.304199.31296.2927
13Sa (d20:0)C20H43NO213.84330.336390.41312.3268, 294.3189
14Sa (d24:0)C24H51NO29.73386.395099.34368.3831, 350.3687
[IS-1]Sa (d17:0)C17H37NO25.62288.2872-270.2790, 252.2685, 240.2682
[IS-2]So (d17:1)C17H35NO27.41286.2749-268.2631, 250.2519, 238.2529
S1P15S1P (d18:1)C18H38NO5P6.93380.256199.89282.2864, 264.2709
[IS-3]S1P (d17:1)C11H36NO5P7.89366.2399-348.2312, 268.2618, 250.2532
Cer16Cer (d16:1/23:0)C39H77NO317.11608.597692.16590.5851, 572.5759, 254.2505, 236.2367
17Cer (d17:1/24:1)C41H79NO316.89634.613385.39616.6008, 598.5886, 268.2633, 250.2521
18Cer (d18:0/16:0)C34H69NO314.03540.534490.32522.5218, 504.5128, 302.3115, 284.2943, 266.2829
19Cer (d18:0/20:0)C38H77NO316.88596.596794.77578.5896, 560.5793, 284.2940, 266.2834
20Cer (d18:0/21:0)C39H79NO317.70610.613394.78592.6011, 266.2884
21Cer (d18:0/22:0)C40H81NO318.41624.628999.59606.6167, 588.6131, 302.3045, 284.2946, 266.2837
22Cer (d18:0/23:0)C41H83NO319.36638.644897.15620.6309, 602.6203, 302.3067, 284.2946, 266.2843, 254.2850
23Cer (d18:0/24:0)C42H85NO320.30652.659698.57634.6530, 616.6360, 302.3034, 284.2964, 266.2846, 254.2844
24Cer (d18:0/24:1)C42H83NO318.61650.644198.55632.6337, 614.6224, 302.3030, 284.2950, 266.2840, 254.2840
25Cer (d18:0/26:1)C44H87NO320.53678.675184.92660.6634, 284.2932, 266.2848
26Cer (d18:1/14:0)C32H63NO312.00510.488178.69492.4790, 474.4692, 282.2814, 264.2651
27Cer (d18:1/16:0)C34H67NO313.61538.519199.81520.5074, 502.4899, 282.2789, 264.2684, 252.2676
28Cer (d18:1/17:2)C35H65NO316.61548.503798.94264.2651
29Cer (d18:1/17:3)C35H63NO312.96546.488196.54282.2838, 264.2675
30Cer (d18:1/18:0)C36H71NO314.96566.550797.65548.5396, 282.2766, 264.2681, 252.2659
31Cer (d18:1/20:0)C38H75NO316.38594.582089.81576.5703, 558.5569, 546.5640, 282.2792, 264.2676, 252.2668
32Cer (d18:1/20:4)C38H67NO313.98586.516767.08300.2854, 282.2756, 264.2686
33Cer (d18:1/21:0)C39H77NO317.01608.597695.73282.2768, 264.2670, 252.2686
34Cer (d18:1/22:0)C40H79NO317.81622.613399.51604.6030, 586.5865, 300.2959, 282.2779, 264.2684, 252.2680
35Cer (d18:1/23:0)C41H81NO318.66636.628599.56618.6171, 600.6080, 282.2790, 264.2683, 252.2682
36Cer (d18:1/23:1)C41H79NO317.11634.613384.89616.6008, 598.5886, 282.2802, 264.2681, 252.2660
37Cer (d18:1/24:0)C42H83NO319.59650.644199.24632.6343, 614.6247, 602.6231, 282.2789, 264.2678, 252.2682
38Cer (d18:1/24:1)C42H81NO318.31648.629991.22630.6188, 612.6087, 282.2789, 264.2682, 252.2684
39Cer (d18:1/25:0)C43H85NO320.07664.658892.95646.6410, 628.6374, 300.2882, 282.2786, 264.2682, 252.2680
40Cer (d18:1/26:3)C42H77NO317.81644.593490.90282.2805, 264.2683
41Cer (d18:2/16:0)C34H65NO312.71536.503770.02518.4939, 500.4770, 280.2648, 262.2522, 250.2529
42Cer (d18:2/18:2)C36H65NO313.63560.496790.73542.4881, 280.2661, 262.2545
43Cer (d18:2/22:0)C40H77NO316.79620.597698.38602.5861, 584.5741, 298.2758, 280.2635, 262.2526, 250.2515
44Cer (d20:0/16:0)C36H73NO312.67568.566397.20312.3264, 294.3158
45Cer (d20:0/22:0)C42H85NO320.91652.660299.80634.6507, 616.6358, 312.3241, 294.3116
46Cer (t18:0/16:0)C34H69NO412.91556.529981.00502.4892, 300.2886, 282.2773, 264.2704
47Cer (t18:0/19:2)C37H71NO515.96610.540599.43282.2797, 264.2680
[IS-4]Cer (d18:1/12:0)C30H59NO310.38482.4564-464.4507, 282.2779, 264.2682, 252.2670
C1P48C1P (d18:0/16:0)C34H70NO6P12.21620.501497.60266.2896
49C1P (d18:1/12:3)C30H54NO6P9.17556.373390.34264.2703
50C1P (d18:1/16:0)C34H68NO6P11.41618.486697.06264.2682
51C1P (d18:1/16:2)C34H64NO6P11.09614.454491.65264.2693
52C1P (d18:1/18:0)C36H72NO6P14.84646.518776.43282.2779, 264.2691
53C1P (d18:1/26:0)C44H88NO6P25.49758.642286.48264.2698
54C1P (d18:2/14:1)C32H60NO6P9.67586.423196.64262.2576
[IS-5]C1P (d18:1/12:0)C30H60NO6P9.61562.4226-544.4109, 464.4442, 446.4342, 282.2719, 264.2677
HexCer 355HexCer (d18:0/20:0)C44H87NO813.19758.650499.76596.5976, 578.5845, 284.2936, 266.2851
56HexCer (d18:1/16:0)C40H77NO811.65700.572290.23520.4977, 502.4891, 282.2819, 264.2683, 252.2643
57HexCer (d18:1/20:0)C44H85NO814.31756.632898.50738.6248, 576.5731, 282.2748, 264.2694, 252.2673
58HexCer (d18:1/22:0)C46H89NO815.95784.666198.10766.6539, 622.6147, 604.6016, 586.5895, 282.2804, 264.2681, 252.2644
59HexCer (d18:1/23:0)C47H91NO816.60798.681793.90780.6693, 618.6176, 600.6079, 282.2786, 264.2683, 252.2675
60HexCer (d18:1/24:0)C48H93NO817.27812.697290.51794.6858, 632.6339, 614.6225, 282.2791, 264.2683, 252.2681
61HexCer (d18:1/24:1)C48H91NO816.05810.678687.89630.6161, 612.6090, 282.2784, 264.2686, 252.2670
[IS-6]HexCer (d18:1/12:0)C36H69NO89.98644.5093-626.4985, 464.4457, 446.4346, 282.2790, 264.2683, 252.2684
LacCer62LacCer (d18:0/22:0)C52H101NO1314.39948.734698.47624.6283, 606.6159, 284.2937, 266.2884
63LacCer (d18:1/16:0)C46H87NO1312.02862.624599.73844.6111, 538.5173, 520.5067, 282.2785, 264.2679, 252.2678
64LacCer (d18:1/22:0)C52H99NO1315.73946.717792.24928.7105, 928.7105, 604.6023, 586.5924, 282.2796, 264.2682, 252.2669
65LacCer (d18:1/24:0)C54H103NO1315.14974.750299.16956.7359, 794.6845, 632.6315, 614.6225, 282.2775, 264.2675, 252.2685
66LacCer (d18:1/24:1)C54H101NO1315.86972.734698.93954.7245, 792.6653, 630.6171, 612.6074, 282.2782, 264.2680, 252.2672
[IS-7]LacCer (d18:1/12:0)C42H79NO139.78806.5621-788.5510, 626.5002, 464.4464, 446.4358, 264.2686
SM67SM (d16:1/14:0)C35H71N2O6P11.53647.510998.44236.2362, 184.0737
68SM (d17:0/18:0)C40H83N2O6P15.14719.606296.03252.2691, 184.0731
69SM (d18:0/14:0)C37H77N2O6P13.10677.559298.82266.2830, 184.0729
70SM (d18:0/16:0)C39H81N2O6P14.43705.590598.83266.2810, 184.0727
71SM (d18:0/18:0)C41H85N2O6P15.85733.621895.37266.2899, 184.0736
72SM (d18:0/20:0)C43H89N2O6P17.30761.653195.46266.2787,184.0725
73SM (d18:0/22:0)C45H93N2O6P18.87789.684499.17266.2881, 184.0725
74SM (d18:0/24:0)C47H97N2O6P20.75817.715799.36266.2808, 184.0724
75SM (d18:1/14:0)C37H75N2O6P12.59675.543699.00264.2671, 184.0729
76SM (d18:1/16:0)C39H79N2O6P13.82703.575599.19264.2661, 184.0728
77SM (d18:1/16:3)C39H73N2O6P12.59697.527997.13264.2659, 184.0728
78SM (d18:1/17:0)C40H81N2O6P14.53717.590498.69264.2618, 184.0728
79SM (d18:1/18:0)C41H83N2O6P15.24731.606298.06264.2685, 184.0729
80SM (d18:1/18:1)C41H81N2O6P14.21729.592686.17264.2614, 184.0726
81SM (d18:1/18:2)C41H79N2O6P14.41727.573799.30264.2659, 184.0727
82SM (d18:1/18:3)C41H77N2O6P13.82725.556994.58264.2608, 184.0725
83SM (d18:1/19:0)C42H85N2O6P15.98745.621899.44264.2675, 184.0729
84SM (d18:1/19:1)C42H83N2O6P14.92743.606497.01264.2699, 184.0730
85SM (d18:1/20:0)C43H87N2O6P16.69759.636191.31264.2691, 184.0729
86SM (d18:1/20:1)C43H85N2O6P15.65757.621899.58264.2687, 184.0725
87SM (d18:1/20:2)C43H83N2O6P14.52755.606298.54264.2703, 184.0733
88SM (d18:1/20:3)C43H81N2O6P15.24753.590591.53264.2691, 184.0728
89SM (d18:1/21:0)C44H89N2O6P17.45773.653199.62264.2663, 184.0731
90SM (d18:1/21:1)C44H87N2O6P16.18771.636798.99264.2676, 184.0729
91SM (d18:1/22:0)C45H91N2O6P18.20787.668289.66264.2738, 184.0729
92SM (d18:1/22:1)C45H89N2O6P17.10785.652190.18264.2700, 184.0729
93SM (d18:1/22:2)C45H87N2O6P15.85783.637498.59264.2717, 184.0728
94SM (d18:1/22:3)C45H85N2O6P16.71781.621894.77264.2674, 184.0723
95SM (d18:1/23:0)C46H93N2O6P19.02801.684499.32264.2665, 184.0725
96SM (d18:1/23:2)C46H89N2O6P16.57797.650692.95264.2660, 184.0730
97SM (d18:1/23:3)C46H87N2O6P17.45795.635481.68 264.2723, 184.0732
98SM (d18:1/24:0)C47H95N2O6P19.98815.700197.84264.2705, 184.0724
99SM (d18:1/24:1)C47H93N2O6P18.28813.684498.88264.2691, 184.0728
100SM (d18:1/24:4)C47H87N2O6P15.44807.637597.83264.2698, 184.0731
101SM (d18:1/25:0)C48H97N2O6P20.79829.715599.43264.2667, 184.0732
102SM (d18:1/25:1)C48H95N2O6P19.24827.700195.78264.2600, 184.0728
103SM (d18:1/25:3)C48H91N2O6P19.02823.666596.01264.2643, 184.0731
104SM (d18:1/25:4)C48H89N2O6P17.85821.650688.64264.2666, 184.0719
105SM (d18:1/26:1)C49H97N2O6P20.21841.715799.25264.2691, 184.0725
106SM (d18:1/26:2)C49H95N2O6P18.81839.700199.73264.2754, 184.0730
107SM (d18:1/26:3)C49H93N2O6P19.98837.680095.27264.2679, 184.0730
108SM (d18:1/26:4)C49H91N2O6P18.28835.668394.37264.2731, 184.0735
109SM (d18:2/18:1)C41H79N2O6P14.41727.574998.92262.2556, 184.0727
110SM (d18:2/18:3)C41H75N2O6P12.90723.543690.63262.2628, 184.0733
111SM (d18:2/20:0)C43H85N2O6P15.48757.621192.69262.2501, 184.0730
112SM (d18:2/20:2)C43H81N2O6P15.24753.590591.53262.2516, 184.0708
113SM (d18:2/20:3)C43H79N2O6P14.21751.574986.38262.2509, 184.0731
114SM (d18:2/21:0)C44H87N2O6P16.40771.635398.99262.2554, 184.0731
115SM (d18:2/23:0)C46H91N2O6P17.84799.667998.81781.6544, 262.2526, 184.0726
116SM (d18:2/24:0)C47H93N2O6P18.28813.684298.28262.2562, 184.0728
117SM (d18:2/24:2)C47H89N2O6P16.30809.653398.67262.2502, 184.0728
118SM (d20:0/24:4)C49H93N2O6P19.98837.684487.77294.3110, 184.0738
119SM (d20:1/23:4)C48H89N2O6P17.85821.653193.97292.3001, 184.0730
120SM (t18:0/16:1)C39H79N2O7P13.32719.569896.54300.2822, 264.2643, 184.0729
[IS-8]SM (d18:1/12:0)C35H71N2O6P9.94647.5116-282.2776, 264.2681, 252.2660, 184.0731
1 IS, internal standard; So, sphingosine; Sa, sphinganine; S1P, sphingosine-1-phosphate; Cer, ceramide; C1P, ceramide-1-phosphate; HexCer, hexosylceramide; LacCer, lactosylceramide; SM, sphingomyelin. 2 Annotation of the sphingoid backbone denotes the number of hydroxyl groups, the number of carbon atoms, and the number of the unsaturation degree (e.g., d means two hydroxyl groups; t means three hydroxyl groups (i.e., phyto-)); annotation of the fatty acid chain indicates the number of carbon atoms and the number of unsaturation degree. 3 HexCer includes glucosylceramide (GlcCer) and galactosylceramide (GalCer), which cannot be distinguished by this method.

