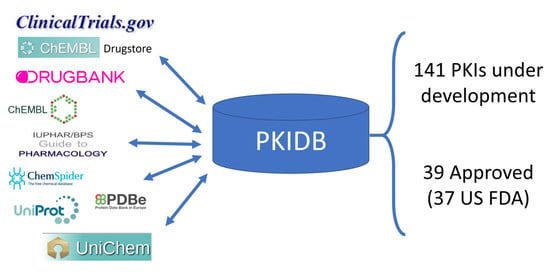
PKIDB: A Curated, Annotated and Updated Database of Protein Kinase Inhibitors in Clinical Trials
Abstract
1. Introduction
2. Results
2.1. PKIDB Content and Interface
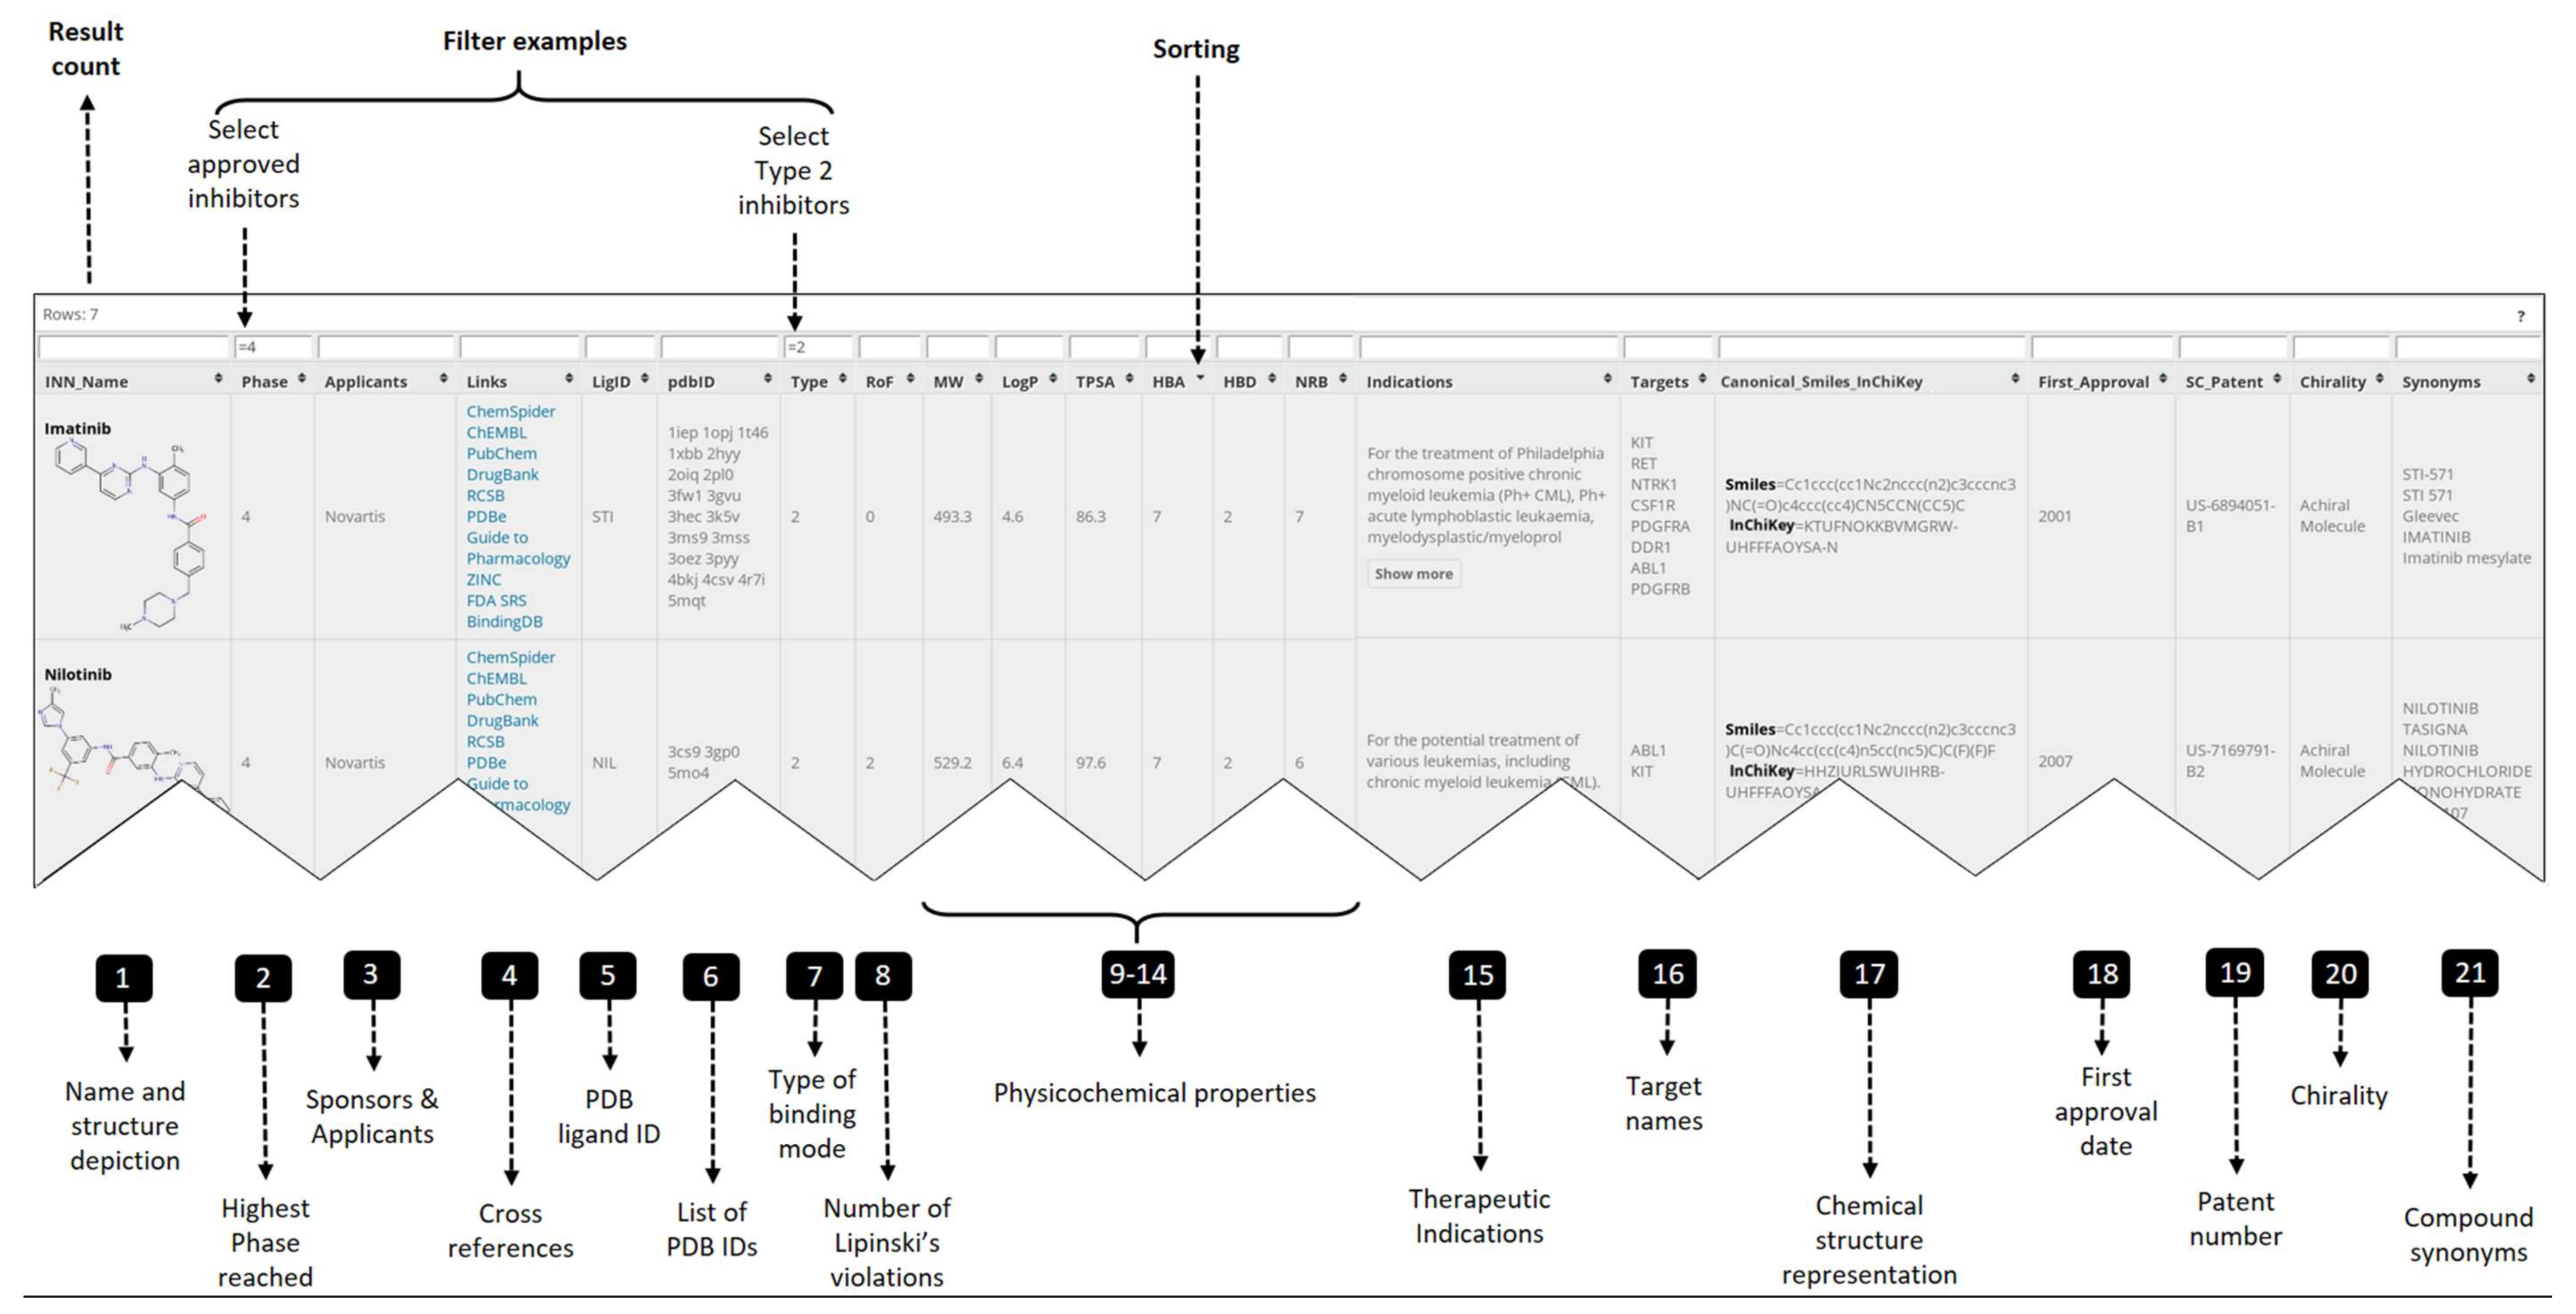
- Official INN name and synonyms for the PKIs (columns 1, 21)
- Compound representation: structure depiction, smiles and InChiKey (columns 1, 17)
- Clinical data: highest phase reached, therapeutic indication, first approval date (columns 2, 15, 18)
- Physicochemical properties (columns 8 to 14, 20)
- Applicants and patent id (columns 3, 19)
- Cross references (columns 4, 5)
- Target data: PDB ID, binding mode type, target name (columns 6 to 7, 16)
- Numerical filter: <, ≤, >, ≥ and =
- String match: exact match, =; partial match, *; match different search pattern, !
- Logical operators: OR, ||; AND, &&.
2.2. Physicochemical Analysis of the PKI Dataset
2.2.1. Distribution of Physicochemical Properties of PKIs
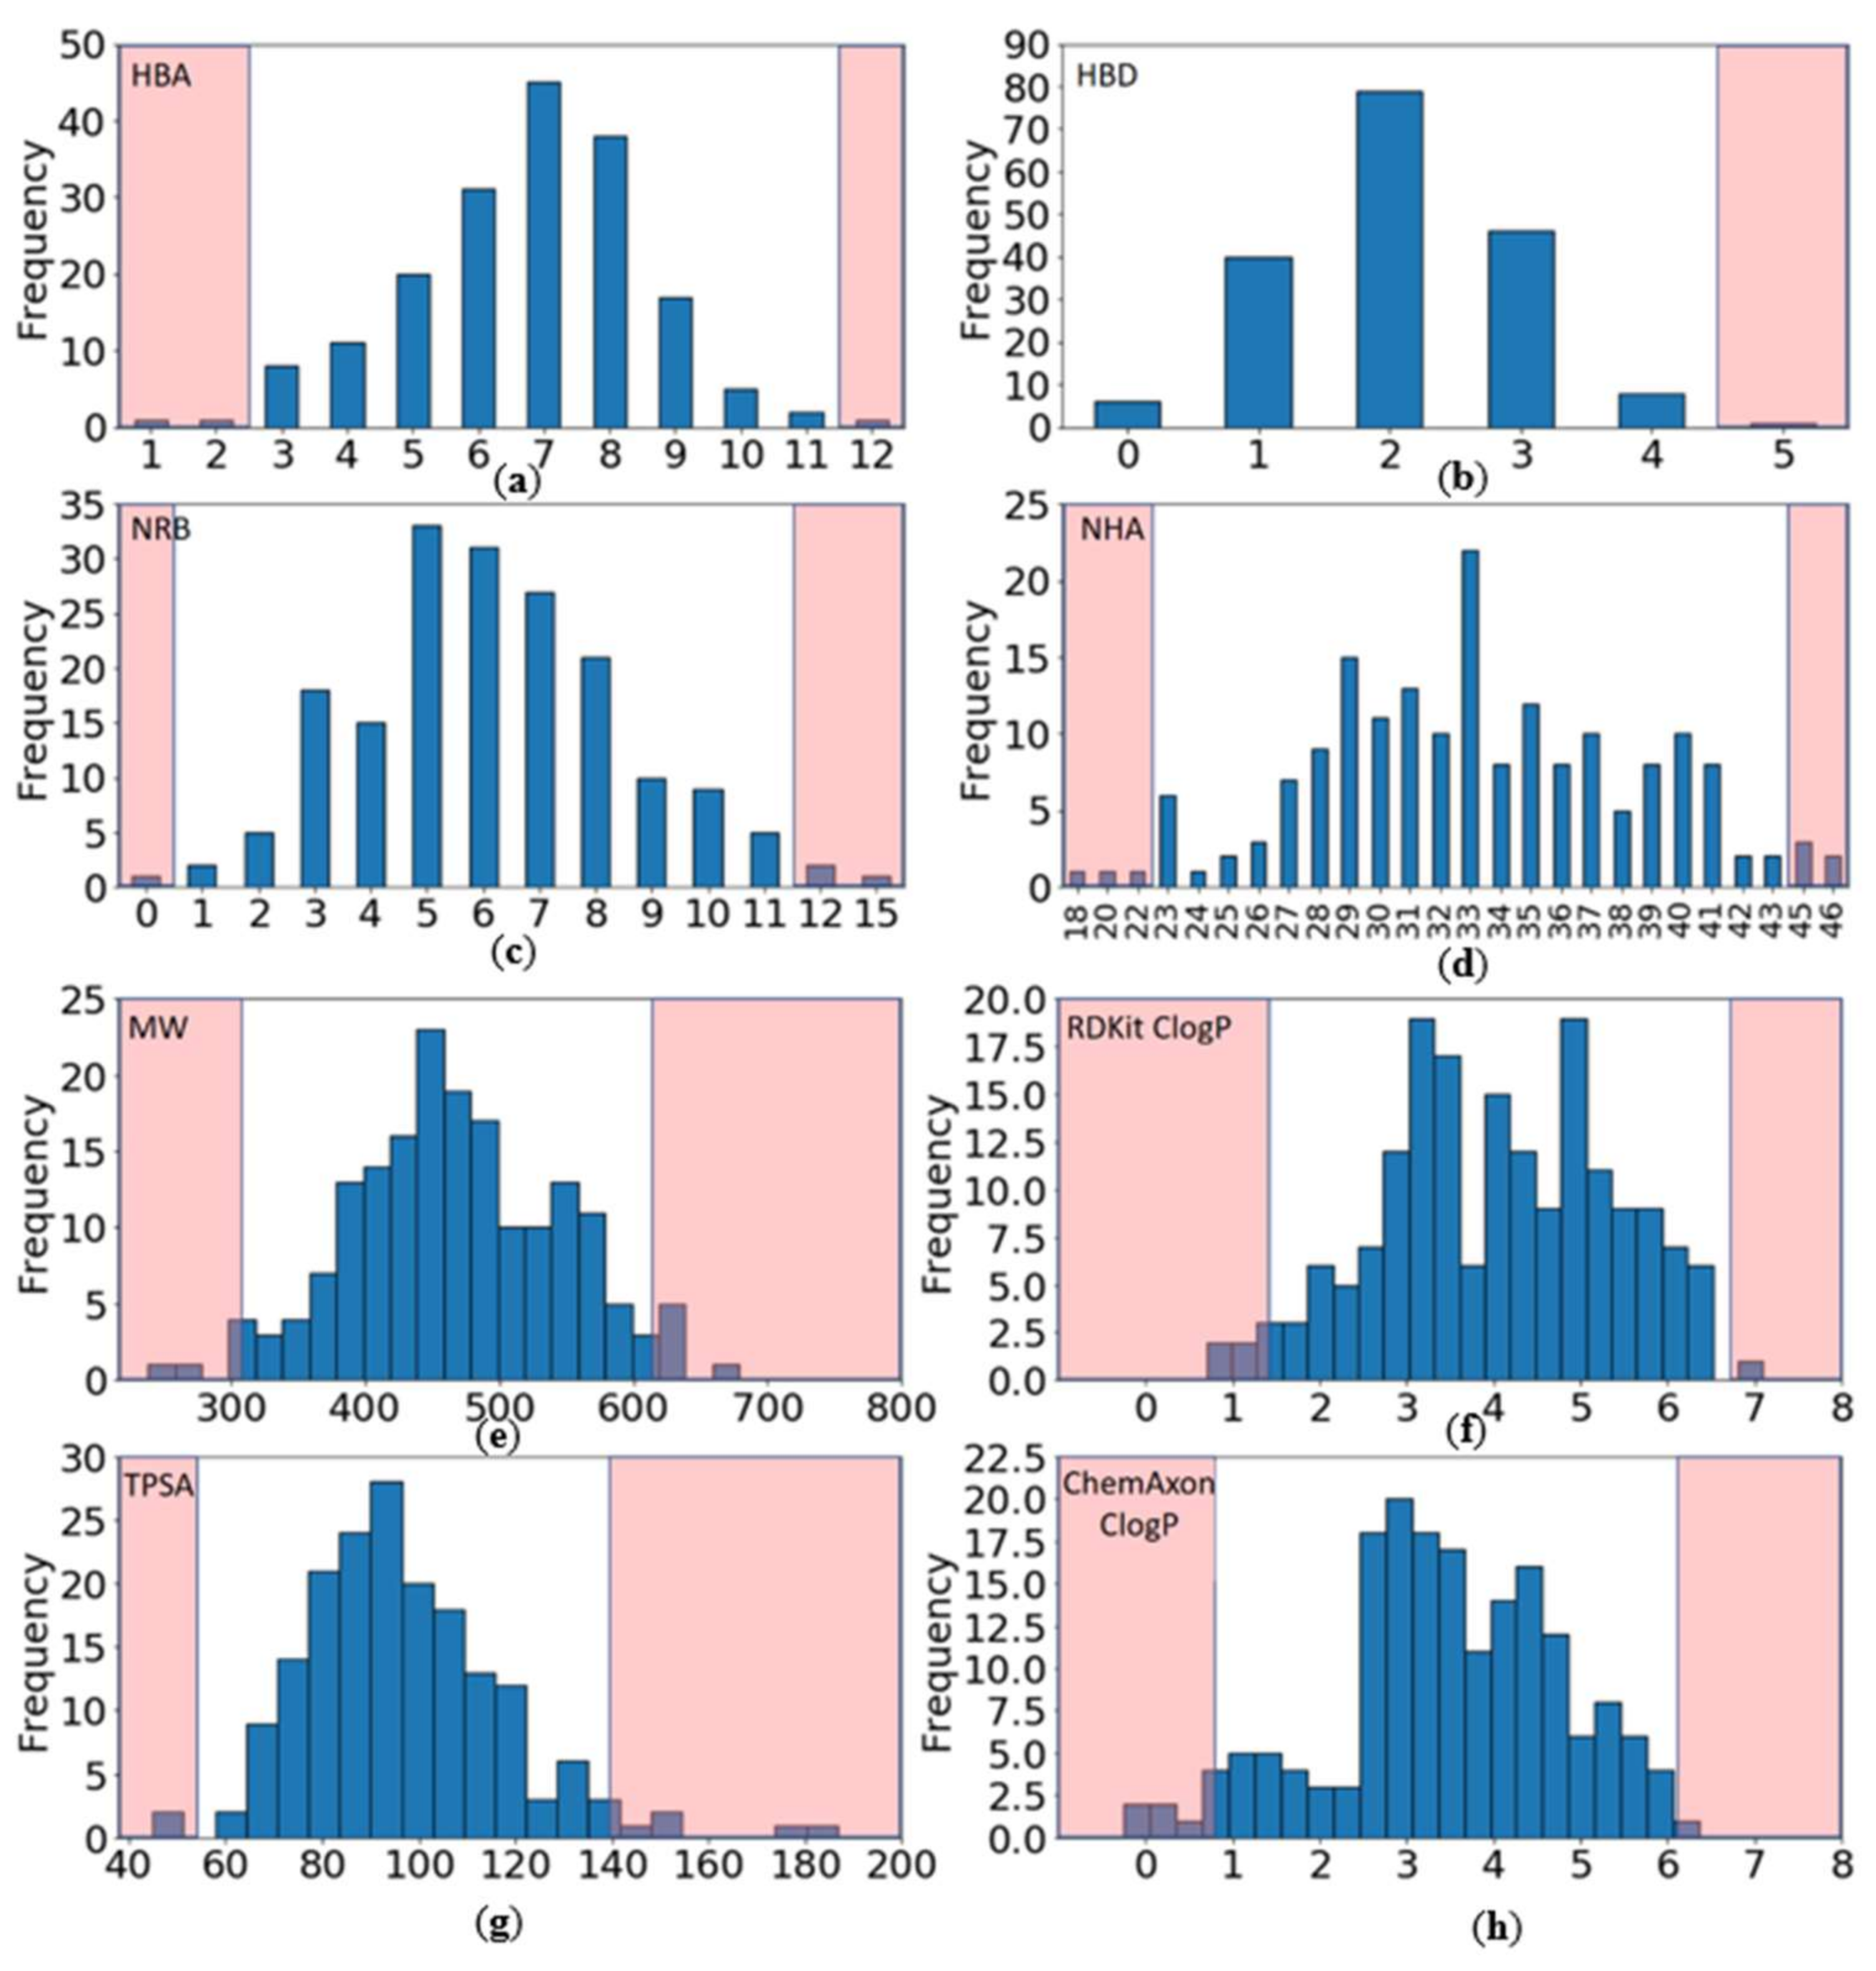
- Have a molecular weight (MW) between 309 and 617 Da (average of 463.3)
- Have a ClogP (calculated with RDKit) between 1.4 and 6.7 (average of 4.0)
- Contain between 0 and 4 hydrogen bond donors (HBD) (average of 2.1)
- Contain between 3 and 11 hydrogen bond acceptors (HBA) (average of 6.7)
- Have a topological polar surface area (TPSA) between 54 and 140 Å2 (average of 96.8)
- Contain between 1 and 11 rotatable bonds (NRB) (average of 6.2).
2.2.2. Chemometrical Analysis of Protein Kinase Inhibitors
2.2.3. Principal Moments of Inertia
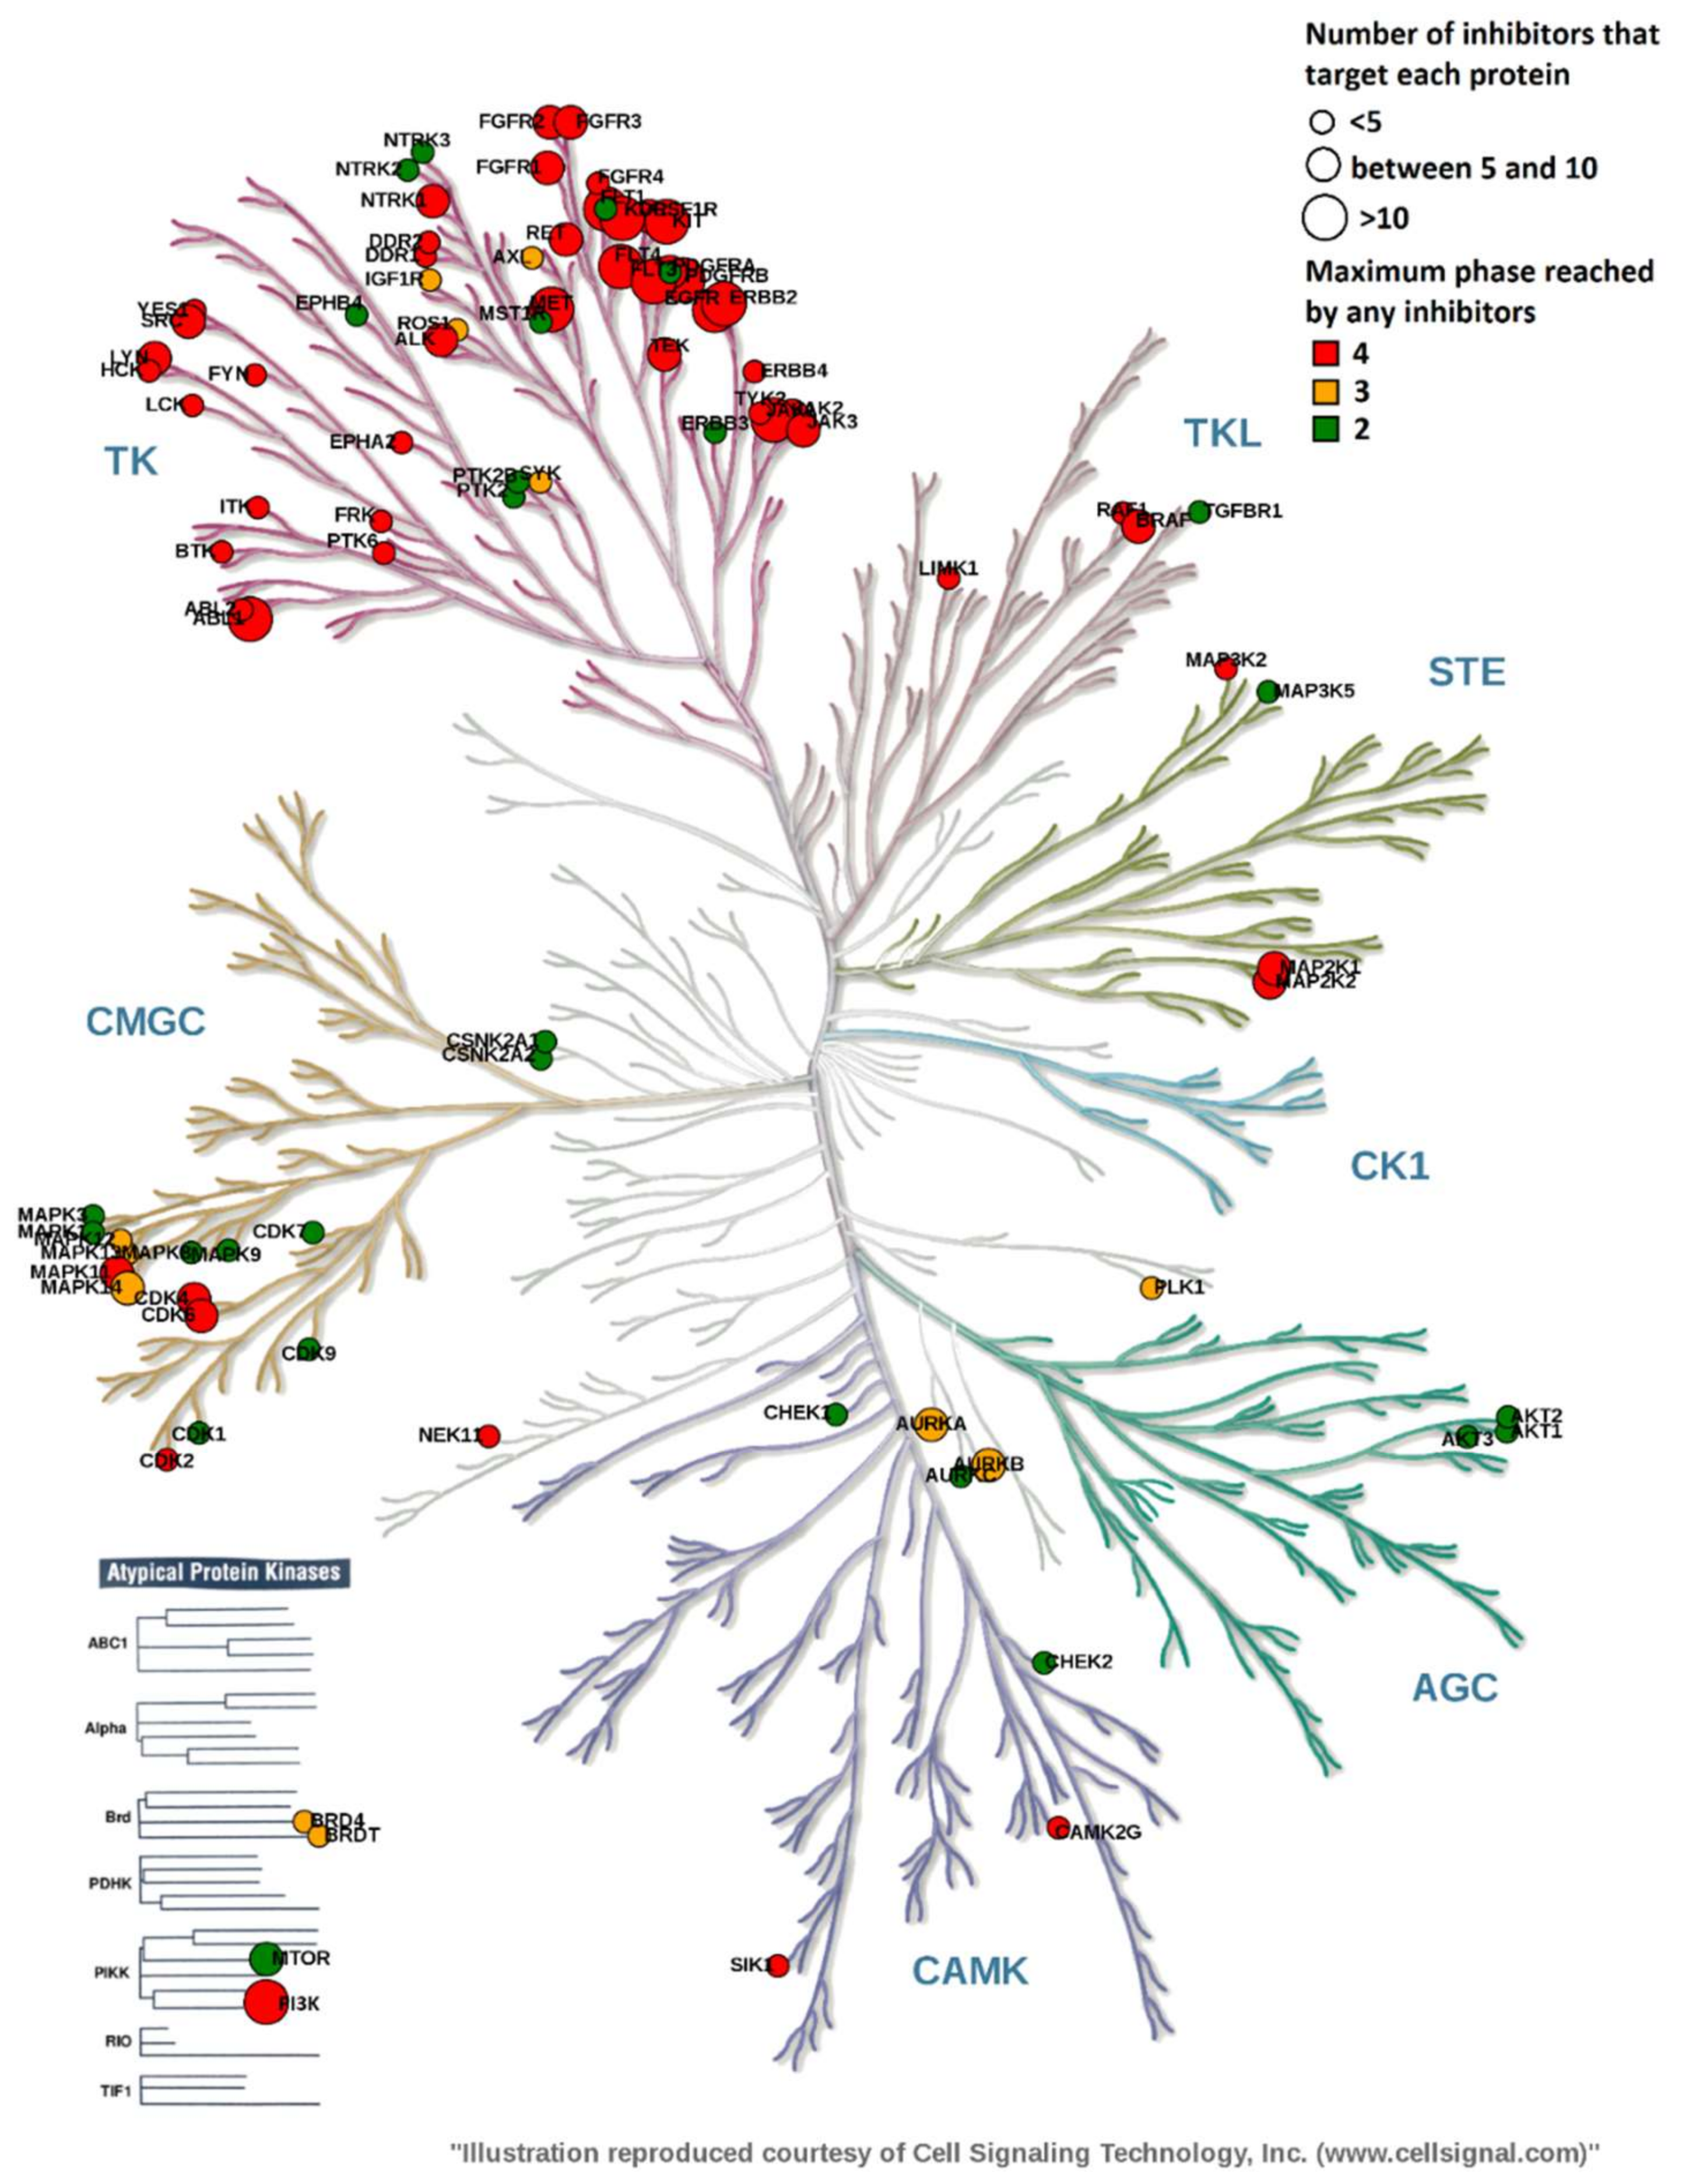
2.3. Overview of Current Targeted Protein Kinases
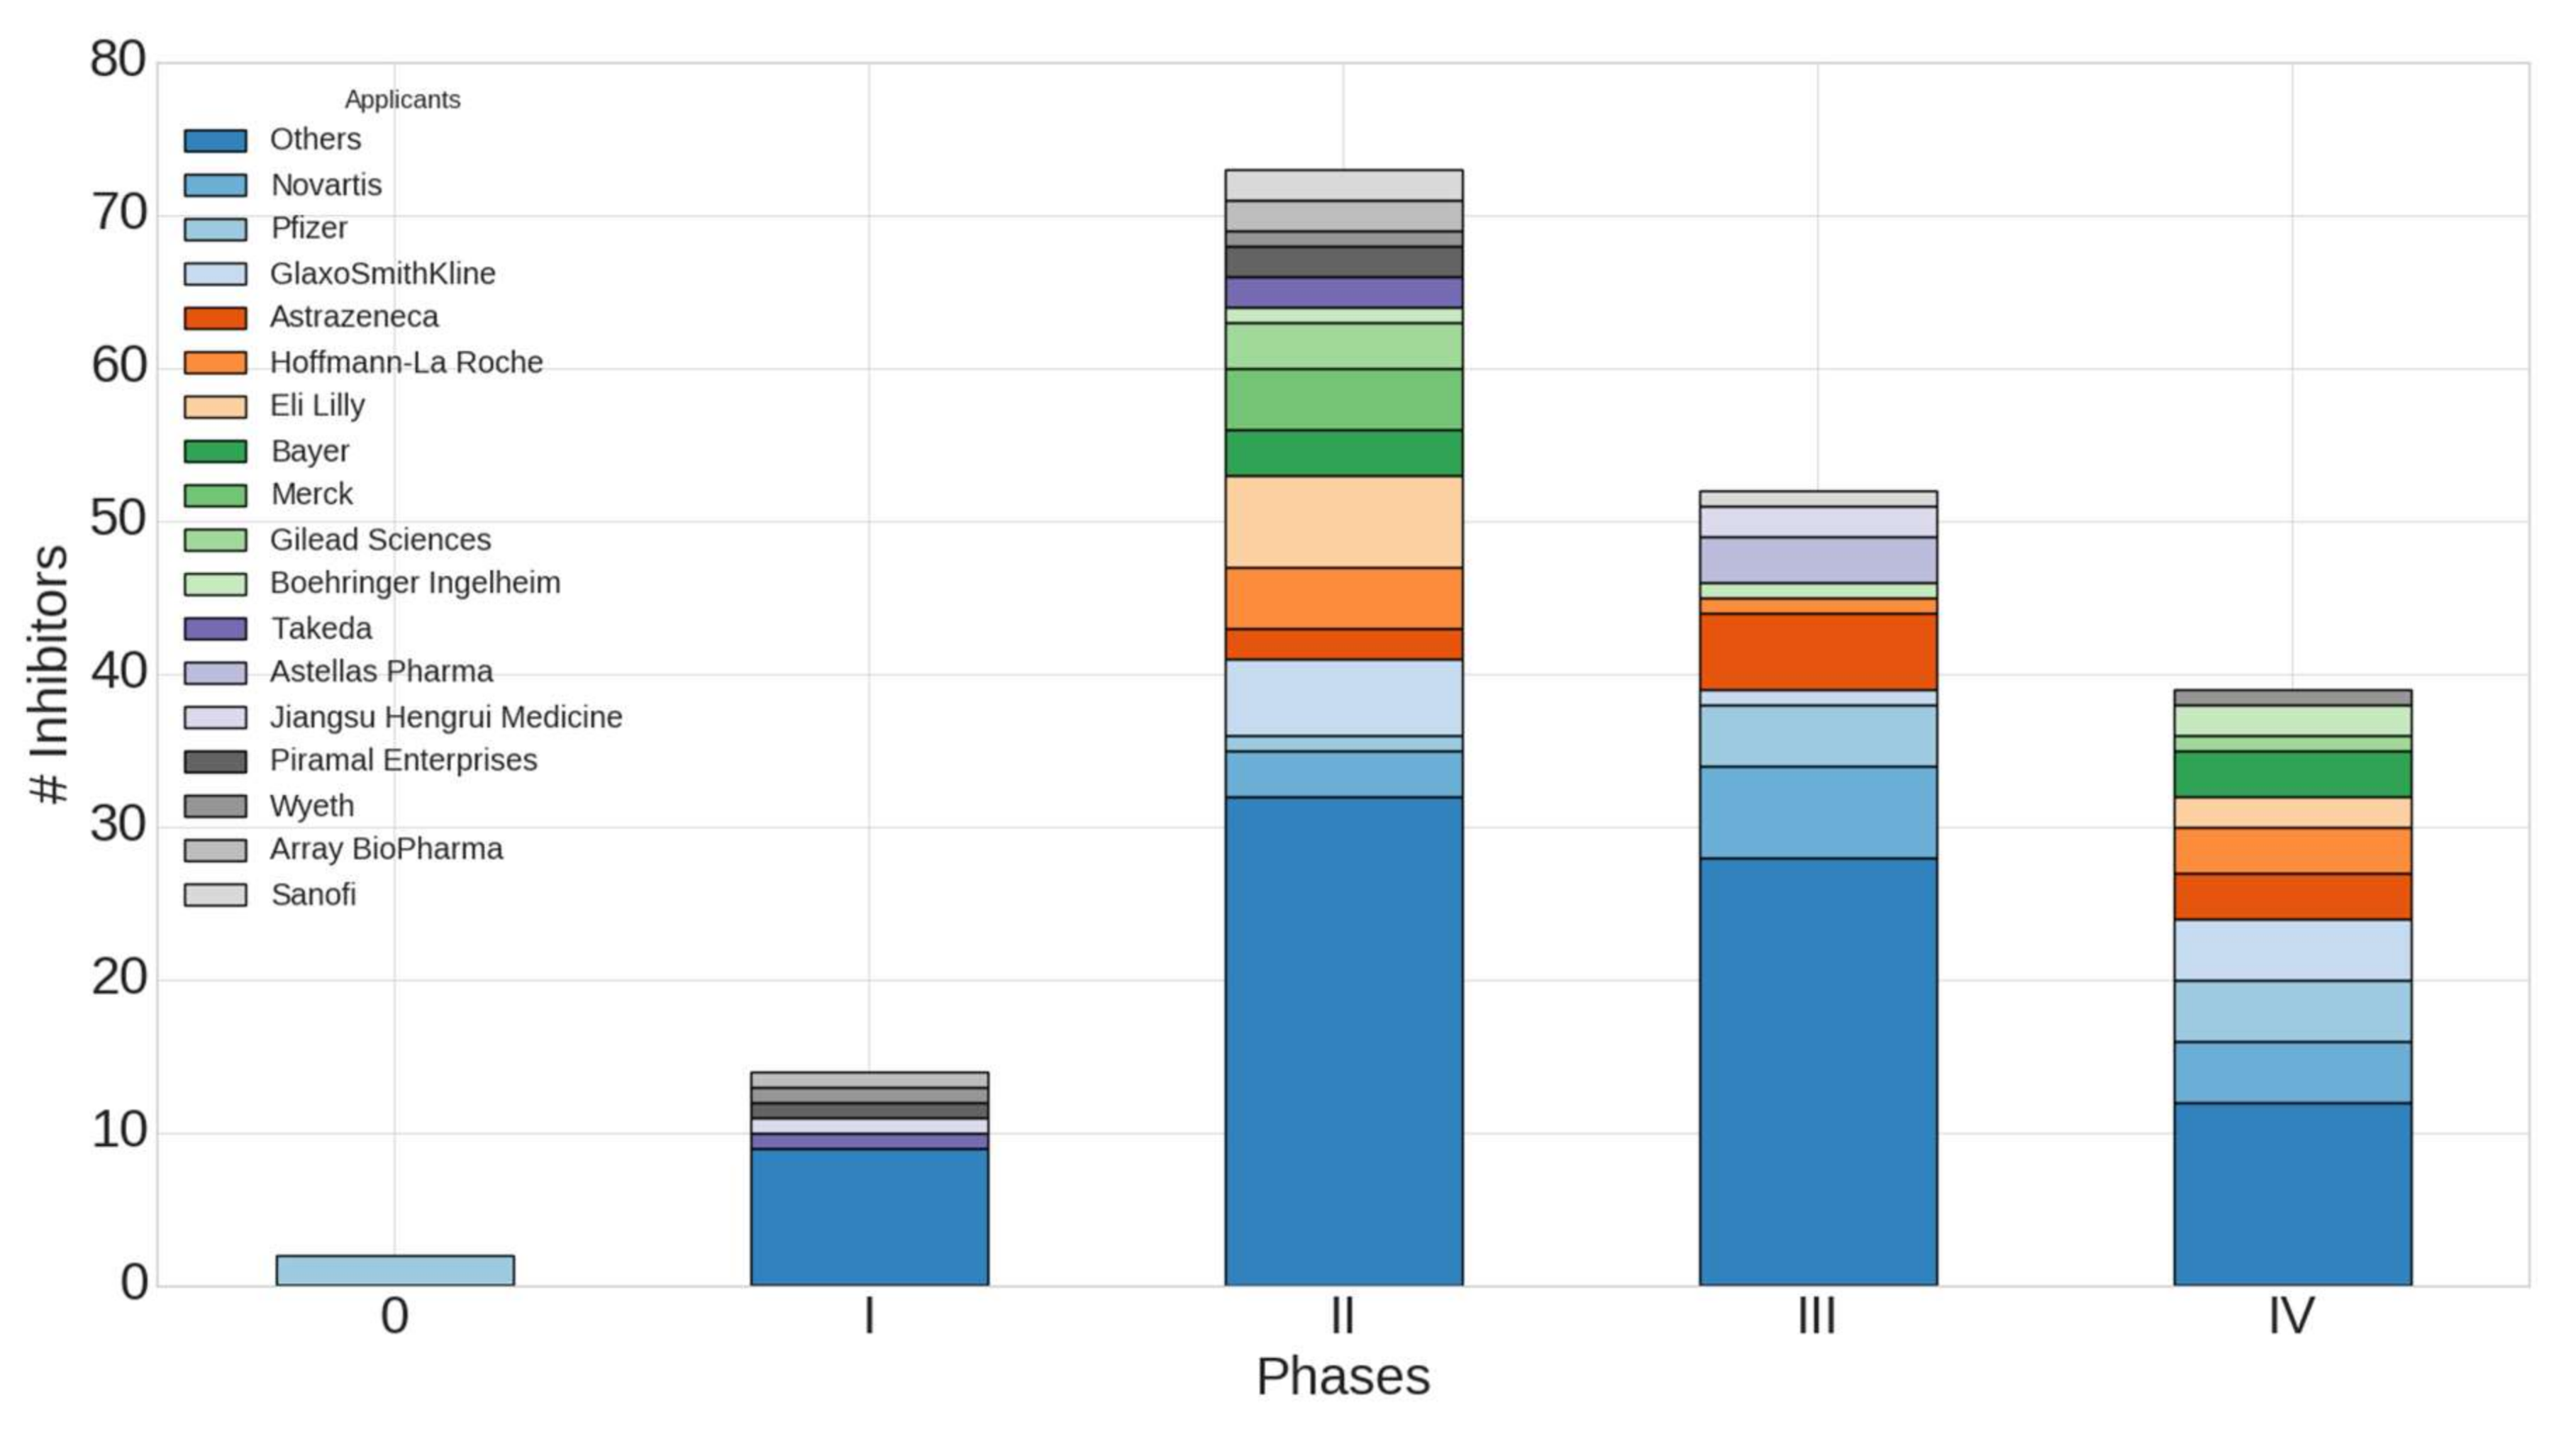
2.4. Worldwide Pharmaceutical Companies Pipeline Overview of Kinase Inhibitors
3. Discussion
4. Materials and Methods
Acknowledgments
Author Contributions
Conflicts of Interest
Appendix A
| 1 | No Ro5 Violation | 1 Ro5 Violation | 2 Ro5 Violations |
|---|---|---|---|
| PKIs approved | 25/39 (64%) | 10/39 (26%) | 4/39 (10%) |
| PKIs in clinical trials | 89/141 (63%) | 41/141 (29%) | 11/141 (7.8%) |
| All PKIs | 114/180 (63%) | 51/180 (28%) | 15/180 (8%) |
| MW > 500 Da | ClogP > 5 1 | HBA > 10 | HBD > 5 | |
|---|---|---|---|---|
| PKIs approved | 13/39 (33%) | 4/39 (10%) | 1/39 (2.5%) | 0/39 (0%) |
| PKIs in clinical trials | 44/141 (31%) | 17/141 (12%) | 2/141 (1.4%) | 0/141 (0%) |
| All PKIs | 57/180 (32%) | 21/180 (12%) | 3/180 (1.7%) | 0/180 (0%) |
References
- Wu, P.; Nielsen, T.E.; Clausen, M.H. FDA-approved small-molecule kinase inhibitors. Trends Pharmacol. Sci. 2015, 36, 422–439. [Google Scholar] [CrossRef] [PubMed]
- Wu, P.; Nielsen, T.E.; Clausen, M.H. Small-molecule kinase inhibitors: An analysis of FDA-approved drugs. Drug Discov. Today 2016, 21, 5–10. [Google Scholar] [CrossRef] [PubMed]
- Kinase Profiling Inhibitor Database|International Centre for Kinase Profiling. Available online: http://www.kinase-screen.mrc.ac.uk/kinase-inhibitors (accessed on 28 February 2018).
- FDA-Approved Protein Kinase Inhibitors/US Food and Drug Administration Approved Small Molecule Protein Kinase Inhibitors. Available online: http://www.brimr.org/PKI/PKIs.htm (accessed on 28 February 2018).
- Berman, H.M.; Westbrook, J.; Feng, Z.; Gilliland, G.; Bhat, T.N.; Weissig, H.; Shindyalov, I.N.; Bourne, P.E. The Protein Data Bank. Nucleic Acids Res. 2000, 28, 235–242. [Google Scholar] [CrossRef] [PubMed]
- Roskoski, R. Classification of small molecule protein kinase inhibitors based upon the structures of their drug-enzyme complexes. Pharmacol. Res. 2015. [Google Scholar] [CrossRef] [PubMed]
- Bosc, N.; Wroblowski, B.; Aci-Sèche, S.; Meyer, C.; Bonnet, P. A Proteometric Analysis of Human Kinome: Insight into Discriminant Conformation-dependent Residues. ACS Chem. Biol. 2015, 10, 2827–2840. [Google Scholar] [CrossRef] [PubMed]
- Zuccotto, F.; Ardini, E.; Casale, E.; Angiolini, M. Through the “Gatekeeper Door”: Exploiting the Active Kinase Conformation. J. Med. Chem. 2010, 53, 2681–2694. [Google Scholar] [CrossRef] [PubMed]
- Tecle, H.; Shao, J.; Li, Y.; Kothe, M.; Kazmirski, S.; Penzotti, J.; Ding, Y.-H.; Ohren, J.; Moshinsky, D.; Coli, R.; et al. Beyond the MEK-pocket: Can current MEK kinase inhibitors be utilized to synthesize novel type III NCKIs? Does the MEK-pocket exist in kinases other than MEK? Bioorg. Med. Chem. Lett. 2009, 19, 226–229. [Google Scholar] [CrossRef] [PubMed]
- Gavrin, L.K.; Saiah, E. Approaches to discover non-ATP site kinase inhibitors. MedChemComm 2012, 4, 41–51. [Google Scholar] [CrossRef]
- Lipinski, C.A.; Lombardo, F.; Dominy, B.W.; Feeney, P.J. Experimental and computational approaches to estimate solubility and permeability in drug discovery and development settings. Adv. Drug Deliv. Rev. 1997, 23, 3–25. [Google Scholar] [CrossRef]
- Veber, D.F.; Johnson, S.R.; Cheng, H.-Y.; Smith, B.R.; Ward, K.W.; Kopple, K.D. Molecular Properties That Influence the Oral Bioavailability of Drug Candidates. J. Med. Chem. 2002, 45, 2615–2623. [Google Scholar] [CrossRef] [PubMed]
- ChemAxon—Software for Chemistry and Biology version 15.2.9.0. Available online: https://www.chemaxon.com/ (accessed on 12 April 2018).
- Johnson, C.N.; Adelinet, C.; Berdini, V.; Beke, L.; Bonnet, P.; Brehmer, D.; Calo, F.; Coyle, J.E.; Day, P.J.; Frederickson, M.; et al. Structure-Based Design of Type II Inhibitors Applied to Maternal Embryonic Leucine Zipper Kinase. ACS Med. Chem. Lett. 2015, 6, 31–36. [Google Scholar] [CrossRef] [PubMed]
- Pearson, K. LIII. On lines and planes of closest fit to systems of points in space. Lond. Edinb. Dublin Philos. Mag. J. Sci. Ser. 6 1901, 2, 559–572. [Google Scholar] [CrossRef]
- Le Guilloux, V.; Colliandre, L.; Bourg, S.; Guénegou, G.; Dubois-Chevalier, J.; Morin-Allory, L. Visual Characterization and Diversity Quantification of Chemical Libraries: 1. Creation of Delimited Reference Chemical Subspaces. J. Chem. Inf. Model. 2011, 51, 1762–1774. [Google Scholar] [CrossRef] [PubMed]
- Sauer, W.H.B.; Schwarz, M.K. Molecular Shape Diversity of Combinatorial Libraries: A Prerequisite for Broad Bioactivity. J. Chem. Inf. Comput. Sci. 2003, 43, 987–1003. [Google Scholar] [CrossRef] [PubMed]
- Bonnet, P.; Mucs, D.; Bryce, R.A. Targeting the inactive conformation of protein kinases: Computational screening based on ligand conformation. MedChemComm 2012, 3, 434–440. [Google Scholar] [CrossRef]
- Mucs, D.; Bryce, R.A.; Bonnet, P. Application of shape-based and pharmacophore-based in silico screens for identification of Type II protein kinase inhibitors. J. Comput. Aided Mol. Des. 2011, 25, 569–581. [Google Scholar] [CrossRef] [PubMed]
- Lovering, F.; Bikker, J.; Humblet, C. Escape from Flatland: Increasing Saturation as an Approach to Improving Clinical Success. J. Med. Chem. 2009, 52, 6752–6756. [Google Scholar] [CrossRef] [PubMed]
- Na, I.-K.; Coutre, P. Article Commentary: Emerging Role of Tyrosine Kinases as Drugable Targets in Cancer. Biomark. Insights 2015, 10, BMI-S22432. [Google Scholar] [CrossRef] [PubMed]
- Moreno, L.; Pearson, A.D. How can attrition rates be reduced in cancer drug discovery? Expert Opin. Drug Discov. 2013, 8, 363–368. [Google Scholar] [CrossRef] [PubMed]
- WHO|INN Stems. Available online: http://www.who.int/medicines/services/inn/stembook/en/ (accessed on 9 February 2018).
- Bento, A.P.; Gaulton, A.; Hersey, A.; Bellis, L.J.; Chambers, J.; Davies, M.; Krüger, F.A.; Light, Y.; Mak, L.; McGlinchey, S.; et al. The ChEMBL bioactivity database: An update. Nucleic Acids Res. 2014, 42, D1083–D1090. [Google Scholar] [CrossRef] [PubMed]
- Home—ClinicalTrials.gov. Available online: https://clinicaltrials.gov/ (accessed on 9 February 2018).
- Pence, H.E.; Williams, A. ChemSpider: An Online Chemical Information Resource. J. Chem. Educ. 2010, 87, 1123–1124. [Google Scholar] [CrossRef]
- Chambers, J.; Davies, M.; Gaulton, A.; Hersey, A.; Velankar, S.; Petryszak, R.; Hastings, J.; Bellis, L.; McGlinchey, S.; Overington, J.P. UniChem: A unified chemical structure cross-referencing and identifier tracking system. J. Cheminform. 2013, 5, 3. [Google Scholar] [CrossRef] [PubMed]
- Wishart, D.S.; Knox, C.; Guo, A.C.; Shrivastava, S.; Hassanali, M.; Stothard, P.; Chang, Z.; Woolsey, J. DrugBank: A comprehensive resource for in silico drug discovery and exploration. Nucleic Acids Res. 2006, 34, D668–D672. [Google Scholar] [CrossRef] [PubMed]
- Southan, C.; Sharman, J.L.; Benson, H.E.; Faccenda, E.; Pawson, A.J.; Alexander, S.P.H.; Buneman, O.P.; Davenport, A.P.; McGrath, J.C.; Peters, J.A.; et al. The IUPHAR/BPS Guide to PHARMACOLOGY in 2016: Towards curated quantitative interactions between 1300 protein targets and 6000 ligands. Nucleic Acids Res. 2016, 44, D1054–D1068. [Google Scholar] [CrossRef] [PubMed]
- Möbitz, H. The ABC of protein kinase conformations. Biochim. Biophys. Acta BBA-Proteins Proteom. 2015, 1854, 1555–1566. [Google Scholar] [CrossRef] [PubMed]
- Eid, S.; Turk, S.; Volkamer, A.; Rippmann, F.; Fulle, S. KinMap: A web-based tool for interactive navigation through human kinome data. BMC Bioinform. 2017, 18. [Google Scholar] [CrossRef] [PubMed]
- Manning, G.; Whyte, D.B.; Martinez, R.; Hunter, T.; Sudarsanam, S. The Protein Kinase Complement of the Human Genome. Science 2002, 298, 1912–1934. [Google Scholar] [CrossRef] [PubMed]
- Molecular Operating Environment (MOE), 2016.08; Chemical Computing Group ULC: Montreal, QC, Canada, 2016.
- Chessel, D.; Dufour, A.B.; Thioulouse, J. The ade4 package-I-One-table methods. R News 2004, 4, 5–10. [Google Scholar]
Sample Availability: Not available. |

| 1 | No Ro5 Violation | 1 Ro5 Violation | 2 Ro5 Violations |
|---|---|---|---|
| PKIs approved | 20/39 (51%) | 11/39 (28%) | 8/39 (21%) |
| PKIs in clinical trials | 80/141 (57%) | 40/141 (28%) | 21/141 (15%) |
| All PKIs | 100/180 (56%) | 51/180 (28%) | 29/180 (16%) |
| MW > 500 Da | ClogP > 5 1 | HBA > 10 | HBD > 5 | |
|---|---|---|---|---|
| PKIs approved | 13/39 (33%) | 11/39 (28%) | 1/39 (2.5%) | 0/39 (0%) |
| PKIs in clinical trials | 44/141 (31%) | 32/141 (23%) | 2/141 (1.4%) | 0/141 (0%) |
| All PKIs | 57/180 (32%) | 43/180 (24%) | 3/180 (1.7%) | 0/180 (0%) |
| 1 | TPSA > 140 Å2 | NRB > 10 |
|---|---|---|
| PKIs approved | 0/39 (0%) | 2/39 (5.1%) |
| PKIs in clinical trials | 7/141 (5%) | 6/141 (4.3%) |
| All PKIs | 7/180 (3.9%) | 8/180 (4.4%) |
| Name Variable | Descriptor |
|---|---|
| MW | Molecular weight |
| LogP | Wildman-Crippen LogP value |
| TPSA | Topological polar surface area |
| HBA | Number of Hydrogen Bond Acceptors |
| HBD | Number of Hydrogen Bond Donors |
| NRB | Number of Rotatable Bonds |
| LabuteASA | Labute’s Approximate Surface Area |
| NAR | Number of aromatic rings |
| FCSP3 | Fraction of C atoms that are sp3 hybridized |
| MQN8 | Molecular QuantumNumbers |
| MQN10 | Molecular QuantumNumbers |
© 2018 by the authors. Licensee MDPI, Basel, Switzerland. This article is an open access article distributed under the terms and conditions of the Creative Commons Attribution (CC BY) license (http://creativecommons.org/licenses/by/4.0/).
Share and Cite
Carles, F.; Bourg, S.; Meyer, C.; Bonnet, P. PKIDB: A Curated, Annotated and Updated Database of Protein Kinase Inhibitors in Clinical Trials. Molecules 2018, 23, 908. https://doi.org/10.3390/molecules23040908
Carles F, Bourg S, Meyer C, Bonnet P. PKIDB: A Curated, Annotated and Updated Database of Protein Kinase Inhibitors in Clinical Trials. Molecules. 2018; 23(4):908. https://doi.org/10.3390/molecules23040908
Chicago/Turabian StyleCarles, Fabrice, Stéphane Bourg, Christophe Meyer, and Pascal Bonnet. 2018. "PKIDB: A Curated, Annotated and Updated Database of Protein Kinase Inhibitors in Clinical Trials" Molecules 23, no. 4: 908. https://doi.org/10.3390/molecules23040908
APA StyleCarles, F., Bourg, S., Meyer, C., & Bonnet, P. (2018). PKIDB: A Curated, Annotated and Updated Database of Protein Kinase Inhibitors in Clinical Trials. Molecules, 23(4), 908. https://doi.org/10.3390/molecules23040908


