Article

Three New Polyynes from Codonopsis pilosula and Their Activities on Lipid Metabolism

1
School of Pharmacy and Chemistry, Dali University, Dali 671000, China
2
Guangdong Key Laboratory for Genome Stability & Disease Prevention, School of Pharmaceutical Sciences, School of Medicine, Shenzhen University Health Science Center, Shenzhen 518060, China
3
State Key Laboratory of Phytochemistry and Plant Resources in West China, Kunming Institute of Botany, Chinese Academy of Sciences, Kunming 650201, China
4
School of Pharmacy, Henan University of Chinese Medicine, Zhengzhou 450008, China
5
College of Pharmacy, Chengdu University of Traditional Chinese Medicine, Chengdu 610075, China
*
Authors to whom correspondence should be addressed.
These authors contributed equally to this work.
Molecules 2018, 23(4), 887; https://doi.org/10.3390/molecules23040887
Submission received: 14 March 2018 / Revised: 27 March 2018 / Accepted: 27 March 2018 / Published: 12 April 2018
(This article belongs to the Section Natural Products Chemistry)

Abstract

:
Three new polyynes, named choushenpilosulynes A–C (13), were isolated from an 85% aqueous EtOH extract of the roots of Codonopsis pilosula cultivated in Xundian County of Yunnan province, China. Their structures, including the absolute configuration of the glucose residue in 1 and 2, were determined by spectroscopic analysis and gas chromatography (GC). In addition, biological evaluation shows that all the compounds can inhibit the expression of the squalene monooxygenase (SQLE) gene in HepG2 cells, suggesting that these compounds may be involved in lipid metabolism.

Graphical Abstract

1. Introduction

High cholesterol is associated with several diseases, including coronary heart disease [1], cancers [2] and neurodegeneration [3]. It has been reported that coronary artery disease (CAD) was the leading cause of death globally and led to over seven million deaths before 2010 [4]. Human 3-hydroxy-3-methylglutaryl-coenzyme A reductase (HMGCR) and squalene monooxygenase (SQLE), two key control enzymes in cholesterol synthesis, play an important role in the metabolism of cholesterol [5]. Codonopsis pilosula (Franch.) Nannf. belongs to the family of Campanulaceae and is mainly distributed in northern or western parts of China, such as Gansu and Shaanxi provinces. The dry root of this plant, known as Dangshen, is often utilized in traditional Chinese medicine to replenish Qi, invigorate the spleen, and nourish the lungs [6,7,8]. Previous studies have shown that phytosteroids, sesquiterpenes, triterpenes, alkaloids, alkylalcohol glycosides, phenylpropanoid glycosides, polyacetylene glycosides, neolignan, and polysaccharides are present in this plant [9,10]. However, C. pilosula produced in Yunnan province, locally known as Choushen, possesses different functions such as generating fats [11]. This difference attracted our attention and we undertook a study on Choushen grown at high altitudes in Yunnan province, which led to the isolation of three new polyynes, choushenpilosulynes A–C (13) (Figure 1). In this paper, we describe the isolation and structural elucidation of compounds 13, as well as their biological activities on lipid metabolism.

2. Results and Discussion

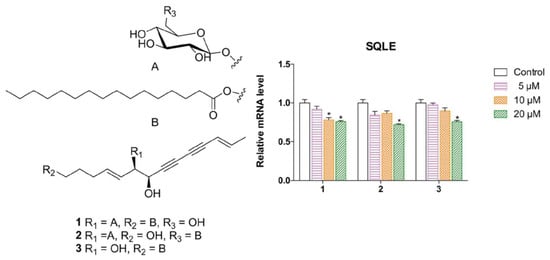
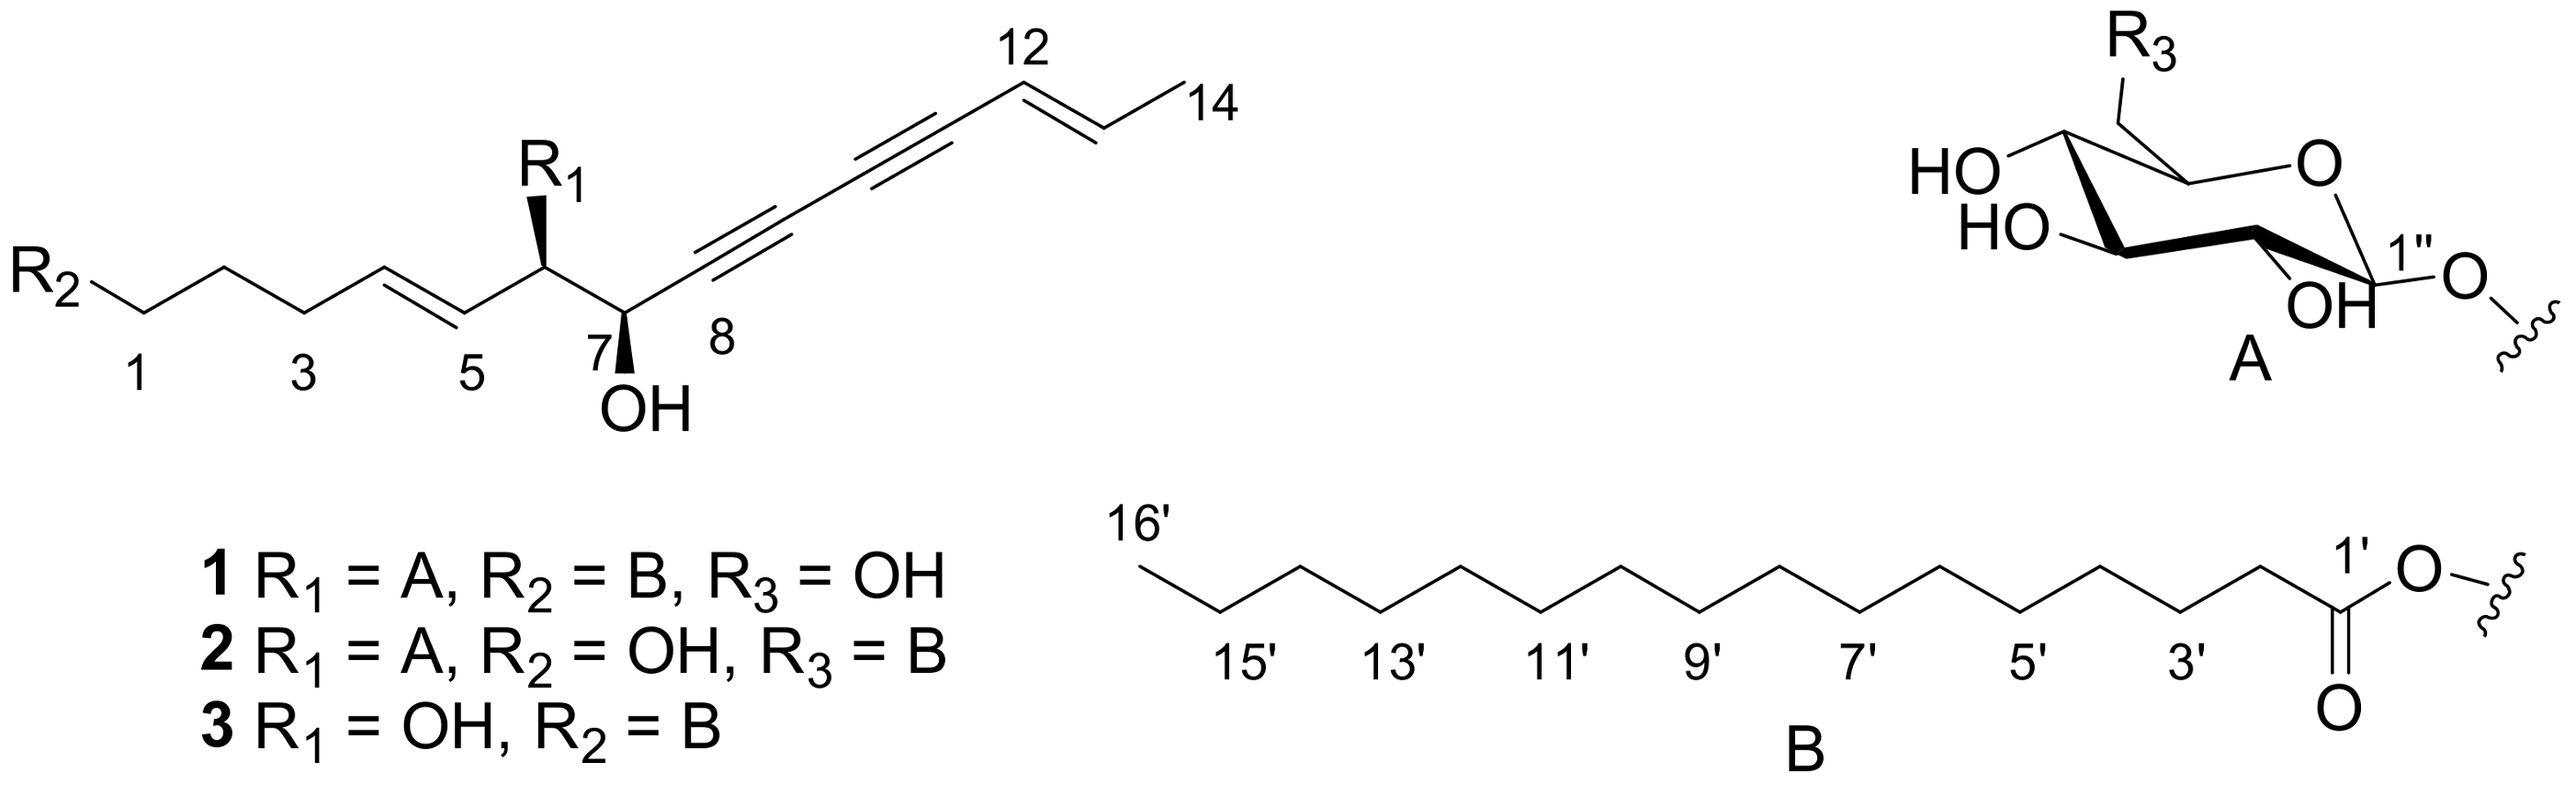
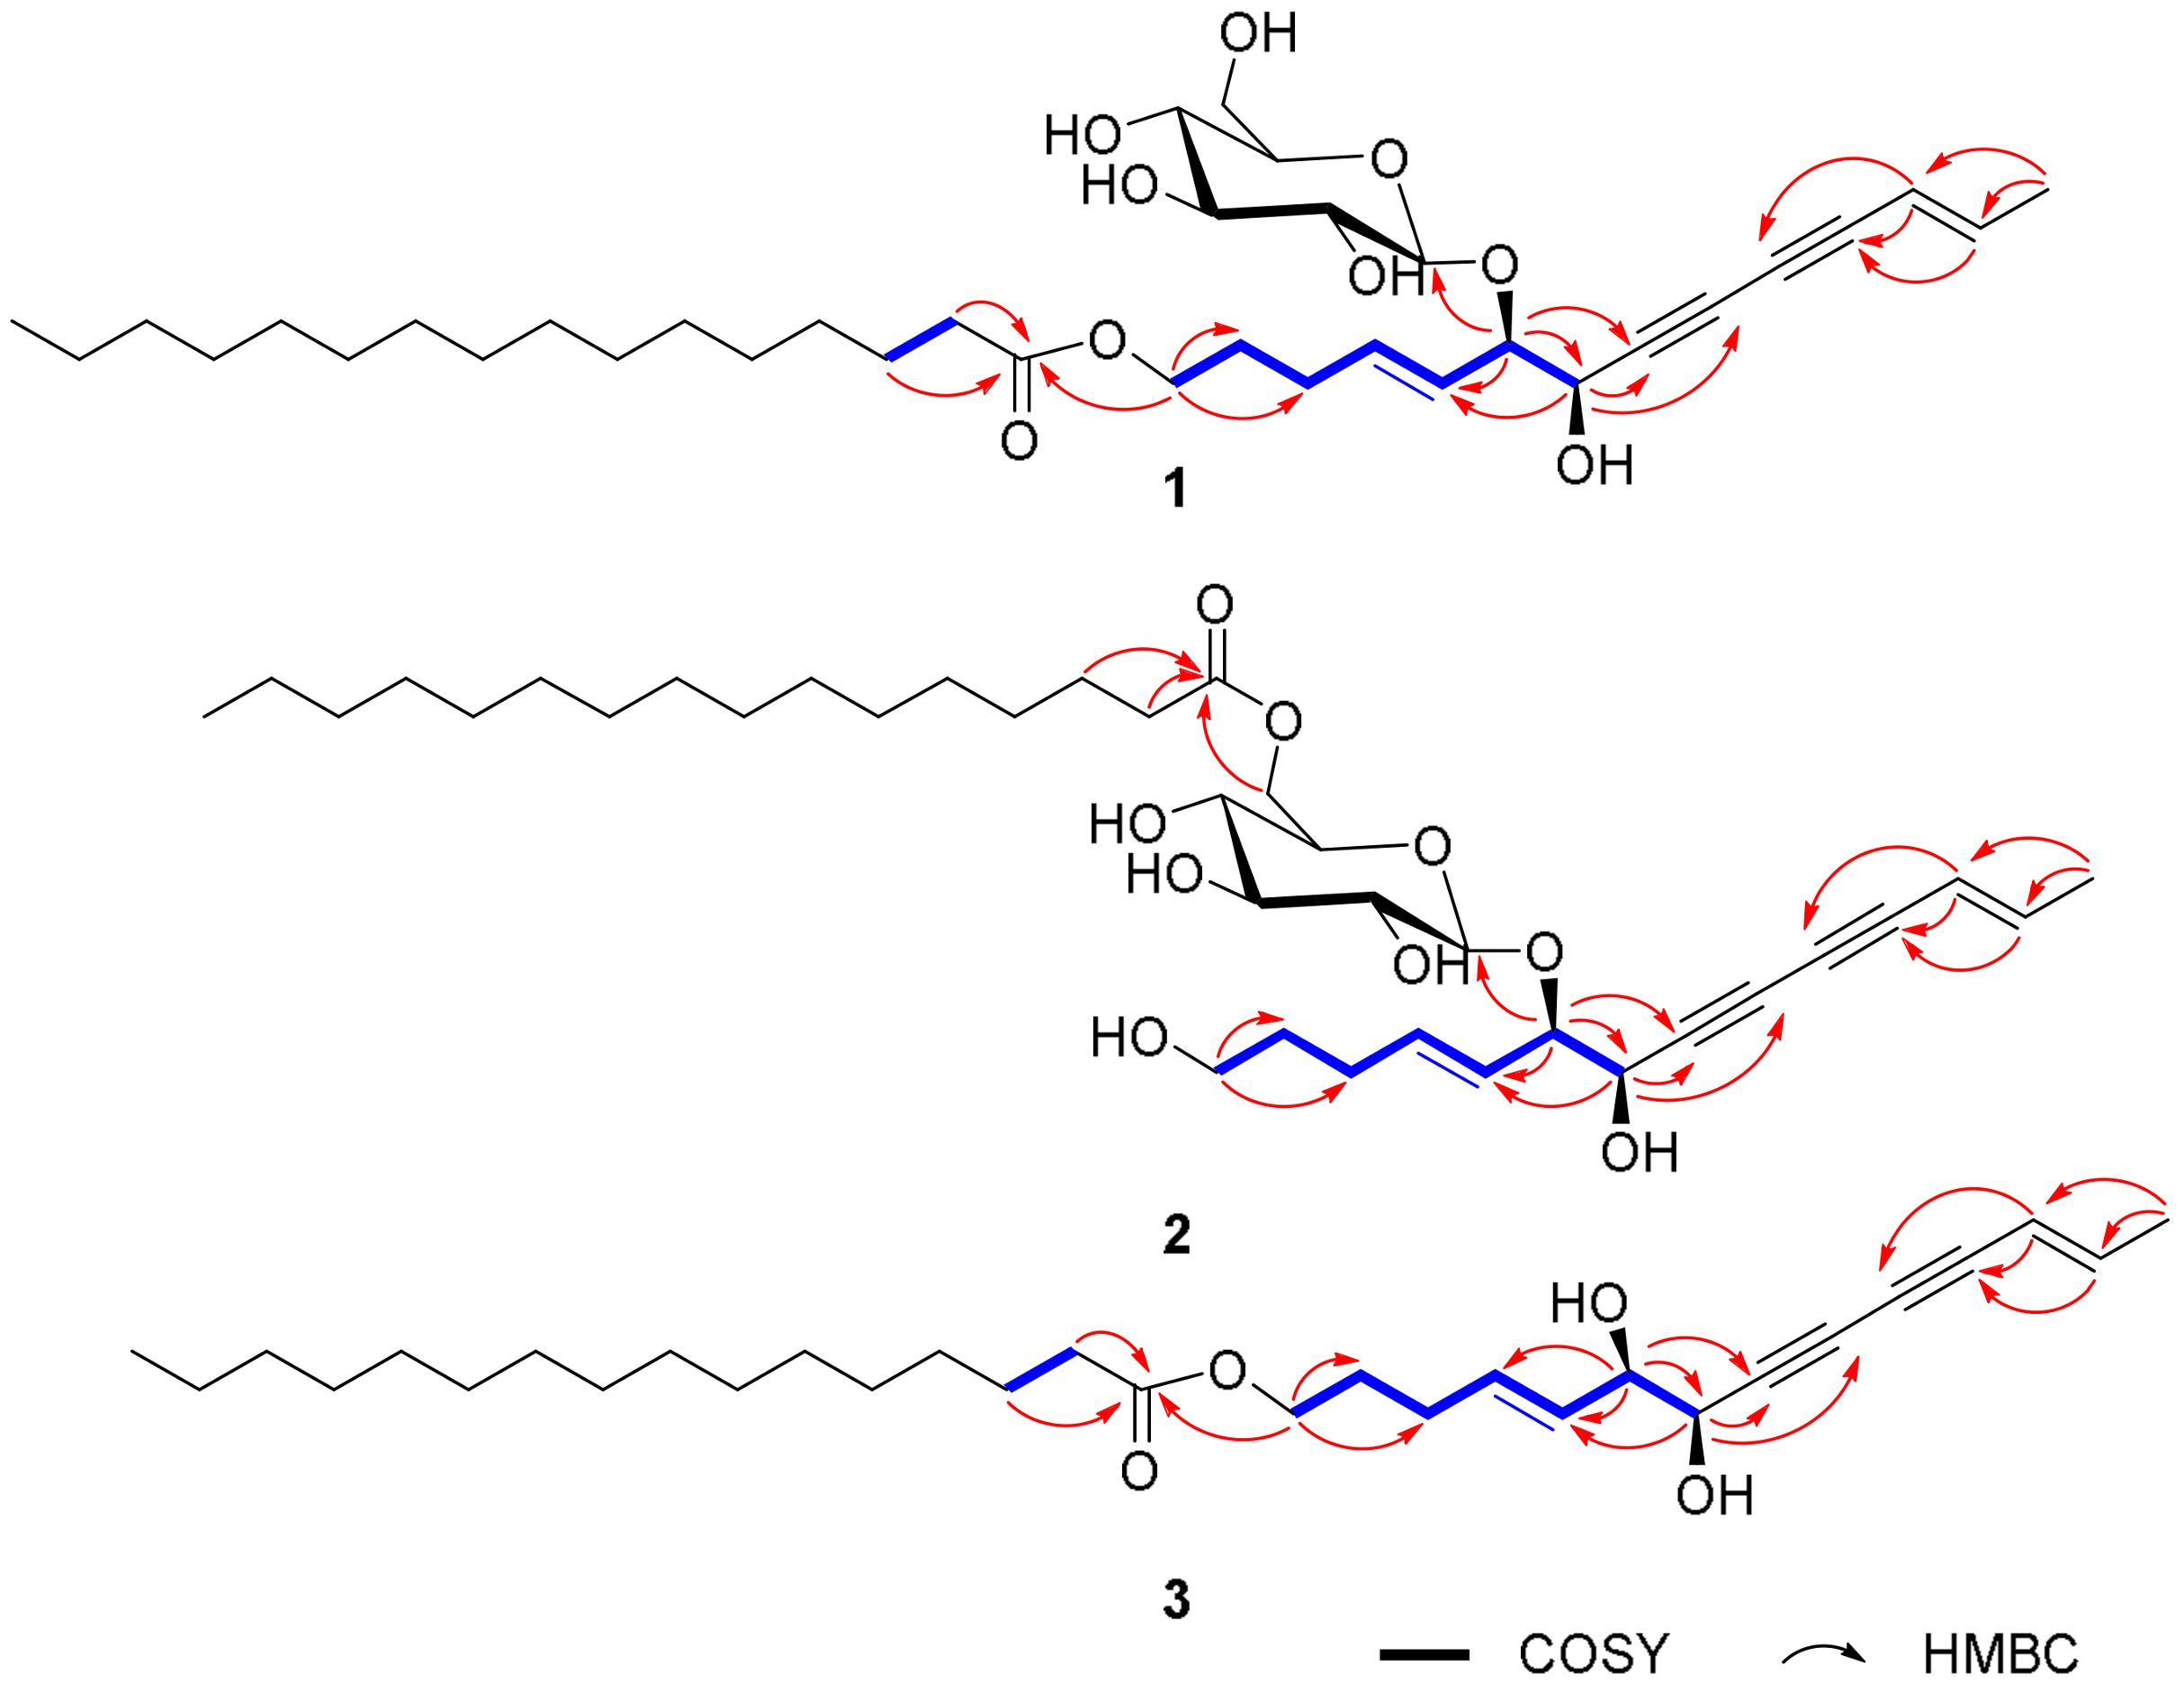
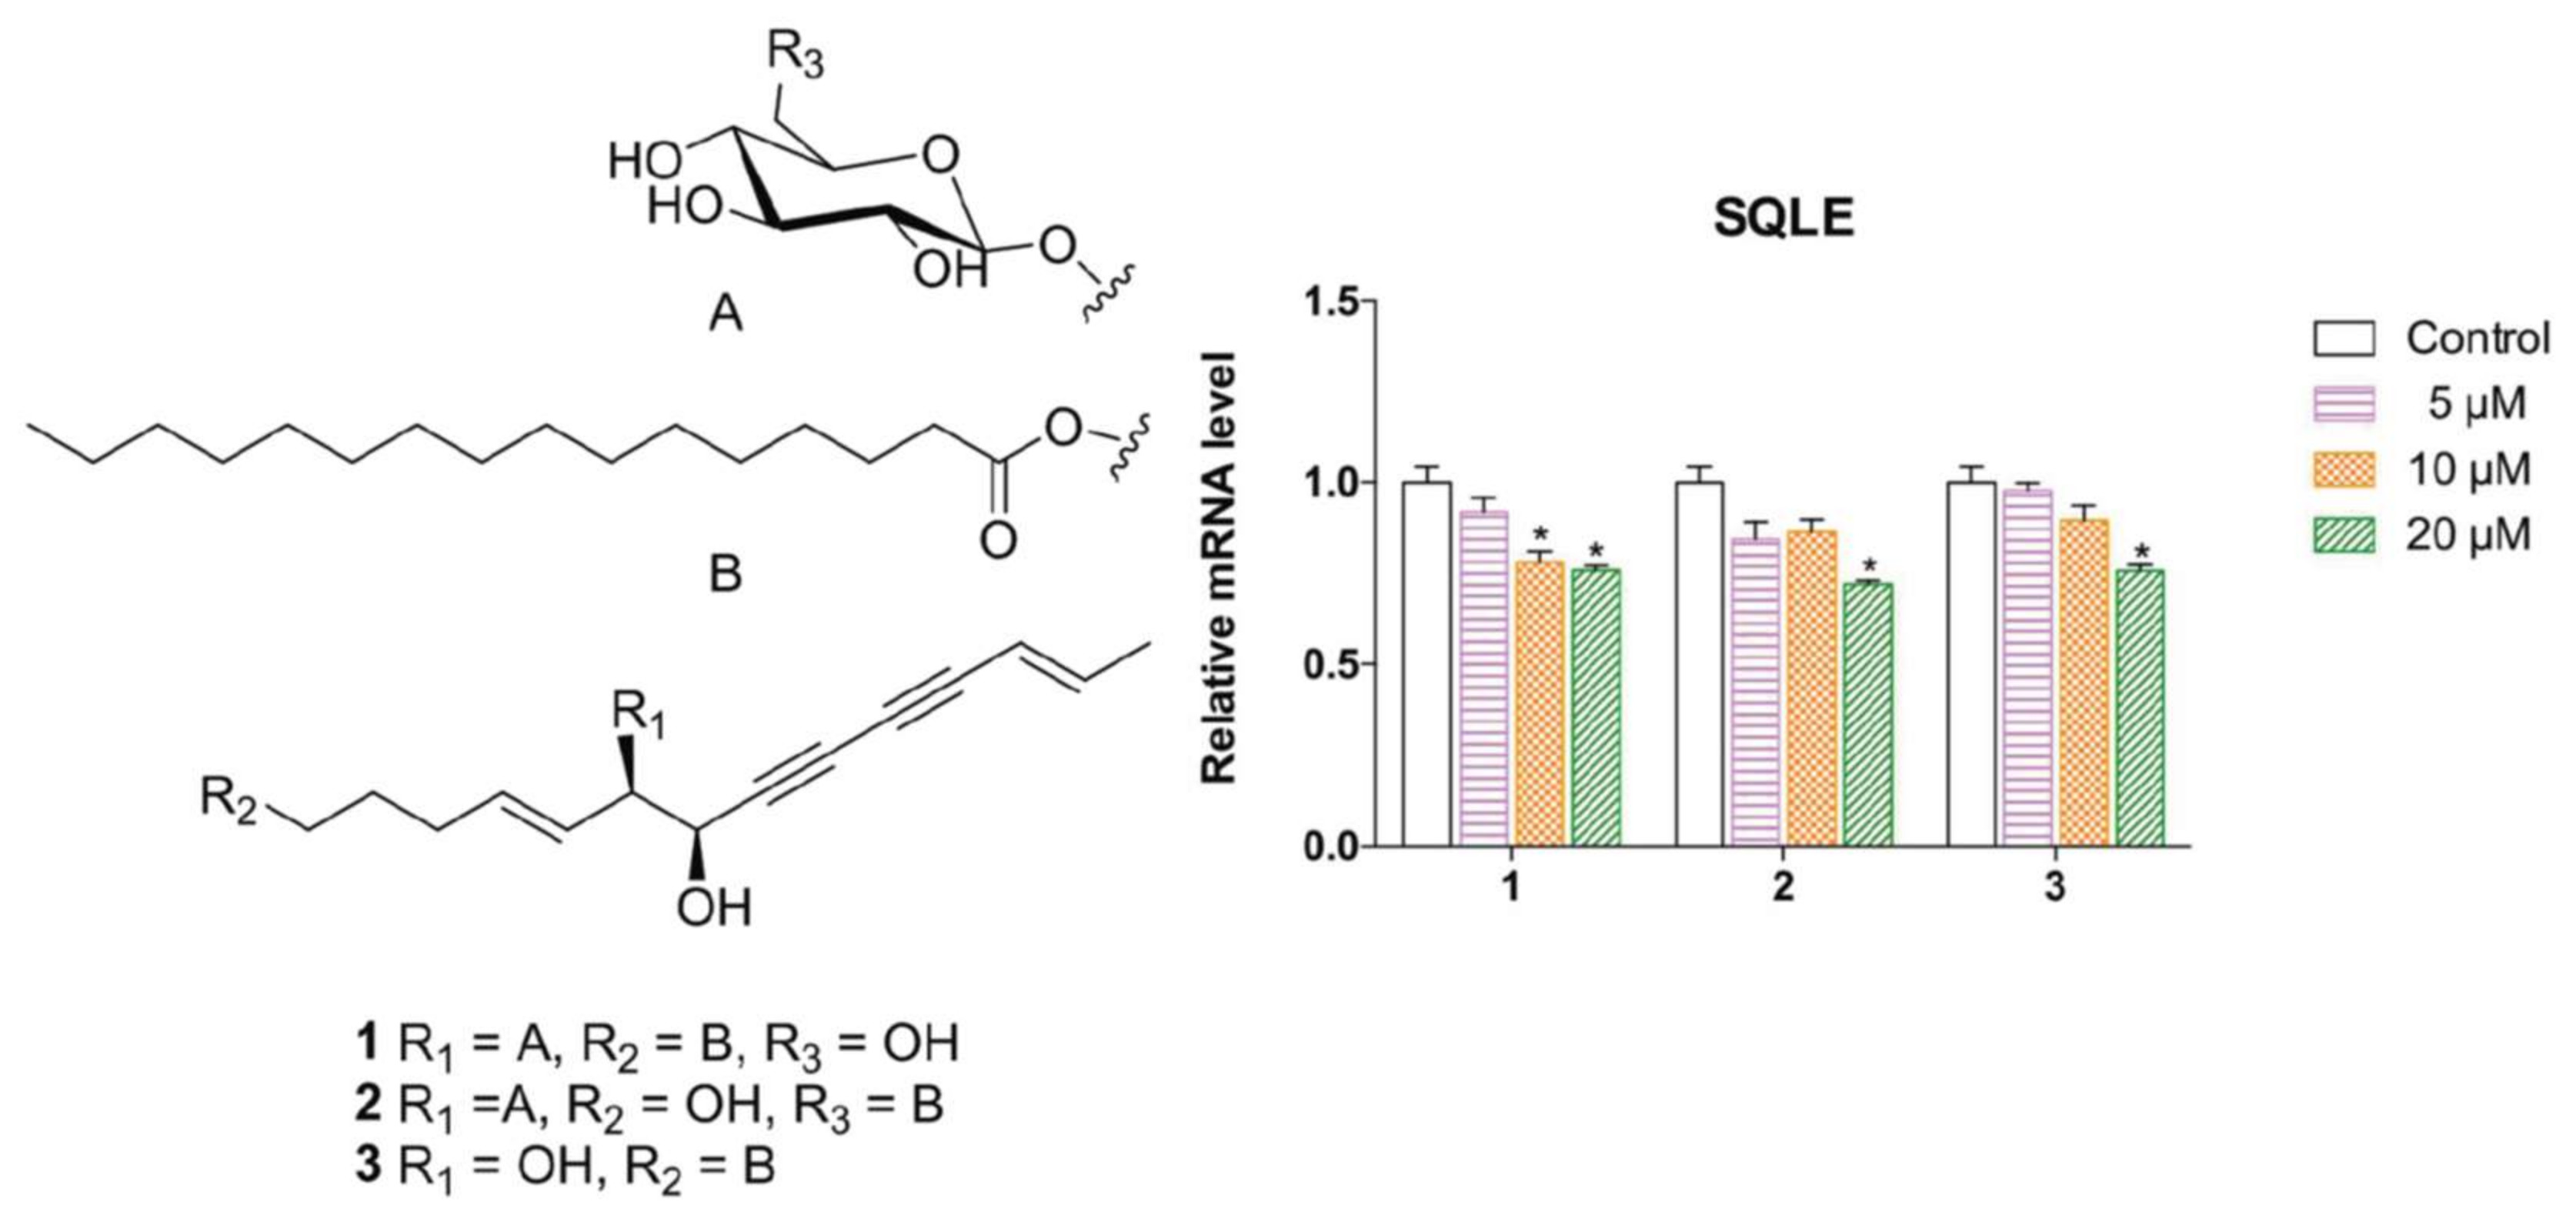
2.1. Elucidation of the Compounds’ Structures

Choushenpilosulyne A (1), obtained as a white amorphous powder, has a molecular formula C36H58O9 (eight degrees of unsaturation) on the basis of its HRESIMS at m/z = 657.3985 [M + Na]+ (calcd. for 657.3979), 13C-NMR, and DEPT spectra (Supplementary Material Figures S5 and S6). The 1H-NMR spectrum (Table 1) suggests the existence of two pairs of olefinic protons at δH = 6.31 (1H, dq, J = 15.7, 7.0 Hz, H-13), 5.50 (1H, dd, J = 15.7, 1.2 Hz, H-12), 5.87 (1H, dt, J = 15.6, 6.4 Hz, H-4), and 5.39 (1H, dd, J = 15.6, 7.2 Hz, H-5). The large coupling constants (nearly 16.0 Hz) of the two pairs of olefinic protons suggest the trans form of the double bonds. The 13C-NMR and DEPT spectra (Table 1) show that this substance contains 36 carbons, including two methyl, eighteen methylene (two oxygenated), eleven methine (four sp2, seven sp3) and five quaternary carbons (including one carboxyl). In addition, the observation of one anomeric proton at δH = 4.37 (d, J = 7.2 Hz), five methine (δC = 99.0, 76.2, 75.6, 73.1, and 68.8) and one methylene (δC = 60.2) in the 1H- and 13C-NMR spectra of 1 reveals the presence of a sugar residue. In the 13C-NMR and DEPT spectra, four additional quaternary carbons (δC = 79.1, 77.8, 71.7, and 71.3) are part of one conjugated diyne structure [12,13]. These data are similar to those of lobetyolin [14]. The difference is that 1 contains a 16-carbon side chain, which is absent in lobetyolin. This conclusion is confirmed by the HMBC correlation of H-1/C-1′ (δC = 174.1) (Figure S1). Specifically, the HMBC correlation of H-6/C-1′ (δC = 99.0) indicates the position of the glucose residue. The fragment of C14-diendiynetriol is confirmed by the 1H–1H COSY correlations of H-1/H-2/H-3/H-4/H-5/H-6/H-7 and H-12/H-13/H-14, and by the HMBC correlations of H-6/C-7, C-8, H-7/C-8, C-9, H-12/C-10, C-11, and H-13/C-11 (Figure 2). The relevant NMR data in the literature suggest that threo and erythro vic-diols with similar partial structures have coupling constants of 6.0–7.0 Hz for threo diols and 3.0–4.0 Hz for erythro diols [15,16,17,18]. The JH-6,H-7 (6.5 Hz) value indicates a threo configuration between H-6 and H-7. For the configuration of sugar moiety, the presence of a d-glucose residue in the structure of 1 comes from analysis of the acid hydrolysis product. In detail, the l-cysteine methyl ester hydrochloride derivatives of the hydrolysis product of 1, d- and l-glucose, were prepared and subjected to comparison via gas chromatography (GC) (Supplementary Material Figures S1–S4). The retention time for 1 is 21.246 min, close to that of d-glucose (21.276 min), rather than that of l-glucose (21.768 min), clarifying the type of sugar and its configuration. Taken together, all of these results allow for the identification of the structure of 1, named choushenpilosulyne A (Supplementary Material Figures S5–S15).
Choushenpilosulyne B (2), isolated as a white amorphous powder, has the molecular formula C36H58O9 (8 degrees of unsaturation), deduced from analysis of its HRESIMS m/z = 657.3973 [M + Na]+ (C36H58NaO8, calcd. for 657.3979), 13C-NMR, and DEPT spectra (Supplementary Material Figure S16 and S17). The 1H-NMR spectrum (Table 2) exhibits two pairs of olefinic protons at δH = 6.32 (1H, dq, J = 15.6, 6.7 Hz, H-13), 5.51 (1H, d, J = 15.6 Hz, H-12), 5.84 (1H, dt, J = 15.5, 6.5 Hz, H-4), and 5.46 (1H, dd, J = 15.5, 7.5 Hz, H-5). The 13C-NMR and DEPT spectra show four additional quaternary carbons (δC = 79.2, 77.1, 71.8, and 70.8) and four olefinic methine (δC = 144.3, 137.8, 125.2, and 109.5). The data of 2 are very similar to those of 1, differing in that the side chain in 2 is connected to C-6″, which is verified by the upfield shift of C-1 and downfield shift of glucose C-6 in compound 2 with respect to those in compound 1, and by the HMBC correlations of Ha-6″ (δH = 4.37)/C-1′ (δC = 174.5). Additionally, the HMBC correlation of H-6/C-7 clearly indicates the location of the sugar moiety. Similarly, the JH-6,H-7 (6.7 Hz) value indicates a threo configuration between H-6 and H-7. A d-glucose residue was identified in the structure of 2 by comparing the retention time of the acid hydrolysis product with the standard sample in the manner as described for 1. Thus, the structure of 2, named choushenpilosulyne B, was determined to be that shown in Figure 1 (Supplementary Material Figures S16–S23), Table 2.
Choushenpilosulyne C (3), isolated as a white amorphous powder, has the molecular formula C30H48O4 (8 degrees of unsaturation), deduced from analysis of its HRESIMS m/z = 495.3454 [M + Na]+ (C30H48NaO4 calcd. for 495.3450) (Supplementary Material Figures S30–S33), 13C-NMR, and DEPT spectra. The 1H-NMR spectrum (Table 3) suggests the existence of two pairs of olefinic protons at δH = 6.32 (1H, dq, J = 15.7, 6.8 Hz, H-13), 5.57 (1H, overlap, H-12), 5.80 (1H, dt, J = 15.5, 6.4 Hz, H-4), and 5.57 (1H, overlap, H-5). In the 13C-NMR and DEPT spectra, four additional quaternary carbons (δC = 78.0, 76.5, 72.6, and 71.3) and four olefinic methine (δC = 145.1, 134.2, 130.3, and 110.6) are observed. These data are very similar to those of 1, differing in that the sugar moiety is absent in 3. The HMBC correlation of H-1/C-1′ (δC = 175.6) indicates that the side chain is located at C-1. Similarly, the JH-6,H-7 (6.7 Hz) value indicates a threo configuration between H-6 and H-7. In the ROESY spectrum (Figure S29), the correlations of H-3/H-5 and H-12/H-13 suggest the trans form of the double bonds. Thus, the structure of 3, named choushenpilosulyne C, was determined to be that shown in Figure 1 (Supplementary Material Figures S24–S29).

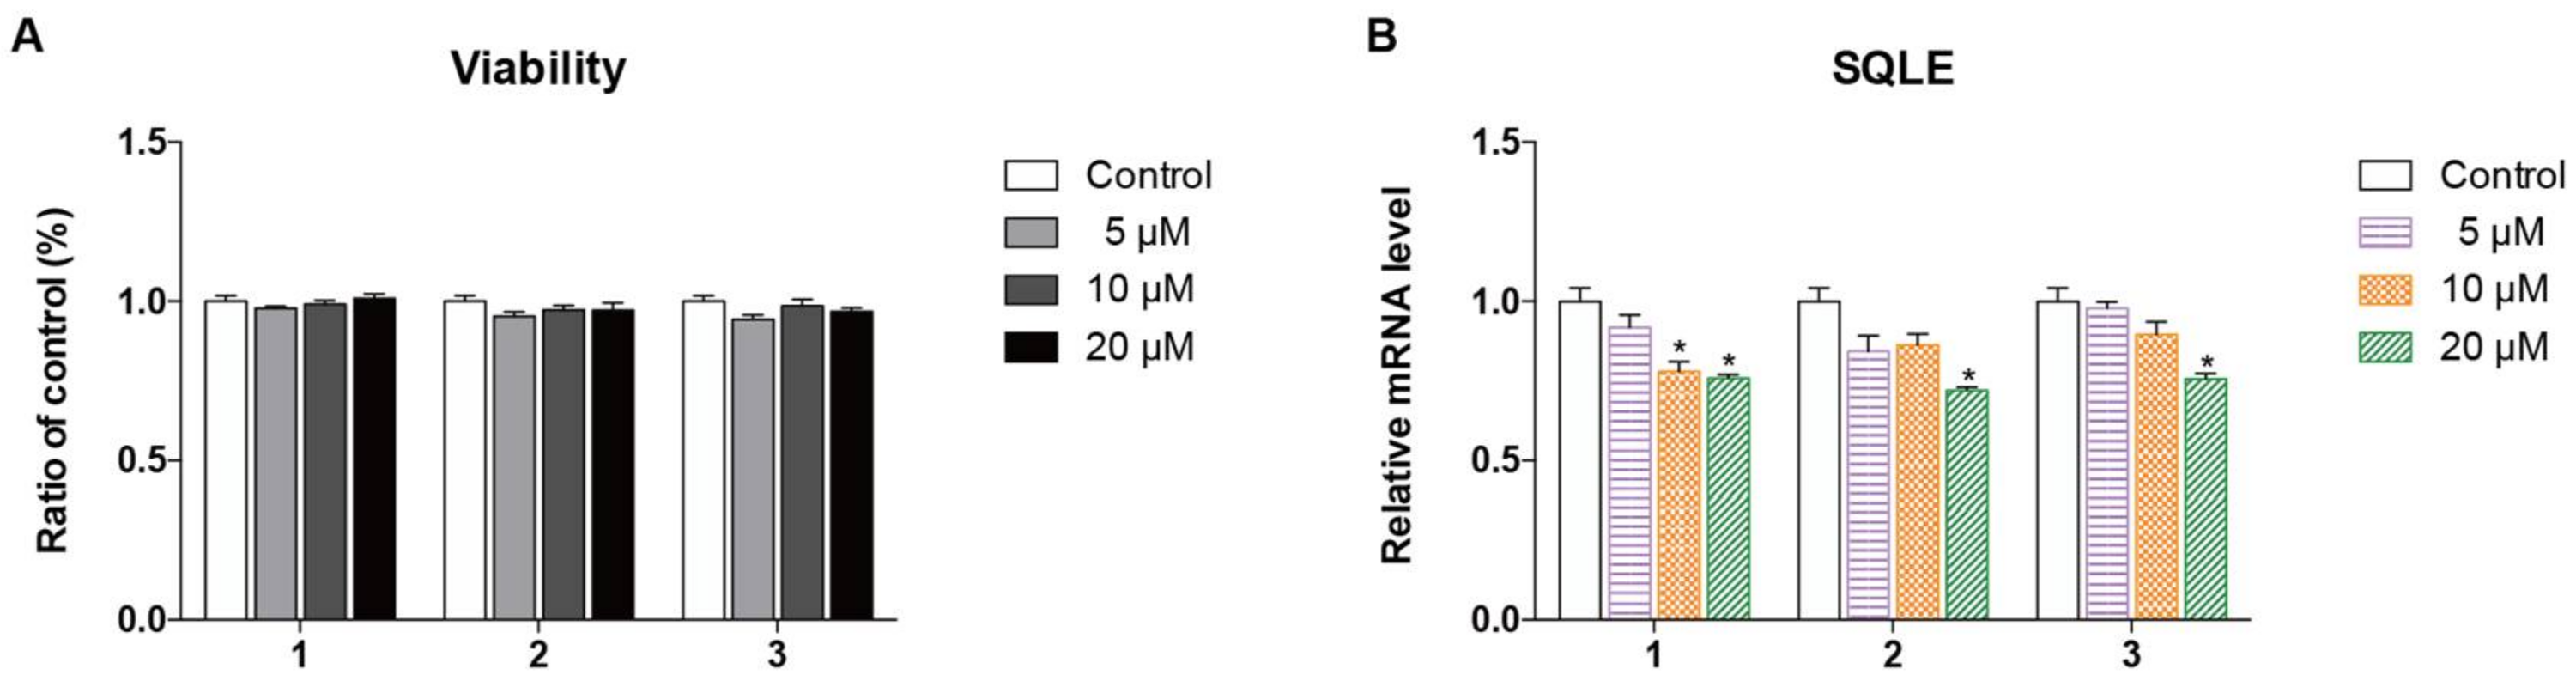
2.2. Biological Evaluation

Squalene monooxygenase (SQLE), as a control enzyme, uses NADPH and molecular oxygen to oxidize squalene to 2,3-oxidosqualene (squalene epoxide). Squalene epoxidase catalyzes the first oxygenation step in sterol biosynthesis and is thought to be one of the rate-limiting enzymes in this pathway. Since SQLE has an important role in lipid biosynthesis and Choushen is known to lower lipids, we studied SQLE. The cytotoxic effects of compounds 13 on cell viability are shown in Figure 3A. These tests help elucidate the relationship between the compounds and their lipid accumulation inhibitory effects in HepG2 cells. Interestingly, we observed that all the compounds potently reduce the SQLE transcript level in a dose-dependent manner (Figure 3B). Moreover, at the doses tested, none of the compounds affects the viability of hepatic cells, excluding the possibility that their cytotoxicity induces changes in the SQLE transcript level. Therefore, the findings suggest that the isolated compounds might be useful in treating disturbances of the lipid metabolism, such as hypercholesterolemia and atherosclerosis, by regulating cholesterol metabolism. However, the exact molecular mechanism of this regulation needs to be elucidated.

3. Experimental Methods

3.1. General Procedures

Column chromatography was undertaken on MCI gel CHP 20P (75–150 μm, Mitsubishi Chemical Industries, Tokyo, Japan), Silica gel (200–300 mesh, Qingdao Marine Chemical Inc., Qingdao, China), RP-18 (40–60 µm; Daiso Co., Tokyo, Japan), and Sephadex LH-20 (Amersham Pharmacia, Uppsala, Sweden). Optical rotations were measured on a Horiba SEPA-300 polarimeter (Horiba, Kyoto, Japan). UV spectra were obtained on a Shimadzu UV-2401PC spectrometer (Shimadzu Corporation, Tokyo, Japan). GC analysis was performed using an Agilent 6890N gas chromatography instrument (Agilent Technologies, Santa Clara, CA, USA). Semi-preparative or analytic HPLC was carried out using an Agilent 1200 liquid chromatograph (Agilent Technologies, Santa Clara, CA, USA) where the columns used were a YMC-Pack ODS-A (250 mm × 9.4 mm, i.d., 5 µm), or an Agilent Eclipse XDB-C18 (150 mm × 4.6 mm, i.d., 5 µm). NMR spectra were recorded at room temperature on an AV-400 or AV-600 spectrometer (Bruker, Karlsruhe, Germany) with TMS as an internal standard. ESIMS and HRESIMS data were collected by an Agilent G6230TOF MS spectrometer (Agilent Technologies, Santa Clara, CA, USA).

3.2. Plant Material

The roots of C. pilosula were collected from a cultivation base in Xundian County, Yunnan province, China, in November 2015. The material was previously identified by Prof. De-Yuan Hong at Beijing Institute of Botany, Chinese Academy of Sciences, China. A voucher specimen (1016268) was deposited at the Herbarium of Kunming Institute of Botany, Chinese Academy of Sciences, Beijing, China.

3.3. Extraction and Isolation

The powders of C. pilosula (20 kg) roots were soaked with 85% aqueous EtOH (4 × 80 L × 24 h) and concentrated under reduced pressure to yield a crude extract. The extract was suspended in water and partitioned with EtOAc thrice followed by the removal of solvents to produce an EtOAc soluble extract. The EtOAc extract (270.0 g) was separated by using a MCI gel CHP-20 column eluted with gradient aqueous MeOH (35%–100%) to provide six parts (Fr.1–Fr.6). Fr.5 (45.0 g) was further separated by Sephadex LH-20 (MeOH) to yield two fractions (Fr.5.1 and Fr.5.2), of which, the second fraction Fr.5.2 (29.0 g) was divided into three portions (Fr.5.2.1–Fr.5.2.3) by a RP-18 column (MeOH/H2O, 35–100%). Among them, Fr.5.2.3 (4.0 g) was purified by Sephadex LH-20 (MeOH), followed by semi-preparative HPLC eluted with MeCN/H2O (90%) to yield compound 1 (10.5 mg, Rt = 28.2 min), and with MeOH/H2O (92%) to yield compound 2 (7.2 mg, Rt = 15.8 min). Fr.6 (78.0 g) was separated by Sephadex LH-20 (MeOH) to yield three fractions (Fr.6.1–Fr.6.3). Fr.6.1 (25.0 g) was further separated by a silica gel column (CHCl3/MeOH, 50:1, 25:1, 15:1, 9:1, 5:1, 2:1) to get six fractions (Fr.6.1.1–Fr.6.1.6). Of them, Fr.6.1.1 (4.5 g) was purified by Sephadex LH-20 (MeOH) followed by semi-preparative HPLC (MeOH/H2O, 92%) to yield compound 3 (5.5 mg, Rt = 30.2 min).

3.4. Compound Characterization Data

Choushenpilosulyne A (1): White amorphous powders; [ α ] 22 D –14.8 (c = 0.3, MeOH); UV (MeOH) λmax (logε) = 215 (4.33), 240 (3.80), 254 (3.97), 267 (4.11), 284 (4.02) nm; ESIMS m/z = 657 [M + Na]+, HRESIMS m/z = 657.3985 [M + Na]+ (calcd. for C36H58NaO8, 657.3979); 1H- and 13C-NMR data, see Table 1.
Choushenpilosulyne B (2): White amorphous powders; [ α ] 24 D –18.0 (c = 0.2, MeOH); UV (MeOH) λmax (logε) = 215 (4.37), 241 (3.98), 254 (4.08), 268 (4.14), 284 (4.16) nm; ESIMS m/z = 657 [M + Na]+, HRESIMS m/z = 657.3973 [M + Na]+ (calcd. for C36H58NaO8, 657.3979); 1H- and 13C-NMR data, see Table 2.
Choushenpilosulyne C (3): White amorphous powders; [ α ] 24 D + 1.6 (c = 0.2, MeOH); UV (MeOH) λmax (logε) = 215 (4.34), 241 (3.74), 254 (3.98), 267 (4.15), 283 (4.06) nm; ESIMS m/z = 495 [M + Na]+, HRESIMS m/z = 495.3454 [M + Na]+(C30H48NaO4 calcd. for 495.3450); 1H- and 13C-NMR data, see Table 3.

3.5. Acid Hydrolysis and Sugar Analysis

d or l-glucose (1 mg) was dissolved in anhydrous pyridine (1 mL). To these solutions, l-cysteine methyl ester hydrochloride (3.0 mg) was added and the mixtures were stirred at 60 °C for 1 h and concentrated in vacuo at 0 °C. A 0.4 mL solution of 1-(trimethylsiyl) imidazole was slowly added to the mixtures and followed by stirring at 60 °C for 1 h. After cooling, 1 mL of water was slowly added into the mixtures. Then, the mixtures were extracted with n-hexane. The n-hexane layer was directly analyzed by gas chromatography (GC).
Compound 1 or 2 (3.0 mg, respectively) were stirred at 75 °C with 6 mol/L HCl (1.5 mL) for 5 h. After reaction, the mixtures were extracted with EtOAc (1.5 mL, 3 times). The aqueous layer was neutralized with 1 N NaOH and concentrated in vacuo. Then, the residue was dissolved in anhydrous pyridine (2 mL). To these solutions, l-cysteine methyl ester hydrochloride (3.0 mg) was added. The mixtures were stirred at 60 °C for 1 h and concentrated in vacuo at 0 °C. A 0.4 mL solution of 1-(trimethylsiyl) imidazole was slowly added to the mixtures and followed by stirring at 60 °C for 1 h. After cooling, 1 mL of water was slowly added into the mixtures. Then, the mixtures were extracted with n-hexane. The n-hexane layer was directly analyzed by gas chromatography (GC). The d-configuration of glucose in 1 or 2 was determined by comparing the retention time with a standard sample [19].

3.6. Cell Viability Assay

Cytotoxicity was determined by the MTT assay using previously described method [20]. HepG2 cells (8000 cells/well) were seeded onto a 96-well plate and incubated for 24 h to allow cell adherence. Fresh medium containing the test samples was added into the cultures and incubated at 37 °C for 24 h. MTT was added; after 4 h of incubation, absorbance was measured at a wavelength of 570 nm using an enzyme-linked immunosorbent assay reader (Bio Tek, Winnooski, VT, USA).

3.7. RT-PCR

All of RNA in the HepG2 cells was extracted using the Trizol and Direc-zolTM RNA MiniPrep kits. 1 mg total RNA was reversely transcribed with Prime ScriptTM RT Master Mix. SYBR green real-time quantitative assays were performed on a qTOWER apparatus using an SYBR® Premix Ex TaqTM II kit reagent, following the protocol specified by the manufacturer. The expressions of SQLE gene were analyzed. Primers of SQLE used in the study were forward: 5′-cctgaatcagaaaataaggagca-3′, and reverse: 5′-gcttgtttctgaaatattggttcc-3′.

4. Conclusions

To conclude, this study led to the isolation of three new polyynes. These compounds were found to inhibit the expression of SQLE gene transcript in HepG2 cells, which suggests that these compounds might contribute to lipid metabolism.

Supplementary Materials

The following are available online. Figures S1–S4: GC analysis of the derivative of d-glucose or l-glucose, Figures S5–S13: NMR spectra of 1, Figures S14 and S15: ESIMS and HRESIMS of 1, Figures S16–S21: NMR spectra of 2, Figures S22 and S23: ESIMS and HRESIMS of 2, Figures S24–S29: NMR spectra of 3, Figures S30 and S31: ESIMS and HRESIMS of 3.

Acknowledgments

This study was supported by National Science Fund for Distinguished Young Scholars (81525026), the Major Project on Biotechnology of Yunnan province (2014FC002), and Open Research Fund of State Key Laboratory Breeding Base of Systematic Research, Development, and Utilization of Chinese Medicine Resources.

Author Contributions

Y.-X.C. conceived and designed the experiments, X.-Y.H. carried out biological experiments. F.-Y.Q. performed extraction and isolation. X.-F.L. and L.-S.Z. analyzed the data; F.-Y.Q. and Y.-X.C. wrote the paper. All authors read and approved the final manuscript.

Conflicts of Interest

The authors declare that there is no conflict of interest.

References

  1. Katz, S.S.; Shipley, G.G.; Small, D.M. Physical chemistry of the lipids of human atherosclerotic lesions. J. Clin. Investig. 1976, 58, 200–211. [Google Scholar] [CrossRef] [PubMed]
  2. Krycer, J.R.; Brown, A.J. Cholesterol accumulation in prostate cancer: A classic observation from a modern perspective. Biochim. Biophys. Acta 2013, 1835, 219–229. [Google Scholar] [CrossRef] [PubMed]
  3. Liu, B.; Turley, S.D.; Burns, D.K.; Miller, A.M.; Repa, J.J.; Dietschy, J.M. Reversal of defective lysosomal transport in NPC disease ameliorates liver dysfunction and neurodegeneration in the npc1−/− mouse. Proc. Natl. Acad. Sci. USA 2009, 106, 2377–2382. [Google Scholar] [CrossRef] [PubMed]
  4. Raza1, S.T.; Abbas1, S.; Eba1, A.; Karim, F.; Wani, I.A.; Rizvi1, S.; Zaidi1, A.; Mahdi, F. Association of COL4A1 (rs605143, rs565470) and CD14 (rs2569190) genes polymorphism with coronary artery disease. Mol. Cell Biochem. 2018. [Google Scholar] [CrossRef] [PubMed]
  5. Howe, V.; Sharpe, L.J.; Prabhu, A.V.; Brown, A.J. New insights into cellular cholesterol acquisition: Promoter analysis of human HMGCR and SQLE, two key control enzymes in cholesterol synthesis. BBA-Mol. Cell Biol. Lipids 2017, 1862, 647–657. [Google Scholar] [CrossRef] [PubMed]
  6. He, J.Y.; Ma, N.; Zhu, S.; Komatsu, K.; Li, Z.Y.; Fu, W.M. The genus Codonopsis (Campanulaceae): A review of phytochemistry, bioactivity and quality control. J. Nat. Med. 2015, 69, 1–22. [Google Scholar] [CrossRef] [PubMed]
  7. He, J.Y.; Zhu, S.; Goda, Y.; Cai, S.Q.; Komatsu, K. Quality evaluation of medicinally-used Codonopsis species and Codonopsis Radix based on the contents of pyrrolidine alkaloids, phenylpropanoid and polyacetylenes. J. Nat. Med. 2014, 68, 326–339. [Google Scholar] [CrossRef] [PubMed]
  8. Jiang, Y.P.; Liu, Y.F.; Guo, Q.L.; Shi, J.G. C14-polyacetylenol glycosides from the roots of Codonopsis pilosula. J. Asian Nat. Prod. Res. 2015, 17, 1166–1179. [Google Scholar] [CrossRef] [PubMed]
  9. Yang, C.X.; Gou, Y.Q.; Chen, J.Y.; An, J.; Chen, W.X.; Hu, F.D. Structural characterization and antitumor activity of a pectic polysaccharide from Codonopsis pilosula. Carbohydr. Polym. 2013, 98, 886–895. [Google Scholar] [CrossRef] [PubMed]
  10. He, J.Y.; Zhu, S.; Komatsu, K. HPLC/UV analysis of polyacetylenes, phenylpropanoid and pyrrolidine alkaloids in medicinally used Codonopsis species. Phytochem. Anal. 2014, 25, 213–219. [Google Scholar] [CrossRef] [PubMed]
  11. Li, X.Z.; Cheng, L.Z.; Yan, Y.M.; Liu, B.H.; Cheng, Y.X. SIRT1 inhibitory compounds from the roots of Codonopsis pilosula. J. Asian Nat. Prod. Res. 2018. [Google Scholar] [CrossRef]
  12. Ishimaru, K.; Sadoshima, S.; Neera, S.; Koyama, K.; Takahashi, K.; Shimomura, K. A polyacetylene gentiobioside from hairy roots of Lobelia inflata. Phytochemistry 1992, 31, 1577–1579. [Google Scholar] [CrossRef]
  13. Ishimaru, K.; Yonemitsua, H.; Shimomura, K. Lobetyolin and lobetyol from hairy root culture of Lobelia inflata. Phytochemistry 1991, 30, 2257–2259. [Google Scholar] [CrossRef]
  14. Ishimaru, K.; Osabe, M.; Yan, L.; Fujioka, T.; Mihashi, K.; Tanaka, N. Polyacetylene glycosides from Pratia nummularia cultures. Phytochemistry 2003, 62, 643–646. [Google Scholar] [CrossRef]
  15. Chao, C.H.; Juang, S.H.; Chan, H.H.; Shen, D.Y.; Liao, Y.R.; Shih, H.C.; Huang, C.H.; Cheng, J.C.; Chen, F.A.; Hung, H.Y.; et al. UV-guided isolation of polyynes and polyenes from the roots of Codonopsis pilosula. RSC Adv. 2015, 5, 41324. [Google Scholar] [CrossRef]
  16. Xu, K.; Yang, P.F.; Yang, Y.N.; Feng, Z.M.; Jiang, J.S.; Zhang, P.C. Direct assignment of the threo and erythro configurations in polyacetylene glycosides by 1H-NMR spectroscopy. Org. Lett. 2017, 19, 686–689. [Google Scholar] [CrossRef] [PubMed]
  17. Aida, W.; Ohtsuki, T.; Li, X.F.; Ishibashi, M. Isolation of new carbamate- or pyridine-containing natural products, fuzanins A, B, C and D from Kitasatospora sp. IFM10917. Tetrahedron 2009, 65, 369–373. [Google Scholar] [CrossRef]
  18. Nagamine, T.; Yoshida, H.; Komae, K. Varietal differences and chromosome locations of multiple isoforms of starch branching enzyme in wheat endosperm. Phytochemistry 1997, 46, 23–26. [Google Scholar] [CrossRef]
  19. Shi, Y.N.; Tu, Z.C.; Wang, X.L.; Yan, Y.M.; Fang, P.; Zuo, Z.L.; Hou, B.; Yang, T.H.; Cheng, Y.X. Bioactive compounds from the insect Aspongopus chinensis. Bioorg. Med. Chem. Lett. 2014, 24, 5164–5169. [Google Scholar] [CrossRef] [PubMed]
  20. Liu, Y.L.; Lin, L.C.; Tung, Y.T.; Ho, S.T.; Chen, Y.L.; Lin, C.C.; Wu, J.H. Rhododendron oldhamii leaf extract improves fatty liver syndrome by increasing lipid oxidation and decreasing the lipogenesis pathway in mice. Int. J. Med. Sci. 2017, 14, 862–870. [Google Scholar] [CrossRef] [PubMed]
Sample Availability: Samples of the compounds 13 are available from the authors.
Figure 1. The structures of the compounds choushenpilosulynes A–C (13) from Codonopsis pilosula.
Molecules 23 00887 g001
Figure 2. Key COSY and HMBC correlations for 13.
Molecules 23 00887 g002
Figure 3. Cytotoxicity of compounds 13 in HepG2 cells was measured using the MTT assay. Statistical analysis was performed using a one-way analysis of the variance (ANOVA) followed by Bonferroni’s multiple comparison tests. All error bars are S.E.M (A). Change in the mRNA expression level of the SQLE gene in cells treated at different concentrations. The transcription level of SQLE gene was normalized by an internal CD36 mRNA control. The data are expressed as the mean ± S.E.M (n = 3). * p < 0.05 vs. control (B).
Molecules 23 00887 g003
Table 1. 1H- (600 MHz) and 13C-NMR (150 MHz) data of 1 in CDCl3 (δ in ppm, J in Hz).
PositionδHδC δHδC
14.07, m63.5 t5′1.26, overlap29.2 a d
21.74, m27.9 t6′1.26, overlap29.4 a d
32.16, m28.7 t7′1.26, overlap29.6 a d
45.87, dt (15.6, 6.4)137.2 d8′1.26, overlap29.7 a d
55.39, dd (15.6, 7.2)125.4 d9′1.26, overlap29.6 a d
64.22, t (6.5)81.1 d10′1.26, overlap29.7 a d
74.40, d (6.5)65.5 d11′1.26, overlap29.7 a d
8 79.1 s12′1.26, overlap29.7 a d
9 71.3 s13′1.26, overlap29.7 a d
10 77.8 s14′1.26, overlap31.8 t
11 71.7 s15′1.29, overlap22.7 t
125.50, dd (15.7, 1.2)109.7 d16′0.88, t (6.9)14.2 q
136.31, dq (15.7, 7.0)144.3 s1″4.32, d (7.8) b99.0 d
141.81, d (7.0)18.9 q2″3.47, m73.1 d
1′ 174.1 s3″3.23, m75.6 d
2′2.29, t (7.6)34.4 t4″3.62, m68.8 d
3′1.61, m25.0 d5″3.50, m76.2 d
4′1.29, m29.7 a t6″3.84, m60.2 t
a These signals can be exchangeable. b Observed in methanol-d4.
Table 2. 1H- (600 MHz) and 13C-NMR (150 MHz) data of 2 in CDCl3 (δ in ppm, J in Hz).
PositionδHδC δHδC
13.63, m61.6 t5′1.26, overlap29.3 a d
21.69, m31.2 t6′1.26, overlap29.4 a d
32.20, m28.7 t7′1.26, overlap29.6 a d
45.84, dt (15.5, 6.5)137.8 d8′1.26, overlap29.7 a d
55.46, dd (15.5, 7.5)125.2 d9′1.26, overlap29.8 a d
64.18, t (6.7)81.7 d10′1.26, overlap29.7 a d
74.42, d (6.7)65.6 d11′1.26, overlap29.7 a d
8 79.2 s12′1.26, overlap29.7 a d
9 70.8 s13′1.26, overlap29.7 a d
10 77.7 s14′1.26, overlap31.8 t
11 71.8 s15′1.30, overlap22.7 t
125.51, d (15.6)109.5 d16′0.88, t (6.9)14.1 q
136.32, dq (15,7, 6.7)144.3 s1″4.32, d (7.8) b99.3 d
141.81, d (6.7)18.9 q2″3.47, m73.1 d
1′ 174.5 s3″3.23, m73.9 d
2′2.35, t (7.5)34.2 t4″3.62, m70.4 d
3′1.62, m24.9 d5″3.50, m76.1 d
4′1.31, m29.4 a t6″Ha 4.37, m Hb 4.23, m63.5 t
a These signals can be exchangeable. b J was observed in methanol-d4.
Table 3. 1H- (400 MHz) and 13C-NMR (150 MHz) data of 3 in methanol-d4 (δ in ppm, J in Hz).
PositionδHδC δHδC
14.10, t (6.4)61.6 t5′1.26, overlap30.8 a d
21..75, m29.1 t6′1.26, overlap30.8 a d
32.17, m30.2 t7′1.26, overlap30.8 a d
45.80, dt (15.5, 6.4)134.2 d8′1.26, overlap30.8 a d
55.57, overlap130.3 d2′2.35, t (7.5)35.1 t
63.99, t (6.7)81.6 d3′1.61, m26.1 d
74.21, d (6.7)67.7 d4′1.29, m29.4 a t
8 78.0 s9′1.29, overlap30.8 a d
9 71.3 s10′1.29, overlap30.7 a d
10 76.5 s11′1.29, overlap30.6 a d
11 72.6 s12′1.29, overlap30.5 a d
125.57, overlap110.6 d13′1.29, overlap30.4 a d
136.32, dq (15.7, 6.8)145.1 s14′1.29, overlap33.1 t
141.81, d (6.1)18.9 q15′1.29, overlap23.8 t
1′ 175.6 s16′0.90, t (6.9)14.5 q
a These signals can be exchangeable.

