Article

Comparative Chloroplast Genome Analysis of Rhubarb Botanical Origins and the Development of Specific Identification Markers

1
College of Pharmacy, Hubei University of Chinese Medicine, Wuhan 430065, China
2
Hubei Institute for Drug Control, Wuhan 430012, China
*
Authors to whom correspondence should be addressed.
Molecules 2018, 23(11), 2811; https://doi.org/10.3390/molecules23112811
Submission received: 15 September 2018 / Revised: 21 October 2018 / Accepted: 27 October 2018 / Published: 30 October 2018

Abstract

:
Rhubarb is an important ingredient in traditional Chinese medicine known as Rhei radix et rhizome. However, this common name refers to three different botanical species with different pharmacological effects. To facilitate the genetic identification of these three species for their more precise application in Chinese medicine we here want to provide chloroplast sequences with specific identification sites that are easy to amplify. We therefore sequenced the complete chloroplast genomes of all three species and then screened those for suitable sequences describing the three species. The length of the three chloroplast genomes ranged from 161,053 bp to 161,541 bp, with a total of 131 encoded genes including 31 tRNA, eight rRNA and 92 protein-coding sequences. The simple repeat sequence analysis indicated the differences existed in these species, phylogenetic analyses showed the chloroplast genome can be used as an ultra-barcode to distinguish the three botanical species of rhubarb, the variation of the non-coding regions is higher than that of the protein coding regions, and the variations in single-copy region are higher than that in inverted repeat. Twenty-one specific primer pairs were designed and eight specific identification sites were experimentally confirmed that can be used as special DNA barcodes for the identification of the three species based on the highly variable regions. This study provides a molecular basis for precise medicinal plant selection, and supplies the groundwork for the next investigation of the closely related Rheum species comparing and correctly identification on these important medicinal species.

1. Introduction

Rheum (Polygonaceae), a genus containing eight sections and ~60 herbaceous species, is widely distributed in Asia, especially in the temperate and subtropical high mountainous regions [1]. Rhubarb (Rhei radix et rhizome), an important multi-origin traditional Chinese medicine, was first recorded in the Shennong Herbal Classic as Jun Yao due to its efficacy as an analgesic and anti-inflammatory, effective at clearing heat, removing toxicity, and improving blood stasis [2]. Modern pharmacology research suggests that rhubarb also exhibits anticancer, antiviral, hypotensive, and immune system regulatory effects [3]. At present, R. palmatum, R. tanguticum, and R. officinale are considered the legal species to be used to produce Rhei radix et rhizome, as recorded in the Chinese Pharmacopoeia 2015 edition.
In past reports, researchers have mainly focused on the extraction of bioactive components, chemistry, or pharmacology properties. However, as a typical multi-origin medicine, the composition of each pharmacological product is different with regard to the three Rheum species and its effect thus variable [4]. The source of the species plays a decisive role in the chemical composition of rhubarb [5]. The difference between the three rhubarb plants mainly lies in the degree of leaf division, whereby R. officinale leaves are lobed and broad triangular, the R. palmatum leaves are lobed and triangular, and R. tanguticum leaves are parted and lanceolate [6], The methods that have long served to identify rhubarb medicinal materials mainly adopt trait identification, microscopic identification, physical and chemical identification, but these methods depend on experience, their subjectivity is strong, and it is hard to distinguish between processed products and powders [7]. It is particularly important to accurately identify the species of rhubarb. Some scholars have used the trnL-trnF sequences of 13 species of the genus Rheum to analyze and design specific primer pairs for the identification of different botanical species of rhubarb [8]. psbA-trnH has also been used to distinguish rhubarb from the other 19 related Polygonaceae species [9]. The gene sequences of matK showed potential for the distinction of different Rheum sections [10]. From the results of the identification efficiency analysis, the identification success rate of trnH-trnF for Rheum is 84%, and the success rate for matK identification is 83.7%, indicating that the identification efficiency of the chloroplast genes is significantly higher than that of nuclear sequences, such as ITS2, for Rheum. Therefore, the current method can identifyf closely related Rheum species only to a certain degree.
Chloroplasts are ubiquitous in plant cells and play important roles in plants to carry out photosynthesis and energy conversion. The chloroplast genome is independent of nuclear genes and is dominated by maternal inheritance. The chloroplast genome of most angiosperms consists of four parts: a pair of inverted repeats (IRA and IRB), a large single-copy region (LSC), and one small single-copy region (SSC) [11]. With the expansion and contraction of the IR region, the chloroplast genome size is approximately 120~160 kb [12]. Numerous scholars suggest that the whole chloroplast genome sequence is an ideal genomic barcode because the genome size is moderate, the intraspecific sequences are relatively conservative, the interspecies variation is large, and the substitution rate is lower than nuclear genes but higher than mitochondrial genes [13].
In the present study, the chloroplast DNA of three different botanical species of rhubarb, the famous Chinese medicinal herb, were utilized. After assembly and annotation, the characteristics of the chloroplast genome were analyzed and the identification of a few specific short sequences which are easy to amplify and which contain identification sites to distinguish the study species. The current study laid the foundation of super barcode utilization in rhubarb, provided a molecular basis for precise medicinal plant selection, and supplied the groundwork for the next investigation of the closely related Rheum species comparing and correctly identification on these important medicinal species.

2. Results

2.1. Chloroplast Genome Features

The chloroplast genomes ranged from 161,053 bp (R. tanguticum) to 161,541 bp (R. palmatum) in length, and the chloroplast genomes of the three species shared the same GC content, 37.3%, which is similar to the reported chloroplast genome of angiosperms [14]. The GC content of the IR region is higher than that of LSC and SSC. These genome sequences have been submitted to GenBank with accession number MH572012 for R. officinale, and MH572013 for R. tanguticum. The sequence of R. palmatum is similar to the published sequence with accession number KR816224 [15] (Table 1).
The chloroplast genome of Rheum was found to encode 131 predicted functional genes, including 92 protein-coding genes, 31 tRNA genes, and eight rRNA genes (Table 2). Among them, seven genes, trnL-TAG, trnI-GAT, rpl2, atpF, rpoC1, ndhA, and ndhB, contain one intron; two genes contain two introns (ycf3 and clpP); 18 genes have two copies; and one gene has three copies. Variation was observed among the different species; for example, trnL-TAG contains one intron in R. officinale, but none in R. palmatum and R. tanguticum.
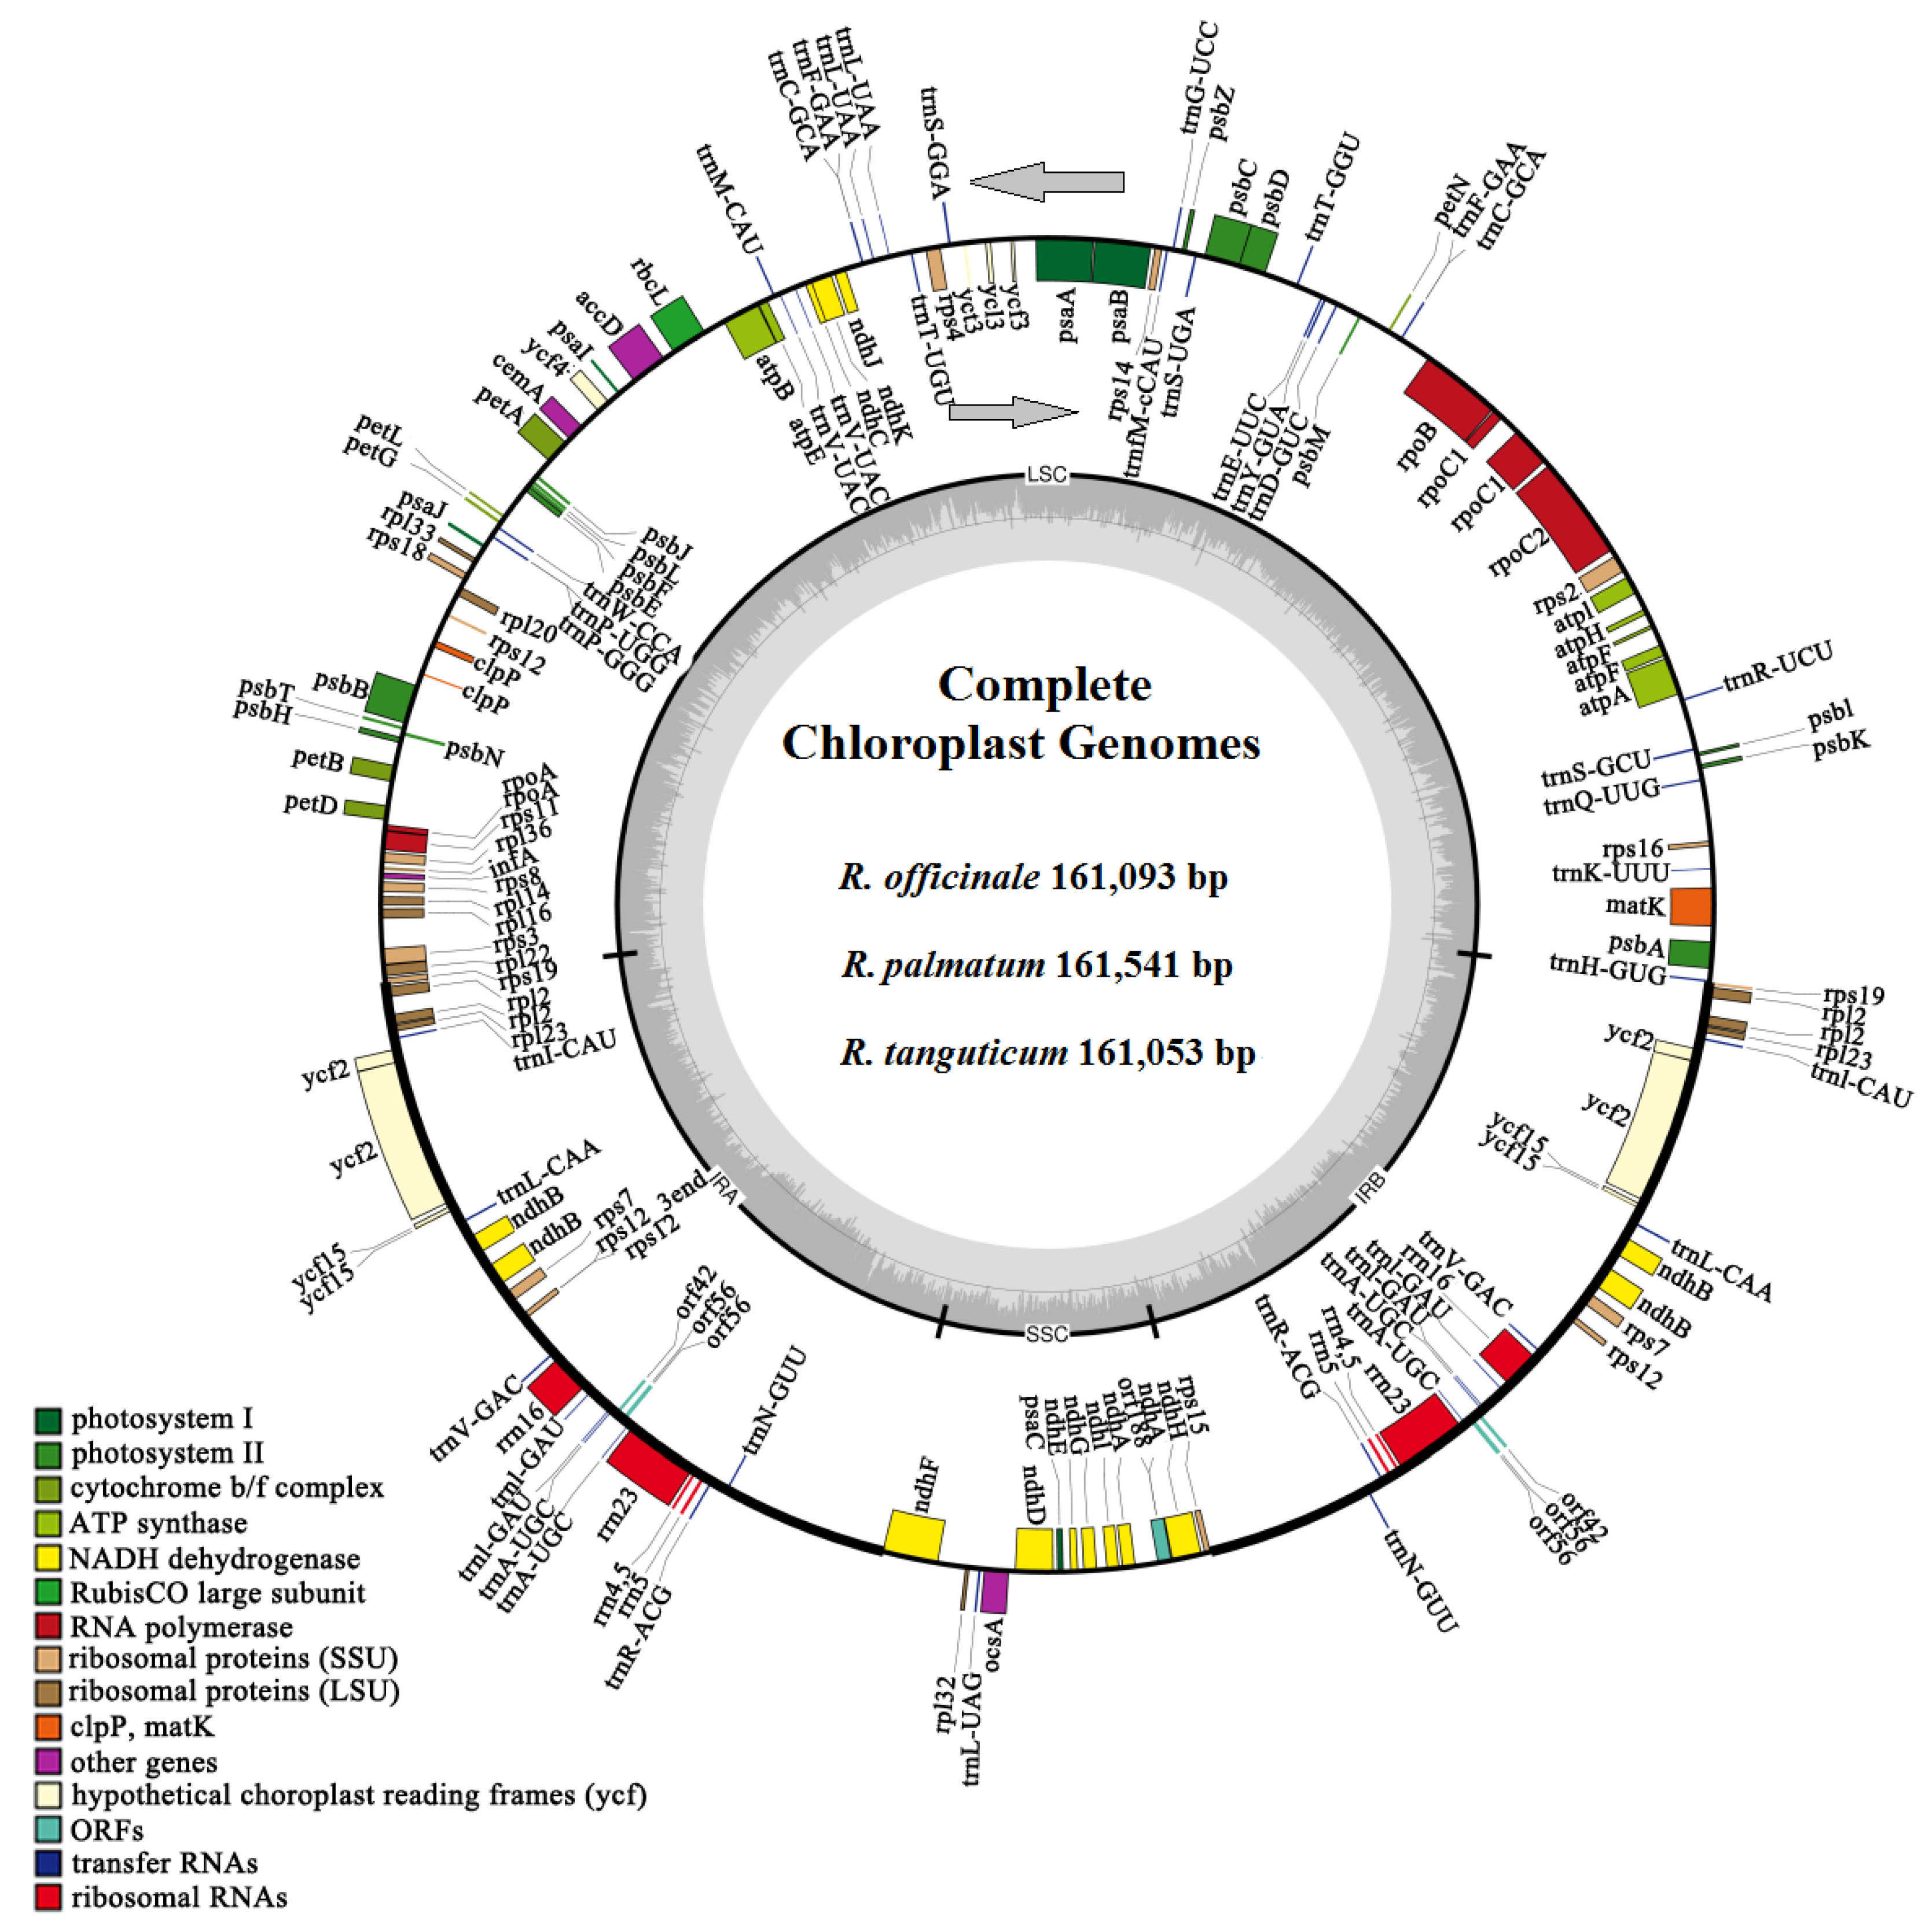
Among the three rhubarb species, the gene rps19 is distributed in the LSC and IRA regions, and the gene ndhF is distributed in the IRA and SSC regions. In the R. officinale chloroplast genome, 62 protein-coding genes and 20 tRNA genes are located in the LSC region, and 10 protein-coding genes and one tRNA gene are located in the SSC region. In the chloroplast genome of R. palmatum, 62 protein-coding genes and 18 tRNA genes are located in the LSC region, and 10 protein-coding genes and two tRNA genes are located in the SSC region. In the chloroplast genome of R. tanguticum, 62 protein-coding genes and 18 tRNA genes are located in the LSC region, and 10 protein-coding genes and one tRNA gene are located in the SSC region. The chloroplast genes of the three species have a typical quadripartite structure (Figure 1).

2.2. Characterization of Simple Sequence Repeats

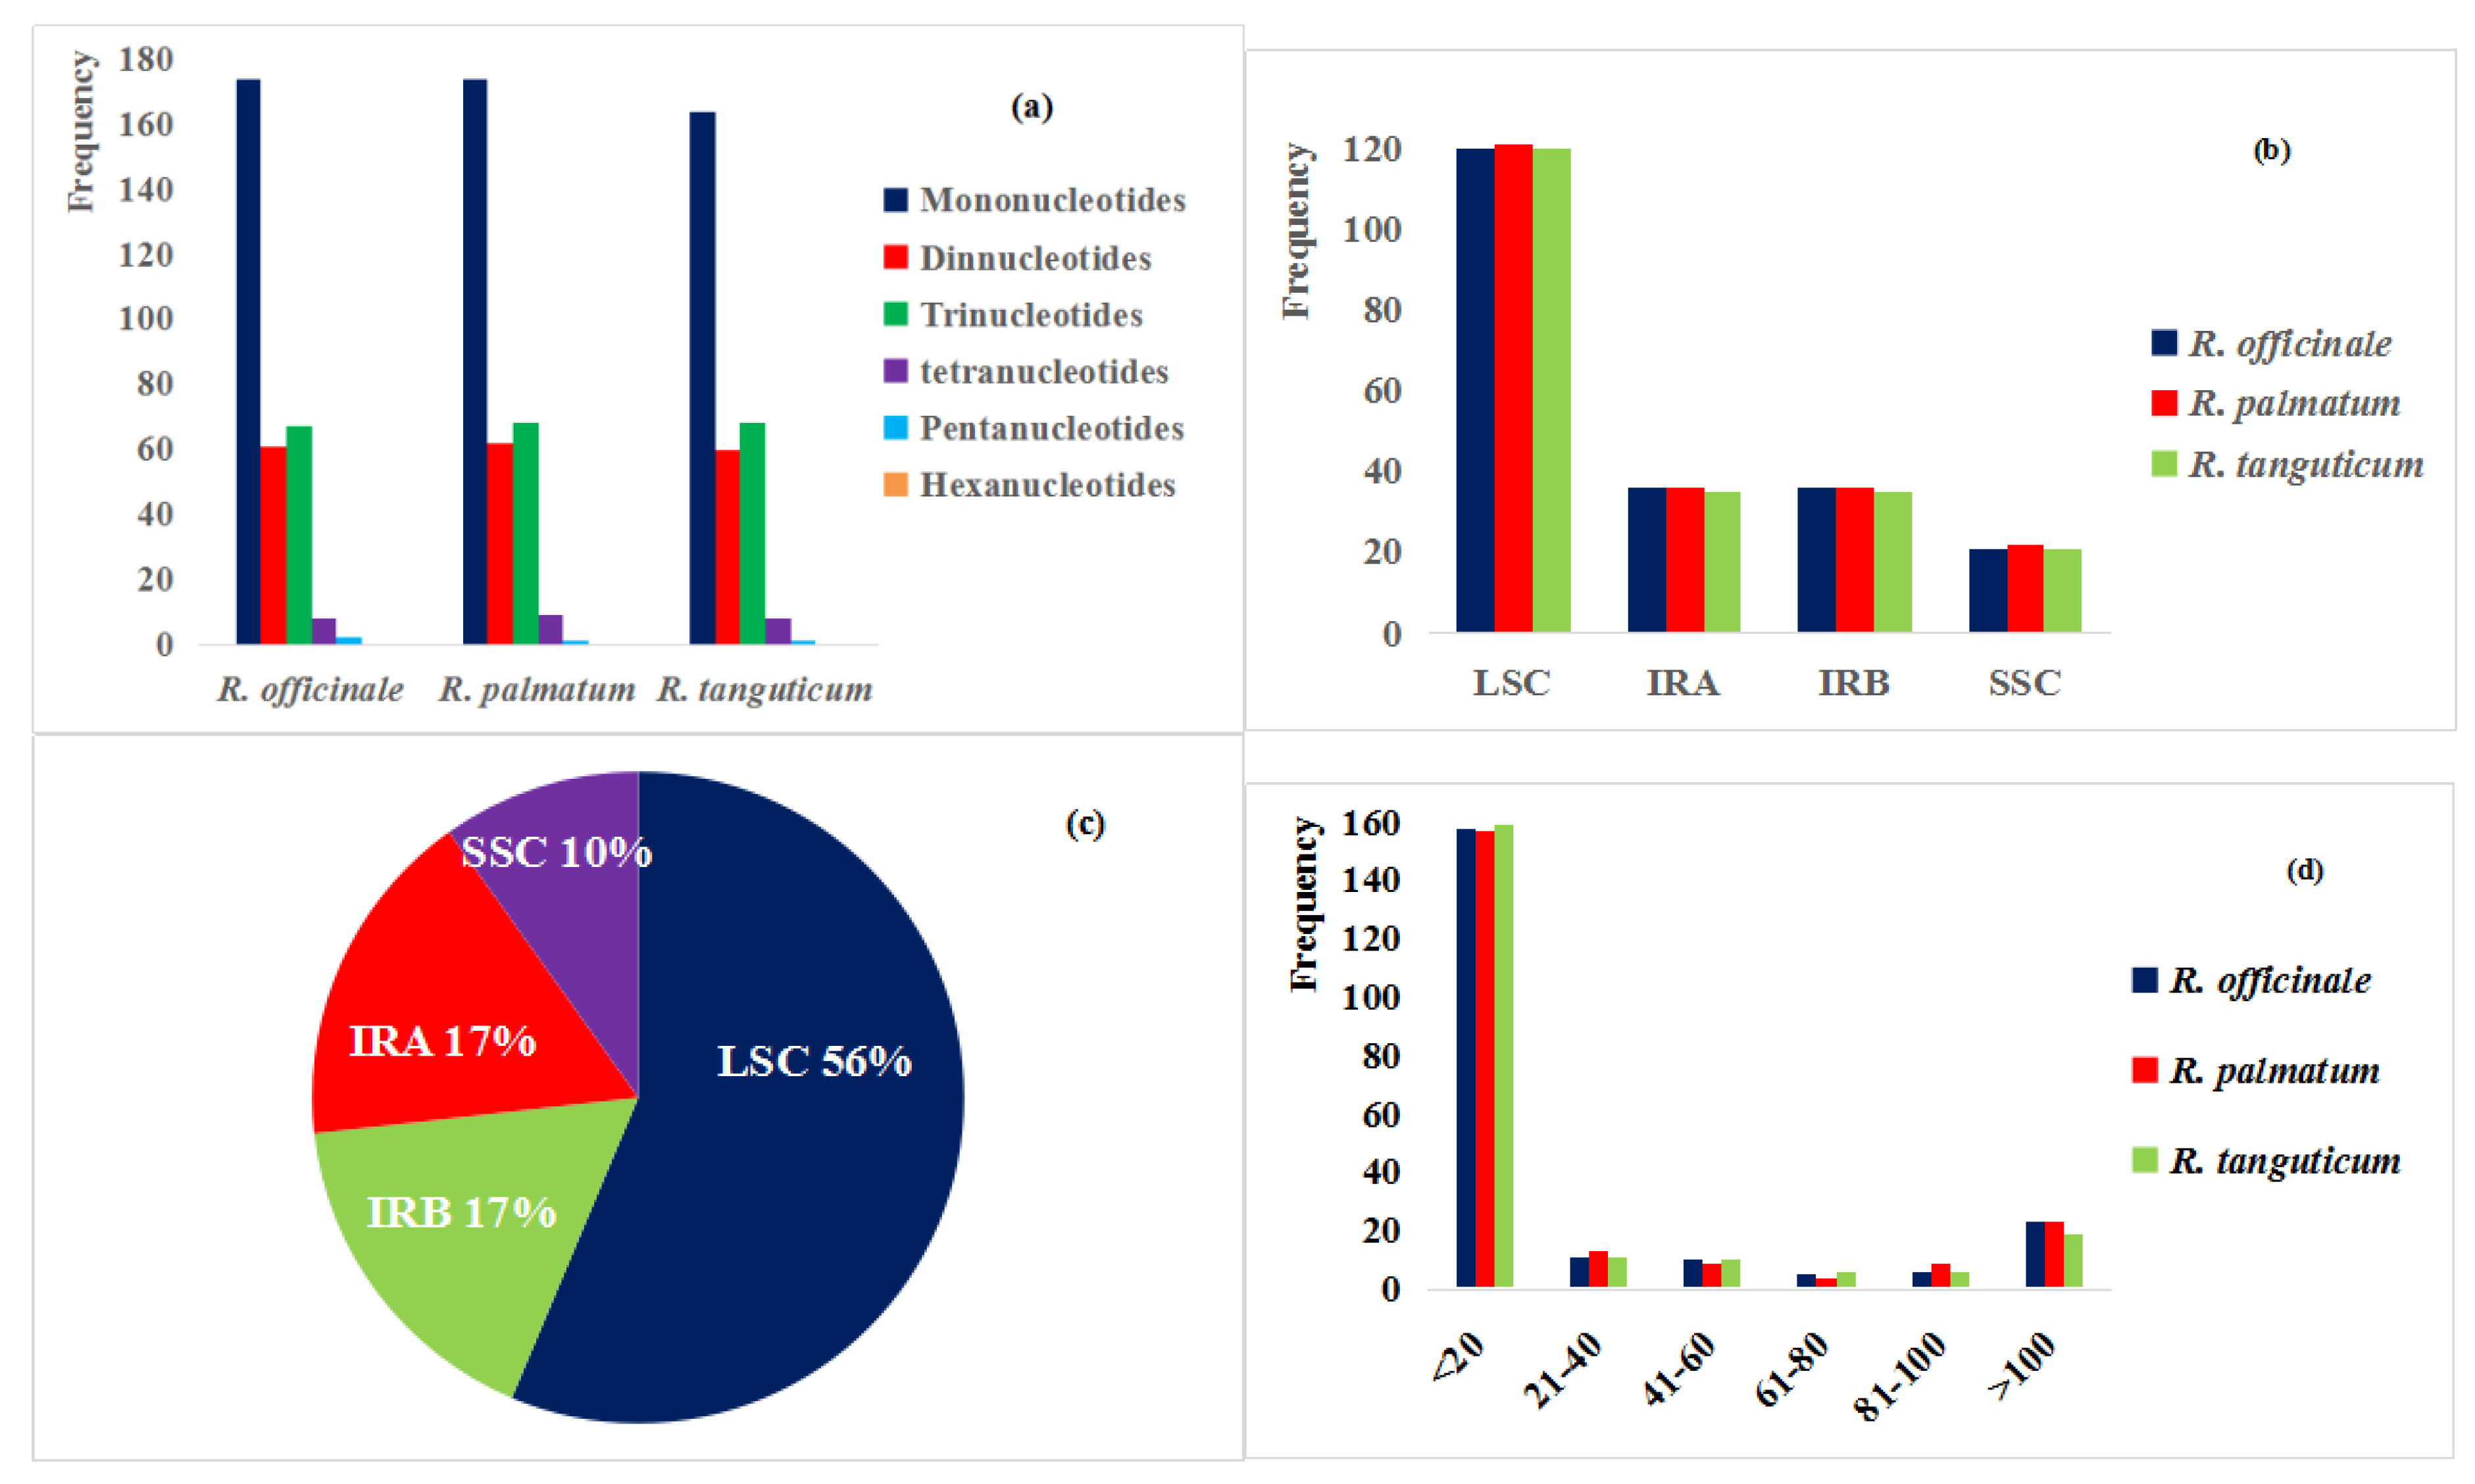
The distribution of repeated sequences and the presence of the SSRs in the chloroplast genomes of the three species were analyzed. Among the three species, SSRs of R. palmatum (314) and R. officinale (312) were larger than SSR of R. tanguticum (301). There were 512, 183, 203, 25, and four mono-, di-, tri-, tetra- and pentanucleotide SSRs, respectively. No hexanucleotides were found in the three species. Among all SSRs, mononucleotide repeats were the most common, accounting for 55.23% of the SSR population, of which 507 A/T accounted for 99.0% of mononucleotides. The number of mononucleotides (174) is the same in R. officinale and R. palmatum; R. palmatum and R. tanguticum contain the same number of trinucleotides (68) and Pentanucleotides (1); there are 8 tetranucleotides in R. officinale and R. tanguticum; the number of dinucleotides in R. officinale, R. palmatum and R. tanguticum were 61, 62, and 60, respectively (Figure 2a).The SSRs of the three Rheum plants are similar in number in the four regions (Figure 2b), but the percentage of SSR in the four regions is different (Figure 2c). These findings show that SSRs are not evenly distributed in the chloroplast genomes. The length of most SSRs were <20 bp (Figure 2d). The distribution of p-type SSRs with a length greater than 10 bp was analyzed by using R. officinale as the representative (Table 3). The repeated sequences were mostly distributed in the non-coding sequences (CNS): intergenic spacers and intron regions, but found in coding regions (CDS), such as rpoC2, petA, ycf2, ndhF, ndhG, matK, atpA, ndhD, and ycf1. There is a 10 bp SSR between petL and the CNS. The others were similar to that of R. officinale, and are displayed in Supplementary Tables S1 and S2.

2.3. Phylogenetic Analysis

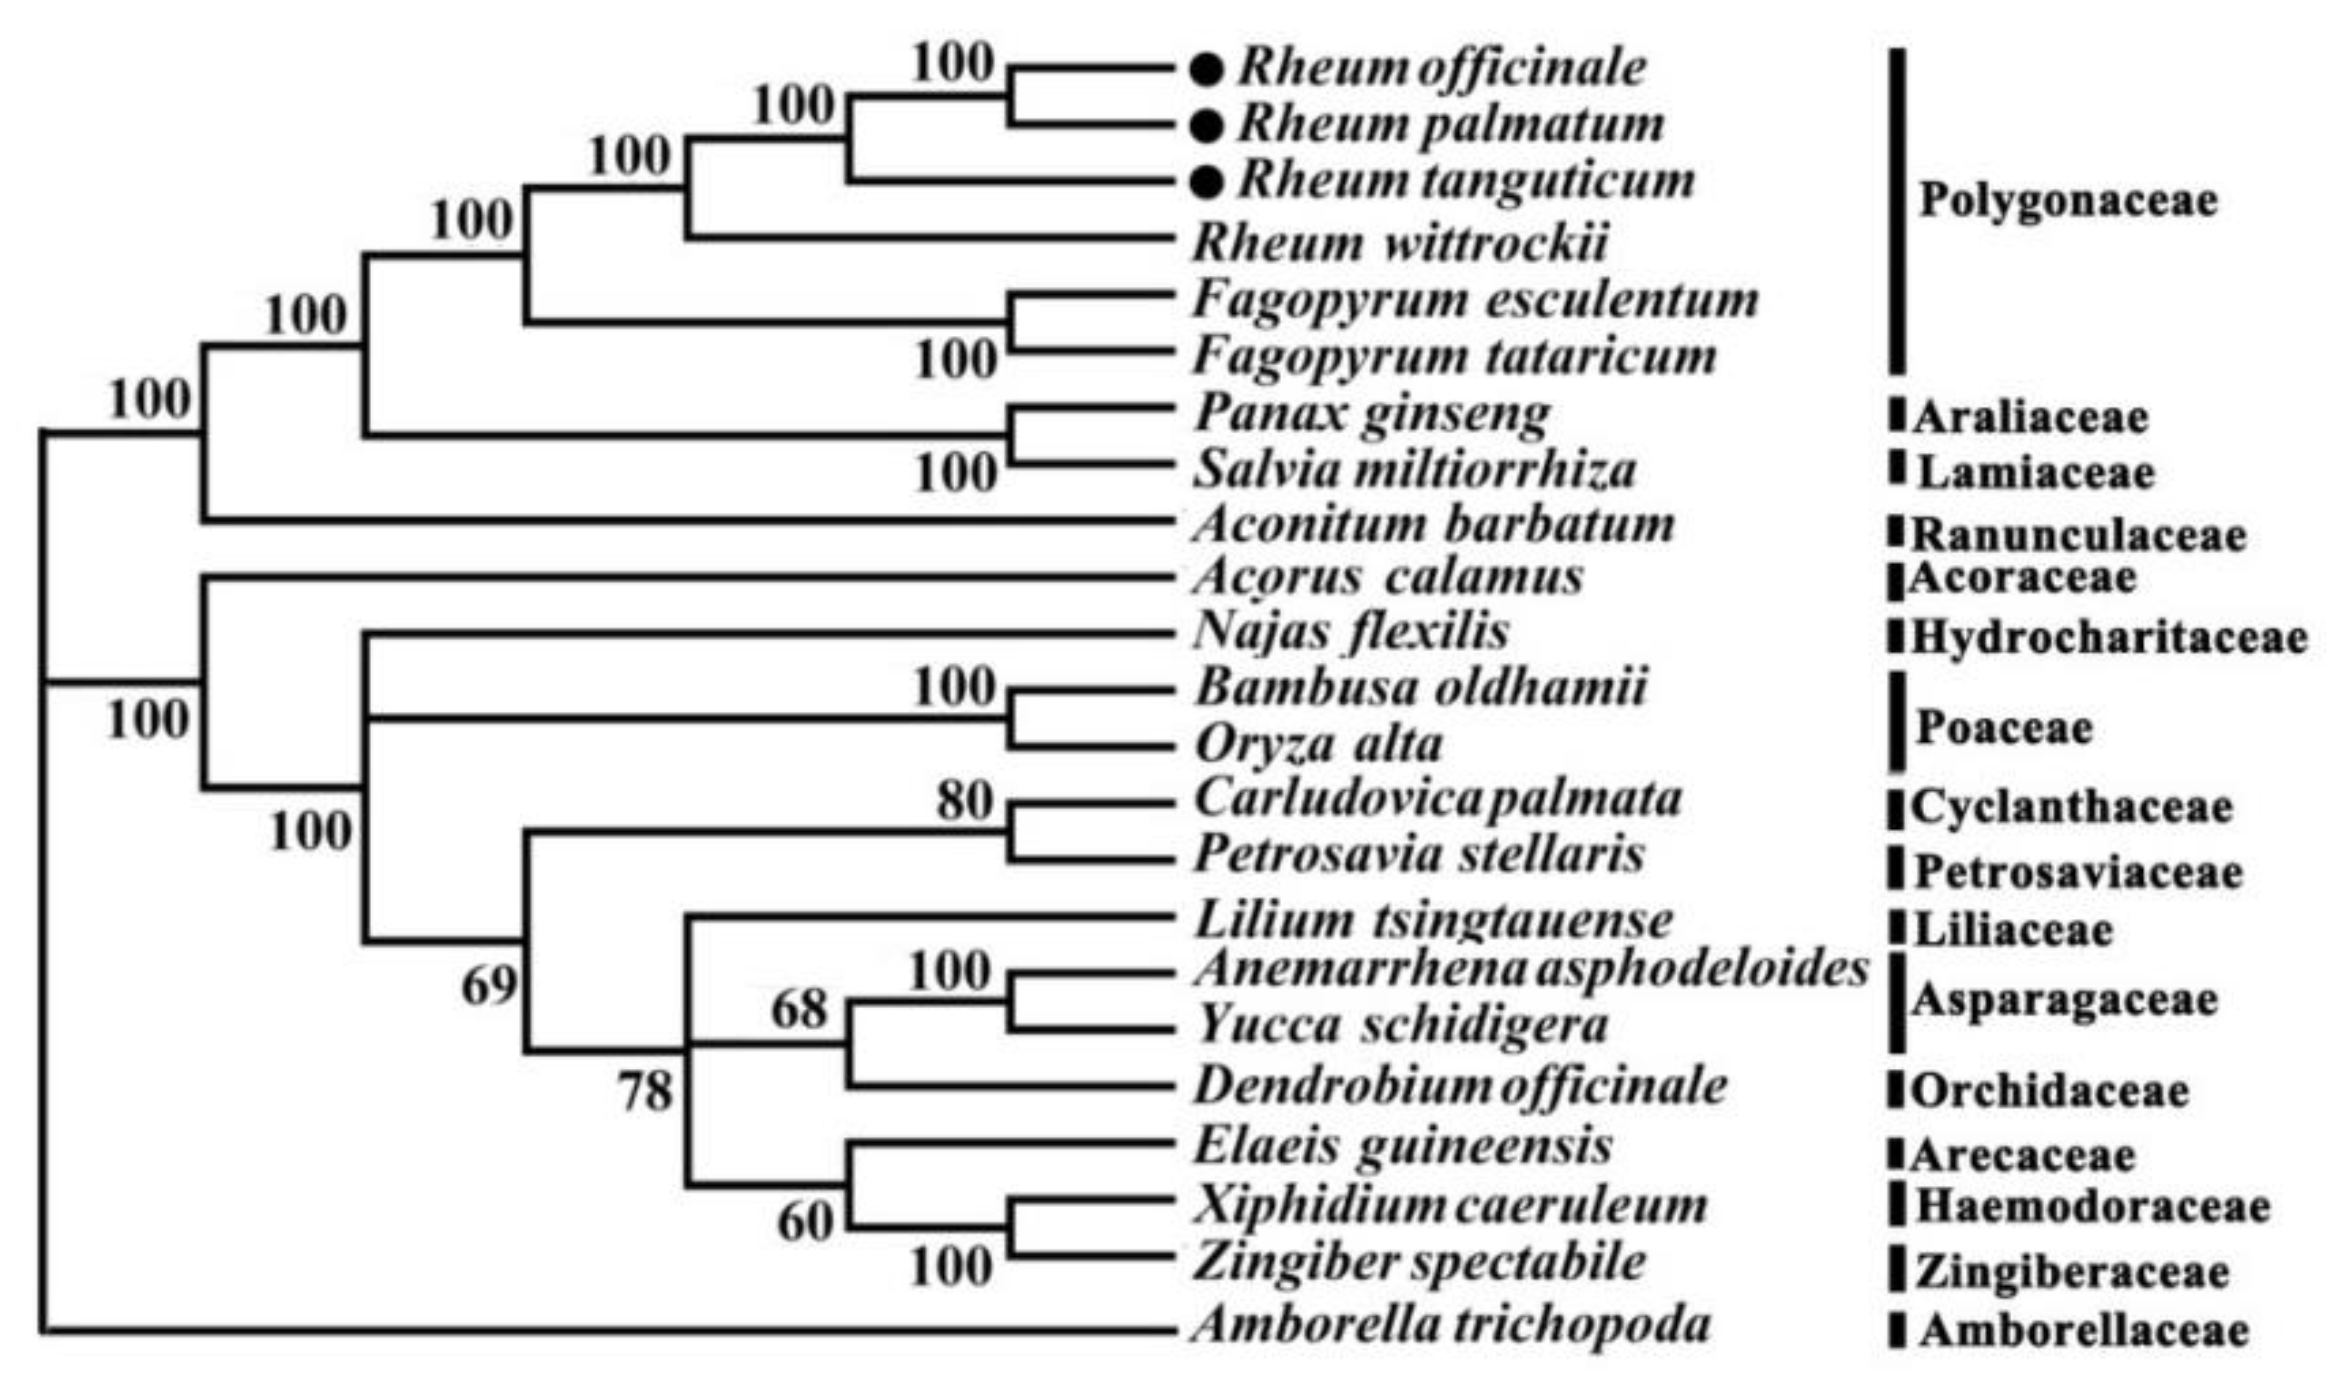
The phylogenetic relationships tree represents the results of a systematic study that can be used to describe the evolutionary relationships between species [16]. As can be seen from the neighbor joining tree, monocotyledons and dicotyledons were clustered together, and the support rate was 100%. Neighbor joining strongly supported the position of Fagopyrum esculentum and F. tataricum as a sister of the closely related species in the Polygonaceae.
The three species of rhubarb were clustered into a polytomy and Rheum wittrockii clustered together, indicating that despite the close relationship, the three species of rhubarb can be separated from each other via these regions (Figure 3). The chloroplast genome sequence provides a new method for the identification of Rheum.

2.4. Comparative Genomic and Candidate Identification Sequence Analysis

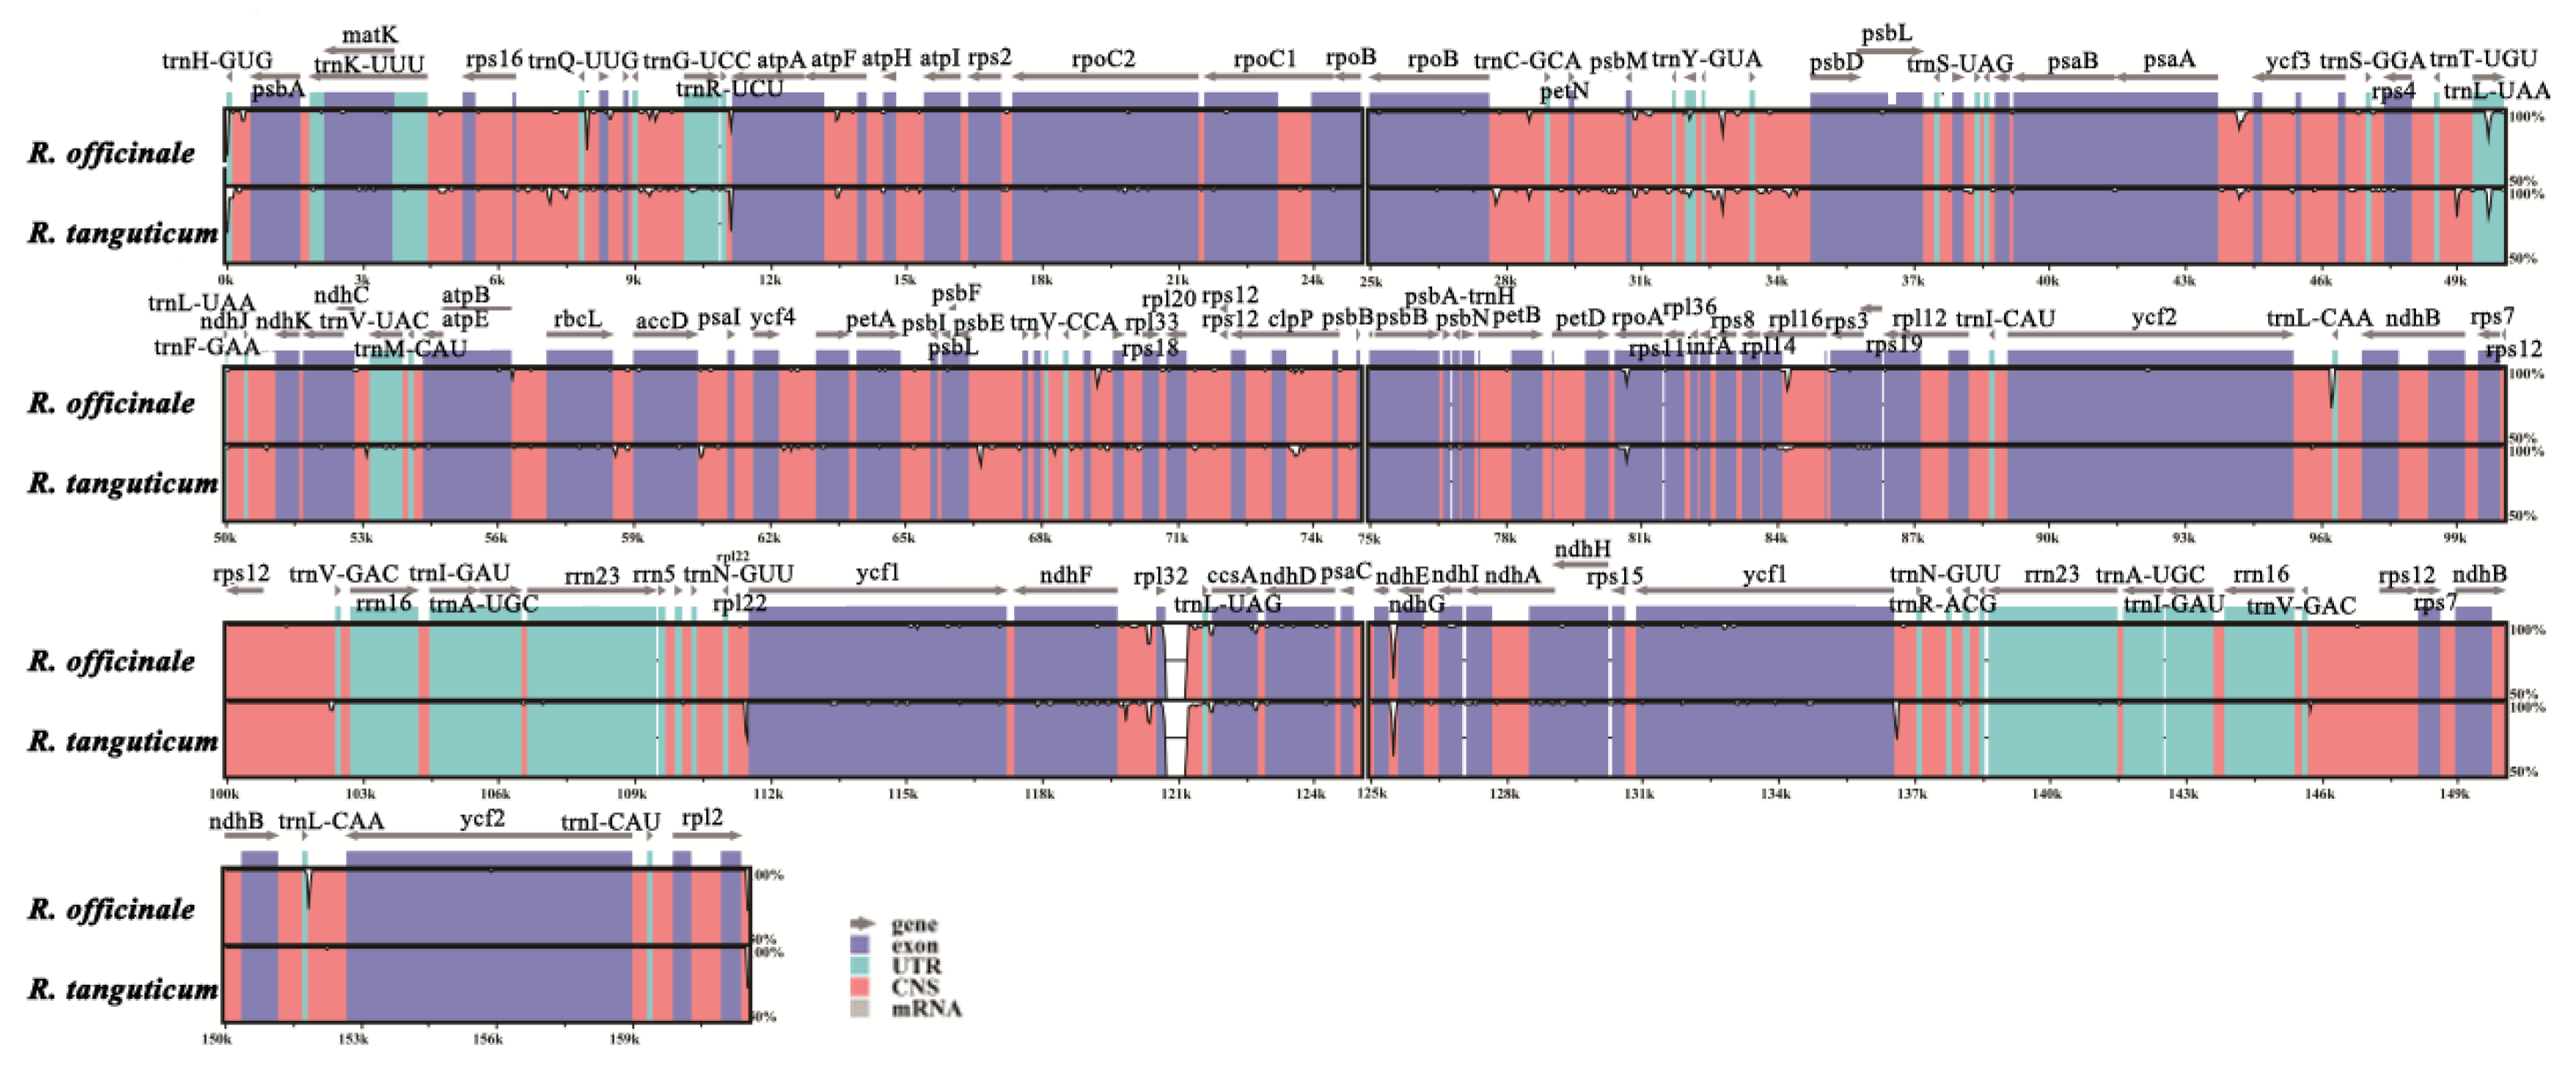
The mVISTA [17] software was used to compare and analyze the chloroplast genomes of the three studied species in Rheum, and R. palmatum was used as a reference sequence. Overall, the IR region is more conservative than LSC and SSC, and coding regions were more conserved than non-coding ones. The genetic differences of the three species are mainly concentrated in the intron and intergenic spacers, and are mostly presented in the form of base substitution. For example, the gene ycf3 and clpP both have two introns, while two sites are substituted in the ycf3 exon, and six sites are replaced in clpP. Intergenic spacers differences existed in the genes, such as psaA-ycf3, trnD-trnT, psbD-trnT, rpl16-rps3, and ccsA-ndhD. The gene accD and rpoC2 with two and eight base substitution, respectively, have no intron (Figure 4).
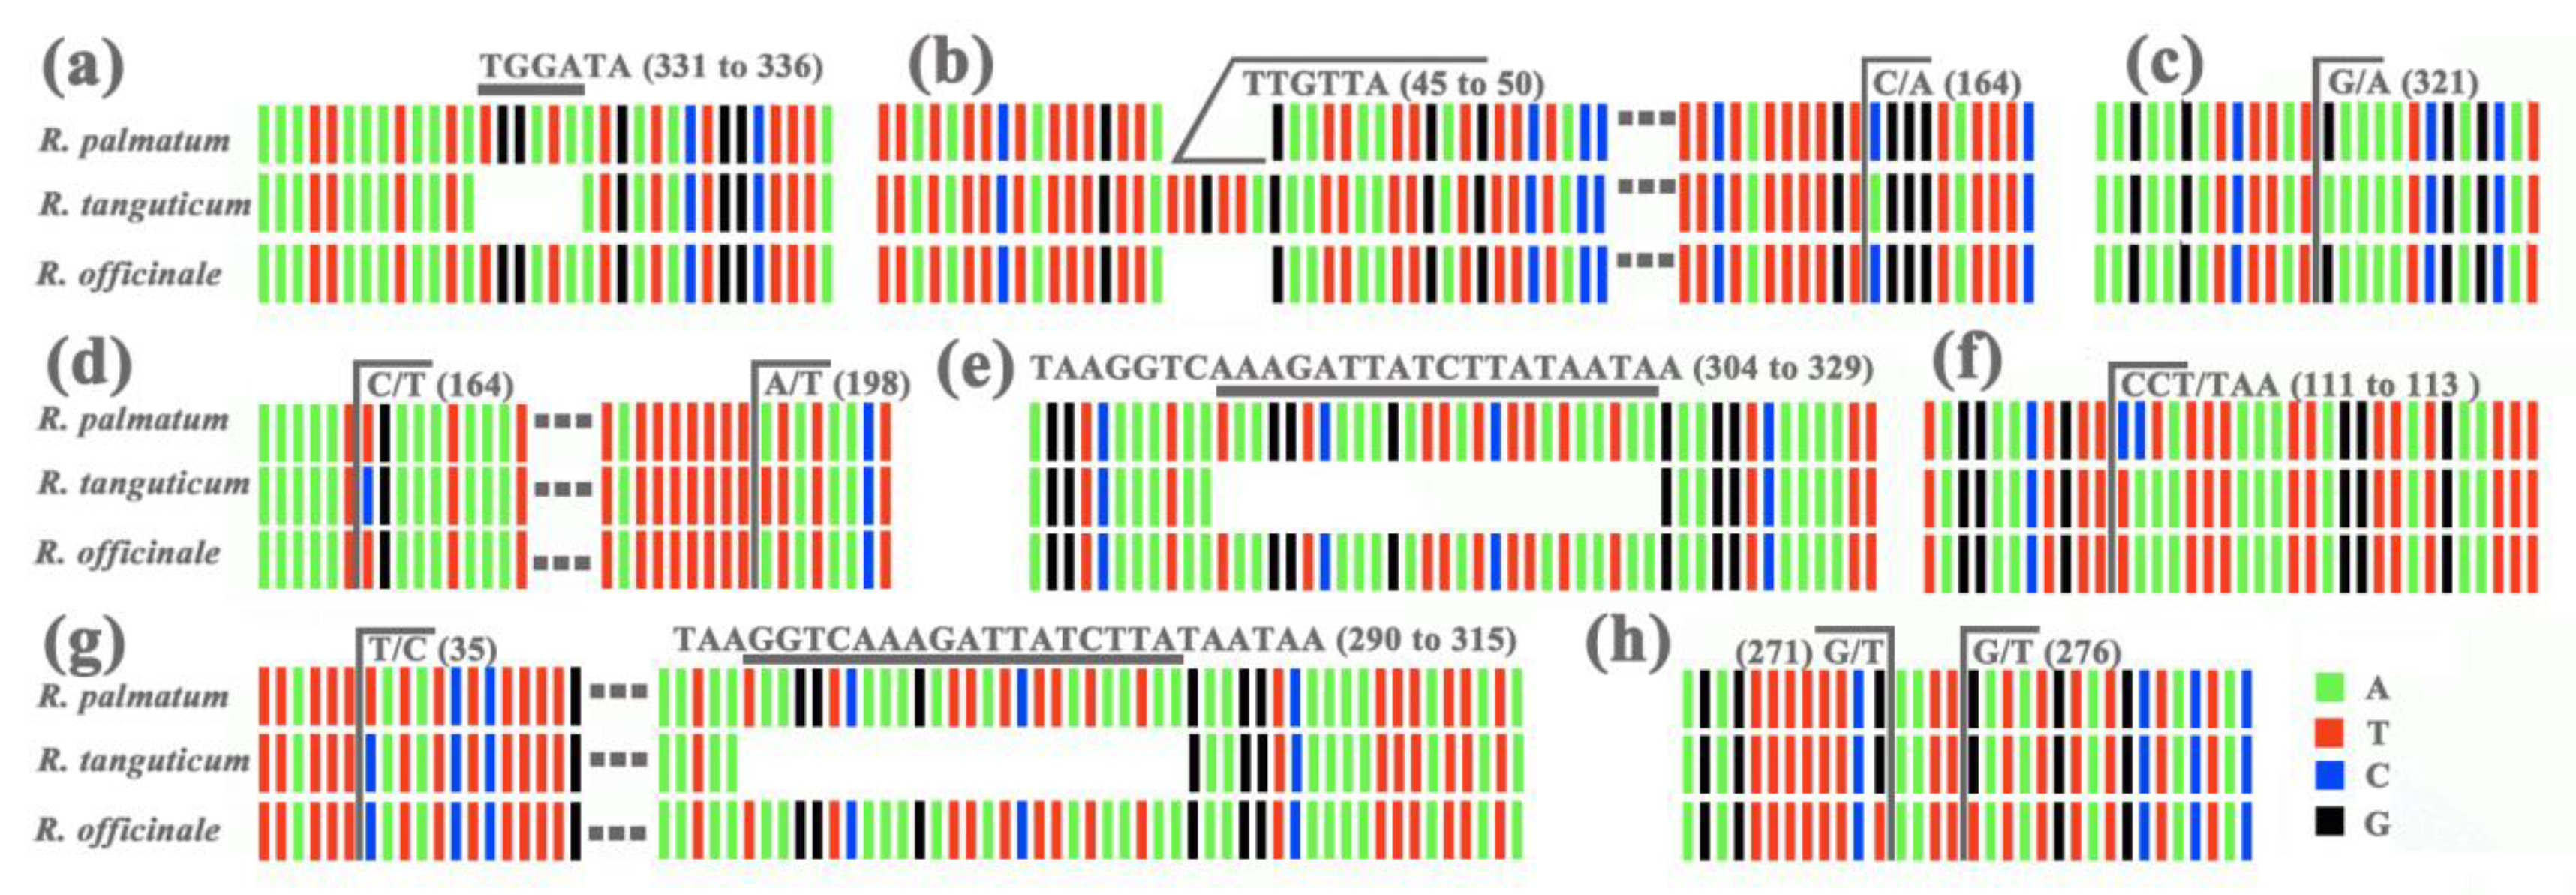
In order to distinguish these three species, reference to the chloroplast genome interspecific analysis, specific primer pairs were designed for the different regions, and the target fragments were amplified in the nearly one hundred samples (experiment with 30 samples of each species). Primer pair 1, used to amplify the trnD-trnT intergenic spacer region, can be employed to identify R. tangutum from the other two species because of its six bases deletion at 331 to 336 in the sequence alignment (Figure 5a). The intergenic spacer of PsaA-ycf3 amplified by Primer pair 7 can distinguish R. tangutum for the base insertion (from site 45 to 50) and the base substitution (C to A at 164) (Figure 5b). Primer pair 9 and primer pair 10 were used to amplify the genes rpoA and rpl16, respectively. SNPs were found at site 321 (G to A) in rpoA, as well as 164 (T to C) and 198 (A to T) in rpl16, which can also be used to distinguish R. tangutum (Figure 5c,d). Primer pair 15, amplified in the trnN-ycf1 intergenic spacer sequence, was also appropriate for the identification of R. tangutum due to the base deletion at 304 to 329 (Figure 5e). The region amplified by primer pair 17 has base substitutions from 111 to 113: CCT/TAA, so that it can be used to identify R. palmatum (Figure 5f). The amplified trnN-ycf1 intergenic spacer from primer pair 21 was very specific, with a C to T substitution at 35, which can be used to identify R. palmatum, and a 26 base deletion at the site 290 to 315, which can be used to identify R. tangutum (Figure 5g). The PsbD-trnT intergenic spacer amplified by primer pair 6 was used to identify R. officinale with base substitutions at 271 (G to T) and 276 (G to T) (Figure 5h). The three species can be distinguished based on the substitution and deletion of bases in the target fragment amplified by primer pair 21.

3. Discussion

At present, DNA barcoding technology relies on chloroplast loci [18], such as matK, rbcL, trnH-psbA, rpoB, rpoC1, atpF-atpH, psbK-psbI, ycf5, and trnL, and has been discussed in detail [19,20]. These traditional single chloroplast loci typically lack sufficient variation; phylogenetic analyses of these chloroplast regions at higher taxonomic levels are meaningful, but chloroplast loci are not generally suitable for lower taxonomic levels. Because of the inherent deficiencies of single-locus DNA barcoding, a new method needs to be found to identify closely related species [21]. It has recently been suggested that the complete chloroplast genome contains as many sites of variation as mitochondrial regions in animals and may be used as a plant DNA barcode [22]. The chloroplast genome is now considered a species-level DNA barcode because it can greatly improve plant phylogenetic and population genetic analyses, facilitating the recovery of lineages as monophyletic at lower taxonomic levels [23]. Using the chloroplast genome as a plant DNA barcode can prevent identification failures caused by gene deletion and low PCR amplification success rate, and it can also solve the problem of sequence retrieval encountered in traditional barcode research [24,25]. The sequencing costs and obtaining high-quality DNA were once the main challenges of the enrichment of the chloroplast ultra-barcode database [26], but these challenges have been overcome by next-generation sequencing (NGS) combined with other technologies [27]. Thus, neither extraction methods nor sequencing capacity can be considered limiting factors for obtaining chloroplast genome data [28]. Currently, whole chloroplast genomes have been used as super molecular markers for species identification and phylogenetic analysis of closely related plant species [18,29,30]; medicinal plants, such as Gynostemma pentaphyllum, have also been analyzed by using chloroplast genomes [31]. In the present study, three closely related Rheum species that cannot be accurately identified by traditional barcodes (single-locus and multi-locus barcodes) were analyzed. The size, number of annotated genes, and the number of simple sequence repeats of their chloroplast genomes were different, and the results of the corresponding phylogenetic analysis showed the genomes can be effectively used to distinguish among these closely related species (Figure 3). The results further suggested the potential use of the chloroplast genome as a super barcode for the identification of closely related species.
The ultimate goal of DNA barcoding is to distinguish species rather than find a universal marker (Li et al., 2015). It is very expensive to sequence the chloroplast genome for each species, but a single gene locus was not suitable at the species level due to its modest discriminatory power, so we sought mutational hotspots to design primer pairs that can be used to identify the three different botanical origins of rhubarb. The trnD-trnT intergenic spacer, psbD-trnT intergenic spacer, psaA-ycf3 intergenic spacer, rpl16-rps3 intergenic spacer, trnN-ycf1 intergenic spacer, ndhF-rpl32 intergenic spacer, trnN (GUU)-ycf1 intergenic spacer, rpoA, and rpl16 were found to have existing stable mutation sites that can be used for the identification of rhubarb botanical origins. Therefore, a DNA fragment having sufficiently high mutation rate and being easily amplified is sought to be able to recognize a species in a given taxonomic group. The chloroplast genome is an effective approach to differentiate closely related plants, including most of the multi-original herbal medicines.
In the Chinese Pharmacopoeia 2015 edition, about one-quarter of the Chinese traditional medicines have multiple origins, meaning they could be derived from different species. Thus, the accurate identification of the different botanical origins of these multi-origin Chinese traditional medicines has become a focus of attention in society. Correct identifications ensure the safety of clinical medications and the control of drug quality. The present study laid the foundation of super barcode utilization in rhubarb, providing a molecular basis for precision medication, and lays the groundwork for the next investigation on these important medicinal species. This research has also provided a reference on the identification of the botanical origin of multi-origin medicinals.

4. Materials and Methods

4.1. Plant Materials and DNA Extraction

Fresh leaves of the three different botanical species (R. officinale, R. palmatum, R. tangutum) for chloroplast genome sequencing were collected from Qinghai, Sichuan, and Gansu Province, China (Table 1). The silica gel dried samples used for specific markers screening were collected from Gansu, Guizhou, Hebei, Henan, Hubei, Jilin, Qinghai and Sichuan Province, and thirty samples were collected for each of the species. The voucher specimens were deposited at the Hubei Institute for Drug Control and identified by Professor Ling Xiao. Total genomic DNA was extracted from leaves with a modified cetyltrimethylammonium bromide (CTAB) method [32,33]. The concentration of DNA was estimated by measuring A260 and A280 using an ND-2000 spectrometer (Nanodrop Technologies, Wilmington, DE, USA), samples were also visually examined by 1% agarose 1× TAE gel electrophoresis.

4.2. Sequencing, Assembly, and Annotation

The DNA integrity and quantity were analyzed by 1% agarose gel electrophoresis, a NanoDrop 2000C Spectrophotometer (Thermo Scientific, Waltham, MA, USA), Qubit®2.0 Fluorometer (Invitrogen, Carlsbad, CA, USA), and Agilent 2100 Bioanalyzer (Agilent, Santa Clara, CA, USA). Then the DNA was randomly fragmented into ~300 bp long fragments using an ultrasonicator (Bioruptor Pico, Denville, NJ, USA). After the sequencing libraries were constructed according to the manufacturer’s protocols (NEBNext®UltraTMDNA Library Prep Kit for Illumina®, Beijing, China), sequencing was carried out on an Illumina HiSeq2000 high-throughput sequencer. The raw reads obtained were filtered using the NGS QC Toolkit [34], to omit the reads with more than 30% low quality bases (Q < 30) and those with more than 5% the amount of non-ATCG (N). The low quality regions of the reads were trimmed using trimmingReads.pl. Clean data were stored for next analysis. All the clean reads were collected as a pool for chloroplast genome assembly, and Geneious 9.1.4 (Biomatters Ltd., Auckland, New Zealand) [35] with BLAST 2.0.3+ (National Institutes of Health, Bethesda, MD, USA) [36] was employed to assemble the genomes. Four junctions between the inverted repeat (IR) and large single-copy/small single-copy (LSC/SSC) regions were confirmed by PCR amplification and Sanger sequencing.
DOGMA (available online: http://dogma.ccbb.utexas.edu/) [37] and CPGAVAS [38] were used for annotating the chloroplast genome to compare them between the three study species and further confirmation was performed using BLAST and DOGMA [37]. The tRNA genes were identified by tRNAscanSE [39]. Circular genome maps of the three different botanical origins of rhubarb were illustrated with the Organellar Genome DRAW tool [40]. The characteristics of chloroplast genomic sequences were determined using MEGA7 [41].

4.3. Identification of Repeated Sequences

Simple sequence repeats (SSR) and scattered repeats in all three species were also investigated. Simple sequence repeats were searched by MISA [42] with thresholds of 8, 4, 3, 3, 3, and 3 for mono-, di-, tri-, tetra-, penta-, and hexa-nucleotide, respectively. Scattered repeats were detected using the program REPuter [43] with parameters set as the similarity percentage of scattered repeat copies was at least 90%, hamming distance = 3, and the parameter of minimal repeat size was 30 bp.

4.4. Phylogenetic Reconstruction

In order to explore the phylogenic relationships of the three species, and to assess the identification efficiency of the chloroplast genomes, chloroplast genomes of Lilium tsingtauense (KU230438), Anemarrhena asphodeloides (KX931449), Najas flexiles (NC_021936), Elaeis guineensis (NC_017602), Zingiber spectabile (JX088661), Bambusa oldhamii (FJ970915), Carludovica palmate (NC_026786), Amborella trichopoda (NC_005086), Salvia miltiorrhiza (JX312195), Acorus calamus (AJ879453), Panax ginseng (KF431956), Oryza alta (KF359913), Fagopyrum esculentum (NC_010776.1), Dendrobium officinale (KJ862886), Yucca schidigera (NC_032714), Petrosavia stellaris (KF482381), Xiphidium caeruleum (JX088669), Aconitum barbatum (KT964698), Rheum wittrockii (NC_035950.1), and Fagopyrum tataricum (NC_027161.1), a total of 20 genome sequences, were downloaded from NCBI and aligned using ClustalW2 [44] and MAFFT [45]. Phylogenetic relationships were analyzed using the neighbor-joining method in MEGA 7.0.26 by a Poisson model for nucleotide sequence, with Poisson correction, pairwise deletion of gaps, and bootstrap analysis with 1000 replications. Amborella trichopoda was set as outgroup.

4.5. Candidate Identification Sequence Screening

Based on the whole genome sequences of the three chloroplasts, 21 pairs of primers toward the variable regions were designed for PCR amplification (Table S3). PCR amplification reactions were performed in a final volume of 25 μL. Each reaction mixture contained 10× PCR buffer 2.5 μL, 25 mM MgCl2 2 μL, 2.5 mM dNTP 2 μL, Taq (5 U/µL) 0.2 μL, forward primers (10 μM) 1 μL, reverse primers (10 μM) 1 μL, template DNA 2 μL, add water to 25 μL. The PCR protocol followed the profile of 95 °C for 4 min, 35 cycles of 94 °C for 30 s, 49 °C~55 °C for 1 min, and at 72 °C for 1 min; 72 °C for 10 min, and subsequent storage at 4 °C. Ninety silica gel dried samples from different localities were collected as the sequence screening samples. After the amplified products were detected by 1% agarose gel electrophoresis, the PCR products showing a single crisp band were purified by DNA product purification kit (Cat: D1300, Solarbio, Beijing, China), then they were bidirectionally sequenced by the ABI3730XL sequencer (Applied Biosystems Co., Shanghai, China). The peak maps obtained by sequencing were aligned using the CodonCode Aligner V3.7.1 (CodonCode Co., Centerville, MA, USA), and the primer regions and low-mass regions were removed to obtain candidate sequences for identification. Phylogenetic analyses were conducted to distinguish whether the candidate regions can be used to identify the three study species employing MEGA7 program (National Institutes of Health, Bethesda, MD, USA).

Supplementary Materials

The following are available online, Supplementary Table S1: R. palmatum chloroplast genome SSR distribution. Supplementary Table S2: R. tanguticum chloroplast genome SSR distribution. Supplementary Table S3: Primer pairs information used to distinguish among species identification candidate regions.

Author Contributions

Data curation, B.W.; Formal analysis, Y.Z.; Funding acquisition, B.W.; Methodology, Z.H. and B.W.; Project administration, B.W.; Software, B.W.; Writing—original draft, Y.Z.; Writing—review & editing, J.N., L.X. and B.W.

Funding

This work was supported by the National Science Foundation of China (81603246) and the fund of Hubei food and drug administration (2016010+29).

Acknowledgments

We are grateful to the Institute of Chinese Materia Medica China Academy of Chinese Medical Sciences and the Institute of Medicinal Plant Development for their assistance in collecting research samples.

Conflicts of Interest

The authors declare no conflict of interest.

References

  1. Sun, Y.; Wang, A.; Wan, D.; Wang, Q.; Liu, J. Rapid Radiation of Rheum (Polygonaceae) and Parallel Evolution of Morphological Traits. Mol. Phylogenet. Evol. 2012, 63, 150–158. [Google Scholar] [CrossRef] [PubMed]
  2. Yang, S.L.; Yang, Y. Textual Research of the Efficacy of Dahuang. Pharm. Clin. Chin. Mater. Med. 2018, 1, 46–47. [Google Scholar]
  3. Fu, X.-S.; Chen, F.; Liu, X.H.; Xu, H.; Zhou, Y.Z. Progress in Research of Chemical Constituents and Pharmacological Actions of Rhubarb. Chin. J. New Drugs 2011, 16, 1534–1539. [Google Scholar]
  4. Zhang, C.; Li, L.; Xiao, Y.Q.; Lin, N.; Liu, C.F.; Tian, G.F.; Chen, D.D. HPLC Simultaneous Determination of Two Anthraquinone-O-Glucosides in Different Botanical Origins of Rhubarb. Chin. J. Pharm. Anal. 2010, 1, 020. [Google Scholar]
  5. Komatsu, K.; Nagayama, Y.; Tanaka, K.; Ling, Y.; Cai, S.Q.; Omote, T.; Meselhy, M.R. Comparative Study of Chemical Constituents of Rhubarb from Different Origins. Chem. Pharm. Bull. 2006, 54, 1491–1499. [Google Scholar] [CrossRef] [PubMed] [Green Version]
  6. Wang, X.-M.; Hou, X.-Q.; Zhang, Y.-Q.; Li, Y. Morphological variation in leaf dissection of Rheum palmatum complex (polygonaceae). PLoS ONE 2014, 9, e110760. [Google Scholar] [CrossRef] [PubMed]
  7. Jiang, K. Identification of Rhubarb. Chin. Med. Mod. Distance Educ. China 2010, 8, 86. [Google Scholar]
  8. Yang, M.; Zhang, D.; Liu, J.; Zheng, J. A Molecular Marker That Is Specific to Medicinal Rhubarb Based on Chloroplast Trnl/Trnf Sequences. Planta Med. 2001, 67, 784–786. [Google Scholar] [CrossRef] [PubMed]
  9. Song, J.; Yao, H.; Li, Y.; Li, X.; Lin, Y.; Liu, C.; Han, J.; Xie, C.; Chen, S. Authentication of the Family Polygonaceae in Chinese Pharmacopoeia by DNA Barcoding Technique. J. Ethnopharmacol. 2009, 124, 434–439. [Google Scholar] [CrossRef] [PubMed]
  10. Yang, D.Y.; Fushimi, H.; Cai, S.Q.; Komatsu, K. Molecular Analysis of Rheum Species Used as Rhei Rhizoma Based on the Chloroplast Matk Gene Sequence and Its Application for Identification. Biol. Pharm. Bull. 2004, 27, 375–383. [Google Scholar] [CrossRef] [PubMed]
  11. Palmer, J.D. Comparative Organization of Chloroplast Genomes. Ann. Rev. Genet. 1985, 19, 325–354. [Google Scholar] [CrossRef] [PubMed]
  12. Wang, R.-J.; Cheng, C.-L.; Chang, C.-C.; Wu, C.-L.; Su, T.-M.; Chaw, S.-M. Dynamics and evolution of the inverted repeat-large single copy junctions in the chloroplast genomes of monocots. BMC Evol. Biol. 2008, 8, 36. [Google Scholar] [CrossRef] [PubMed]
  13. Li, X.; Gao, H.; Wang, Y.; Song, J.; Henry, R.; Wu, H.; Hu, Z.; Yao, H.; Luo, H.; Luo, K. Complete Chloroplast Genome Sequence of Magnolia Grandiflora and Comparative Analysis with Related Species. Sci. China Life Sci. 2013, 56, 189–198. [Google Scholar] [CrossRef] [PubMed]
  14. Jin, G.H.; Chen, S.; Yi, T.; Zhang, S. Characterization of the Complete Chloroplast Genome of Apple. Plant Divers. Resour. 2014, 36, 468–484. [Google Scholar]
  15. Fan, K.; Sun, X.J.; Huang, M.; Wang, X.M. The Complete Chloroplast Genome Sequence of the Medicinal Plant Rheum Palmatum L. (Polygonaceae). Mitogenome DNA Part A 2016, 27, 2935–2936. [Google Scholar]
  16. Raman, G.; Choi, K.; Park, S. Phylogenetic relationships of the fern Cyrtomium falcatum (dryopteridaceae) from dokdo island, sea of east Japan, based on chloroplast genome sequencing. Genes 2016, 7, 115. [Google Scholar] [CrossRef] [PubMed]
  17. Frazer, K.A.; Pachter, L.; Poliakov, A.; Rubin, E.M.; Dubchak, I. VISTA: Computational Tools for Comparative Genomics. Nucleic Acids Res. 2004, 32, W273–W279. [Google Scholar] [CrossRef] [PubMed]
  18. Dong, W.; Liu, J.; Yu, J.; Wang, L.; Zhou, S. Highly variable chloroplast markers for evaluating plant phylogeny at low taxonomic levels and for DNA barcoding. PLoS ONE 2012, 7, e35071. [Google Scholar] [CrossRef] [PubMed]
  19. Hollingsworth, P.M.; Graham, S.W.; Little, D.P. Choosing and Using a Plant DNA Barcode. PLoS ONE 2011, 6, e19254. [Google Scholar] [CrossRef] [PubMed]
  20. Vijayan, K.; Tsou, C.H. DNA Barcoding in Plants: Taxonomy in a New Perspective. Curr. Sci. 2010, 99, 1530–1541. [Google Scholar]
  21. Heinze, B. A Database of PCR Primers for the Chloroplast Genomes of Higher Plants. Plant Methods 2007, 3, 4. [Google Scholar] [CrossRef] [PubMed]
  22. Kane, N.C.; Cronk, Q. Botany without Borders: Barcoding in Focus. Mol. Ecol. 2008, 17, 5175–5176. [Google Scholar] [CrossRef] [PubMed]
  23. Parks, M.; Cronn, R.; Liston, A. Increasing phylogenetic resolution at low taxonomic levels using massively parallel sequencing of chloroplast genomes. BMC Biol. 2009, 7, 84. [Google Scholar] [CrossRef] [PubMed]
  24. Huang, C.Y.; Grünheit, N.; Ahmadinejad, N.; Timmis, J.N.; Martin, W. Mutational Decay and Age of Chloroplast and Mitochondrial Genomes Transferred Recently to Angiosperm Nuclear Chromosomes. Plant Physiol. 2005, 138, 1723–1733. [Google Scholar] [CrossRef] [PubMed] [Green Version]
  25. Li, X.; Yang, Y.; Henry, R.J.; Rossetto, M.; Wang, Y.; Chen, S. Plant DNA Barcoding: From Gene to Genome. Biol. Rev. Camb. Philos. Soc. 2015, 90, 157–166. [Google Scholar] [CrossRef] [PubMed]
  26. Kane, N.; Sveinsson, S.; Dempewolf, H.; Yang, J.Y.; Zhang, D.; Engels, J.M.M.; Cronk, Q. Ultra-barcoding in cacao (theobroma spp.; malvaceae) using whole chloroplast genomes and nuclear ribosomal DNA. Am. J. Bot. 2012, 99, 320–329. [Google Scholar] [CrossRef] [PubMed]
  27. Stull, G.W.; Moore, M.J.; Mandala, V.S.; Douglas, N.A.; Kates, H.-R.; Qi, X.; Brockington, S.F.; Soltis, P.S.; Soltis, D.E.; Gitzendanner, M.A. A targeted enrichment strategy for massively parallel sequencing of angiosperm plastid genomes. Appl. Plant Sci. 2013, 1, 1200497. [Google Scholar] [CrossRef] [PubMed]
  28. Doorduin, L.; Gravendeel, B.; Lammers, Y.; Ariyurek, Y.; Chin-A-Woeng, T.; Vrieling, K. The complete chloroplast genome of 17 individuals of pest species Jacobaea vulgaris: SNPs, microsatellites and barcoding markers for population and phylogenetic studies. DNA Res. 2011, 18, 93–105. [Google Scholar] [CrossRef] [PubMed]
  29. Krawczyk, K.; Nobis, M.; Myszczyński, K.; Klichowska, E.; Sawicki, J. Plastid Super-Barcodes as a Tool for Species Discrimination in Feather Grasses (Poaceae: Stipa). Sci. Rep. 2018, 8, 1924. [Google Scholar] [CrossRef] [PubMed]
  30. Jheng, C.-F.; Chen, T.-C.; Lin, J.-Y.; Chen, T.-C.; Wu, W.-L.; Chang, C.-C. The comparative chloroplast genomic analysis of photosynthetic orchids and developing DNA markers to distinguish Phalaenopsis orchids. Plant Sci. 2012, 190, 62–73. [Google Scholar] [CrossRef] [PubMed]
  31. Zhang, X.; Zhou, T.; Kanwal, N.; Zhao, Y.; Bai, G.; Zhao, G. Completion of Eight Gynostemma BL. (Cucurbitaceae) Chloroplast Genomes: Characterization, Comparative Analysis, and Phylogenetic Relationships. Front. Plant Sci. 2017, 8, 1583. [Google Scholar] [CrossRef] [PubMed]
  32. Sandbrink, J.M.; Vellekoop, P.; Van Ham, R.; Van Brederode, J. A Method for Evolutionary Studies on Rflp of Chloroplast DNA, Applicable to a Range of Plant Species. Biochem. Syst. Ecol. 1989, 17, 45–49. [Google Scholar] [CrossRef]
  33. Doyle, J.J. A Rapid DNA Isolation Procedure for Small Quantities of Fresh Leaf Tissue. Phytochem. Bull. 1987, 19, 11–15. [Google Scholar]
  34. Patel, R.K.; Jain, M. Ngs Qc Toolkit: A Toolkit for Quality Control of Next Generation Sequencing Data. PLoS ONE 2012, 7, e30619. [Google Scholar] [CrossRef] [PubMed]
  35. Kearse, M.; Moir, R.; Wilson, A.; Stones-Havas, S.; Cheung, M.; Sturrock, S.; Buxton, S.; Cooper, A.; Markowitz, S.; Duran, C.; et al. Geneious basic: An integrated and extendable desktop software platform for the organization and analysis of sequence data. Bioinformatics 2012, 28, 1647–1649. [Google Scholar] [CrossRef] [PubMed]
  36. Altschul, S.F.; Gish, W.; Miller, W.; Myers, E.W.; Lipman, D.J. Basic Local Alignment Search Tool. J. Mol. Biol. 1990, 215, 403–410. [Google Scholar] [CrossRef]
  37. Wyman, S.K.; Jansen, R.K.; Boore, J.L. Automatic Annotation of Organellar Genomes with Dogma. Bioinformatics 2004, 20, 3252–3255. [Google Scholar] [CrossRef] [PubMed]
  38. Liu, C.; Shi, L.; Zhu, Y.; Chen, H.; Zhang, J.; Lin, X.; Guan, X. Cpgavas, an integrated web server for the annotation, visualization, analysis, and genbank submission of completely sequenced chloroplast genome sequences. BMC Genom. 2012, 13, 715. [Google Scholar] [CrossRef] [PubMed]
  39. Schattner, P.; Brooks, A.N.; Lowe, T.M. The tRNAscan-SE, snoscan and snoGPS web servers for the detection of tRNAs and snoRNAs. Nucleic Acids Res. 2005, 33, W686–W689. [Google Scholar] [CrossRef] [PubMed]
  40. Lohse, M.; Drechsel, O.; Kahlau, S.; Bock, R. Organellargenomedraw—A suite of tools for generating physical maps of plastid and mitochondrial genomes and visualizing expression data sets. Nucleic Acids Res. 2013, 41, W575–W581. [Google Scholar] [CrossRef] [PubMed]
  41. Kumar, S.; Stecher, G.; Tamura, K. Mega7: Molecular evolutionary genetics analysis version 7.0 for bigger datasets. Mol. Biol. Evol. 2016, 33, 1870–1874. [Google Scholar] [CrossRef] [PubMed]
  42. Thiel, T.; Michalek, W.; Varshney, R.; Graner, A. Exploiting EST databases for the development and characterization of gene-derived SSR-markers in barley (Hordeum vulgare L.). Theor. Appl. Genet. 2003, 106, 411–422. [Google Scholar] [CrossRef] [PubMed]
  43. Kurtz, S.; Choudhuri, J.V.; Ohlebusch, E.; Schleiermacher, C.; Stoye, J.; Giegerich, R. REPuter: The Manifold Applications of Repeat Analysis on a Genomic Scale. Nucleic Acids Res. 2001, 29, 4633–4642. [Google Scholar] [CrossRef] [PubMed]
  44. Larkin, M.A.; Blackshields, G.; Brown, N.P.; Chenna, R.; McGettigan, P.A.; McWilliam, H.; Valentin, F.; Wallace, I.M.; Wilm, A.; Lopez, R.; et al. Clustal W and clustal X version 2.0. Bioinformatics 2007, 23, 2947–2948. [Google Scholar] [CrossRef] [PubMed]
  45. Katoh, K.; Standley, D.M. Mafft multiple sequence alignment software version 7: Improvements in performance and usability. Mol. Biol. Evol. 2013, 30, 772–780. [Google Scholar] [CrossRef] [PubMed]
Sample Availability: Sequences date of three Rheum species (R. officinale, R. palmatum and R. tanguticum) are available from the authors.
Figure 1. Gene map of the Rheum chloroplast genome. The genes lying inside and outside the outer circle are transcribed in a clockwise and counterclockwise direction, respectively (as indicated by arrows). Colors denote the genes belonging to different functional groups. The hatch marks on the inner circle indicate the extent of the inverted repeats (IRa and IRb) that separate the small single copy (SSC) region from the large single copy (LSC) region. The dark gray and light gray shading within the inner circle correspond to the percentage of G + C and A + T content, respectively.
Molecules 23 02811 g001
Figure 2. Comparison of SSR types and quantities in the three studied Rheum species. (a) Number of SSR types; (b) SSRs of three species in four regions; (c) The percentages of SSRs number in four regions; (d) Frequency of SSRs by length. SSR: Simple sequence repeats; LSC: large single-copy region; SSC: small single-copy region; IRA and IRB: inverted repeats.
Molecules 23 02811 g002
Figure 3. Phylogenetic tree constructed using neighbor joining (NJ), based on the whole chloroplast genomes from different species. Amborella trichopoda was set as outgroup.
Molecules 23 02811 g003
Figure 4. Comparison of three chloroplast genomes using R. palmatum as the reference. The vertical scale indicates the percentage of identity, ranging from 50% to 100%; the horizontal axis indicates the coordinates within the chloroplast genome. Annotated genes are displayed along the top. Genome regions are color-coded as either protein-coding exons, rRNA, tRNA, or conserved non-coding sequences (CNS). UTR: Untranslated Region.
Molecules 23 02811 g004
Figure 5. Base information of the identification sites of sequences obtained by chosen primer pairs for the three study species. (a) Primer pair 1; (b) Primer pair 7; (c) Primer pair 9; (d) Primer pair 10; (e) Primer pair 15; (f) Primer pair 17; (g) Primer pair 21; (h) Primer pair 6. For more detailed information on primer pairs see Table S3.
Molecules 23 02811 g005
Table 1. The basic characteristics of chloroplast genomes of the three Rheum species.
R. officinaleR. palmatumR. tanguticum
LocationQinghaiSichuanGansu
Accession number in GenBankMH572012KR816224MH572013
Total clean read820,613 kb644,941 kb685,879 kb
N50 of contigs (bp)86,52386,48386,439
Total chloroplast DNA size (bp)161,093161,541161,053
LSC size (bp)86,60986,51886,604
IR size (bp)30,95630,95630,961
SSC size (bp)12,75013,11113,147
Total number of genes131130129
Number of different protein-coding genes929292
Number of different tRNA genes313029
Number of different rRNA genes888
GC content (%)37.337.337.3
GC content of LSC (%)35.335.435.4
GC content of IR (%)41.14141.1
GC content of SSC (%)32.532.532.6
LSC: large single-copy region; IR: inverted repeats; SSC: small single-copy region.
Table 2. A list of genes found in the chloroplast genomes of the three Rheum species including copy number and introns included.
Group of GenesName of Gene
Transfer RNAs (31)trnC-GCA, trnD-GTC, trnE-TTC, trnF-GAA, trnfM-CAT, trnG-GCC, trnH-GTG, trnI-CAT (x2), trnI-GAT *, trnL-CAA (x2), trnL-TAG, trnL-TAG *, trnM-CAT, trnN-GTT (x2), trnP-TGG, trnQ-TTG, trnR-ACG (x2), trnR-TCT, trnS-GGA, trnS-GCT, trnS-TGA, trnT-GGT, trnT-TGT, trnV-GAC (x2), trnW-CCA, trnY-GTA,
photosystem I (5)psaA, psaB, psaC, psaI, psaJ
Assembly/stability of photosystem I (2)ycf3 **, ycf4
photosystem II (15)psbA, psbB, psbC, psbD, psbE, psbF, psbH, psbI, psbJ, psbK, psbL, psbM, psbN, psbT, psbZ
Maturase (1)matK
Ribosomal protein (25)rps16, rps2, rps14, rps4, rpl33, rps18, rpl20, rps11, rpl36, rps8, rpl14, rpl16, rps3, rpl22, rps19, rps15, rps12 (x3), rpl2 * (x2), rpl23 (x2), rps7 (x2),
cytochrome b6/f complex (6) petA, petB, petD, petG, petL, petN
ATP synthase (6)atpA, atpB, atpE, atpF *, atpH, atpI
RNA polymerase (4)rpoC2, rpoC1 *, rpoB, rpoA
NADH dehydrogenase (13)ndhA *, ndhB * (x2), ndhC, ndhD, ndhE, ndhF, ndhG, ndhH, ndhI, ndhJ, ndhK (x2)
Rubisco large subunit (1)rbcL
Acetyl-CoA carboxylase (1)accD
envelope membrane protein (1)cemA
ATP-dependent protease subunit (1)clpP **
translation initiation factor (1)infA
Conserved reading frames (ycfs) (8)ycf2 (x2), ycf15 (1N) (x2), ycf15 (x2), ycf1 (1N) (x2)
Ribosomal RNAs (8)rrn16S (x2), rrn23S (x2), rrn4.5S (x2), rrn5S (x2)
c-type cytochrome biogenesis (1) ccsA
* contains one intron; ** contains two introns; Numbers in brackets behind name of gene group give number of repetitive genes; trnI-GAT * exists in R. officinale.
Table 3. R. officinale chloroplast genome SSR distribution.
SSR nr.SSR TypeSSRSizeStarEndLocation
2p1(A)101018831892CNS
3p1(T)111120532063CNS
4p4(TGAT)31226882699matK
5p1(T)121230403051matK
6p1(T)111135053515matK
8p1(A)121247634774CNS
10p1(T)101055385547CNS
16p1(A)121281178128CNS
23p4(GTCT)3121220712218atpA
32p1(T)11111930619316rpoC2
35p2(AT)5102068320692rpoC2
49p1(T)10103366933678CNS
50p1(A)12123426334274CNS
57p1(A)10103916239171CNS
62p1(T)10104536945378CNS
63p3(AAT)4124631546326CNS
65p4(TTGG)3124689446905CNS
87p4(TATT)3126126861279CNS
90p2(TA)5106399464003petA
97p1(A)10106768767696petL-CNS
116p1(T)15158200382017CNS
120p1(T)12128628386294rpl22
125p1(A)10108937089379ycf2
129p3(CTT)4129249892509ycf2
151p1(A)1616114057114072ycf1
158p1(A)1010117661117670ndhF
165p1(T)1010120389120398CNS
171p4(AATA)312122749122760ndhD
174p2(AT)510124108124117CNS
175p1(A)1010125400125409ndhG
183p1(T)1616133545133560ycf1
205p3(AAG)412155108155119ycf2
209p1(T)1010158238158247ycf2
SSR: Simple sequence repeats; CNS: non-coding sequences.