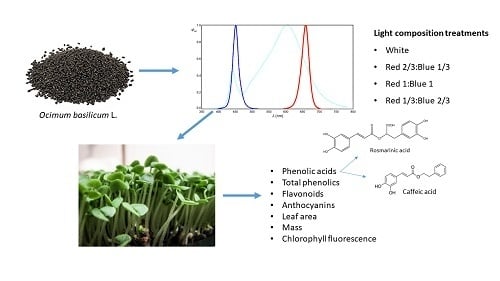
Blue and Red LED Illumination Improves Growth and Bioactive Compounds Contents in Acyanic and Cyanic Ocimum basilicum L. Microgreens

Abstract
1. Introduction
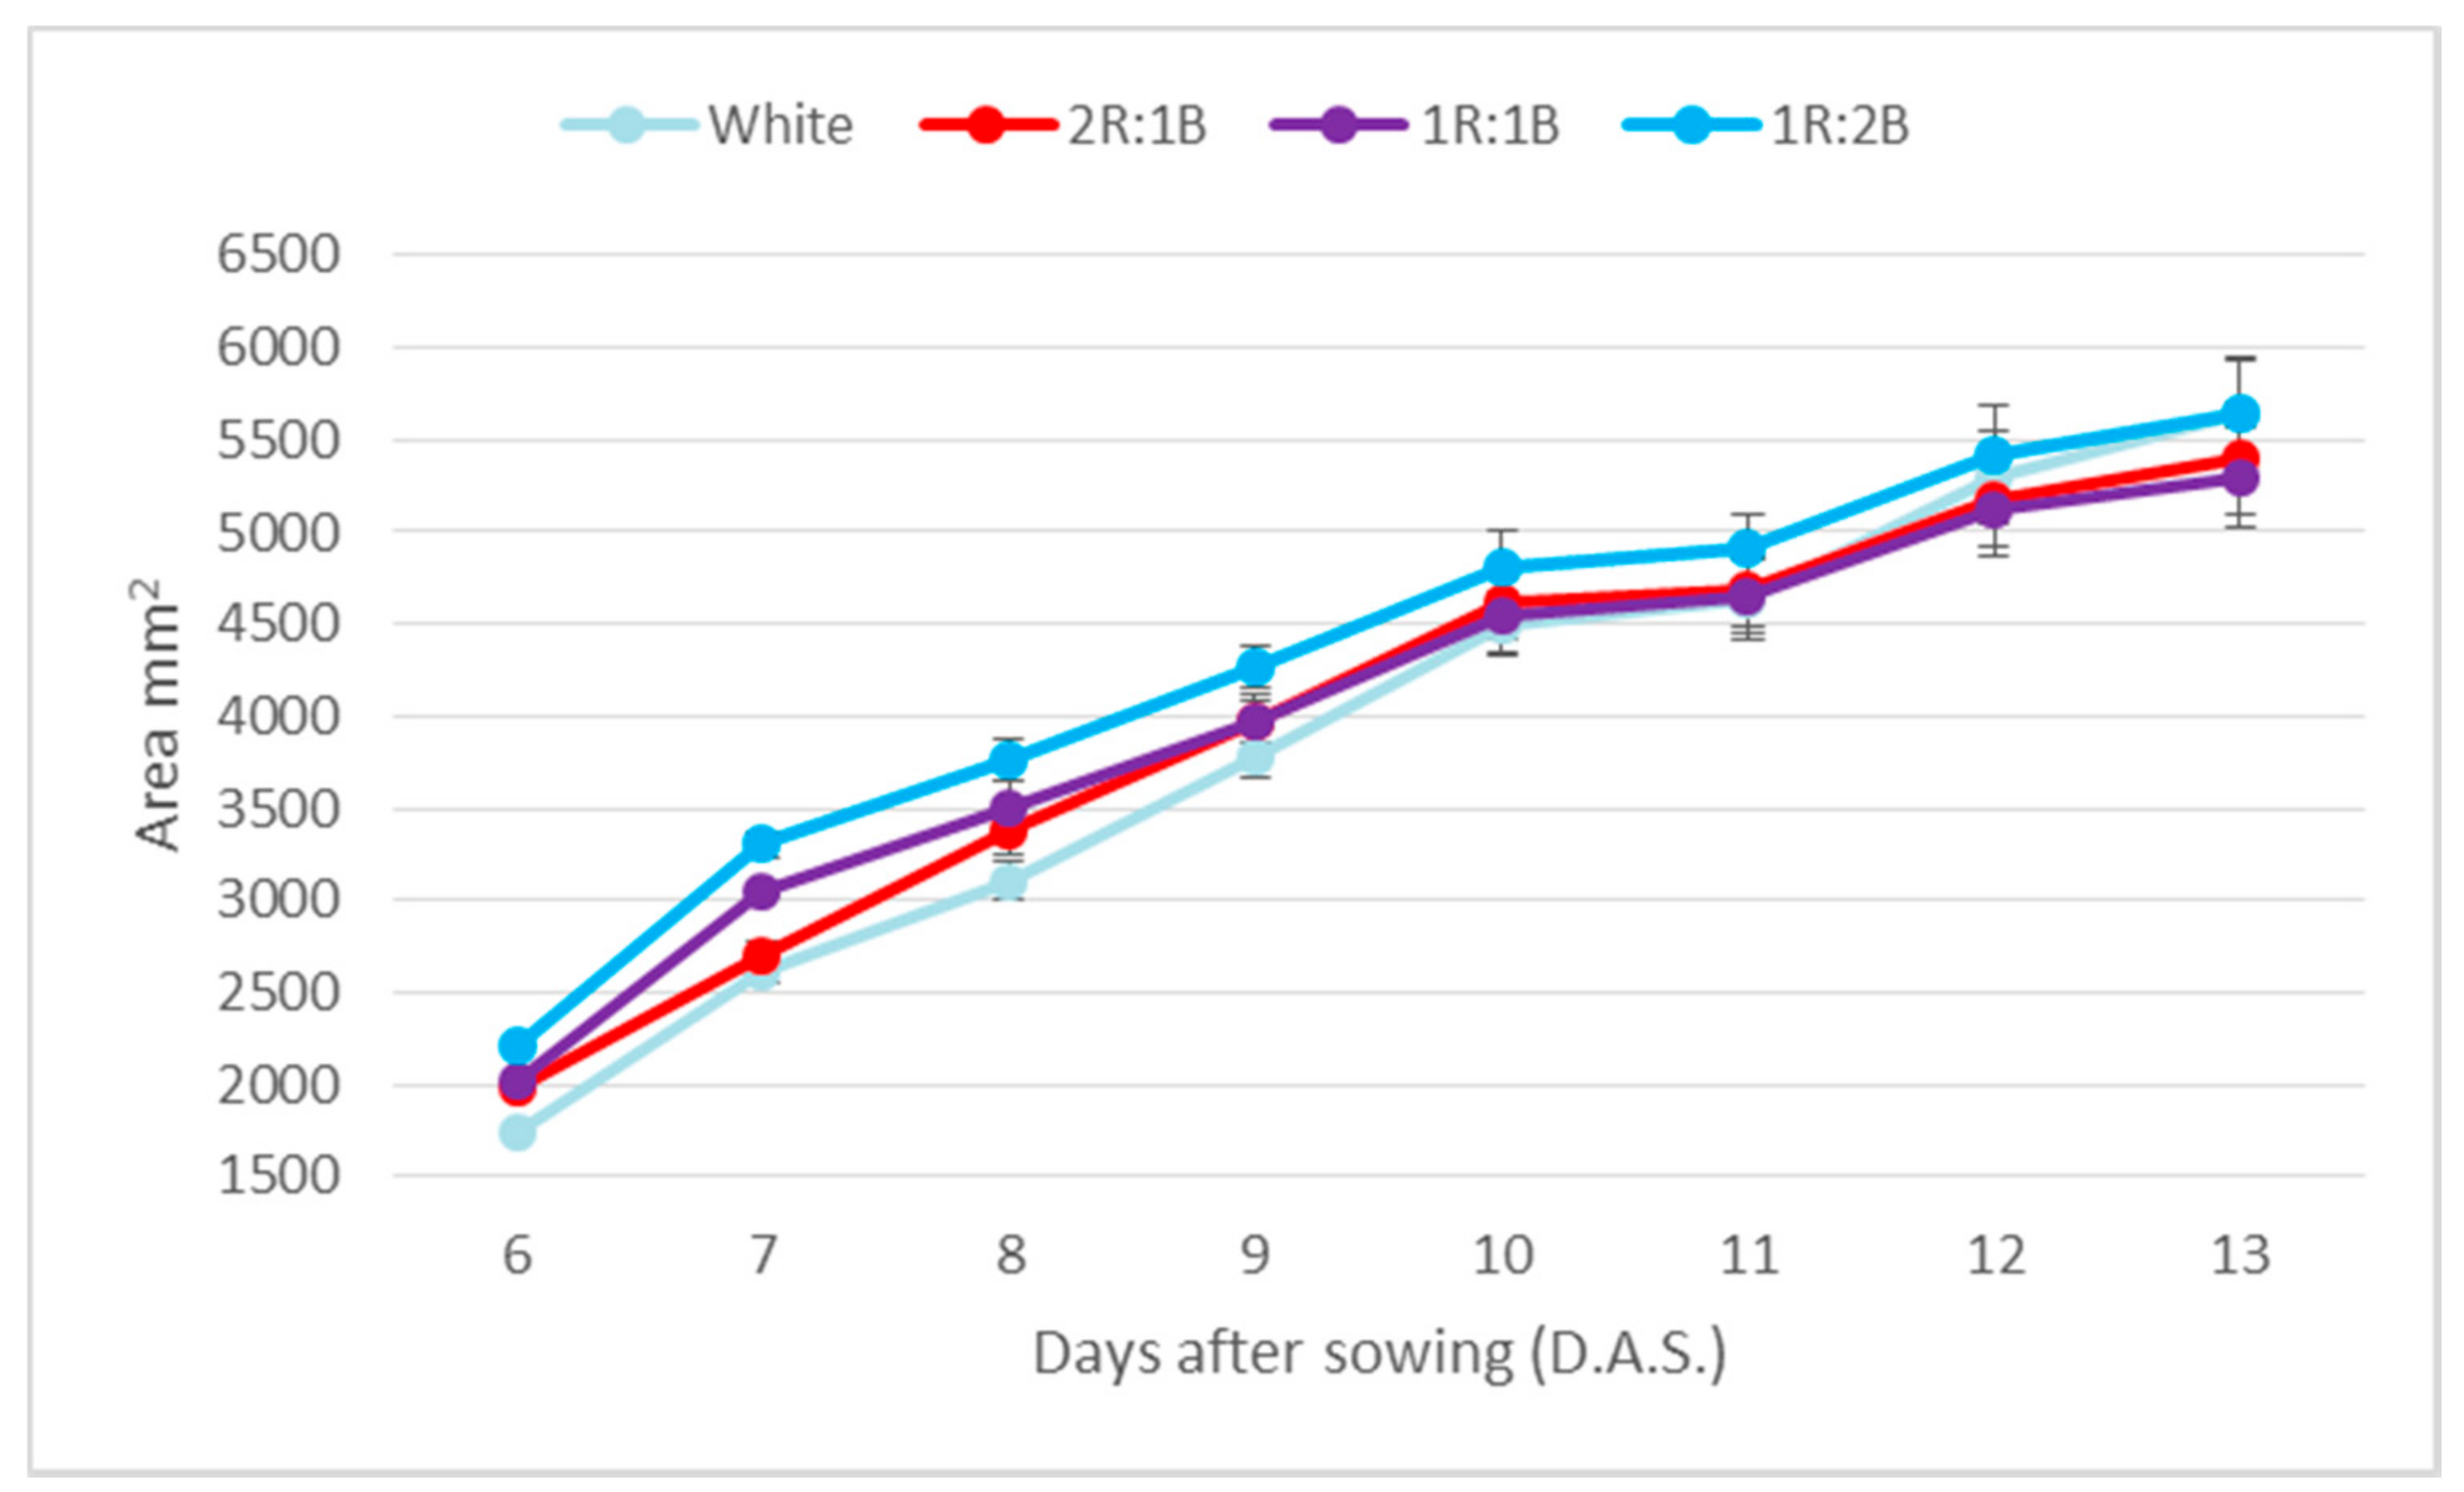
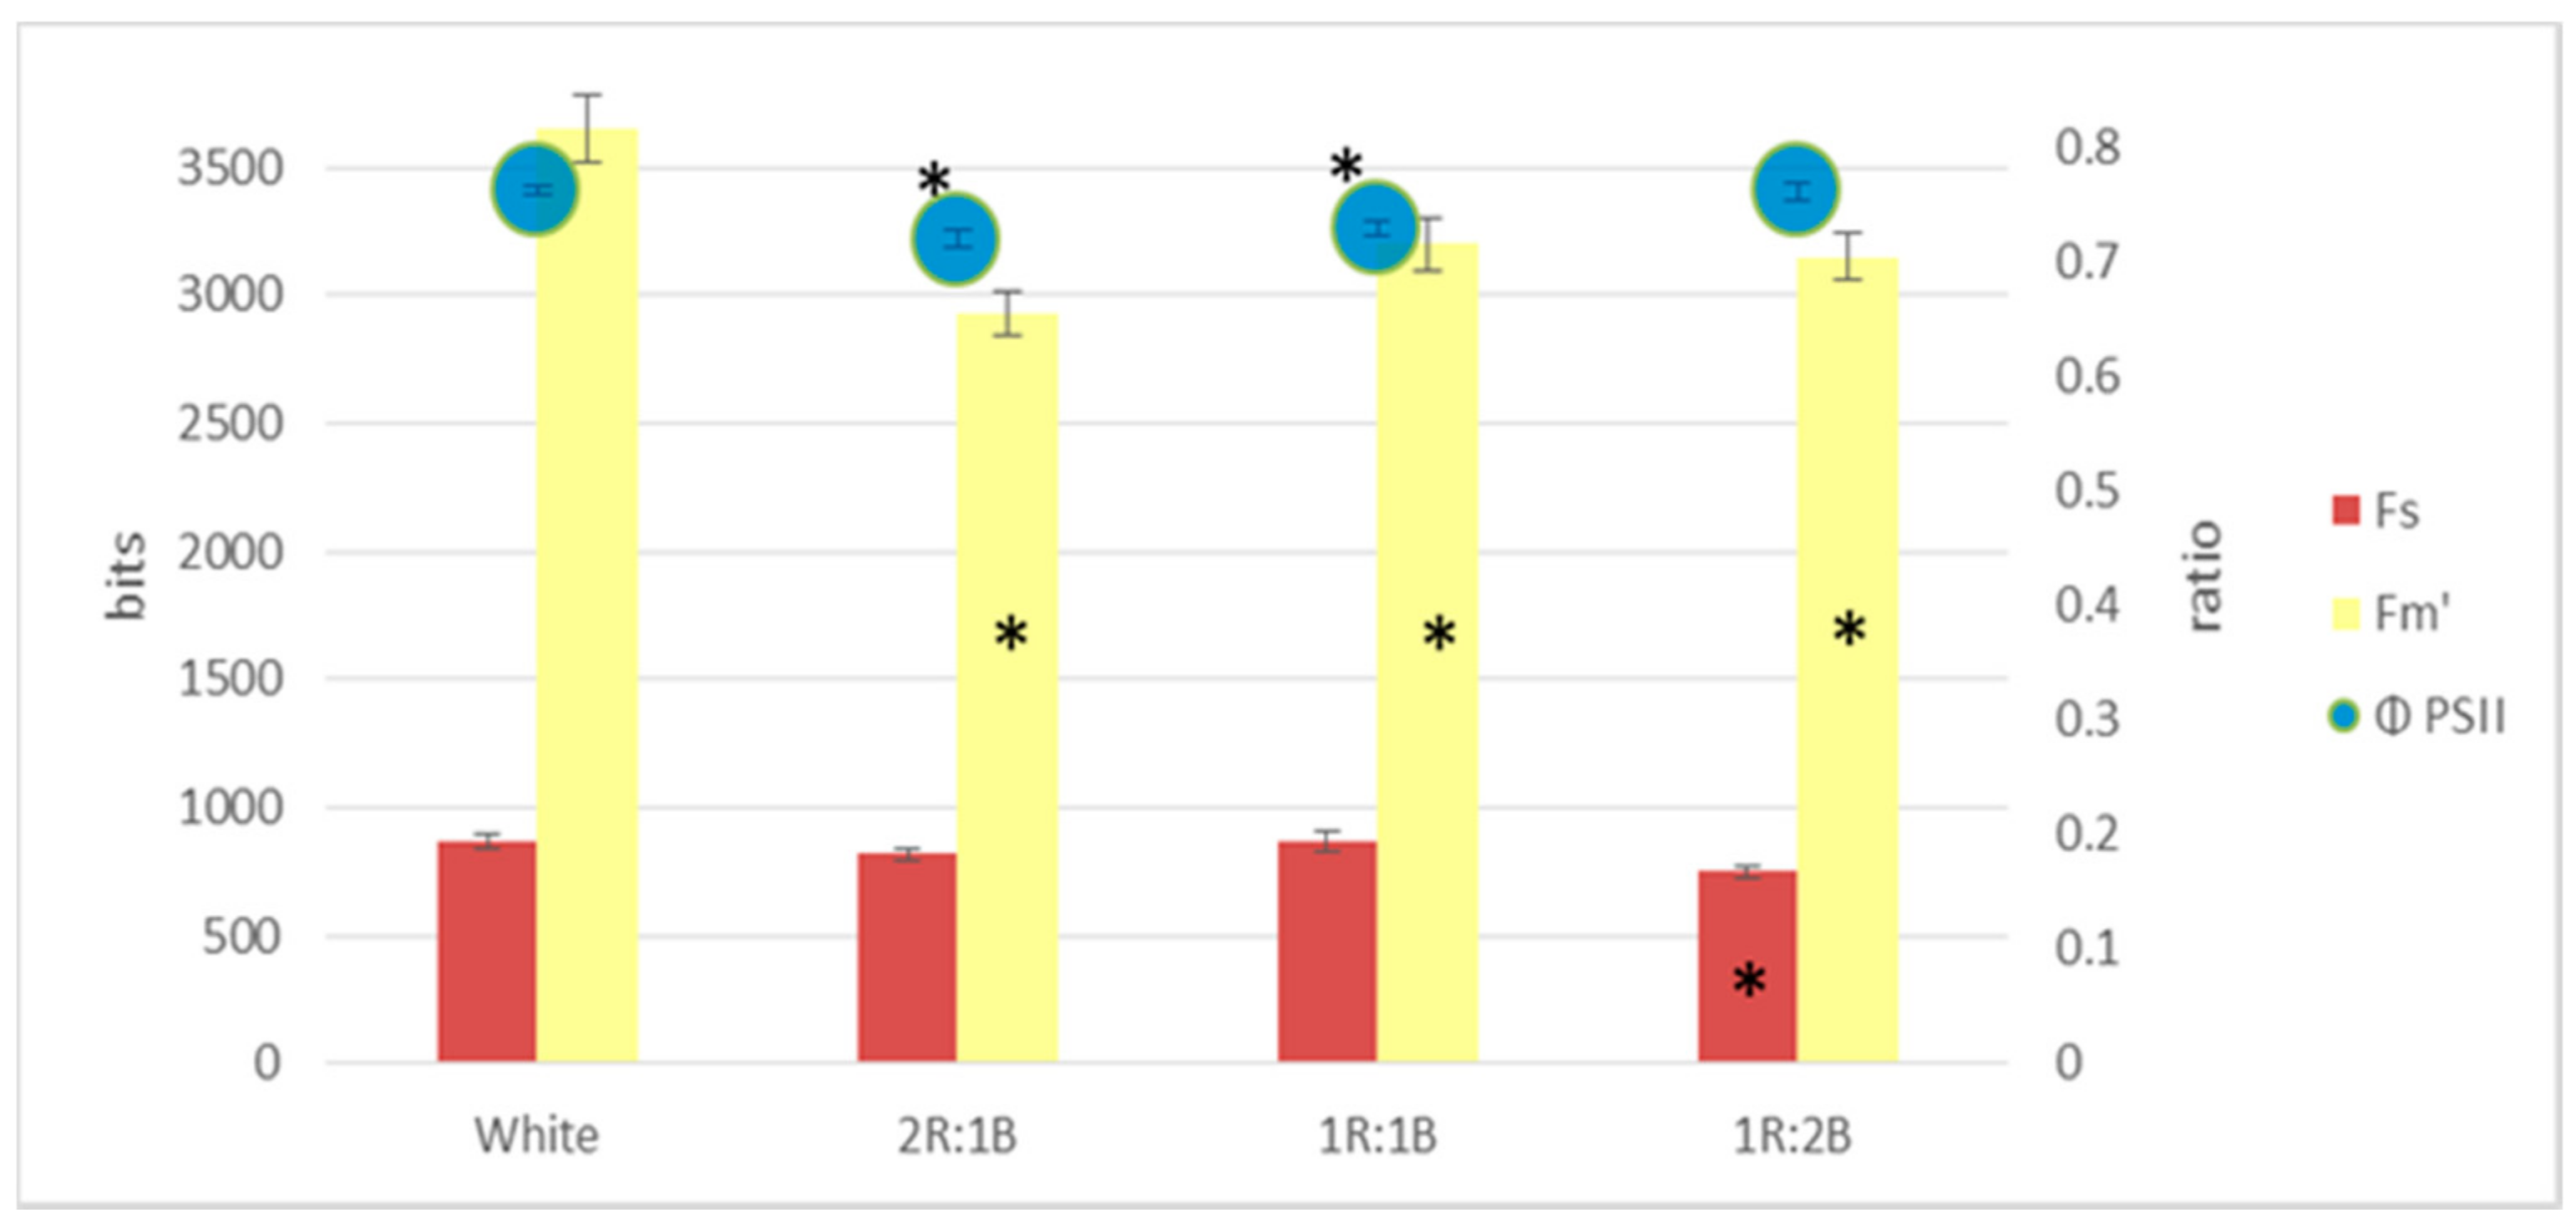
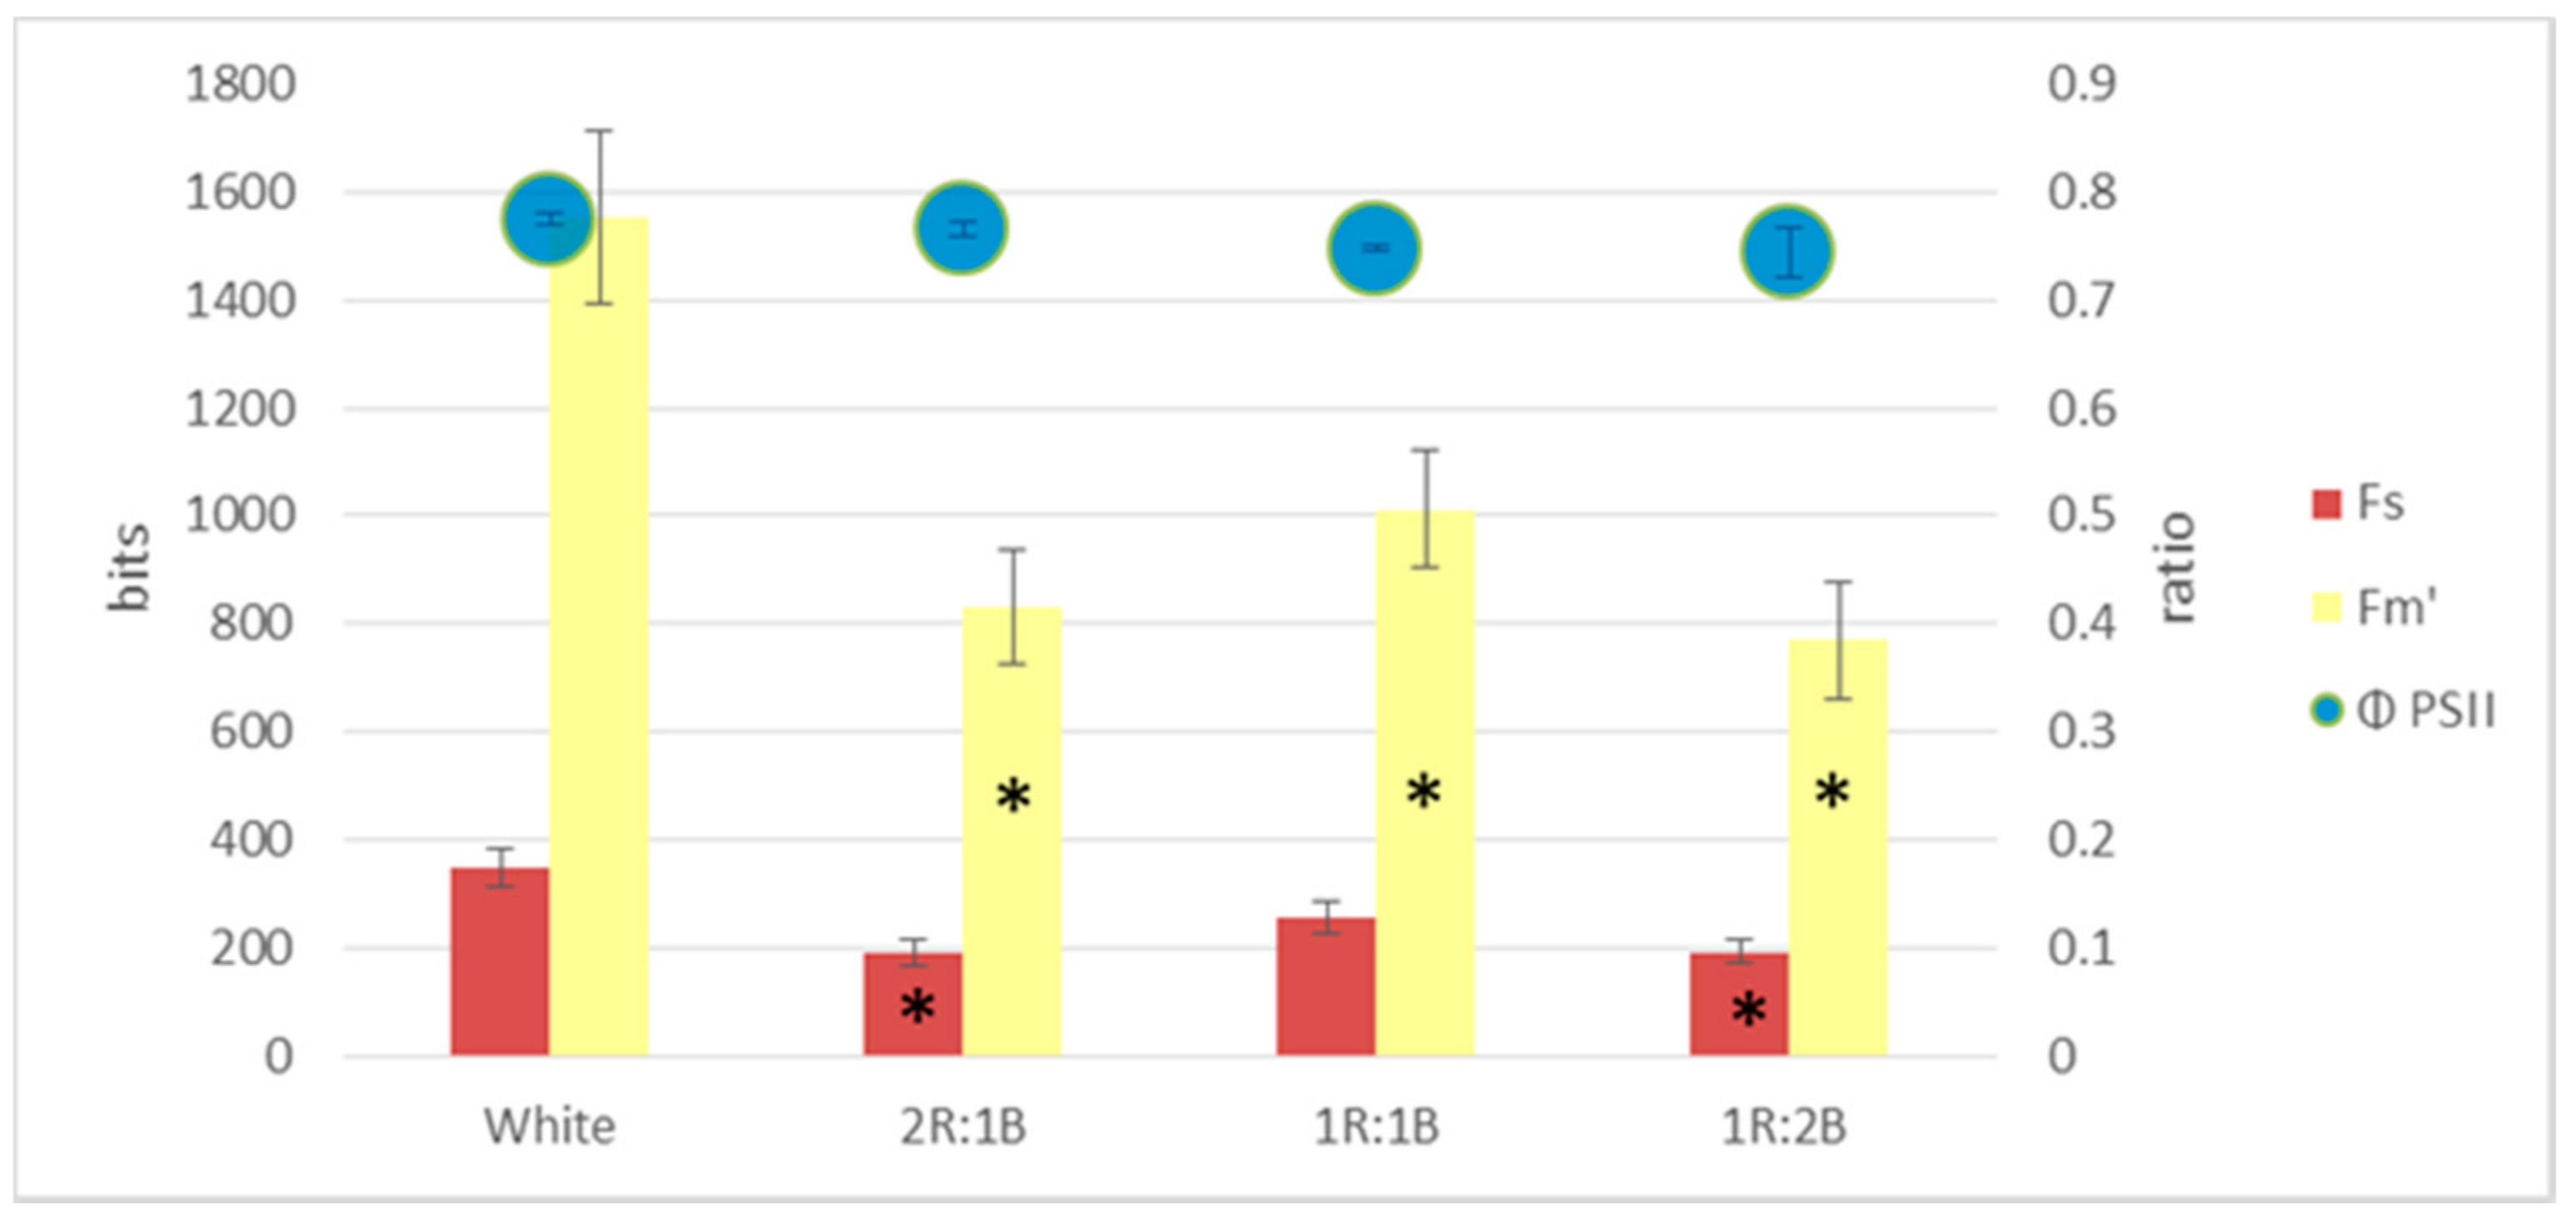
2. Results
3. Discussion
4. Materials and Methods
4.1. Plant Material and Growth Conditions
4.2. Analyses
5. Conclusions
Author Contributions
Conflicts of Interest
References
- Kyriacou, M.C.; Rouphael, Y.; Di Gioia, F.; Kyratzis, A.; Serio, F.; Renna, M.; De Pascale, S.; Santamaria, P. Micro-scale vegetable production and the rise of microgreens. Trends Food Sci. Technol. 2016, 57, 103–115. [Google Scholar] [CrossRef]
- Mir, S.A.; Shah, M.A.; Mir, M.M. Microgreens: Production, shelf life, and bioactive components. Crit. Rev. Food Sci. Nutr. 2016, 57, 2730–2736. [Google Scholar] [CrossRef] [PubMed]
- Janovská, D.; Štočková, L.; Stehno, Z. Evaluation of buckwheat sprouts as microgreens. Acta Agric. Slov. 2010, 95, 157–162. [Google Scholar] [CrossRef]
- Świeca, M.; Dziki, D. Improvement in sprouted wheat flour functionality: Effect of time, temperature and elicitation. Int. J. Food Sci. Technol. 2015, 50, 2135–2142. [Google Scholar] [CrossRef]
- Zhao, J.L.; Zou, L.; Zhong, L.Y.; Peng, L.X.; Ying, P.L.; Tan, M.L.; Zhao, G. Effects of polysaccharide elicitors from endophytic Bionectria pityrodes Fat6 on the growth and flavonoid production in tartary buckwheat sprout cultures. Cereal Res. Commun. 2015, 43, 661–671. [Google Scholar] [CrossRef]
- Mohr, H.; Drumm-Herrel, H.; Oelmüller, R. Coaction of phytochrome and blue/UV light photoreceptors. In Blue Light Effects in Biological Systems; Senger, H., Ed.; Springer: Berlin/Heidelberg, Germany, 1984; pp. 6–19. [Google Scholar]
- Lefsrud, M.G.; Kopsell, D.A.; Sams, C.E. Irradiance from distinct wavelength light-emitting diodes affect secondary metabolites in kale. HortScience 2008, 43, 2243–2244. [Google Scholar]
- Lin, K.H.; Huang, M.Y.; Huang, W.D.; Hsu, M.H.; Yang, Z.W.; Yang, C.M. The effects of red, blue, and white light-emitting diodes on the growth, development, and edible quality of hydroponically grown lettuce (Lactuca sativa L. var. capitata). Sci. Hortic. (Amst.) 2013, 150, 86–91. [Google Scholar] [CrossRef]
- Pinho, P. Usage and Control of Solid-State Lighting for Plant Growth. Ph.D. Thesis, Helsinki University of Technology, Espoo, Finland, 2008; ISBN 9789512295012. [Google Scholar]
- Kritsky, M.S. The blue light responses in evolutionary studies. In Blue Light Effects in Biological Systems; Senger, H., Ed.; Springer: Berlin/Heidelberg, Germany, 1984; pp. 3–5. [Google Scholar]
- Macedo, A.F.; Leal-Costa, M.V.; Tavares, E.S.; Lage, C.L.S.; Esquibel, M.A. The effect of light quality on leaf production and development of in vitro-cultured plants of Alternanthera brasiliana Kuntze. Environ. Exp. Bot. 2011, 70, 43–50. [Google Scholar] [CrossRef]
- Olle, M.; Viršilė, A. The effects of light-emitting diode lighting on greenhouse plant growth and quality. Agric. Food Sci. 2013, 22, 223–234. [Google Scholar] [CrossRef]
- Darko, E.; Heydarizadeh, P.; Schoefs, B.; Sabzalian, M.R. Photosynthesis under artificial light: The shift in primary and secondary metabolism. Philos. Trans. R. Soc. B Biol. Sci. 2014, 369, 20130243. [Google Scholar] [CrossRef] [PubMed]
- Dou, H.; Niu, G.; Gu, M.; Masabni, J. Effects of light quality on growth and phytonutrient accumulation of herbs under controlled environments. Horticulturae 2017, 3, 36. [Google Scholar] [CrossRef]
- Davis, P.A.; Burns, C. Photobiology in protected horticulture. Food Energy Secur. 2016, 5, 223–238. [Google Scholar] [CrossRef]
- Javanmardi, J.; Stushnoff, C.; Locke, E.; Vivanco, J.M. Antioxidant activity and total phenolic content of Iranian Ocimum accessions. Food Chem. 2003, 83, 547–550. [Google Scholar] [CrossRef]
- Kwee, E.M.; Niemeyer, E.D. Variations in phenolic composition and antioxidant properties among 15 basil (Ocimum basilicum L.) cultivars. Food Chem. 2011, 128, 1044–1050. [Google Scholar] [CrossRef]
- Xiao, Z.; Lester, G.E.; Park, E.; Saftner, R.A.; Luo, Y.; Wang, Q. Evaluation and correlation of sensory attributes and chemical compositions of emerging fresh produce: Microgreens. Postharvest Biol. Technol. 2015, 110, 140–148. [Google Scholar] [CrossRef]
- Samuolienė, G.; Brazaitytė, A.; Jankauskienė, J.; Viršilė, A.; Sirtautas, R.; Novičkovas, A.; Sakalauskienė, S.; Sakalauskaitė, J.; Duchovskis, P. LED irradiance level affects growth and nutritional quality of Brassica microgreens. Cent. Eur. J. Biol. 2013, 8, 1241–1249. [Google Scholar] [CrossRef]
- Vaštakaitė, V.; Viršilė, A. Light—Emitting diodes (leds) for higher nutritional quality of Brassicaceae microgreens. Food Sci. 2015, 1, 111–117. [Google Scholar]
- Samuoliene, G.; Brazaityte, A.; Sirtautas, R.; Sakalauskiene, S.; Jankauskiene, J.; Duchovskis, P.; Novičkovas, A. The impact of supplementary short-term red LED lighting on the antioxidant properties of microgreens. Acta Hortic. 2012, 956, 649–655. [Google Scholar] [CrossRef]
- Wojciechowska, R.; Dugosz-Grochowska, O.; Koton, A.; Zupnik, M. Effects of LED supplemental lighting on yield and some quality parameters of lamb’s lettuce grown in two winter cycles. Sci. Hortic. (Amst.) 2015, 187, 80–86. [Google Scholar] [CrossRef]
- Choi, M.K.; Chang, M.S.; Eom, S.H.; Min, K.S.; Kang, M.H. Physicochemical composition of buckwheat microgreens grown under different light conditions. J. Korean Soc. Food Sci. Nutr. 2015, 44, 709–715. [Google Scholar] [CrossRef]
- Brazaityte, A.; Viršile, A.; Jankauskiene, J.; Sakalauskiene, S.; Samuoliene, G.; Sirtautas, R.; Novičkovas, A.; Dabašinskas, L.; Miliauskiene, J.; Vaštakaite, V.; et al. Effect of supplemental UV-A irradiation in solid-state lighting on the growth and phytochemical content of microgreens. Int. Agrophys. 2015, 29, 13–22. [Google Scholar] [CrossRef]
- Vaštakaitė, V.; Viršilė, A.; Brazaitytė, A.; Samuolienė, G.; Jankauskienė, J.; Sirtautas, R.; Novičkovas, A.; Dabašinskas, L.; Sakalauskienė, S.; Miliauskienė, J.; et al. The Effect of Blue Light Dosage on Growth and Antioxidant Properties of Microgreens; Scientific Works of the Institute of Horticulture; Institute of Horticulture, Lithuanian Research Centre for Agriculture and Forestry: Babtai, Lithuania, 2015; Volume 34, pp. 25–35. [Google Scholar]
- Bian, Z.H.; Yang, Q.C.; Liu, W.K. Effects of light quality on the accumulation of phytochemicals in vegetables produced in controlled environments: A review. J. Sci. Food Agric. 2015, 95, 869–877. [Google Scholar] [CrossRef] [PubMed]
- Chen, C.; Huang, M.; Lin, K.; Wong, S.-L.; Huang, W.; Yang, C.-M. Effects of light quality on the growth, development and metabolism of rice seedlings (Oryza sativa L.). Res. J. Biotechnol. 2014, 9, 15–24. [Google Scholar]
- Ruyters, G. Effects of blue light on enzymes. In Blue Light Effects in Biological Systems; Proceedings in Life Sciences; Senger, H., Ed.; Springer: Berlin/Heidelberg, Germany, 1984; pp. 283–301. ISBN 9783642697678. [Google Scholar]
- Ruyters, G. Regulation of carbohydrate breakdown of Chlorella mutant No. 20, studied by 31P NMR spectroscopy and enzymatic analysis 2. Regulation in the presence of exogenous glucose. Plant Cell Physiol. 1988, 29, 365–370. [Google Scholar]
- Li, Y.; Xin, G.; Wei, M.; Shi, Q.; Yang, F.; Wang, X. Carbohydrate accumulation and sucrose metabolism responses in tomato seedling leaves when subjected to different light qualities. Sci. Hortic. (Amst.) 2017, 225, 490–497. [Google Scholar] [CrossRef]
- Naznin, M.T.; Lefsrud, M.; Grave, V.; Hao, X. Different ratios of red and blue LED light effects on coriander productivity and antioxidant properties. Acta Hortic. 2016, 1134, 223–229. [Google Scholar] [CrossRef]
- Fan, X.X.; Zang, J.; Xu, Z.G.; Guo, S.R.; Jiao, X.L.; Liu, X.Y.; Gao, Y. Effects of different light quality on growth, chlorophyll concentration and chlorophyll biosynthesis precursors of non-heading Chinese cabbage (Brassica campestris L.). Acta Physiol. Plant. 2013, 35, 2721–2726. [Google Scholar] [CrossRef]
- Ruyter, G. Effects of blue-light on pyruvate kinase activity during chloroplast development of unicellular green algae. Photochem. Photobiol. 1982, 35, 229–231. [Google Scholar] [CrossRef]
- Tran, L.H.; Jung, S. Effects of light-emitting diode irradiation on growth characteristics and regulation of porphyrin biosynthesis in rice seedlings. Int. J. Mol. Sci. 2017, 18, 641. [Google Scholar] [CrossRef] [PubMed]
- Kopsell, D.A.; Kopsell, D.E. Genetic and environmental factors affecting plant lutein/zeaxanthin. Agro Food Ind. Hi-Tech 2008, 19, 44–46. [Google Scholar]
- Fu, W.; Guomundsson, Ó.; Paglia, G.; Herjólfsson, G.; Andrésson, Ó.S.; Palsson, B.Ø.; Brynjólfsson, S. Enhancement of carotenoid biosynthesis in the green microalga Dunaliella salina with light-emitting diodes and adaptive laboratory evolution. Appl. Microbiol. Biotechnol. 2013, 97, 2395–2403. [Google Scholar] [CrossRef] [PubMed]
- Pizarro, L.; Stange, C. Light-dependent regulation of carotenoid biosynthesis in plants. Cienc. Investig. Agrar. 2009, 36, 143–162. [Google Scholar] [CrossRef]
- Roháček, K. Chlorophyll fluorescence parameters: The definitions, photosynthetic meaning, and mutual relationships. Photosynthetica 2002, 40, 13–29. [Google Scholar] [CrossRef]
- Maxwell, K.; Johnson, G.N. Chlorophyll fluorescence—A practical guide. J. Exp. Bot. 2000, 51, 659–668. [Google Scholar] [CrossRef] [PubMed]
- Wang, J.; Lu, W.; Tong, Y.; Yang, Q. Leaf morphology, photosynthetic performance, chlorophyll fluorescence, stomatal development of lettuce (Lactuca sativa L.) exposed to different ratios of red light to blue light. Front. Plant Sci. 2016, 7, 1–10. [Google Scholar] [CrossRef] [PubMed]
- Peng, C.; Lin, Z.; Lin, G.; Chen, S. The anti-photooxidation of anthocyanins-rich leaves of a purple rice cultivar. Sci. China Ser. C Life Sci. 2006, 49, 543–551. [Google Scholar] [CrossRef]
- Murchie, E.H.; Lawson, T. Chlorophyll fluorescence analysis: A guide to good practice and understanding some new applications. J. Exp. Bot. 2013, 64, 3983–3998. [Google Scholar] [CrossRef] [PubMed]
- Chang, S.; Li, C.; Yao, X.; Chen, S.; Jiao, X.; Liu, X.; Xu, Z.; Guan, R. Morphological, photosynthetic, and physiological responses of rapeseed leaf to different combinations of red and blue lights at the rosette stage. Front. Plant Sci. 2016, 7, 1–12. [Google Scholar] [CrossRef]
- Zheng, L.; Van Labeke, M.-C. Long-term effects of red- and blue-light emitting diodes on leaf anatomy and photosynthetic efficiency of three ornamental pot plants. Front. Plant Sci. 2017, 8, 1–12. [Google Scholar] [CrossRef] [PubMed]
- He, J.; Qin, L.; Chong, E.L.C.; Choong, T.-W.; Lee, S.K. Plant growth and photosynthetic characteristics of mesembryanthemum crystallinum grown aeroponically under different blue- and red-LEDs. Front. Plant Sci. 2017, 8, 361. [Google Scholar] [CrossRef] [PubMed]
- Ouzounis, T.; Fretté, X.; Ottosen, C.O.; Rosenqvist, E. Spectral effects of LEDs on chlorophyll fluorescence and pigmentation in Phalaenopsis “Vivien” and “Purple Star”. Physiol. Plant. 2015, 154, 314–327. [Google Scholar] [CrossRef] [PubMed]
- Hughes, N.M.; Vogelmann, T.C.; Smith, W.K. Optical effects of abaxial anthocyanin on absorption of red wavelengths by understorey species: Revisiting the back-scatter hypothesis. J. Exp. Bot. 2008, 59, 3435–3442. [Google Scholar] [CrossRef] [PubMed]
- Neill, S.O. The Functional Role of Anthocyanins in Leaves. Ph.D. Thesis, University of Auckland, Auckland, New Zealand, 2002. [Google Scholar]
- Engelsma, G.; Meijer, G. The influence of light of different spectral regions on the synthesis of phenolic compounds in gherkin seedlings in relation to photomorphogenesis I Biosynthesis of phenolic compounds. Acta Bot. Neerl. 1965, 14, 54–72. [Google Scholar] [CrossRef]
- Engelsma, G. The influence of light of different spectral regions on the synthesis of phenolic compounds in gherkin seedlings, in relation to photomorphogenesis V Phenol synthesis and photoperiodism. Acta Bot. Neerl. 1969, 18, 347–352. [Google Scholar] [CrossRef]
- Engelsma, G. A comparative investigation of the control of phenylalanine ammonia-lyase activity in gherkin and red cabbage hypocotyls. Acta Bot. Neerl. 1970, 19, 403–414. [Google Scholar] [CrossRef]
- Billett, E.E.; Grayer-Barkmeije, R.J.; Johnson, C.B.; Harborne, J.B. The effect of blue light on free and esterified phenolic acids in etiolated gherkin tissues. Phytochemistry 1981, 20, 1259–1263. [Google Scholar] [CrossRef]
- Hahlbrock, K.; Scheel, D. Physiology and molecular biology of phenylpropanoid metabolism. Annu. Rev. Plant Physiol. Plant Mol. Biol. 1989, 40, 347–369. [Google Scholar] [CrossRef]
- Huang, B.; Yi, B.; Duan, Y.; Sun, L.; Yu, X.; Guo, J.; Chen, W. Characterization and expression profiling of tyrosine aminotransferase gene from Salvia miltiorrhiza (Dan-shen) in rosmarinic acid biosynthesis pathway. Mol. Biol. Rep. 2008, 35, 601–612. [Google Scholar] [CrossRef] [PubMed]
- Zoratti, L.; Karppinen, K.; Luengo Escobar, A.; Häggman, H.; Jaakola, L. Light-controlled flavonoid biosynthesis in fruits. Front. Plant Sci. 2014, 5, 1–16. [Google Scholar] [CrossRef] [PubMed]
- Johkan, M.; Shoji, K.; Goto, F.; Hashida, S.N.; Yoshihara, T. Blue light-emitting diode light irradiation of seedlings improves seedling quality and growth after transplanting in red leaf lettuce. HortScience 2010, 45, 1809–1814. [Google Scholar]
- Yamazaki, M.; Shibata, M.; Nishiyama, Y.; Springob, K.; Kitayama, M.; Shimada, N.; Aoki, T.; Ayabe, S.I.; Saito, K. Differential gene expression profiles of red and green forms of Perilla frutescens leading to comprehensive identification of anthocyanin biosynthetic genes. FEBS J. 2008, 275, 3494–3502. [Google Scholar] [CrossRef] [PubMed]
- Iwai, M.; Ohta, M.; Tsuchiya, H.; Suzuki, T. Enhanced accumulation of caffeic acid, rosmarinic acid and luteolin-glucoside in red perilla cultivated under red diode laser and blue LED illumination followed by UV-A irradiation. J. Funct. Foods 2010, 2, 66–70. [Google Scholar] [CrossRef]
- Albert, N.W.; Lewis, D.H.; Zhang, H.; Irving, L.J.; Jameson, P.E.; Davies, K.M. Light-induced vegetative anthocyanin pigmentation in Petunia. J. Exp. Bot. 2009, 60, 2191–2202. [Google Scholar] [CrossRef] [PubMed]
- Cominelli, E.; Gusmaroli, G.; Allegra, D.; Galbiati, M.; Wade, H.K.; Jenkins, G.I.; Tonelli, C. Expression analysis of anthocyanin regulatory genes in response to different light qualities in Arabidopsis thaliana. J. Plant Physiol. 2008, 165, 886–894. [Google Scholar] [CrossRef] [PubMed]
- Kim, K.; Kook, H.-S.; Jang, Y.-J.; Lee, W.-H.; Kamala-Kannan, S.; Chae, J.-C.; Lee, K.-J. The effect of blue-light-emitting diodes on antioxidant properties and resistance to Botrytis cinerea in tomato. J. Plant Pathol. Microbiol. 2013, 4, 4–9. [Google Scholar] [CrossRef]
- Shiga, T.; Shoji, K.; Shimada, H.; Hashida, S.N.; Goto, F.; Yoshihara, T. Effect of light quality on rosmarinic acid content and antioxidant activity of sweet basil, Ocimum basilicum L. Plant Biotechnol. 2009, 26, 255–259. [Google Scholar] [CrossRef]
- Taulavuori, K.; Hyöky, V.; Oksanen, J.; Taulavuori, E.; Julkunen-Tiitto, R. Species-specific differences in synthesis of flavonoids and phenolic acids under increasing periods of enhanced blue light. Environ. Exp. Bot. 2015, 121, 145–150. [Google Scholar] [CrossRef]
- Shoji, K.; Goto, E.; Hashida, S.; Goto, F.; Yoshihara, T. Effect of light quality on the polyphenol content and antioxidant activity of sweet basil (Ocimum basilicum L.). In Proceedings of the VI International Symposium on Light in Horticulture, Tsukuba, Japan, 15–19 November 2009; pp. 95–99. [Google Scholar]
- Petersen, M.; Simmonds, M.S. Rosmarinic acid. Phytochemistry 2003, 62, 121–125. [Google Scholar] [CrossRef]
- Nardini, M.; Natella, F.; Gentili, V.; Felice, M.D.; Scaccini, C. Effect of caffeic acid dietary supplementation on the antioxidant defense system in rat: An in vivo study. Arch. Biochem. Biophys. 1997, 342, 157–160. [Google Scholar] [CrossRef] [PubMed]
- He, J.; Giusti, M.M. Anthocyanins: Natural colorants with health-promoting properties. Annu. Rev. Food Sci. Technol. 2010, 1, 163–187. [Google Scholar] [CrossRef] [PubMed]
- Arvidsson, S.; Pérez-Rodríguez, P.; Mueller-Roeber, B. A growth phenotyping pipeline for Arabidopsis thaliana integrating image analysis and rosette area modeling for robust quantification of genotype effects. New Phytol. 2011, 191, 895–907. [Google Scholar] [CrossRef] [PubMed]
- Wellburn, A.R. The spectral determination of chlorophylls a and b, as well as total carotenoids, using various solvents with spectrophotometers of different resolution. J. Plant Physiol. 1994, 144, 307–313. [Google Scholar] [CrossRef]
- Herald, T.J.; Gadgil, P.; Tilley, M. High-throughput micro plate assays for screening flavonoid content and DPPH-scavenging activity in sorghum bran and flour. J. Sci. Food Agric. 2012, 92, 2326–2331. [Google Scholar] [CrossRef] [PubMed]
- Lee, J.; Durst, R.W.; Wrolstad, R.E. Determination of total monomeric anthocyanin pigment content of fruit juices, beverages, natural colorants, and wines by the pH differential method: Collaborative study. J. AOAC Int. 2005, 88, 1269–1278. [Google Scholar] [PubMed]
Sample Availability: Not available. |


| Treatment | White | 2R:1B | 1R:1B | 1R:2B |
|---|---|---|---|---|
| Fresh mass (g/100 microgreens) | 4.27 ± 0.3 ab | 3.67 ± 0.29 a | 3.97 ± 0.34 a | 5.51 ± 0.31 b |
| Dry mass (g/100 microgreens) | 0.4 ± 0.05 ab | 0.34 ± 0.03 a | 0.39 ± 0.02 ab | 0.58 ± 0.06 b |
| Pigment | Cultivar/Treatment | White | 2R:1B | 1R:1B | 1R:2B |
|---|---|---|---|---|---|
| Chlorophyll a mg g−1 | Green cv. | 0.5 ± 0.06 a | 0.48 ± 0.07 a | 0.53 ± 0.04 a | 0.68 ± 0.03 a |
| Red cv. | 0.35 ± 0.01 a | 0.39 ± 0.05 a | 0.42 ± 0.06 a | 0.4 ± 0.04 a | |
| Chlorophyll b mg g−1 | Green cv. | 0.27 ± 0.06 a | 0.21 ± 0.03 a | 0.33 ± 0.1 a | 0.31 ± 0.01 a |
| Red cv. | 0.24 ± 0.06 a | 0.27 ± 0.05 a | 0.29 ± 0.06 a | 0.3 ± 0.03 a | |
| Carotenoids mg g−1 | Green cv. | 0.1 ± 0.02 a | 0.1 ± 0.01 a | 0.11 ± 0.01 a | 0.15 ± 0.01 a |
| Red cv. | 0.11 ± 0.02 a | 0.1 ± 0.04 a | 0.09 ± 0.01 a | 0.1 ± 0.03 a |
| Treatment | White | 2R:1B | 1R:1B | 1R:2B |
|---|---|---|---|---|
| Caffeic acid (mg/g f.w.) | 0.62 ± 0.018 a | 0.73 ± 0.018 b | 1.37 ± 0.015 c | 2.57 ± 0.016 d |
| Rosmarinic acid (mg/g f.w.) | 0.33 ± 0.021 a | 0.84 ± 0.018 b | 1.65 ± 0.034 c | 4.99 ± 0.035 d |
| Anthocyanins (mg/g f.w.) | 1.44 ± 0.04 a | 2.45 ± 0.05 c | 2.19 ± 0.04 b | 2.24 ± 0 b |
| Treatment (μmol m−2 s−1) | White | 2R:1B | 1R:1B | 1R:2B |
|---|---|---|---|---|
| White | 120 | - | - | - |
| Red | - | 80 | 60 | 40 |
| Blue | - | 40 | 60 | 80 |
© 2017 by the authors. Licensee MDPI, Basel, Switzerland. This article is an open access article distributed under the terms and conditions of the Creative Commons Attribution (CC BY) license (http://creativecommons.org/licenses/by/4.0/).
Share and Cite
Lobiuc, A.; Vasilache, V.; Oroian, M.; Stoleru, T.; Burducea, M.; Pintilie, O.; Zamfirache, M.-M. Blue and Red LED Illumination Improves Growth and Bioactive Compounds Contents in Acyanic and Cyanic Ocimum basilicum L. Microgreens. Molecules 2017, 22, 2111. https://doi.org/10.3390/molecules22122111
Lobiuc A, Vasilache V, Oroian M, Stoleru T, Burducea M, Pintilie O, Zamfirache M-M. Blue and Red LED Illumination Improves Growth and Bioactive Compounds Contents in Acyanic and Cyanic Ocimum basilicum L. Microgreens. Molecules. 2017; 22(12):2111. https://doi.org/10.3390/molecules22122111
Chicago/Turabian StyleLobiuc, Andrei, Viorica Vasilache, Mircea Oroian, Toma Stoleru, Marian Burducea, Olga Pintilie, and Maria-Magdalena Zamfirache. 2017. "Blue and Red LED Illumination Improves Growth and Bioactive Compounds Contents in Acyanic and Cyanic Ocimum basilicum L. Microgreens" Molecules 22, no. 12: 2111. https://doi.org/10.3390/molecules22122111
APA StyleLobiuc, A., Vasilache, V., Oroian, M., Stoleru, T., Burducea, M., Pintilie, O., & Zamfirache, M.-M. (2017). Blue and Red LED Illumination Improves Growth and Bioactive Compounds Contents in Acyanic and Cyanic Ocimum basilicum L. Microgreens. Molecules, 22(12), 2111. https://doi.org/10.3390/molecules22122111