
Simultaneous Determination of Purpurin, Munjistin and Mollugin in Rat Plasma by Ultra High Performance Liquid Chromatography-Tandem Mass Spectrometry: Application to a Pharmacokinetic Study after Oral Administration of Rubia cordifolia L. Extract


Abstract
:1. Introduction
2. Results and Discussion
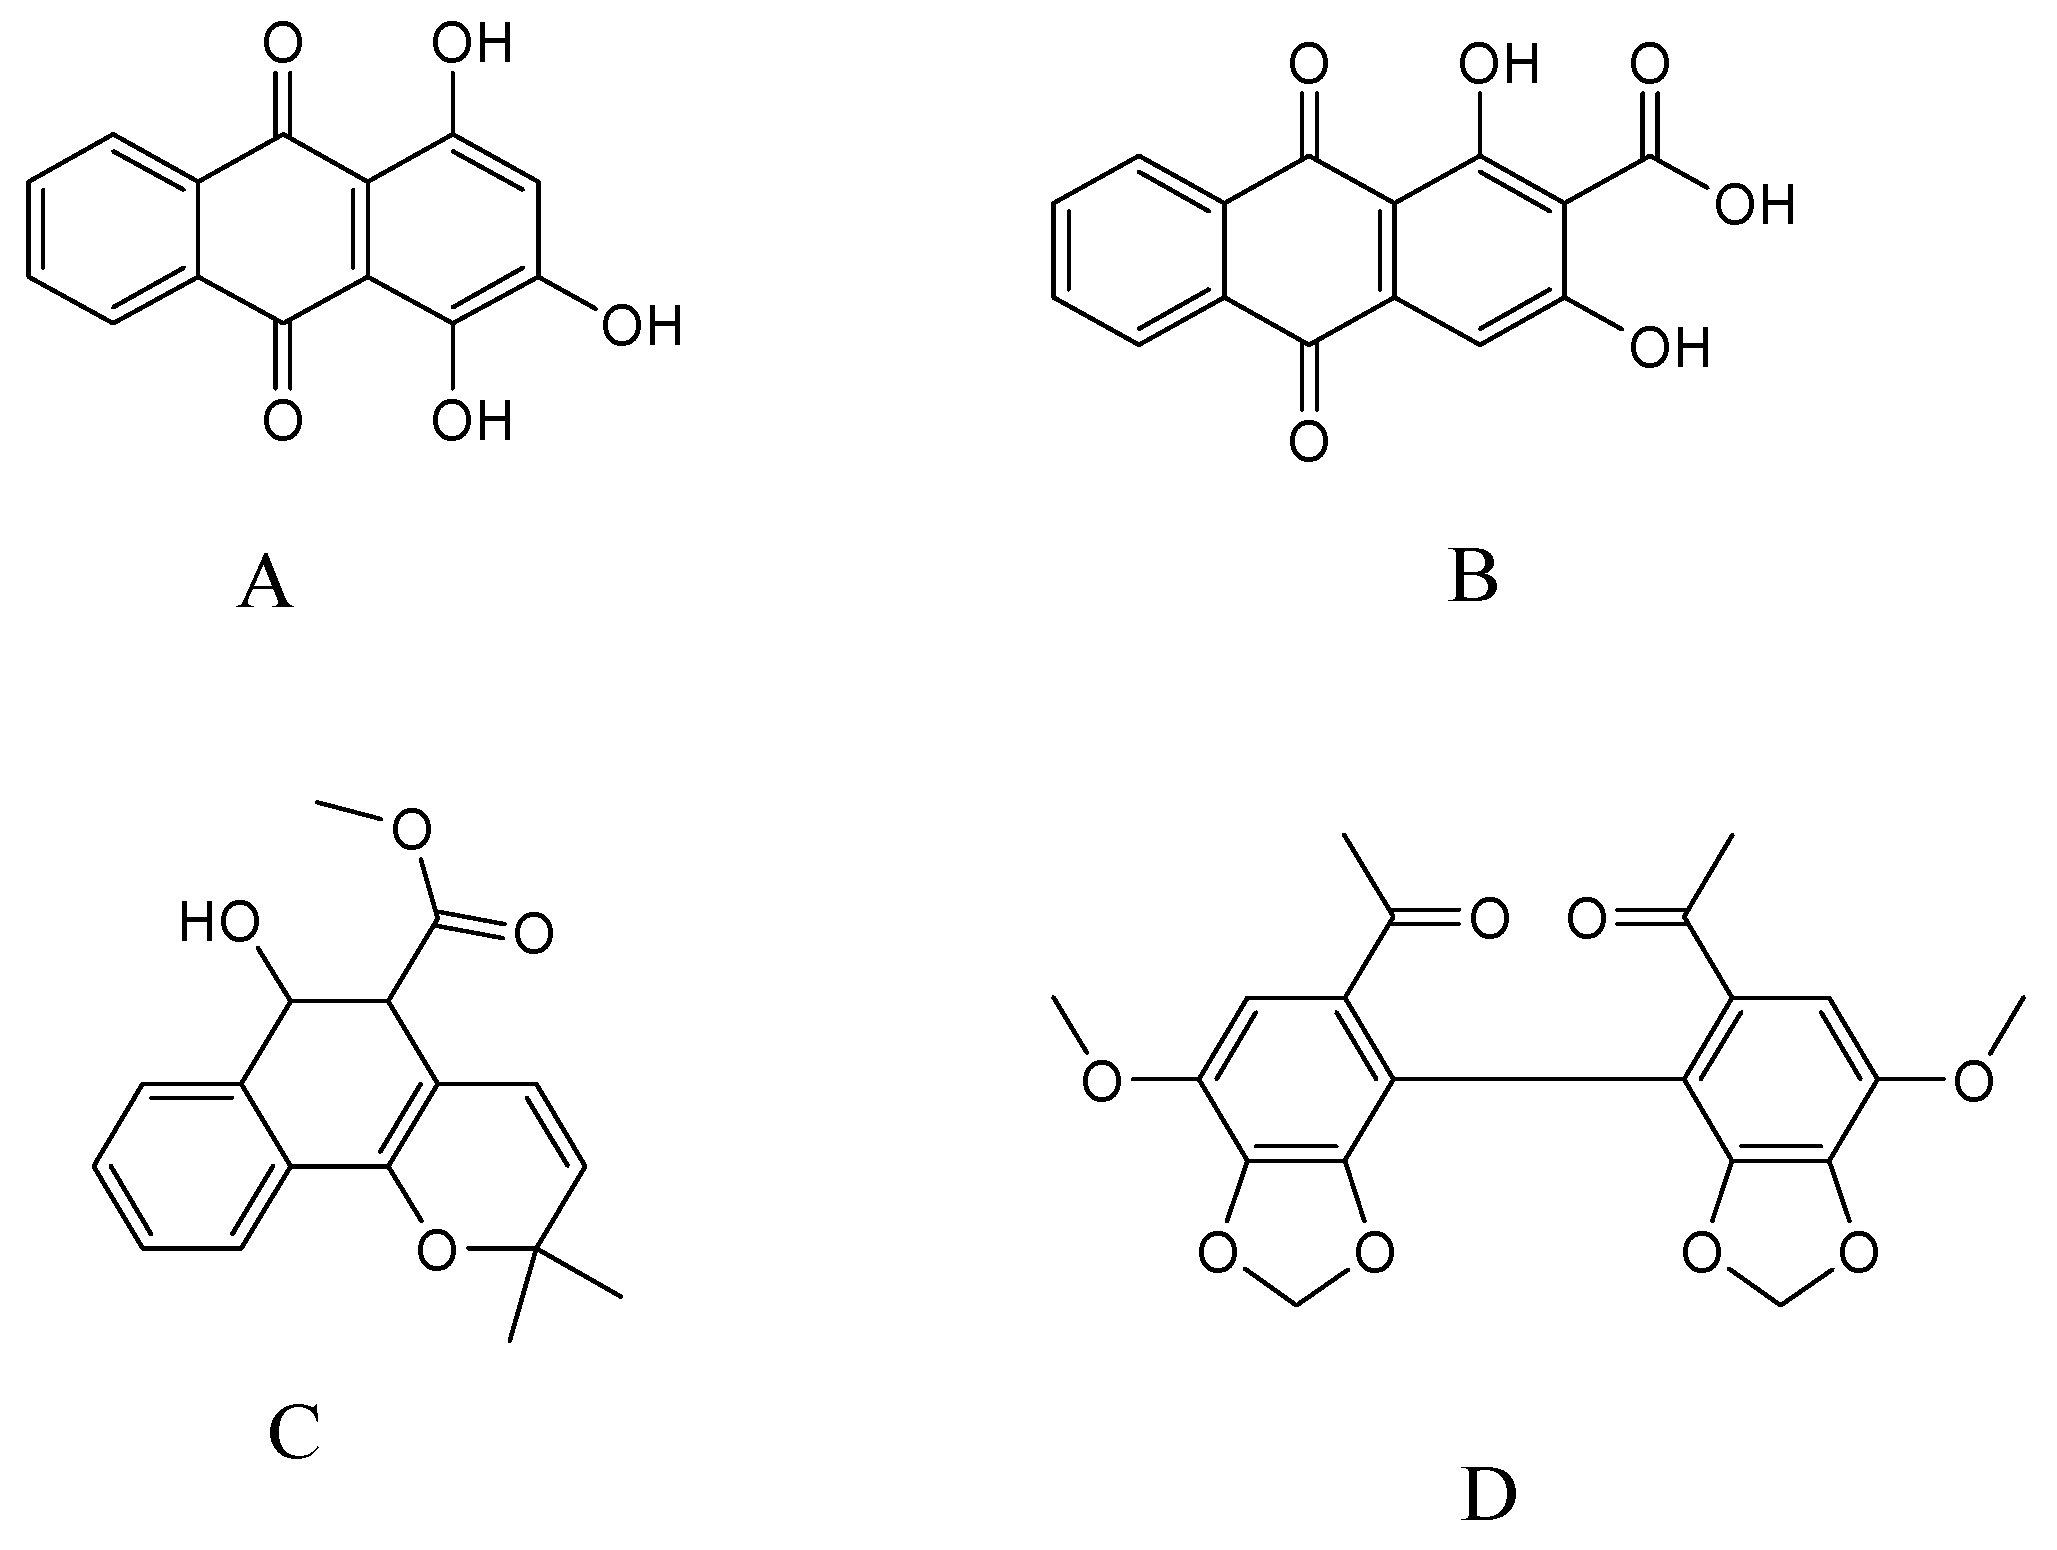
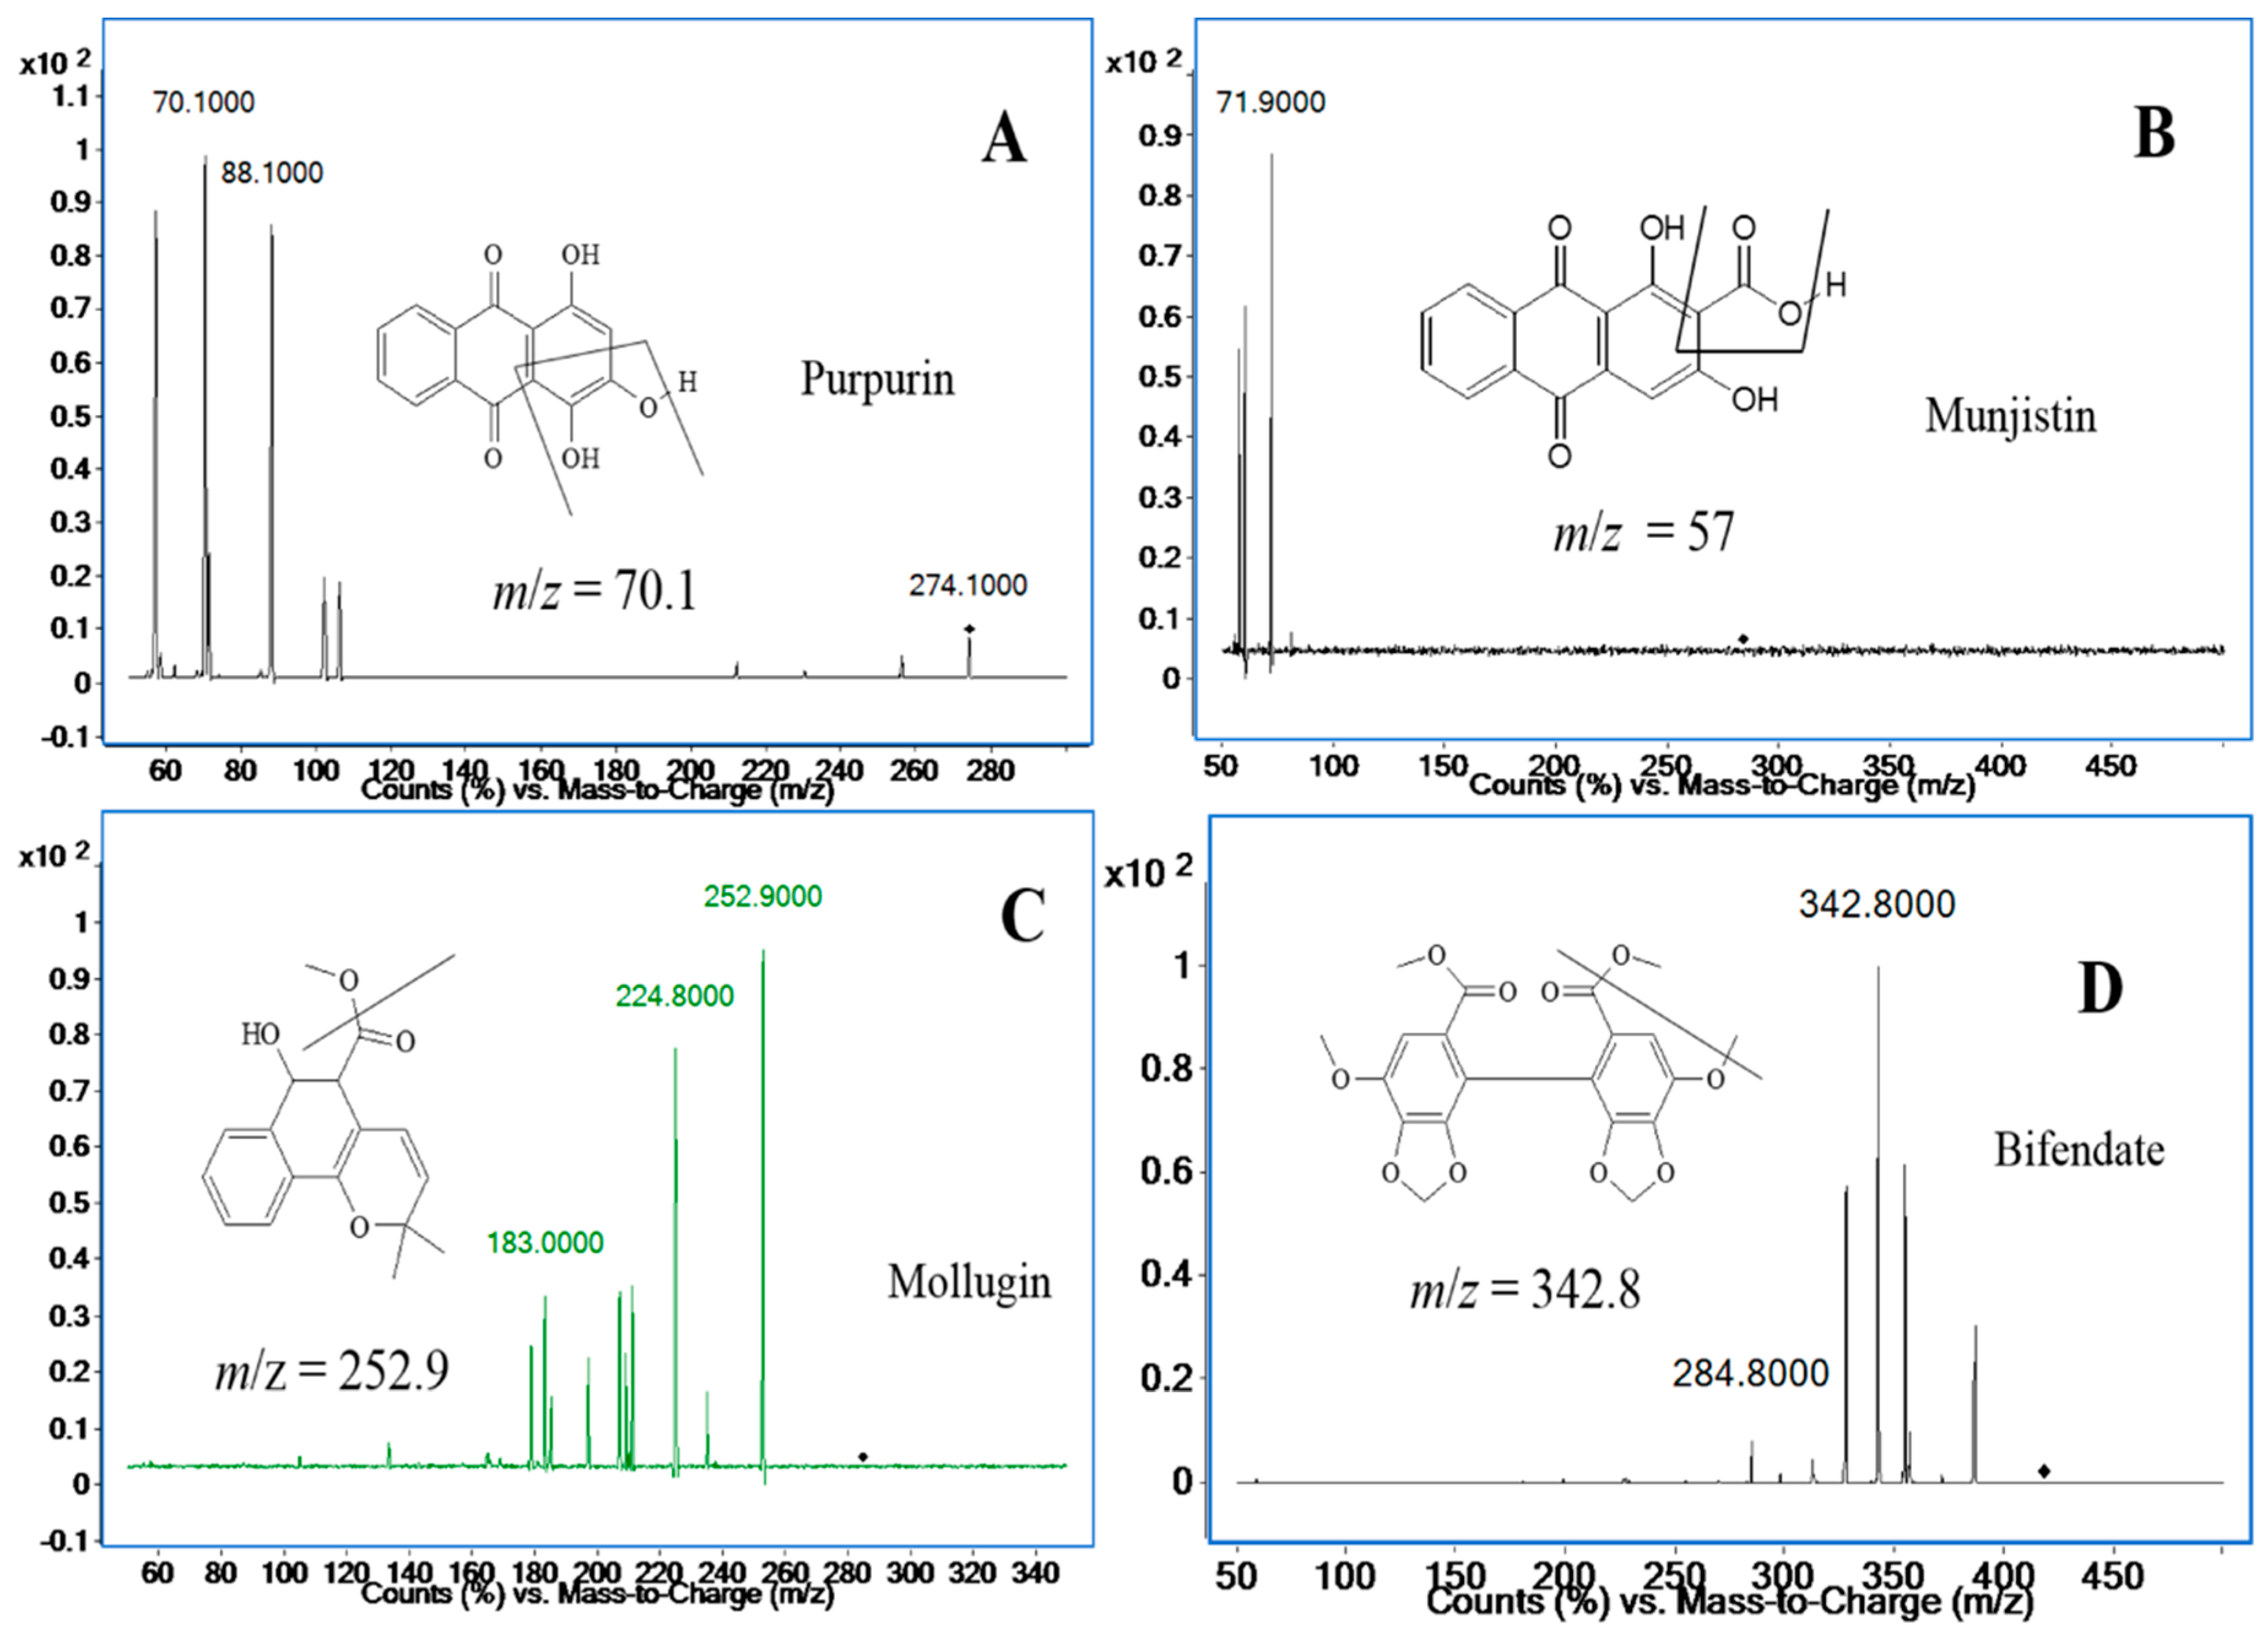
2.1. Optimization of the UHPLC-MS/MS Analysis
2.2. Sample Preparation
2.3. Method Validation
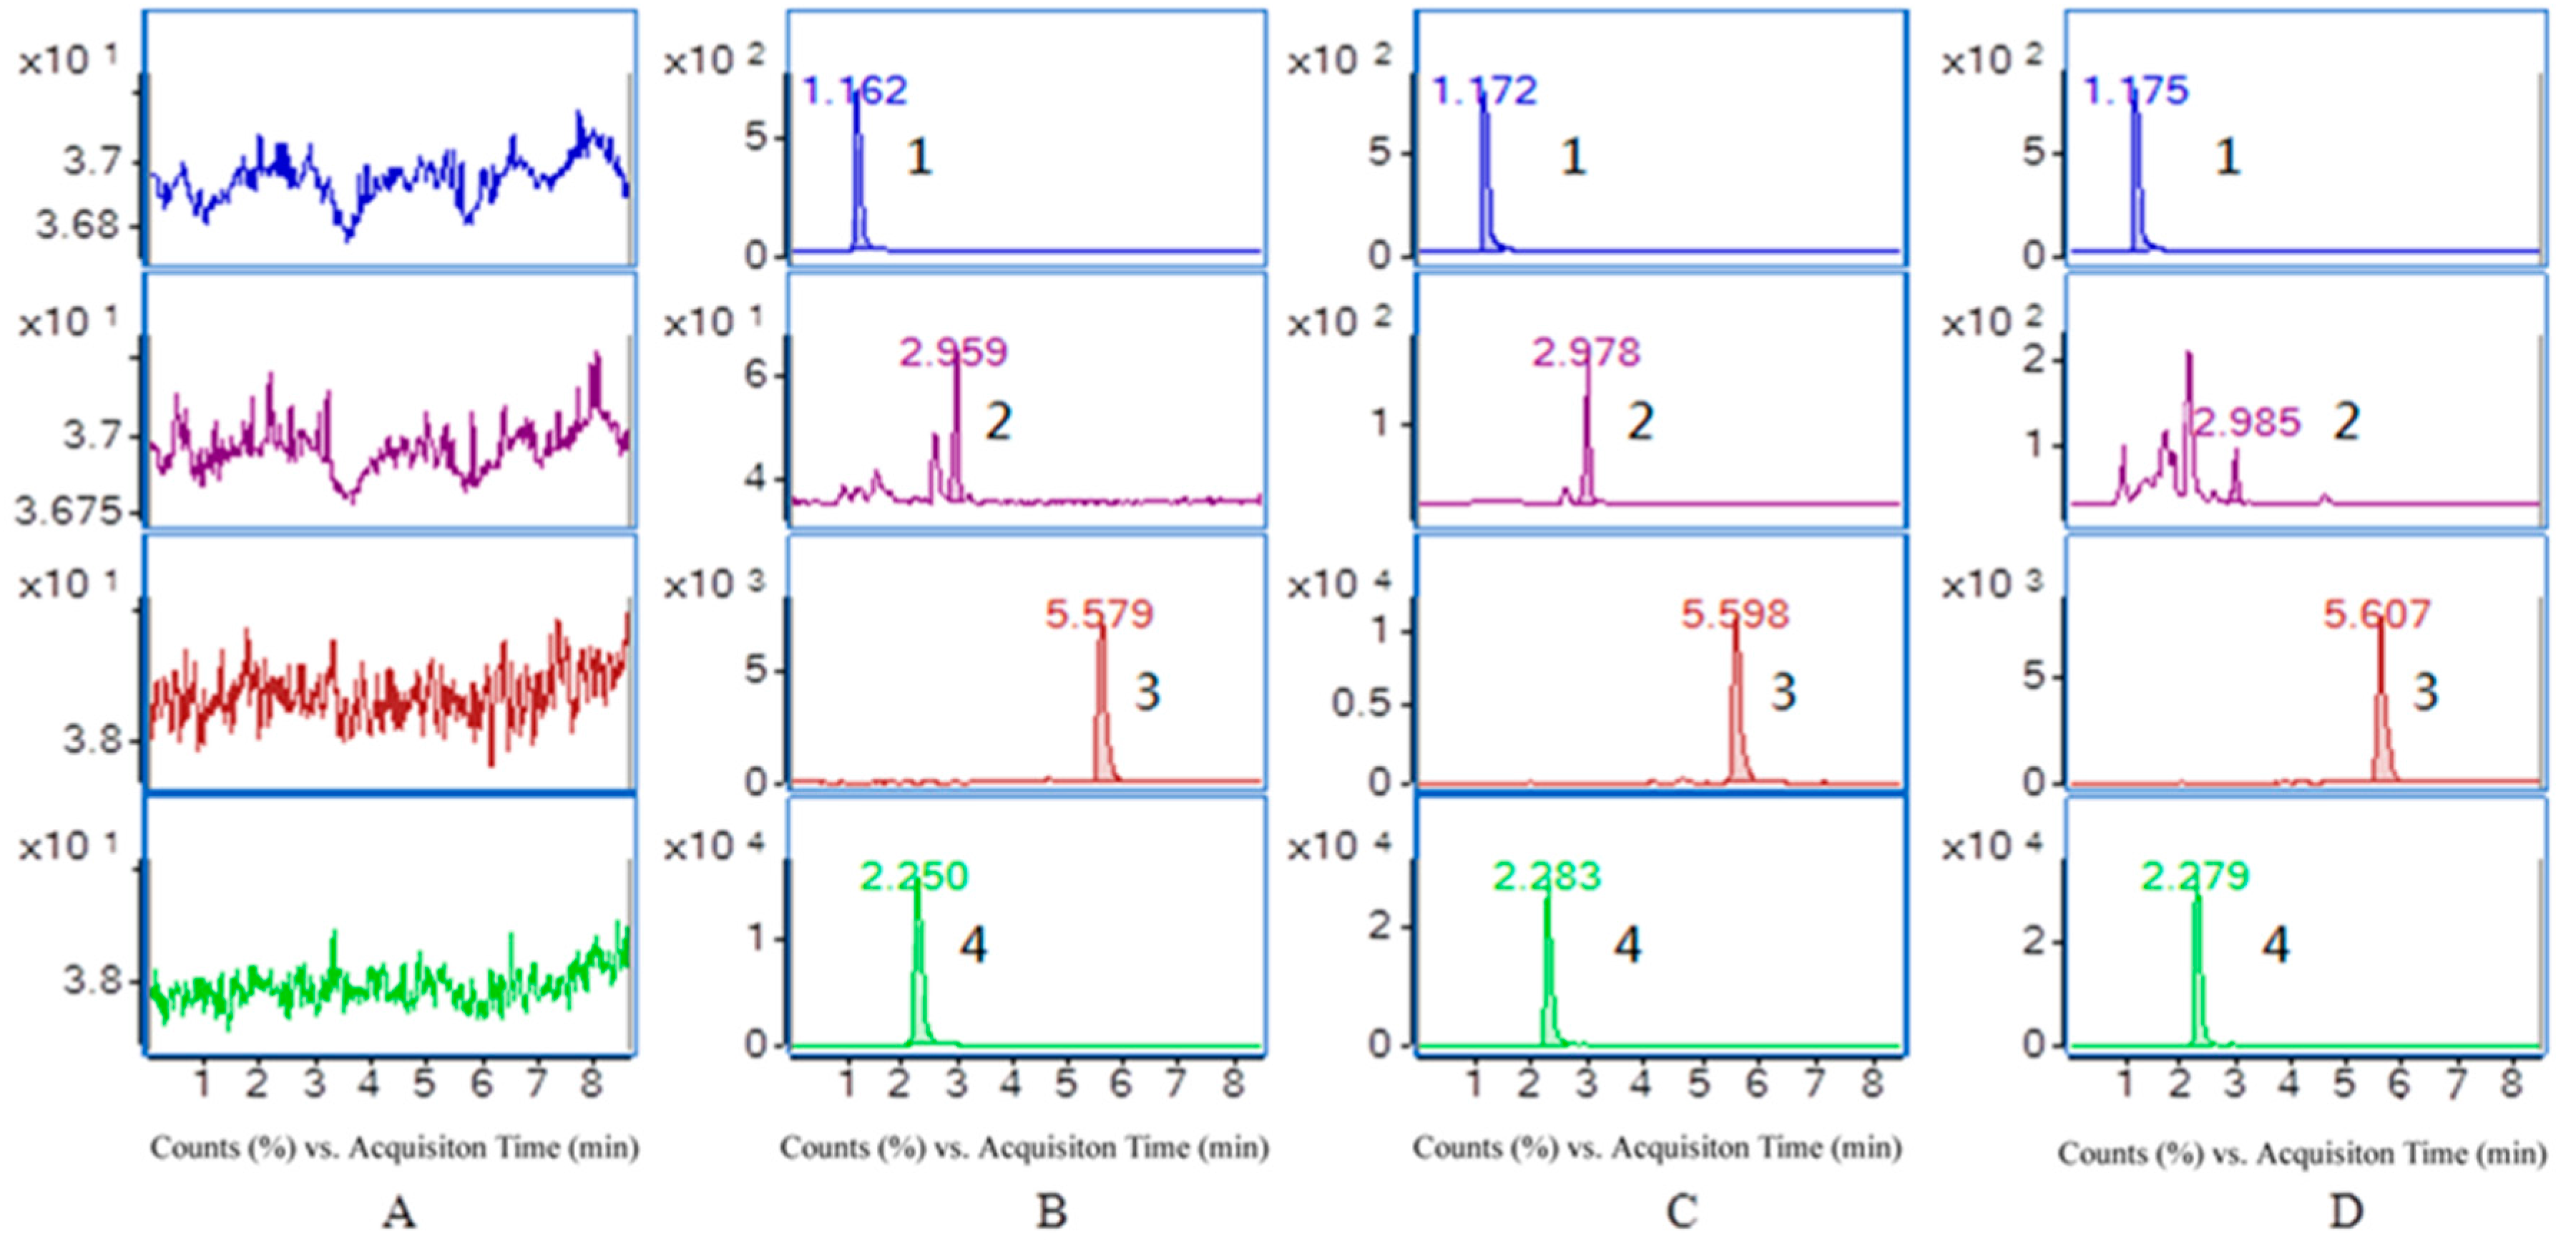
2.3.1. Specificity and Selectivity
2.3.2. Linearity and Lower Limits of Quantification
2.3.3. Precision and Accuracy
2.3.4. Extraction Recovery and Matrix Effect
2.3.5. Stability Experiments
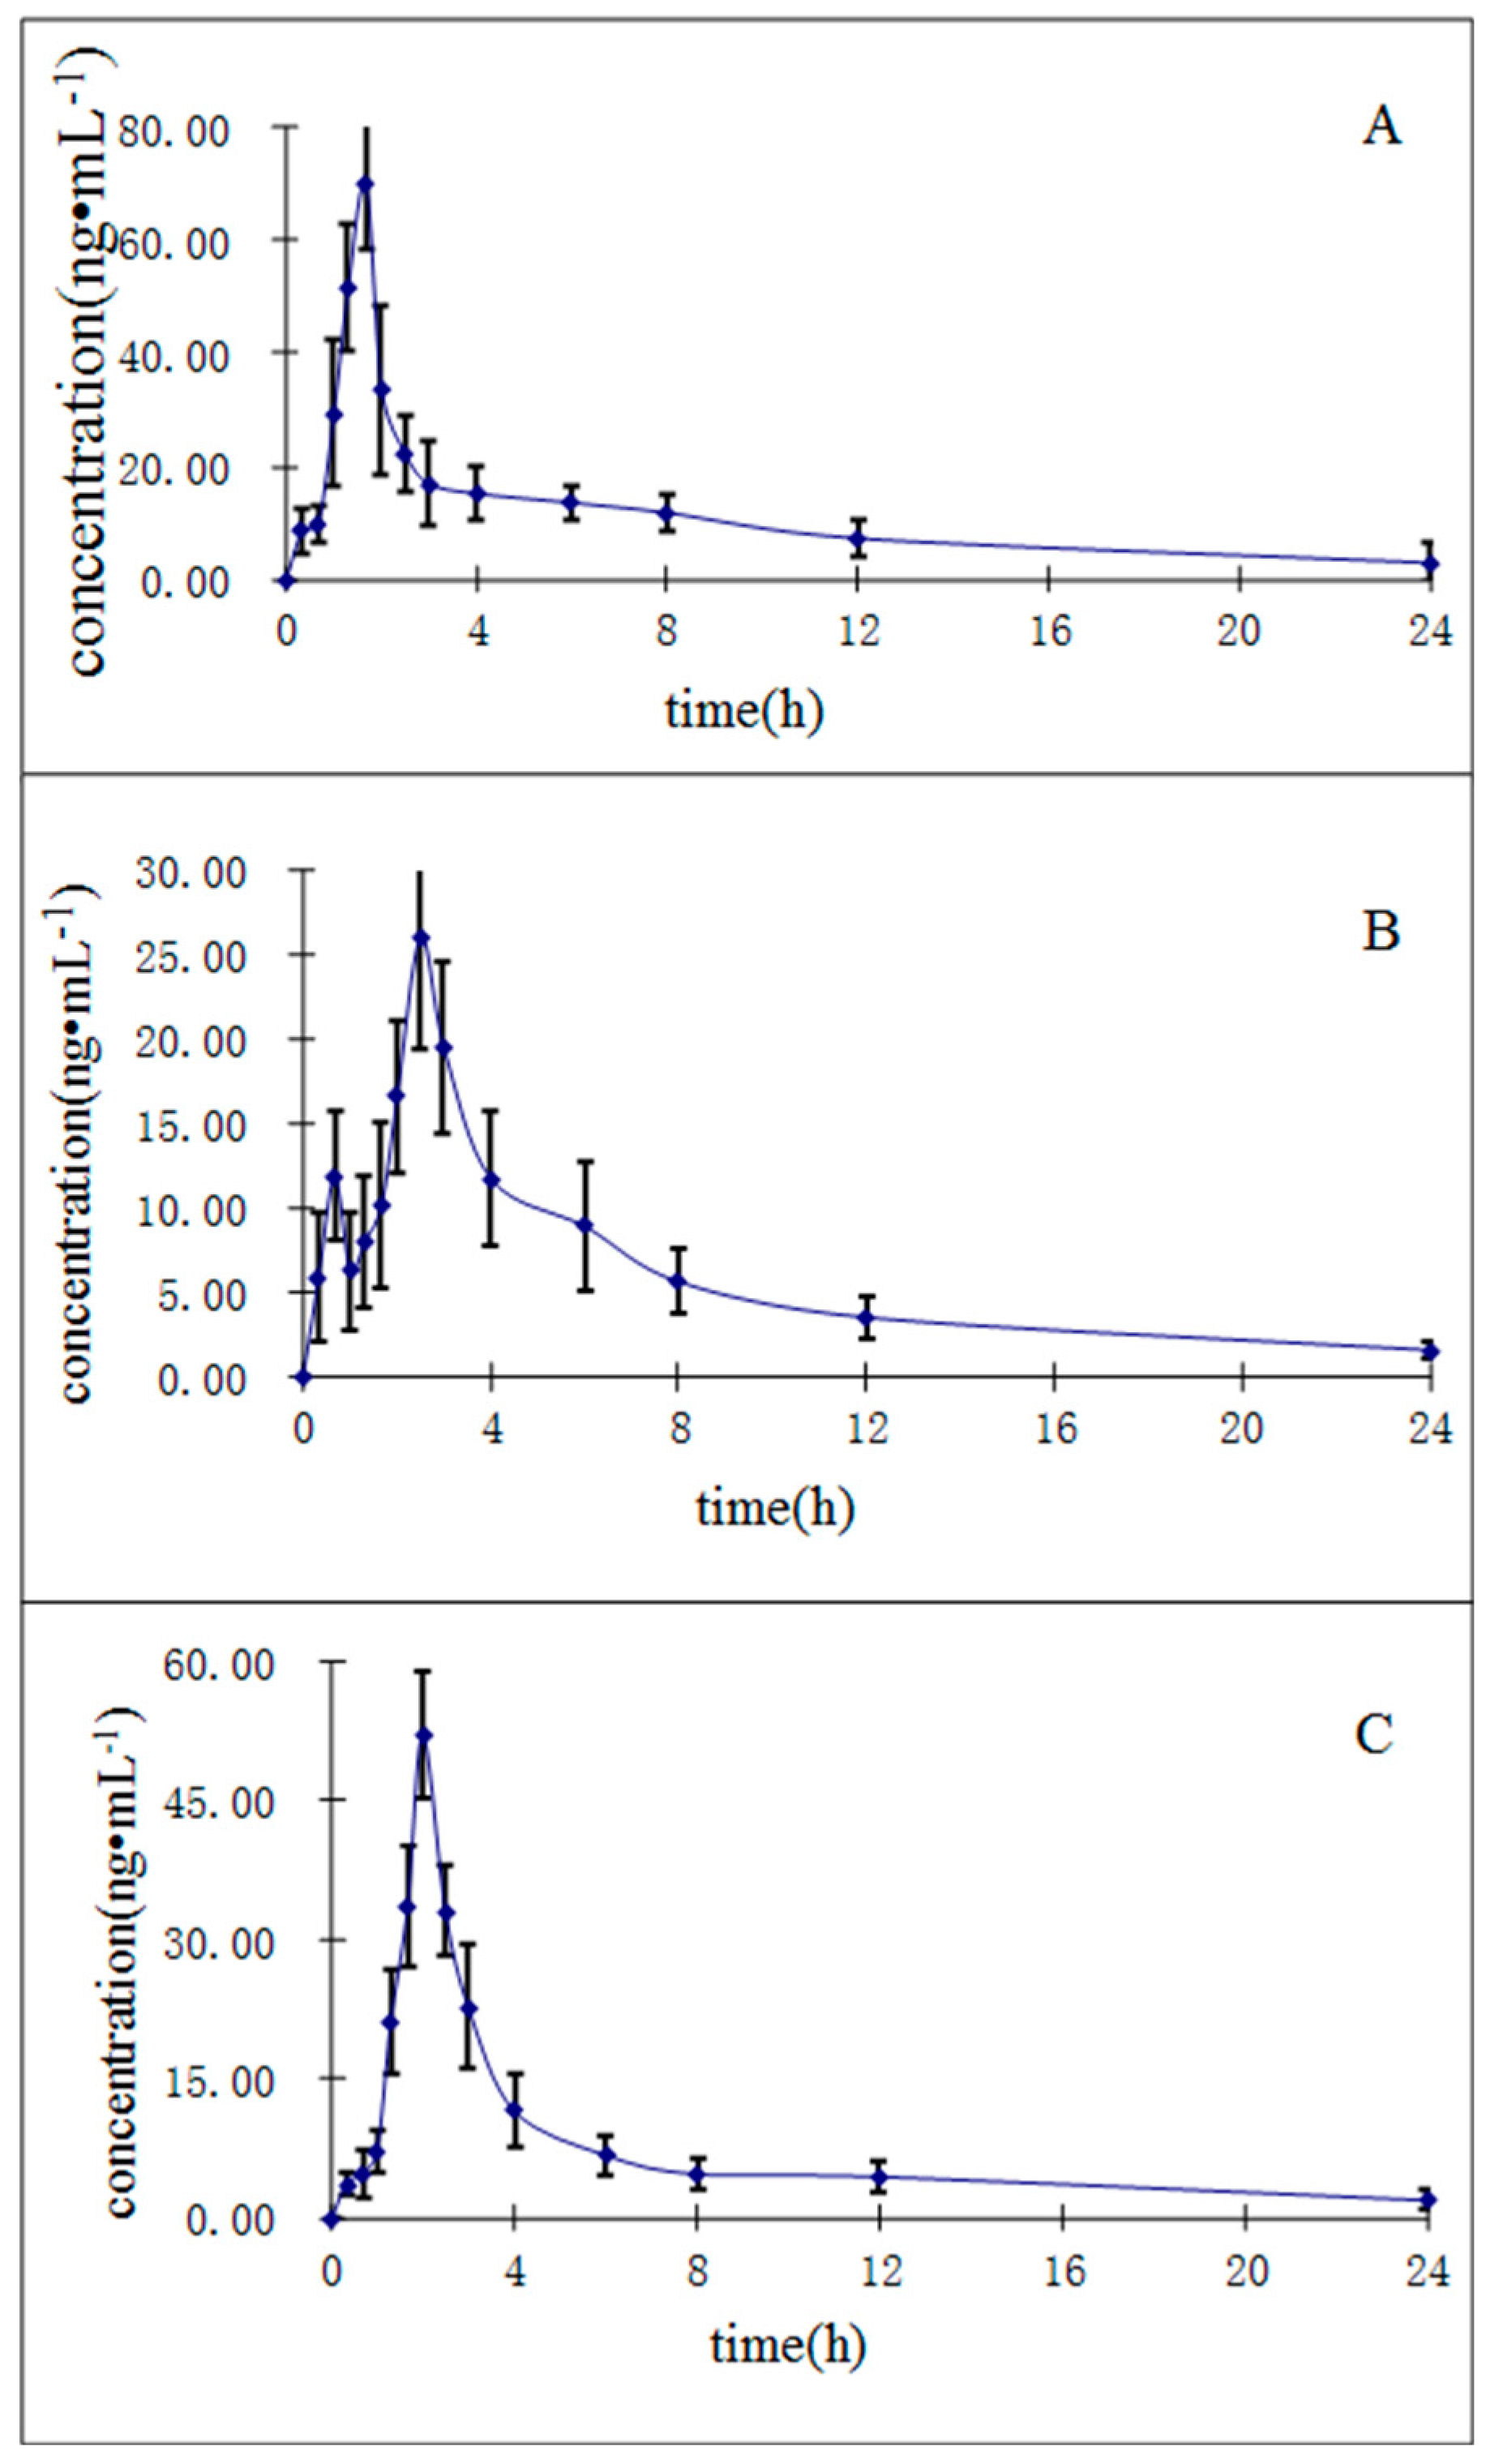
2.3.6. Application to the Pharmacokinetic Study
3. Materials and Methods
3.1. Materials and Reagents
3.2. Instruments and Analytical Conditions
3.3. Preparation of R. Cordifolia Extract
3.4. Preparation of Calibration Standards and Quality Control (QC) Samples
3.5. Animal Experiments
3.6. Plasma Sample Preparation
3.7. Method Validation
3.7.1. Specificity and Selectivity
3.7.2. Linearity and Lower Limits of Quantification (LLOQ)
3.7.3. Precision and Accuracy
3.7.4. Extraction Recovery and Matrix Effect
3.7.5. Stability Experiments
3.8. Application to Pharmacokinetic Study
4. Conclusions
Acknowledgments
Author Contributions
Conflicts of Interest
References
- Huang, M.B.; Zhao, S.M.; Zeng, G.Z.; Kuang, B.; Chen, X.Q.; Tan, N.H. Rubischumanins A–C, new cytotoxic cyclopeptides from Rubia schumanniana. Tetrahedron 2014, 70, 7627–7631. [Google Scholar] [CrossRef]
- China Pharmacopoeia Committee. Pharmacopoeia of the People’s Republic of China; China Chemical Industry Press: Beijing, China, 2015; p. 234. [Google Scholar]
- Zhao, S.M.; Wang, Z.; Zeng, G.Z.; Song, W.W.; Chen, X.Q.; Li, X.N.; Tan, N.H. New Cytotoxic Naphthohydroquinone Dimers from Rubia alata. Org. Lett. 2014, 16, 5576–5579. [Google Scholar] [CrossRef] [PubMed]
- Shan, M.Q.; Chen, X.; Li, J.; Yu, B.; Ding, A.W. Comparative study on effects of Rubiae Radix et Rhizoma and carbonized Rubiae Radix et Rhizoma on acute blood stasis rat model. Zhongguo Zhong Yao Za Zhi 2014, 39, 493–497. [Google Scholar] [PubMed]
- Lee, J.E.; Hitotsuyanaqi, Y.; Fukaya, H.; Kondo, K.; Takeya, K. New cytotoxic bicyclic hexapeptides, RA-XXIII and RA-XXIV, from Rubia cordifolia L. Chem. Pharm. Bull. Tokyo 2008, 56, 730–733. [Google Scholar] [CrossRef] [PubMed]
- Alexandr, J.; Ladislav, C.; Jan, C.; Bohumil, K.; Petr, S.; Vladimır, H. Crystal structures of mollugin and lucidin. Chem. Crystallogr. 2005, 35, 621–627. [Google Scholar]
- Zhang, L.; Wang, H.; Zhu, J.; Xu, J.; Ding, K. Mollugin induces tumor cell apoptosis and autophagy via the PI3K/AKT/mTOR/p70S6K and ERK signaling pathways. Biochem. Biophys. Res. Commun. 2014, 450, 561–567. [Google Scholar] [CrossRef] [PubMed]
- Shilpa, P.N.; Sivaramakrishnan, V.; Niranjali Devaraj, S. Induction of apoptosis by methanolic extract of Rubia cordifolia Linn in HEp-2 cell line is mediated by reactive oxygen species. Asian Pac. J. Cancer Prev. 2012, 13, 2753–2758. [Google Scholar] [CrossRef] [PubMed]
- Singh, R.; Geetanjali; Chauhan, S.M.S. 9,10-Anthraquinones and Other Biologically Active Compounds from the Genus Rubia. Chem. Biodivers. 2004, 1, 1241–1242. [Google Scholar] [CrossRef] [PubMed]
- Zengin, G.; Degirmenci, N.S.; Alpsoy, L.; Aktumsek, A. Evaluation of antioxidant, enzyme inhibition, and cytotoxicc activity of three anthraquinones (alizarin, purpurin, and quinizarin). Hum. Exp. Toxicol. 2016, 35, 544–553. [Google Scholar] [CrossRef] [PubMed]
- Lee, Y.M.; Auh, Q.S.; Lee, D.W.; Kim, J.Y.; Jung, H.J.; Lee, S.H.; Kim, E.C. Involvement of Nrf2-Mediated Upregulation of Heme Oxygenase-1 in Mollugin-Induced Growth Inhibition and Apoptosis in Human Oral Cancer Cells. Bio. Med. Res. Int. 2013, 36, 399–406. [Google Scholar] [CrossRef] [PubMed]
- Zhu, Z.G.; Jin, H.; Yu, P.J.; Tian, Y.X.; Zhang, J.J.; Wu, S.G. Mollugin inhibits the inflammatory response in lipopolysaccharide-stimulated RAW264.7 macrophages by blocking the Janus kinase-signal transducers and activators of transcription signaling pathway. Biol. Pharm. Bull. 2013, 36, 399–406. [Google Scholar] [CrossRef] [PubMed]
- Cai, Y.; Sun, M.; Xing, J.; Corke, H. Antioxidant Phenolic Constituents in Roots of Rheum officinale and Rubia cordifolia: Structure-Radical Scavenging Activity Relationships. J. Agric. Food Chem. 2004, 52, 7884–7890. [Google Scholar] [CrossRef] [PubMed]
- Park, H.; Shim, J.S.; Kim, B.S.; Jung, H.J.; Huh, T.L.; Kwon, H.J. Purpurin inhibits adipocyte-derived leucine aminopeptidase and angiogenesis in a zebrafish model. Biochem. Biophys. Res. Commun. 2014, 450, 561–567. [Google Scholar] [CrossRef] [PubMed]
- Tsang, P.W.; Bandara, H.M.; Fong, W.P. Purpurin suppresses Candida albicans biofilm formation and hyphal development. PLoS ONE 2012, 11, e50866. [Google Scholar] [CrossRef] [PubMed]
- Li, F.R.; Luo, S.Z.; Luo, S.H.; Wang, H. Ultra fast liquid chromatog-raphy (UFLC) determination of rubimaillin in Chinese herbalpieces of Rubia cordifolia L. Chin. Tradit. Herbal Drugs 2010, 41, 2087–2089. [Google Scholar]
- Lin, W.H.; Zhu, X.M.; Yan, P.; Zhan, R.Y.; Pan, H.F.; Liu, C.T.; Zhang, J. Experiment Research on Optimization of Determination Method for Rubimaillin and Purpurin in Radix Rubiae. Tradit. Chin. Drug Res. Clin.Pharmacol. 2014, 25, 345–348. [Google Scholar]
- Li, X.; Chen, S.Z.; Suo, F.Y.; Yang, B. HPLC determination of rubimaillin in Chinese herbalpieces of Radixet Rhizoma Rubiae. Chin. J. Pharm. Anal. 2009, 29, 363–366. [Google Scholar]
- Yang, H.S.; Wang, J.; Guo, C.; Liu, W.; Chen, Y.Y.; Wei, J.F.; Kang, W.Y. Simultaneous determination of alizarin and rubimaillin in Rubia cordifolia by ultrasound-assisted ionic liquid-reversed phase liquid chromatography. Chin. Mater. Med. 2015, 40, 2617–2623. [Google Scholar]
- Derksena, G.C.; Niederlander, H.A.; van Beek, T.A. A nalysis of anthraquinones in Rubia tinctorum L. by liquidchromatography coupled with diode-array UV and massspectrometric detection. Chromatogr. A 2002, 978, 119–127. [Google Scholar] [CrossRef]
- Liu, L.; Yu, X.L.; Wang, Z.B.; Sun, J.H.; Pan, R.; Yang, C.J.; Wu, L.J. Simultaneous determination and pharmacokinetics of five alkaloids in rat plasma by Ultra High Performance Liquid Chromatography with Tandem Mass Spectrometry after the oral administration of Corydalis bungeana Turcz extract. J. Sep. Sci. 2016, 39, 296–305. [Google Scholar] [CrossRef] [PubMed]
- Liang, Y.; Wu, J.L.; Leung, E.L.; Zhou, H.; Liu, Z.Q.; Yan, G.Q.; Liu, Y.; Liu, L.; Li, N. Identification of Oxygenated Fatty Acid as a Side Chain of Lipo-Alkaloids in Aconitum carmichaelii by UHPLC-Q-TOF-MS and a Database. Molecules 2016, 21, 437. [Google Scholar] [CrossRef] [PubMed]
- Gu, W.Y.; Li, N.; Leung, E.L.; Zhou, H.; Luo, G.A.; Liu, L.; Wu, J.L. Metabolites software-assisted flavonoid hunting in plants using ultra-high performance liquid chromatography-quadrupole-time of flight mass spectrometry. Molecules 2015, 20, 3955–3971. [Google Scholar] [CrossRef] [PubMed]
- McManu, S.L.; Moloney, M.; Richards, K.G.; Coxon, C.E.; Danaher, M. Determination and occurrence of phenoxyacetic acid herbicides and their transformation products in groundwater using ultra high performance liquid chromatography coupled to tandem mass spectrometry. Molecules 2014, 19, 20627–20649. [Google Scholar] [CrossRef] [PubMed]
- Yang, C.J.; Wang, S.H.; Guo, X.W.; Sun, J.H.; Liu, L.; Wu, L.J. Simultaneous determination of seven anthraquinones in rat plasma by Ultra High Performance Liquid Chromatography-Tandem Mass Spectrometry and pharmacokinetic study after oral administration of Semen Cassiae extract. J. Ethnopharmacol. 2015, 169, 305–313. [Google Scholar] [CrossRef] [PubMed]
- Ma, L.Y.; Zhang, Y.B.; Zhou, Q.L.; Yang, Y.F.; Yang, X.W. Simultaneous determination of eight ginsenosides in rat plasma by liquid chromatography-electrospray ionization tandem mass spectrometry: Application to their pharmacokinetics. Molecules 2015, 20, 21597–21608. [Google Scholar] [CrossRef] [PubMed]
- Yang, N.; Sun, Q.; Xu, Z.; Wang, X.; Zhao, X.; Cao, Y.; Chen, L.; Fan, G. LC-ESI-MS/MS analysis and pharmacokinetics of GP205, an innovative potent macrocyclic inhibitor of hepatitis C virus NS3/4A protease in rats. Molecules 2015, 20, 4319–4336. [Google Scholar] [CrossRef] [PubMed]
- Guidance for Industry, Bioanalytical Method Validation. Available online: http://www.fda.gov/downloads/Drugs/Guidance Compliance Regulatory Information/Guidances/UCM368107 (accessed on 6 September 2013).
- Sample Availability: Samples of the compounds purpurin, munjistin, and mollugin are available from the authors.


| Analyte | Precursor Ion, m/z | Product Ion, m/z | Qualifier Ion, m/z | Fragment, V | Collision Energy, V | Cell Accelerator Voltage, V | Polarity |
|---|---|---|---|---|---|---|---|
| Purpurin | 274.1 | 70.1 | 88.1 | 151 | 31 | 5 | positive |
| Munjistin | 284.3 | 57.0 | 71.9 | 156 | 32 | 5 | positive |
| Mollugin | 285.0 | 252.9 | 224.8 | 101 | 8 | 5 | positive |
| Bifendate | 418.9 | 342.8 | 284.8 | 78 | 18 | 5 | positive |
| Compounds | Regression Equation | R2 | Linear Range (ng/mL) | LLOQ (ng/mL) |
|---|---|---|---|---|
| Purpurin | Y = 3.458 × 10³X + 12.73 | 0.9927 | 0.264–264 | 0.264 |
| Munjistin | Y = 3.067 × 10³X + 4.827 | 0.9979 | 0.515–515 | 0.515 |
| Mollugin | Y = 9.599X + 4.826 | 0.9939 | 2.45–2450 | 2.45 |
| Compounds | Spiked Concentration (ng/mL) | Measured Concentration (ng/mL) | Accuracy (%) | Intra-Day Precision (%) | Inter-Day Precision (%) |
|---|---|---|---|---|---|
| Purpurin | 0.264 | 0.256 ± 0.02 | −2.9 | 6.0 | 14.2 |
| 0.528 | 0.50 ± 0.07 | −5.10 | 14.00 | 12.09 | |
| 26.4 | 24.5 ± 3.10 | −7.18 | 12.96 | 10.09 | |
| 211 | 242.3 ± 24.3 | 14.75 | 10.54 | 5.07 | |
| Munjistin | 0.515 | 0.503 ± 0.06 | −2.3 | 12.6 | 7.3 |
| 1.03 | 1.17 ± 0.11 | 13.88 | 8.75 | 11.94 | |
| 51.5 | 55.57 ± 2.67 | 7.89 | 4.88 | 4.21 | |
| 412 | 417.1 ± 37.2 | 1.24 | 8.43 | 12.10 | |
| Mollugin | 2.45 | 2.58 ± 0.32 | 5.2 | 13.0 | 7.6 |
| 4.90 | 5.35 ± 0.66 | 9.22 | 12.33 | 12.30 | |
| 245 | 261.7 ± 38.1 | 6.82 | 14.84 | 12.51 | |
| 1960 | 1684 ± 211 | −14.05 | 13.15 | 6.61 |
| Compounds | Spiked Concentration (ng/mL) | Matrix Effect | Extraction Recovery | ||
|---|---|---|---|---|---|
| Mean (%) | RSD (%) | Mean (%) | RSD (%) | ||
| Purpurin | 0.528 | 98.35 | 4.182 | 84.21 | 9.143 |
| 26.40 | 95.14 | 5.012 | 81.30 | 5.667 | |
| 211.0 | 95.43 | 7.447 | 82.63 | 3.884 | |
| Munjistin | 1.030 | 93.74 | 2.720 | 78.87 | 6.317 |
| 51.50 | 92.56 | 9.851 | 83.89 | 6.879 | |
| 412.0 | 99.51 | 4.619 | 83.46 | 2.838 | |
| Mollugin | 4.900 | 98.85 | 5.103 | 84.53 | 8.346 |
| 245.0 | 100.2 | 3.534 | 85.90 | 5.074 | |
| 1960 | 94.53 | 7.476 | 88.96 | 4.090 | |
| I.S. | 2000 | 96.03 | 4.225 | 94.74 | 11.91 |
| Analytes | Spiked Concentration (ng/mL) | Stability (% RE a) | |||
|---|---|---|---|---|---|
| Three Freeze-Thaw | Short-Term | Long-Term | Post-Preparative | ||
| Purpurin | 0.528 | 1.92 | −13.38 | −2.59 | −14.02 |
| 26.4 | −5.35 | −5.35 | −2.68 | −2.00 | |
| 211 | 14.76 | 14.76 | 12.08 | 13.68 | |
| Munjistin | 1.03 | 9.04 | 11.56 | 13.97 | 11.15 |
| 51.5 | 9.46 | 6.73 | 5.56 | 7.04 | |
| 412 | −2.82 | 7.31 | −0.77 | −10.15 | |
| Mollugin | 4.90 | 10.26 | 9.90 | 4.57 | 11.15 |
| 245 | 8.78 | −4.35 | −0.17 | 0.65 | |
| 1960 | −13.17 | −8.69 | −8.55 | 14.38 | |
| Compounds | Cmax (ng/mL) | Tmax (h) | t1/2 (h) | AUC0→t (ng∙h/mL) | AUC0→∞ (ng∙h/mL) |
|---|---|---|---|---|---|
| Purpurin | 70.10 ± 11.78 | 1.61 ± 0.24 | 9.52 ± 2.68 | 205.90 ± 36.12 | 243.16 ± 35.91 |
| Munjistin | 26.09 ± 6.59 | 2.58 ± 0.19 | 9.22 ± 2.75 | 110.31 ± 20.10 | 136.34 ± 21.19 |
| Mollugin | 52.10 ± 6.71 | 1.99 ± 0.21 | 9.02 ± 2.14 | 231.56 ± 57.57 | 296.49 ± 40.88 |
© 2016 by the authors. Licensee MDPI, Basel, Switzerland. This article is an open access article distributed under the terms and conditions of the Creative Commons Attribution (CC-BY) license ( http://creativecommons.org/licenses/by/4.0/).
Share and Cite
Gao, M.; Yang, J.; Wang, Z.; Yang, B.; Kuang, H.; Liu, L.; Wang, L.; Yang, C. Simultaneous Determination of Purpurin, Munjistin and Mollugin in Rat Plasma by Ultra High Performance Liquid Chromatography-Tandem Mass Spectrometry: Application to a Pharmacokinetic Study after Oral Administration of Rubia cordifolia L. Extract. Molecules 2016, 21, 717. https://doi.org/10.3390/molecules21060717
Gao M, Yang J, Wang Z, Yang B, Kuang H, Liu L, Wang L, Yang C. Simultaneous Determination of Purpurin, Munjistin and Mollugin in Rat Plasma by Ultra High Performance Liquid Chromatography-Tandem Mass Spectrometry: Application to a Pharmacokinetic Study after Oral Administration of Rubia cordifolia L. Extract. Molecules. 2016; 21(6):717. https://doi.org/10.3390/molecules21060717
Chicago/Turabian StyleGao, Mingjie, Jing Yang, Zhibin Wang, Bingyou Yang, Haixue Kuang, Lu Liu, Liqian Wang, and Chunjuan Yang. 2016. "Simultaneous Determination of Purpurin, Munjistin and Mollugin in Rat Plasma by Ultra High Performance Liquid Chromatography-Tandem Mass Spectrometry: Application to a Pharmacokinetic Study after Oral Administration of Rubia cordifolia L. Extract" Molecules 21, no. 6: 717. https://doi.org/10.3390/molecules21060717
APA StyleGao, M., Yang, J., Wang, Z., Yang, B., Kuang, H., Liu, L., Wang, L., & Yang, C. (2016). Simultaneous Determination of Purpurin, Munjistin and Mollugin in Rat Plasma by Ultra High Performance Liquid Chromatography-Tandem Mass Spectrometry: Application to a Pharmacokinetic Study after Oral Administration of Rubia cordifolia L. Extract. Molecules, 21(6), 717. https://doi.org/10.3390/molecules21060717