
Exotic Vegetable Oils for Cosmetic O/W Nanoemulsions: In Vivo Evaluation

 ,
,
Abstract
:1. Introduction
2. Results and Discussion
2.1. Preparation of Nanoemulsions
2.2. Physicochemical Characterization
2.2.1. Granulometry (Diameter Mean Size)
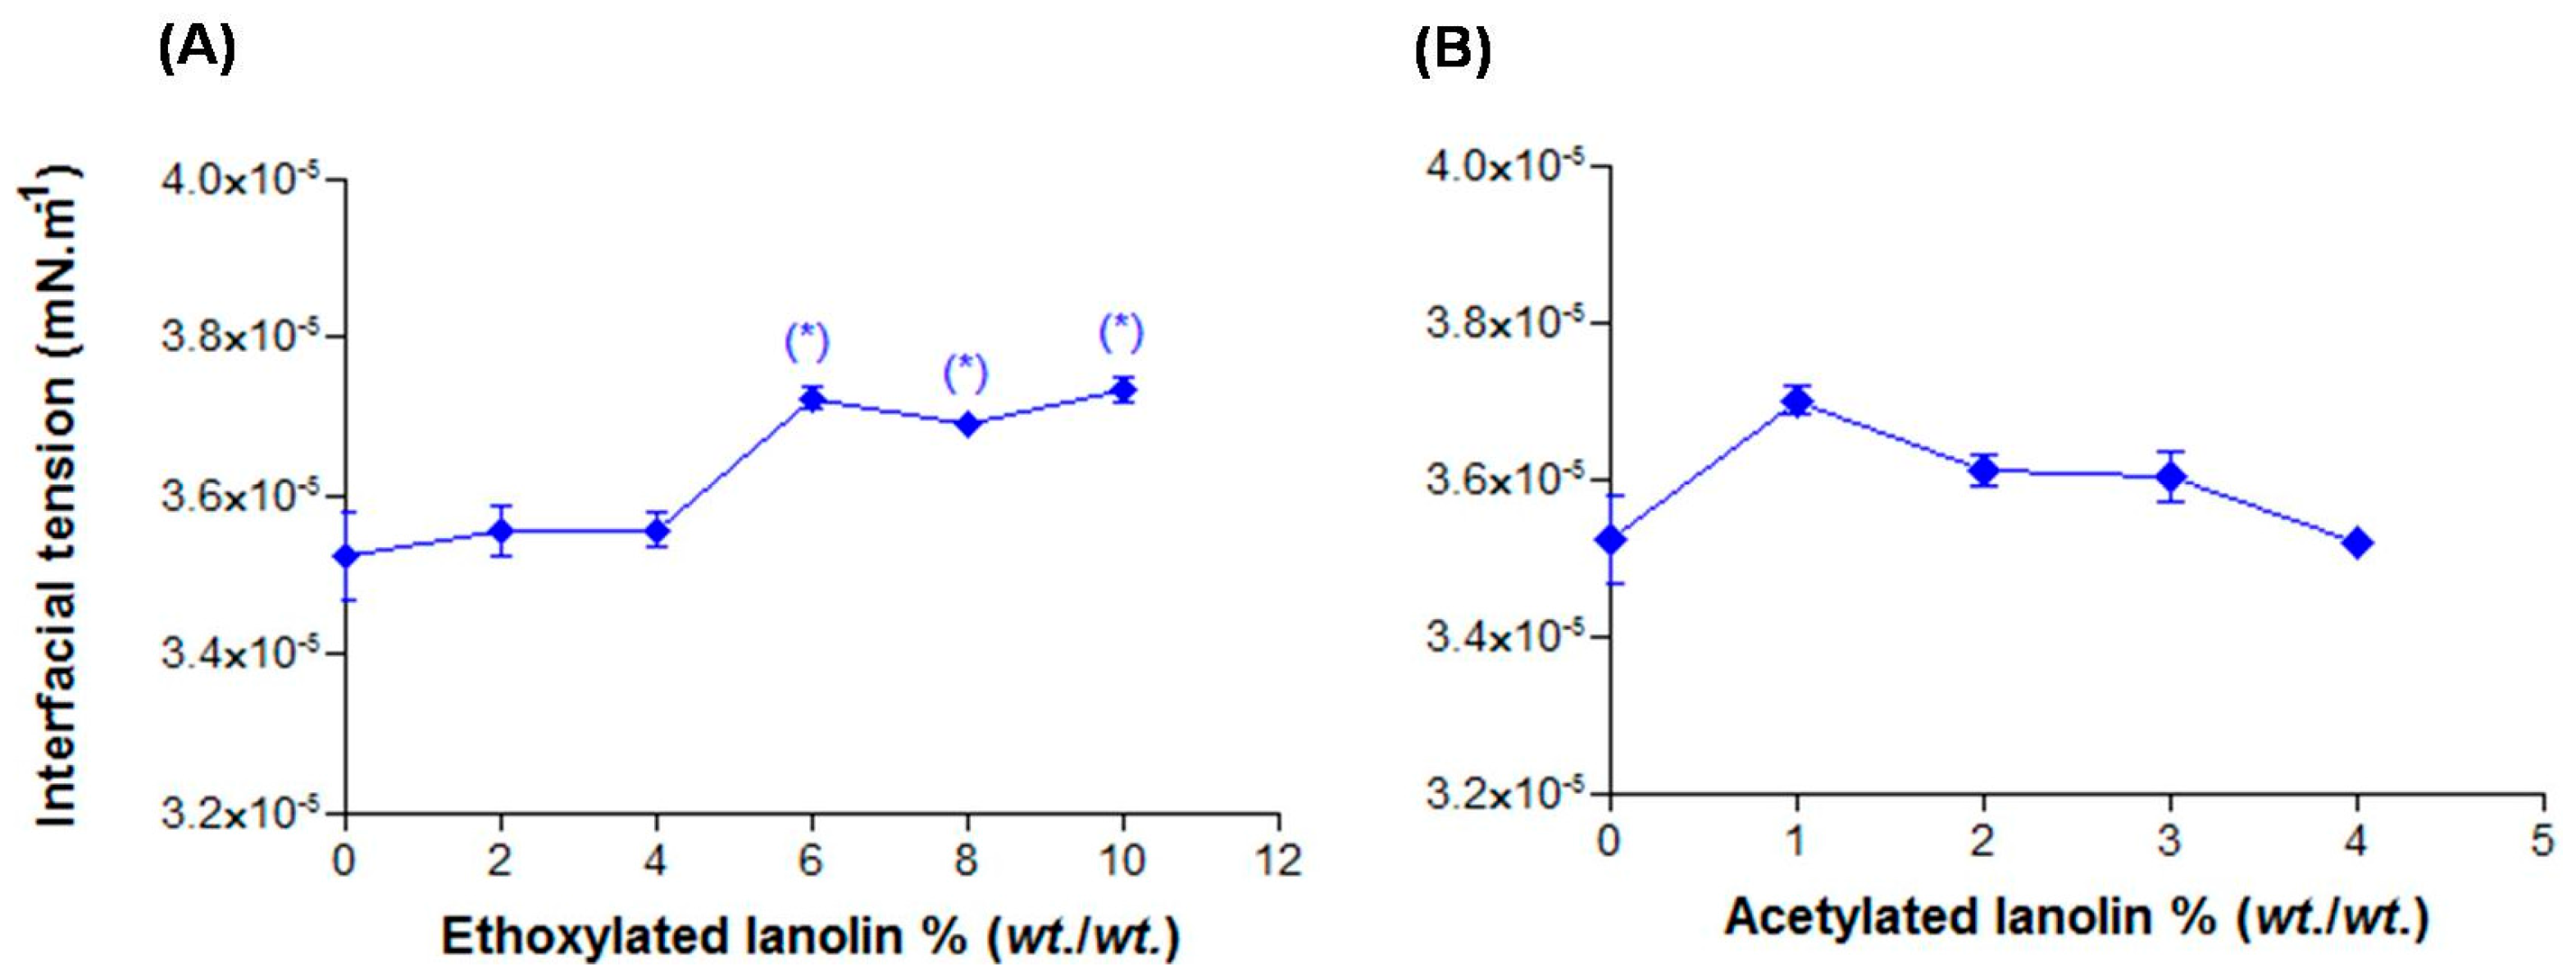
2.2.2. Interfacial Tension
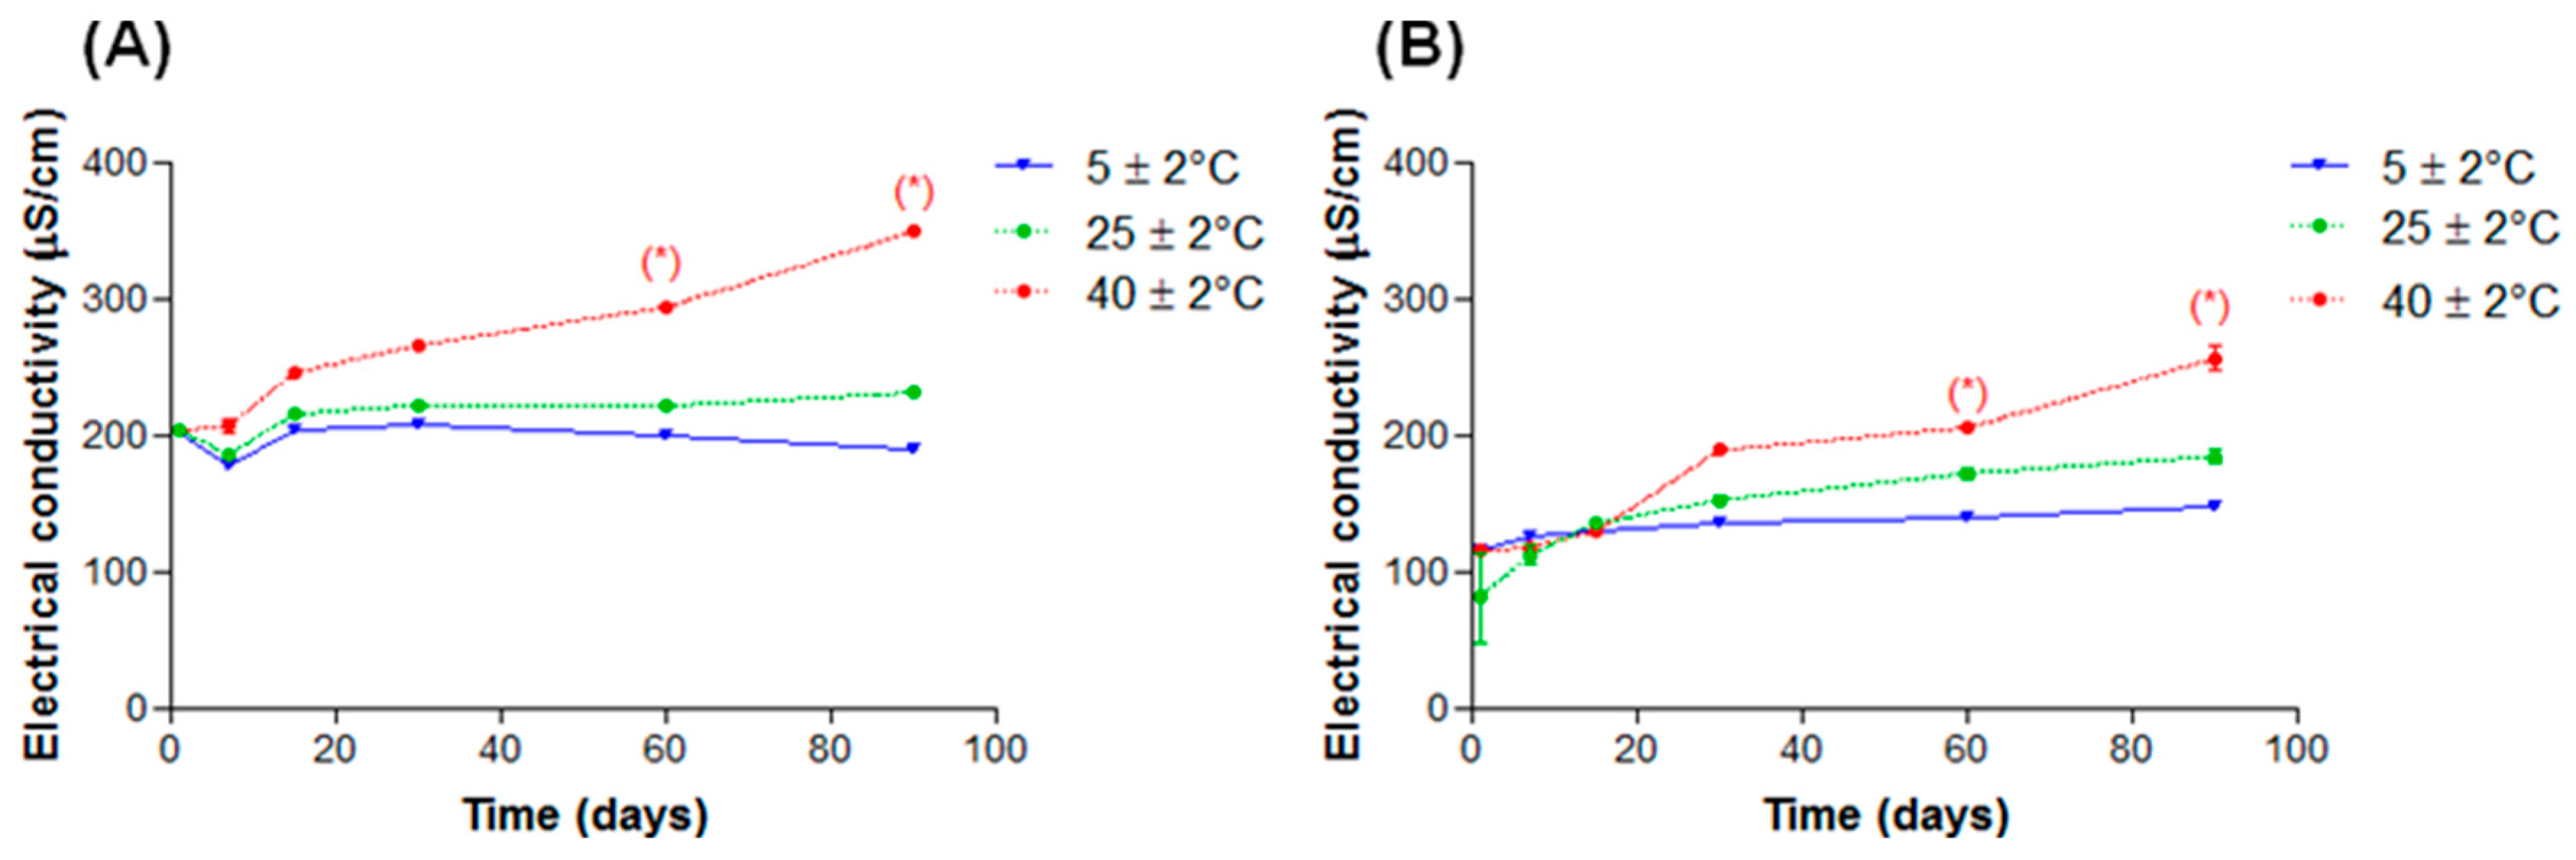
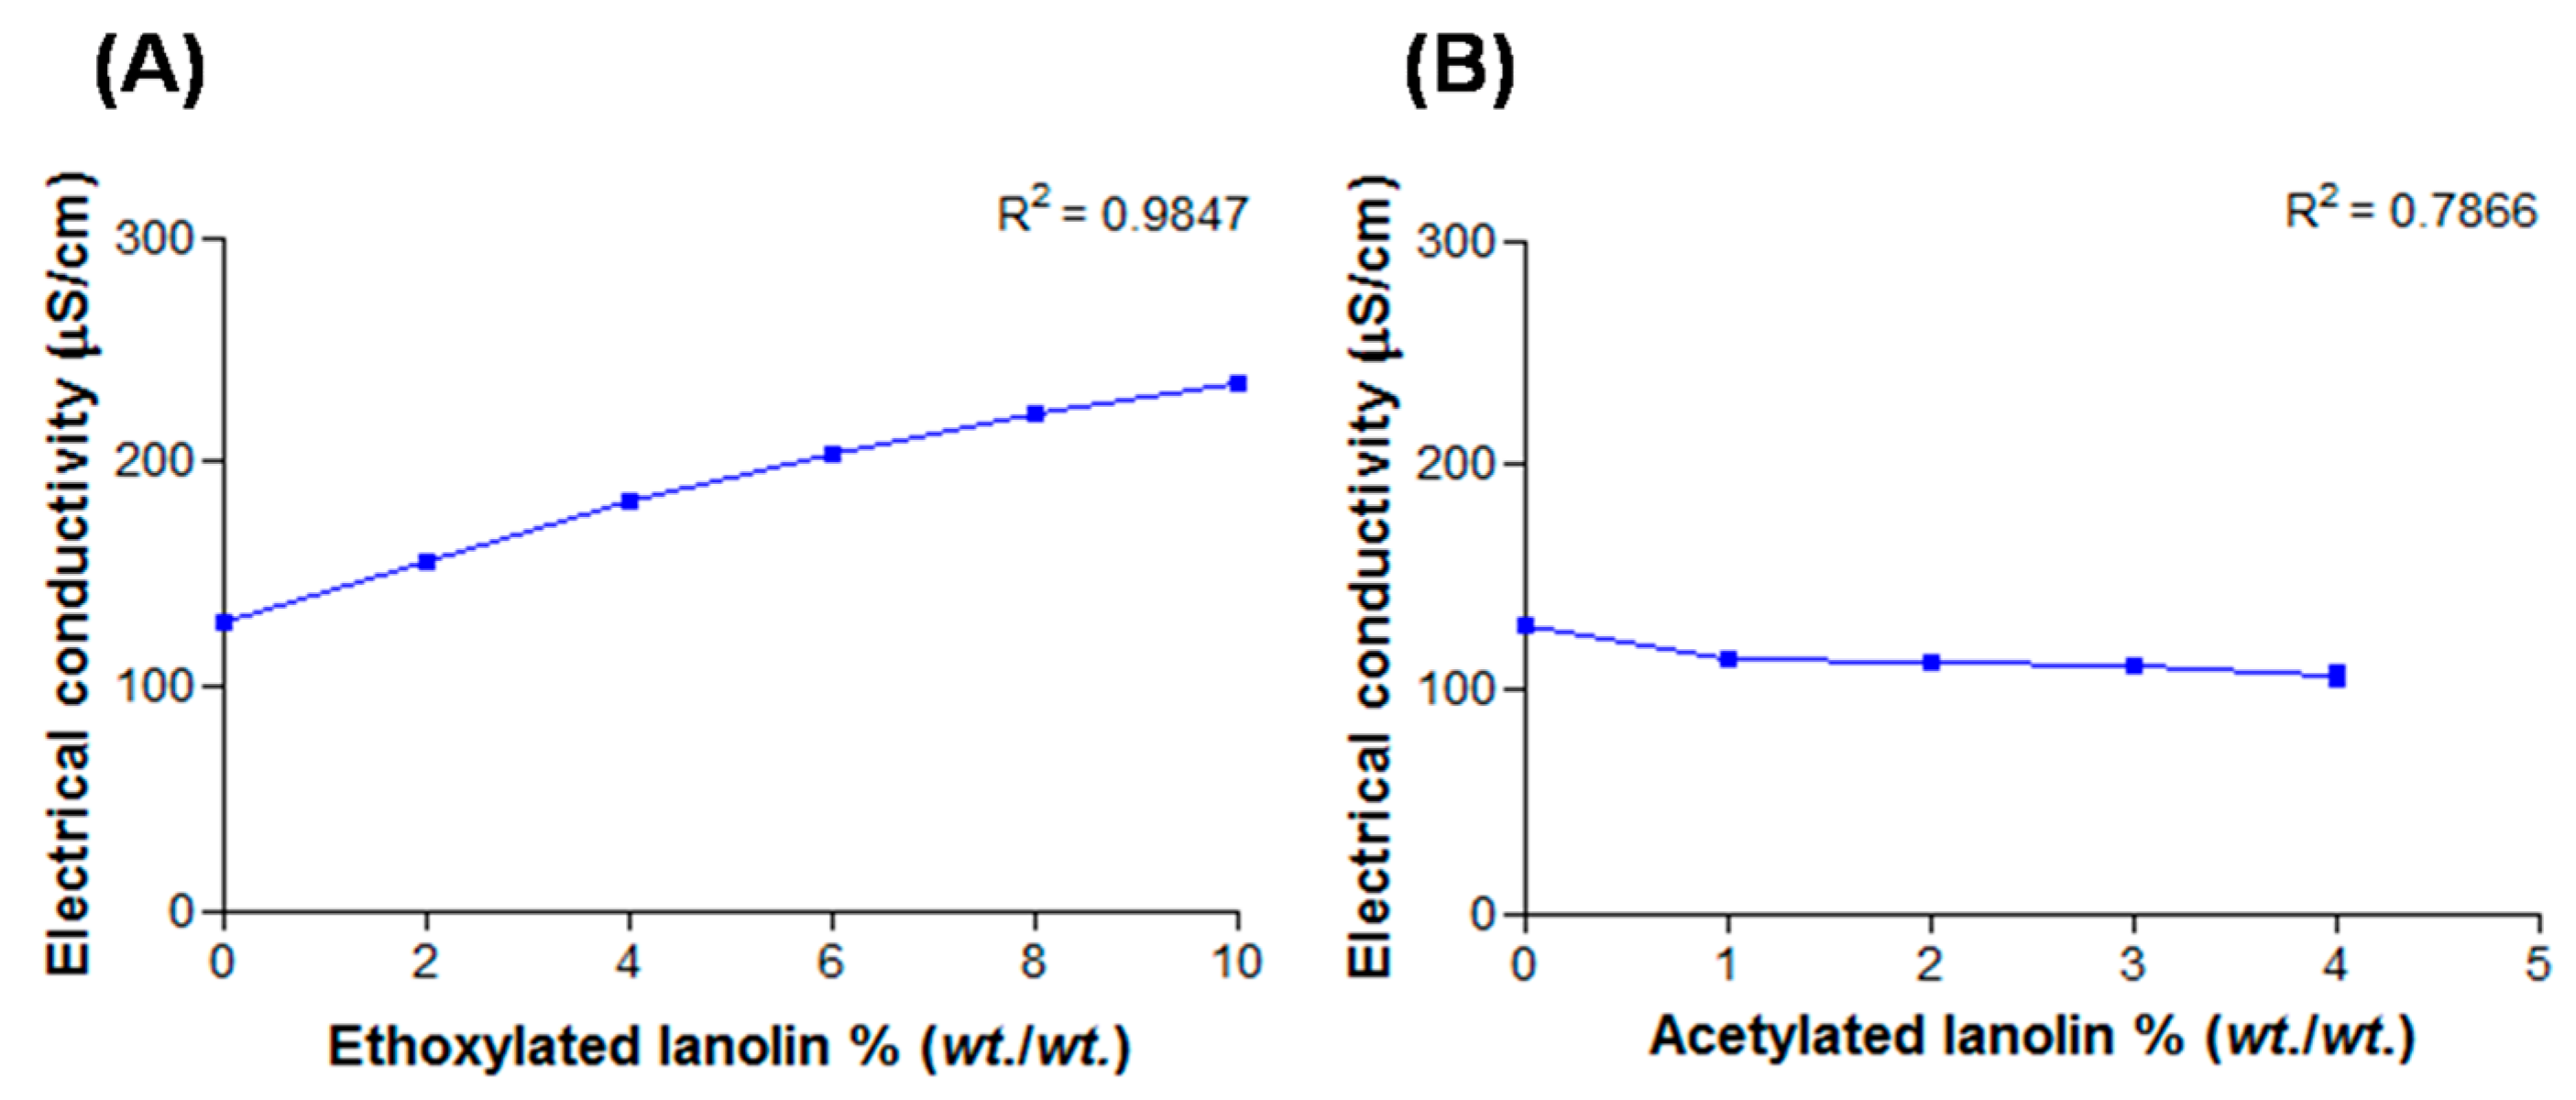
2.2.3. Electrical Conductivity
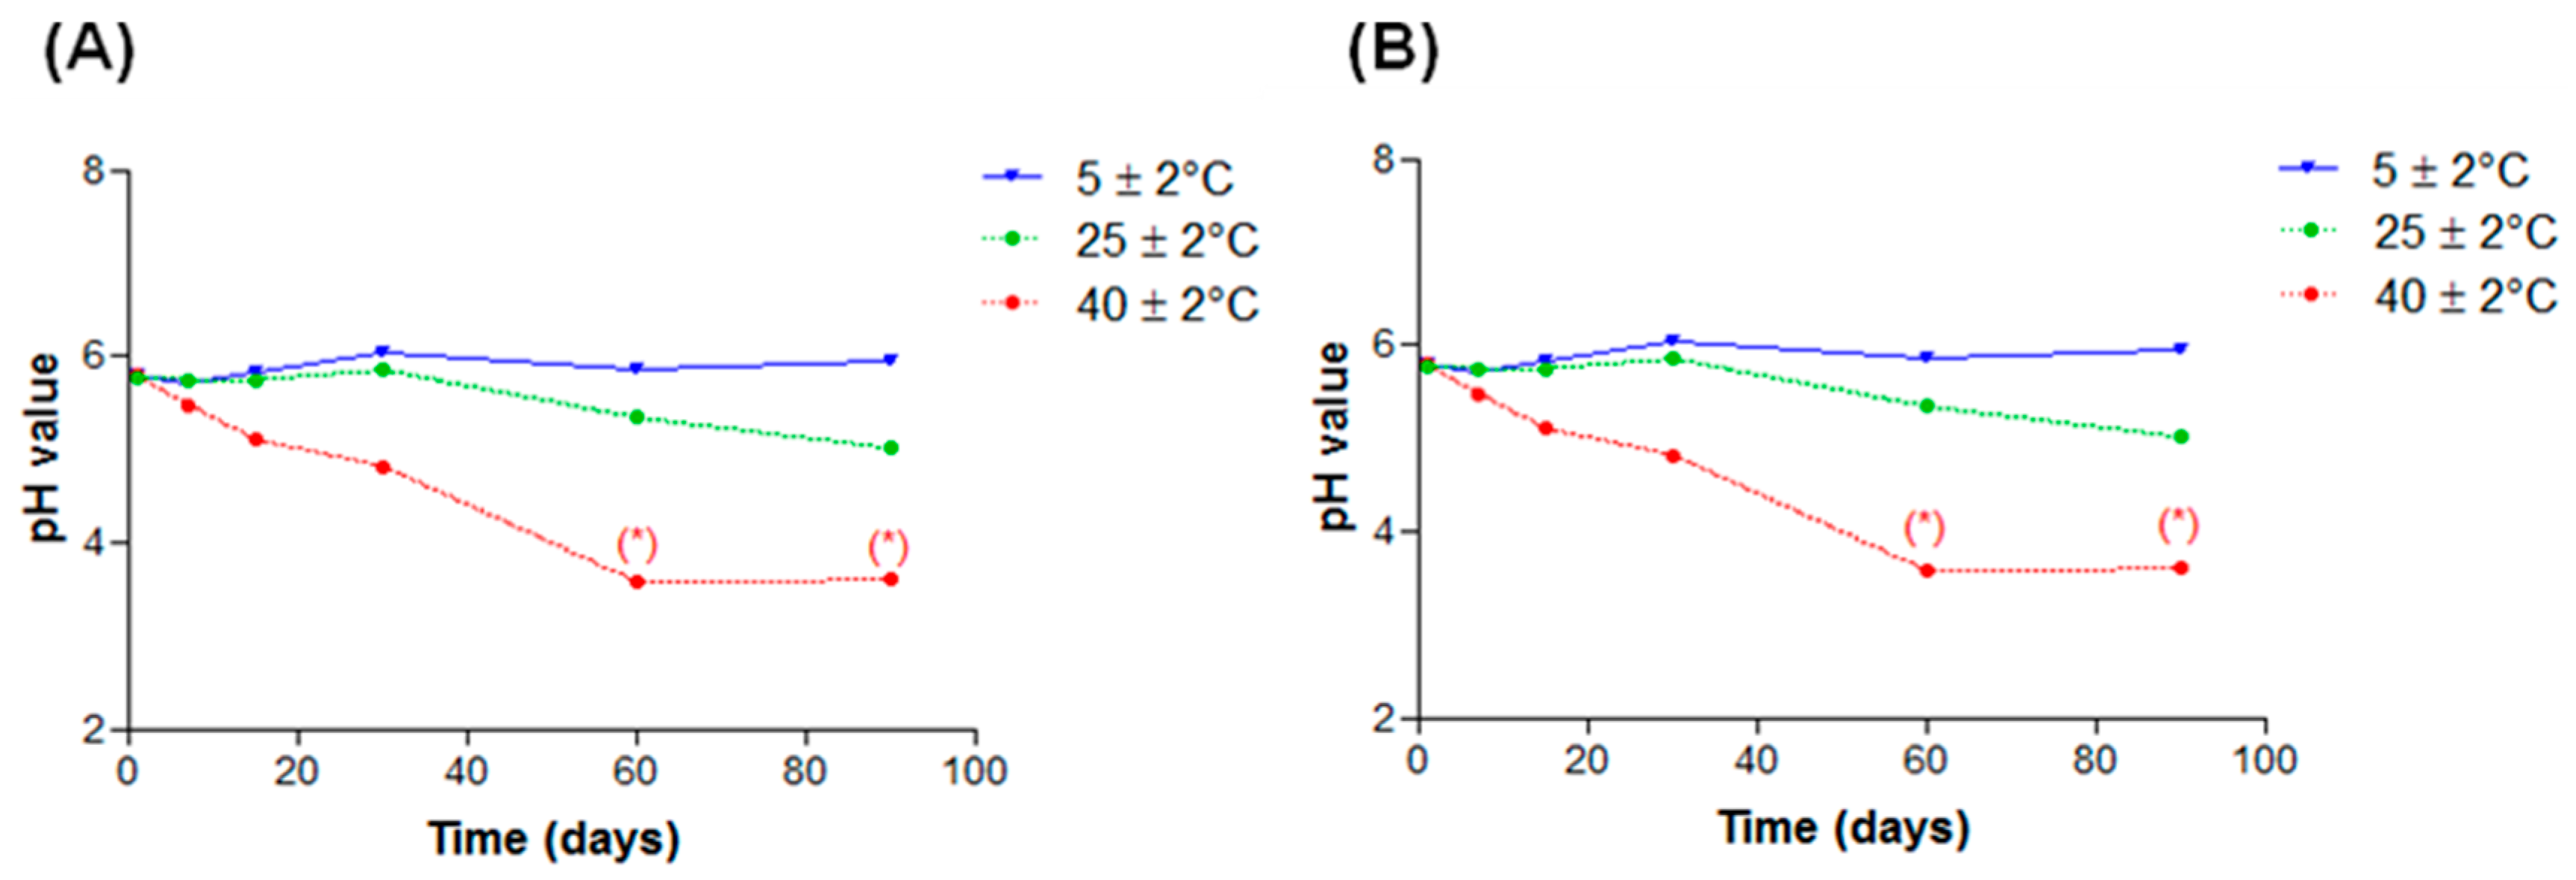
2.2.4. pH Values
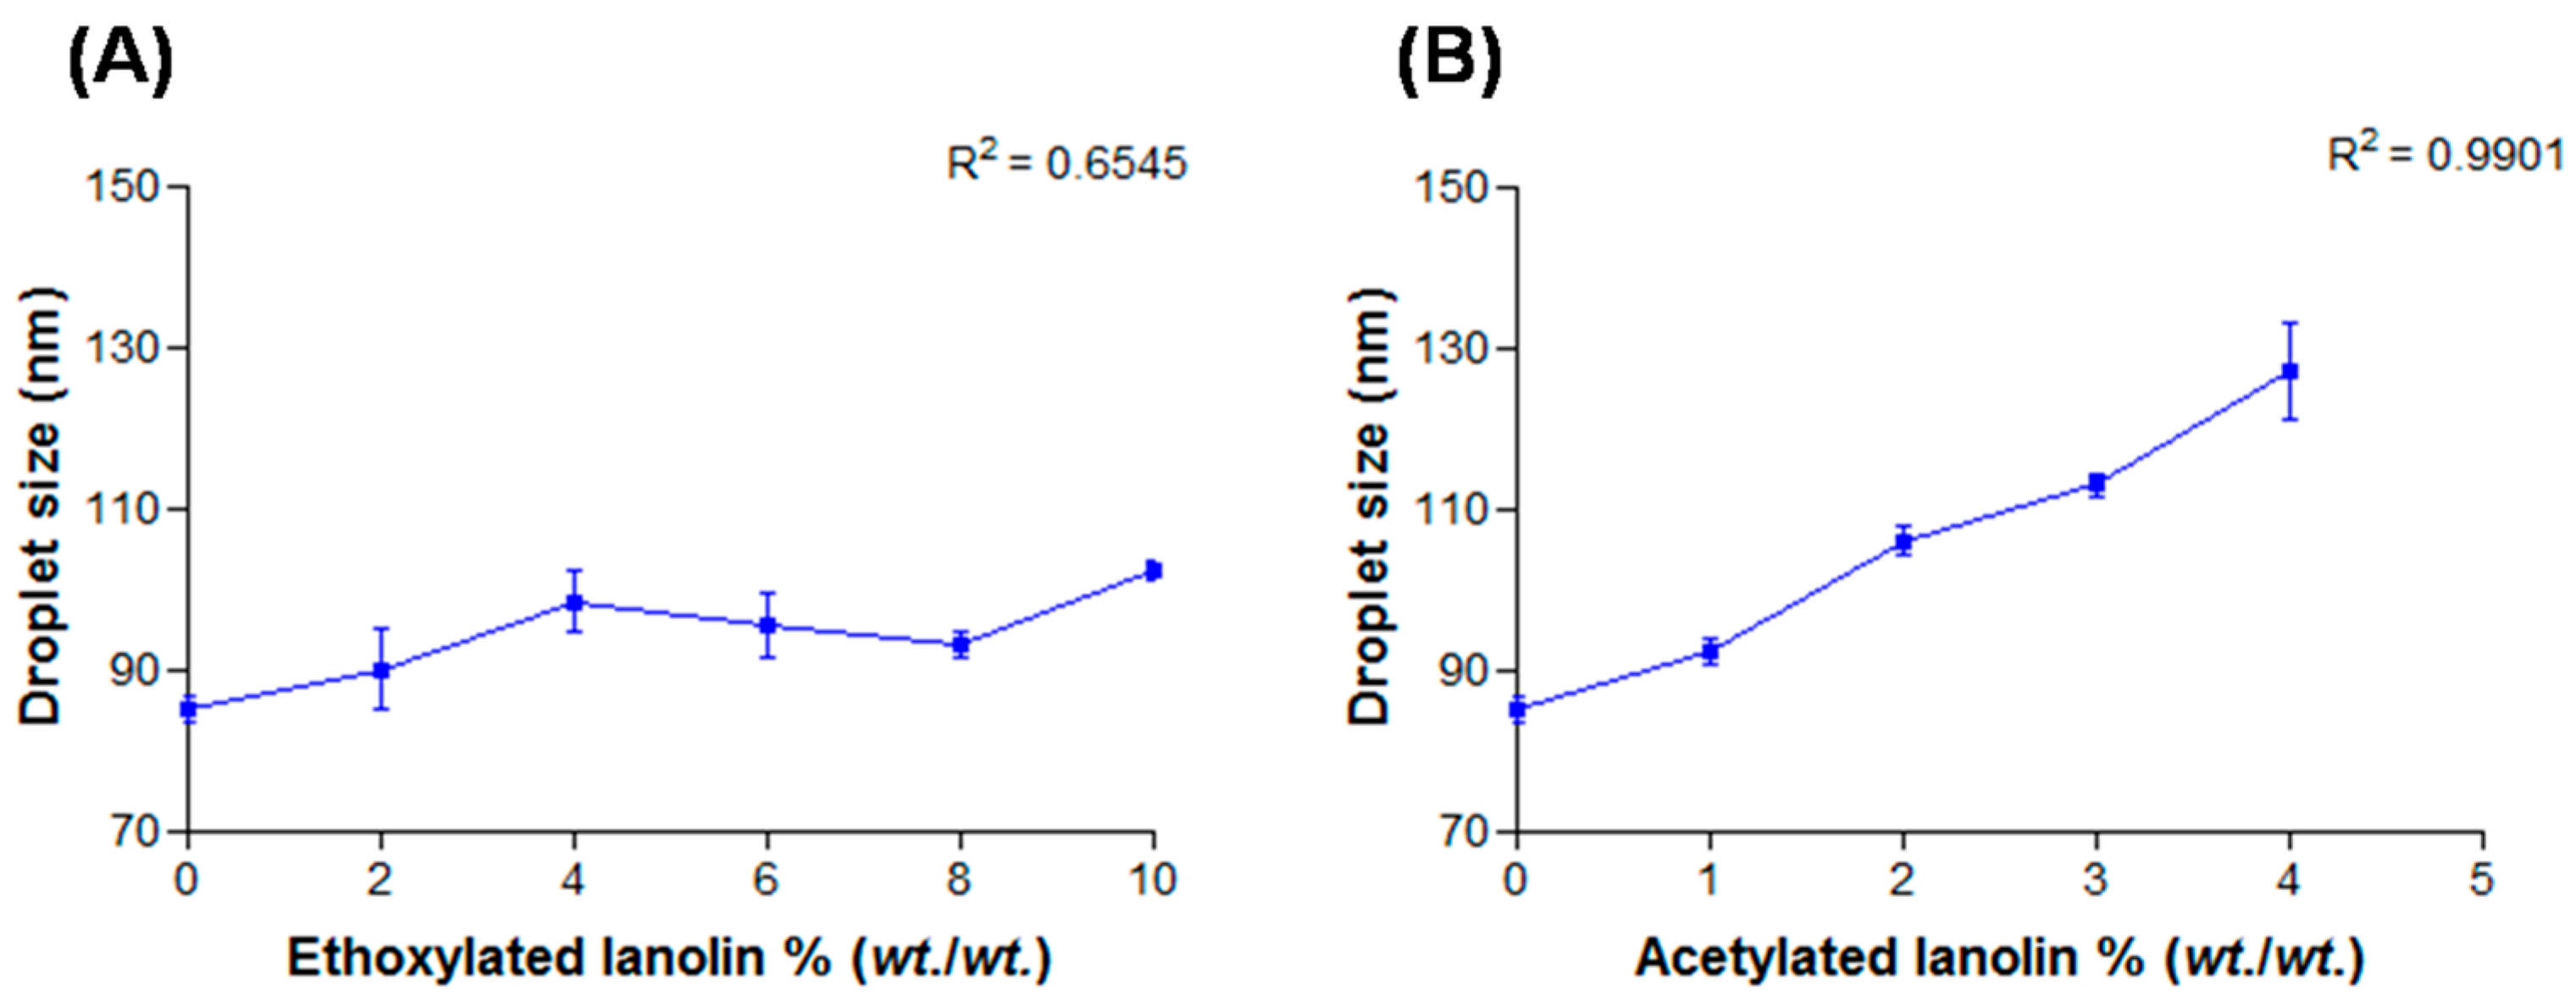
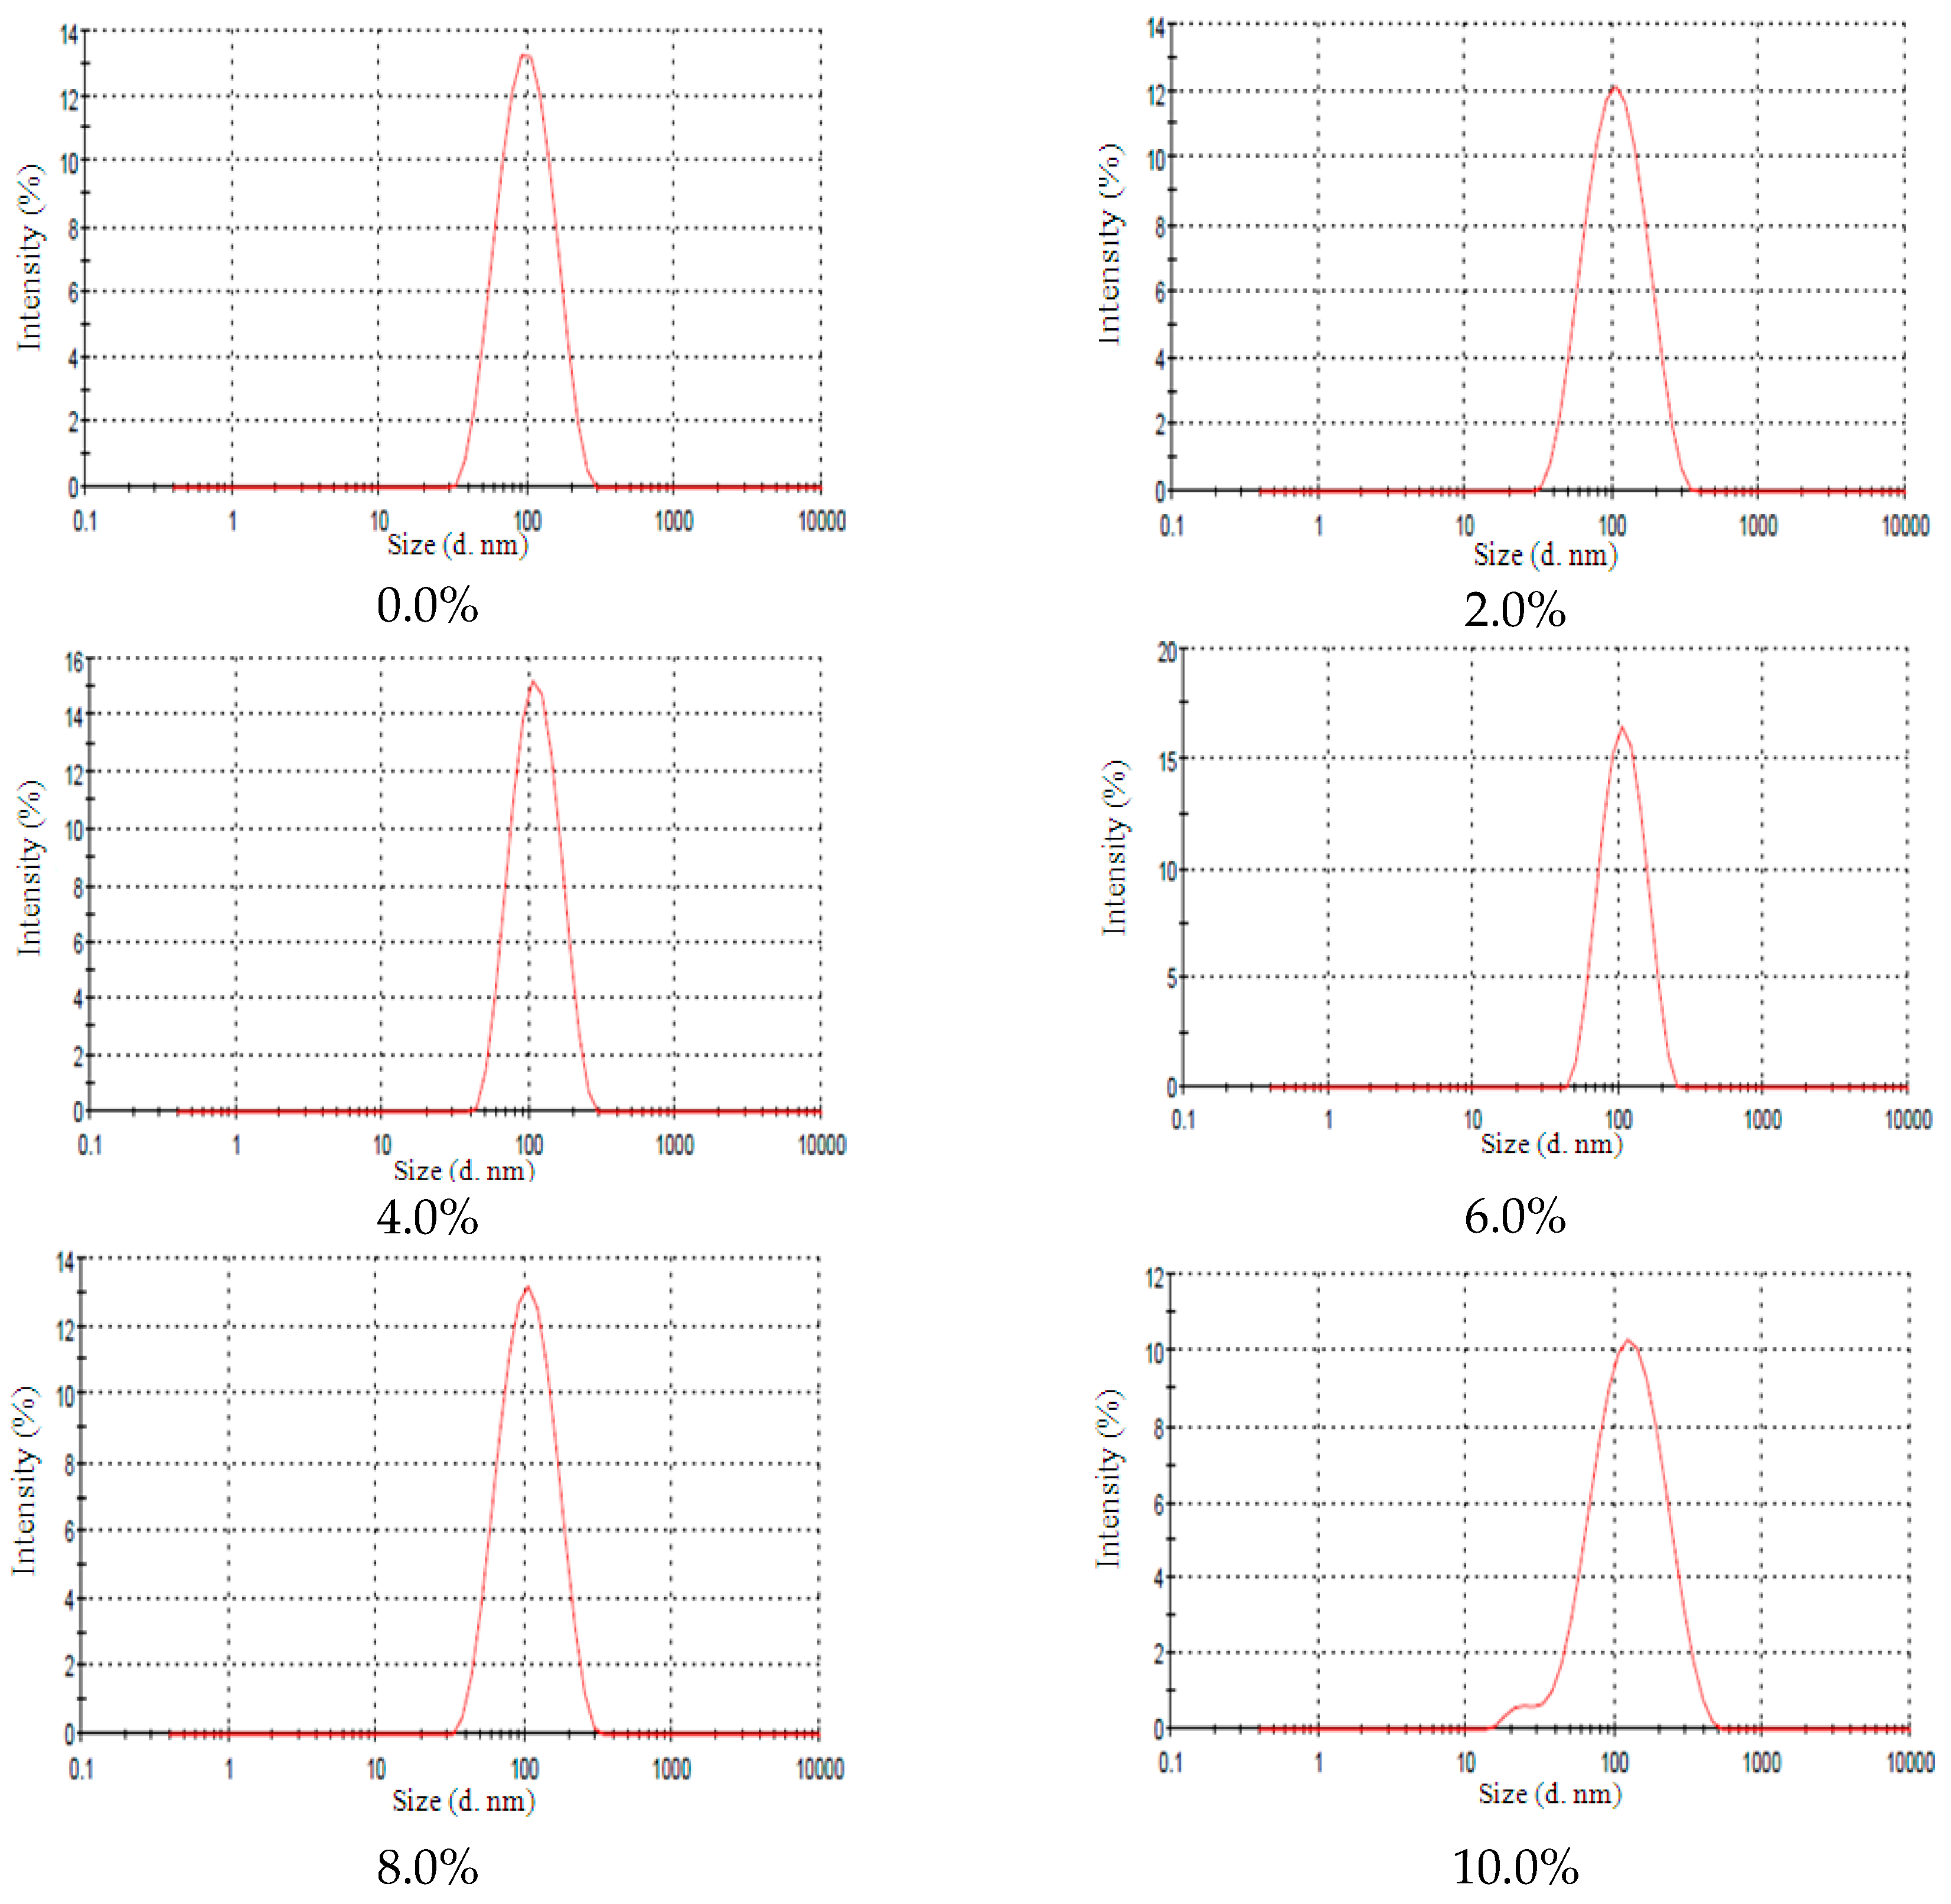
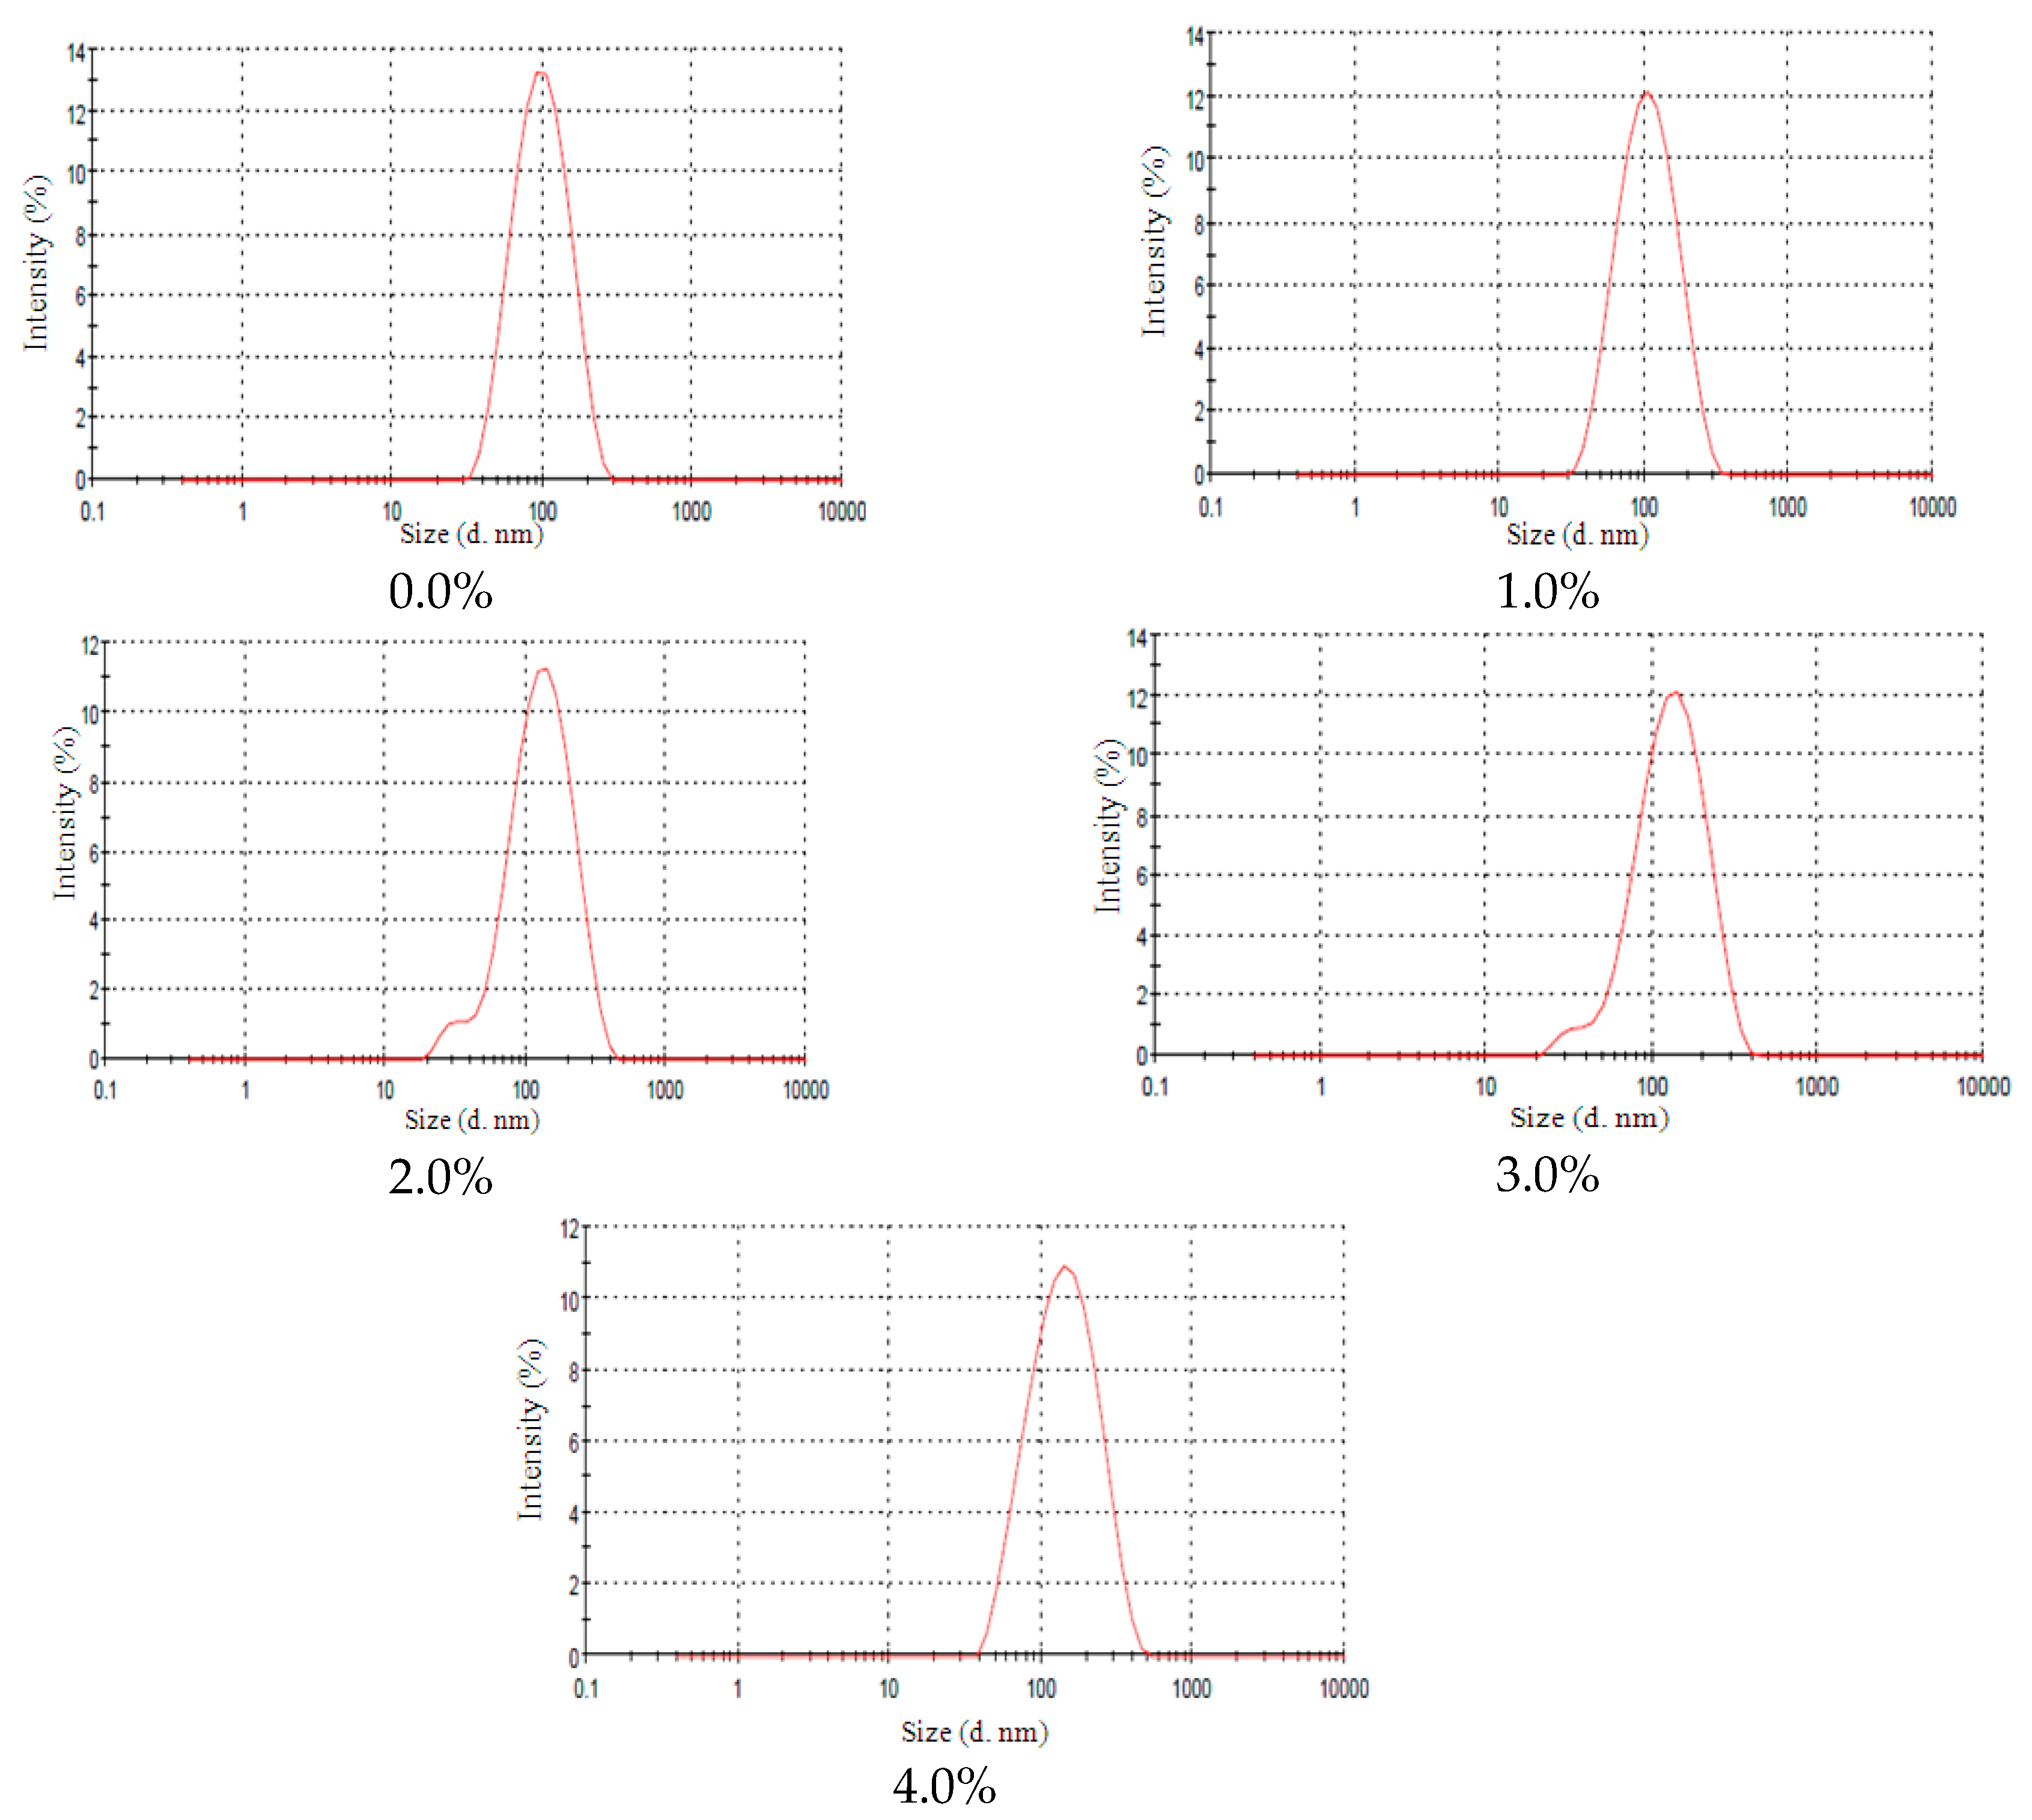
2.3. Lanolin Derivatives’ Addition
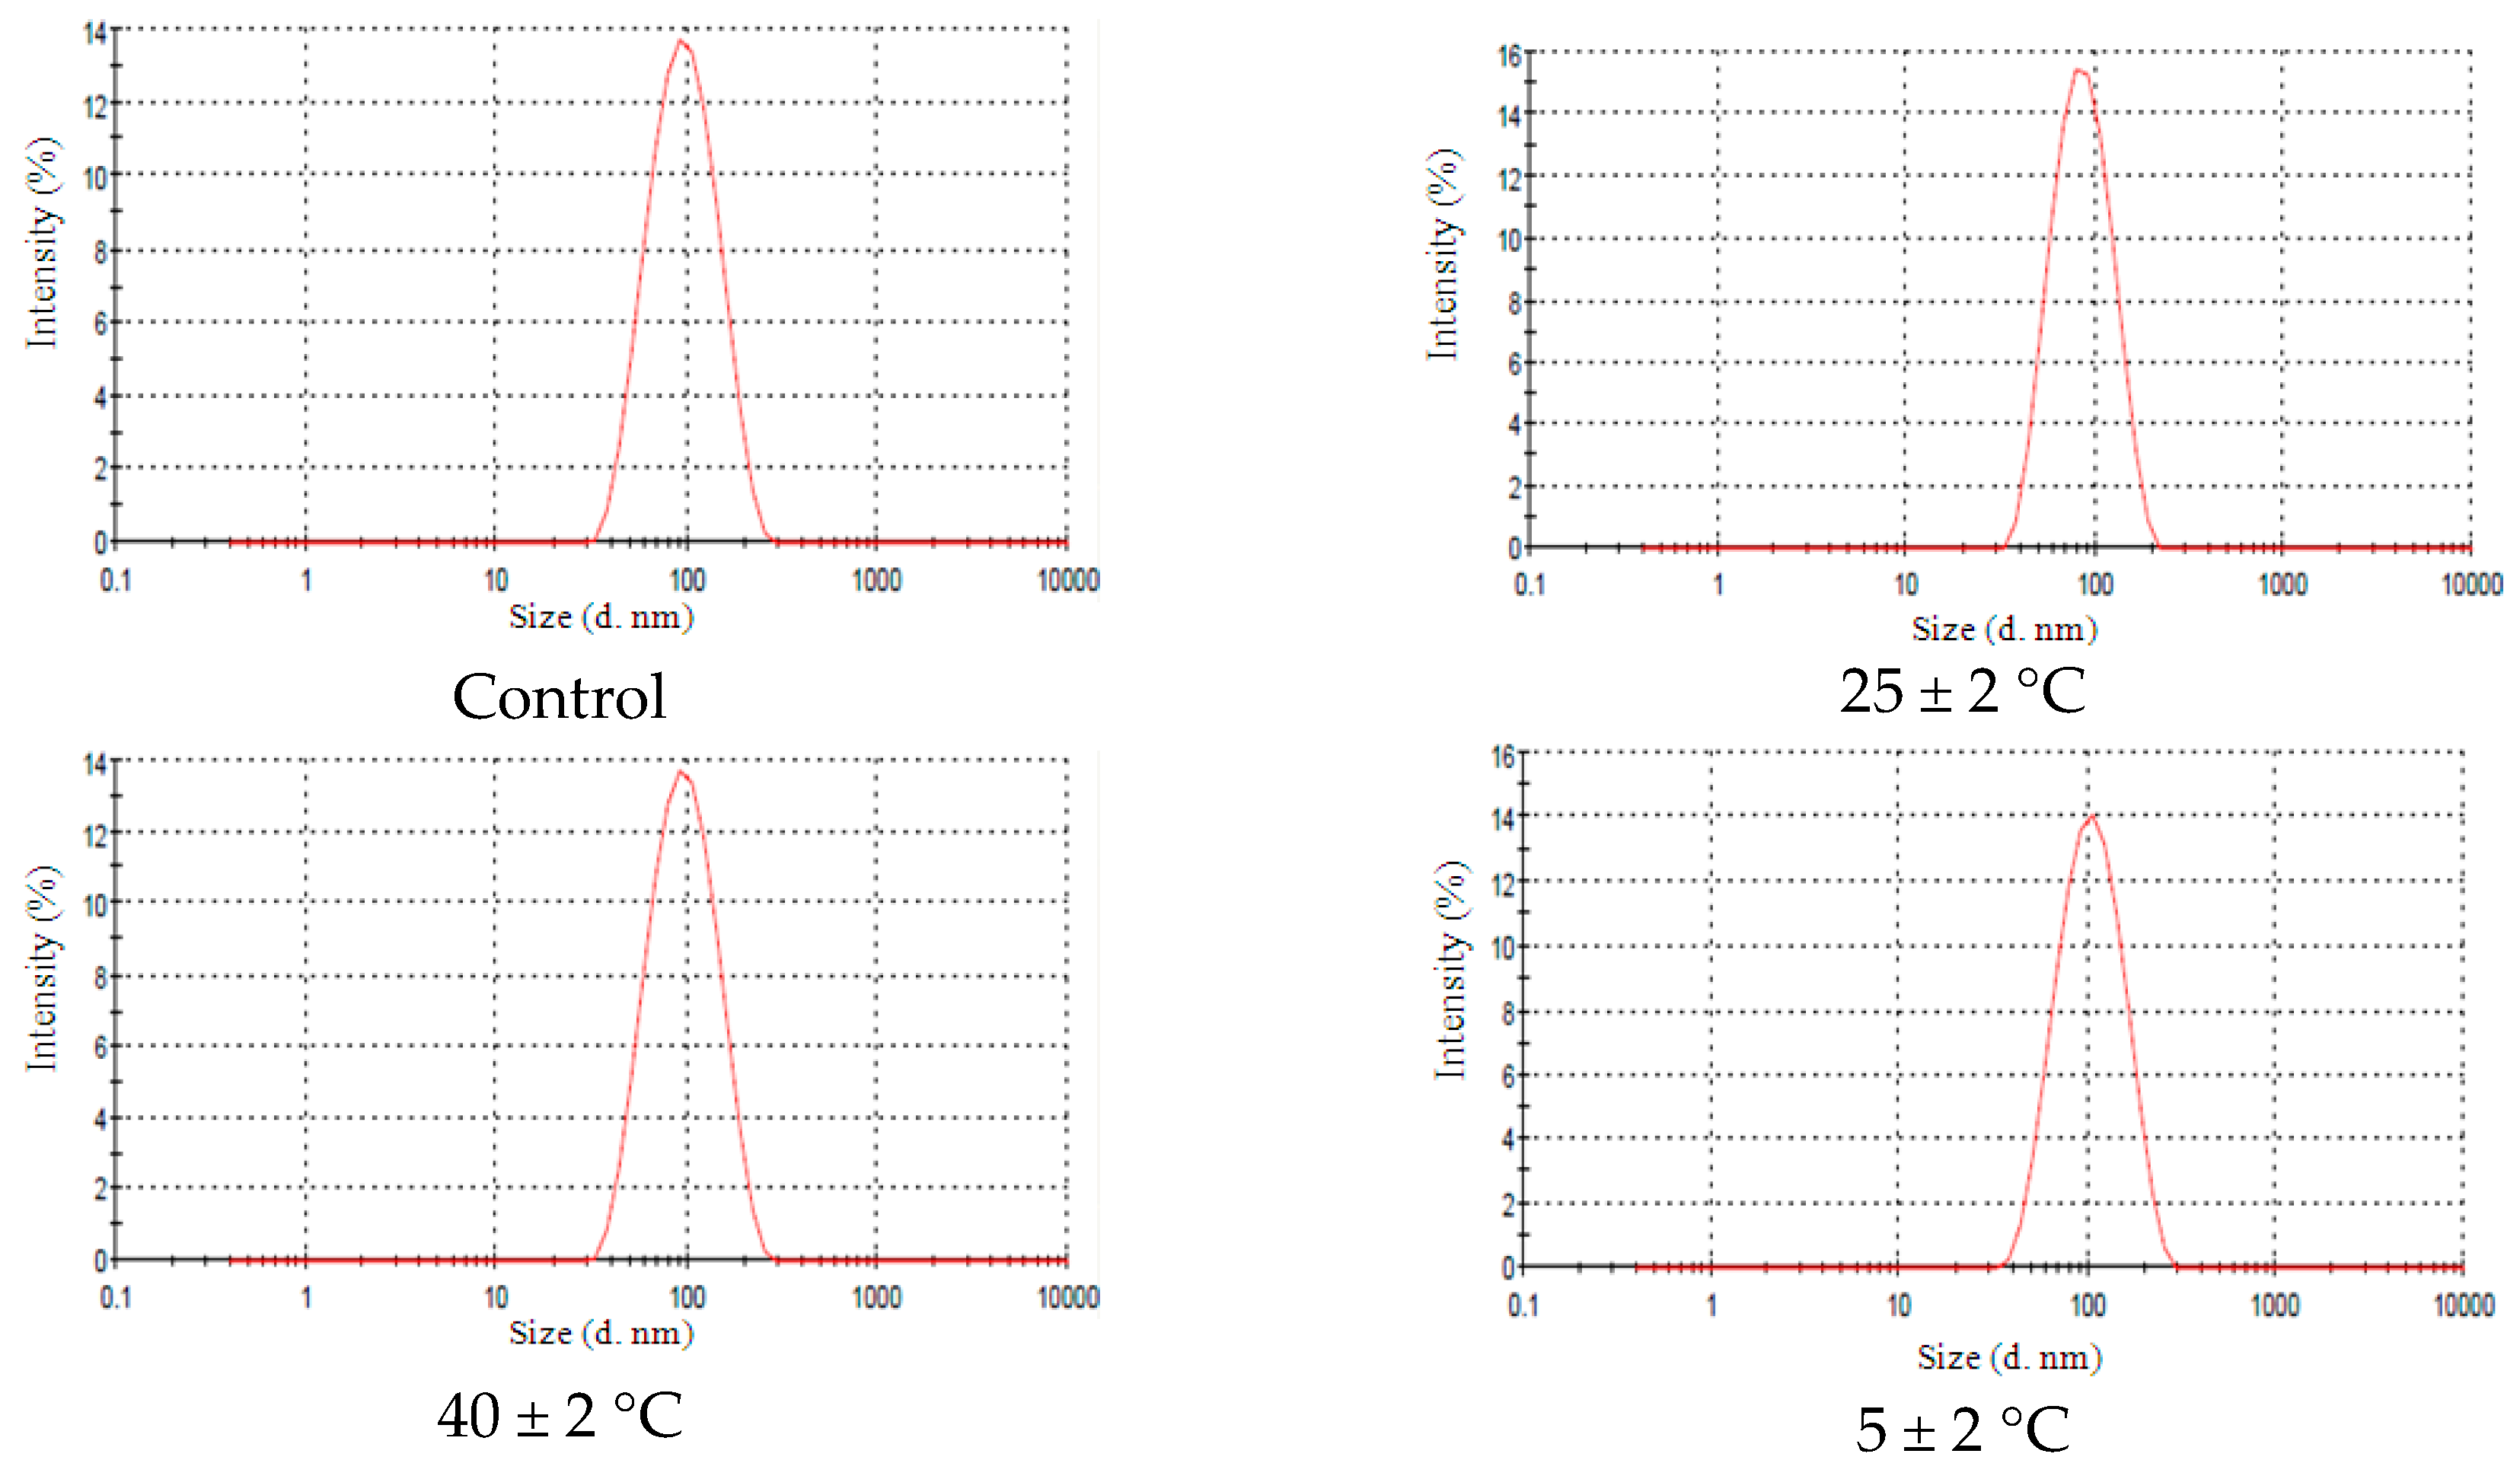
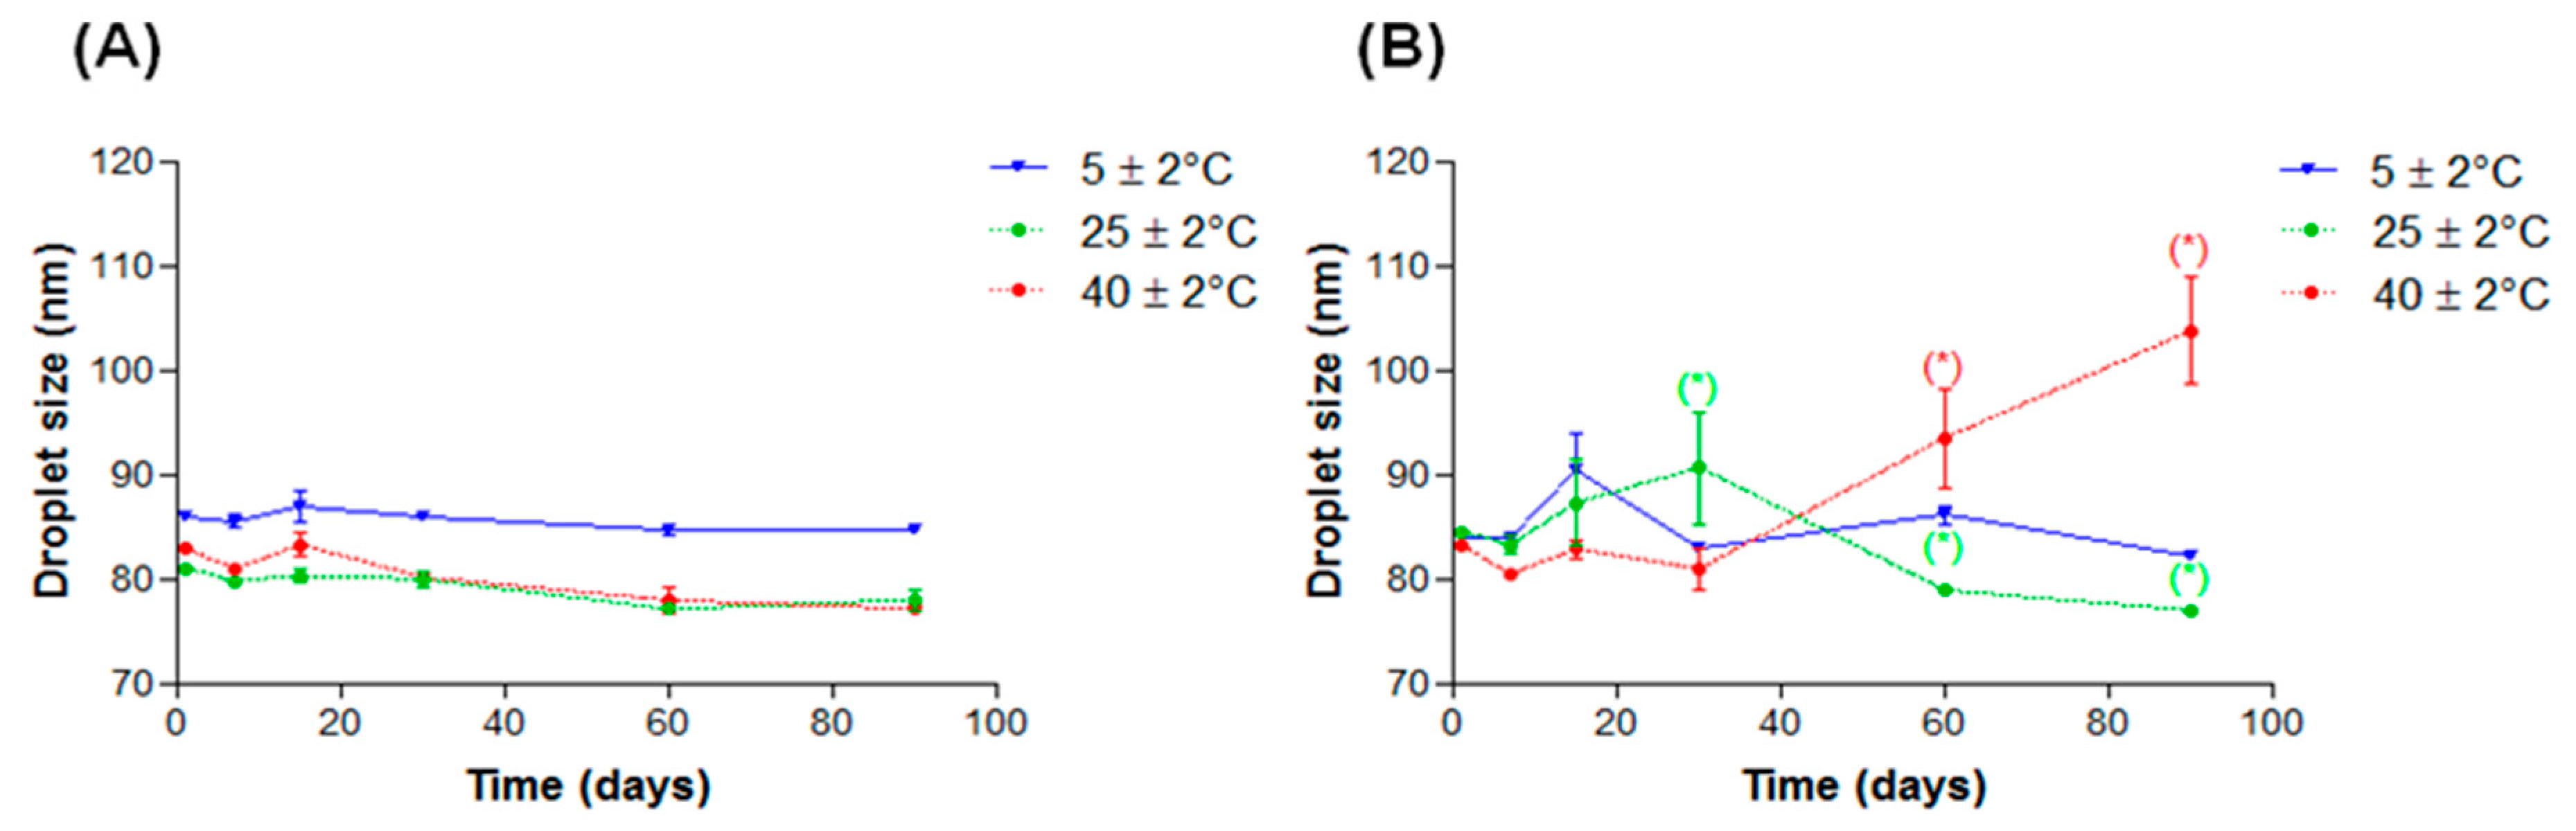
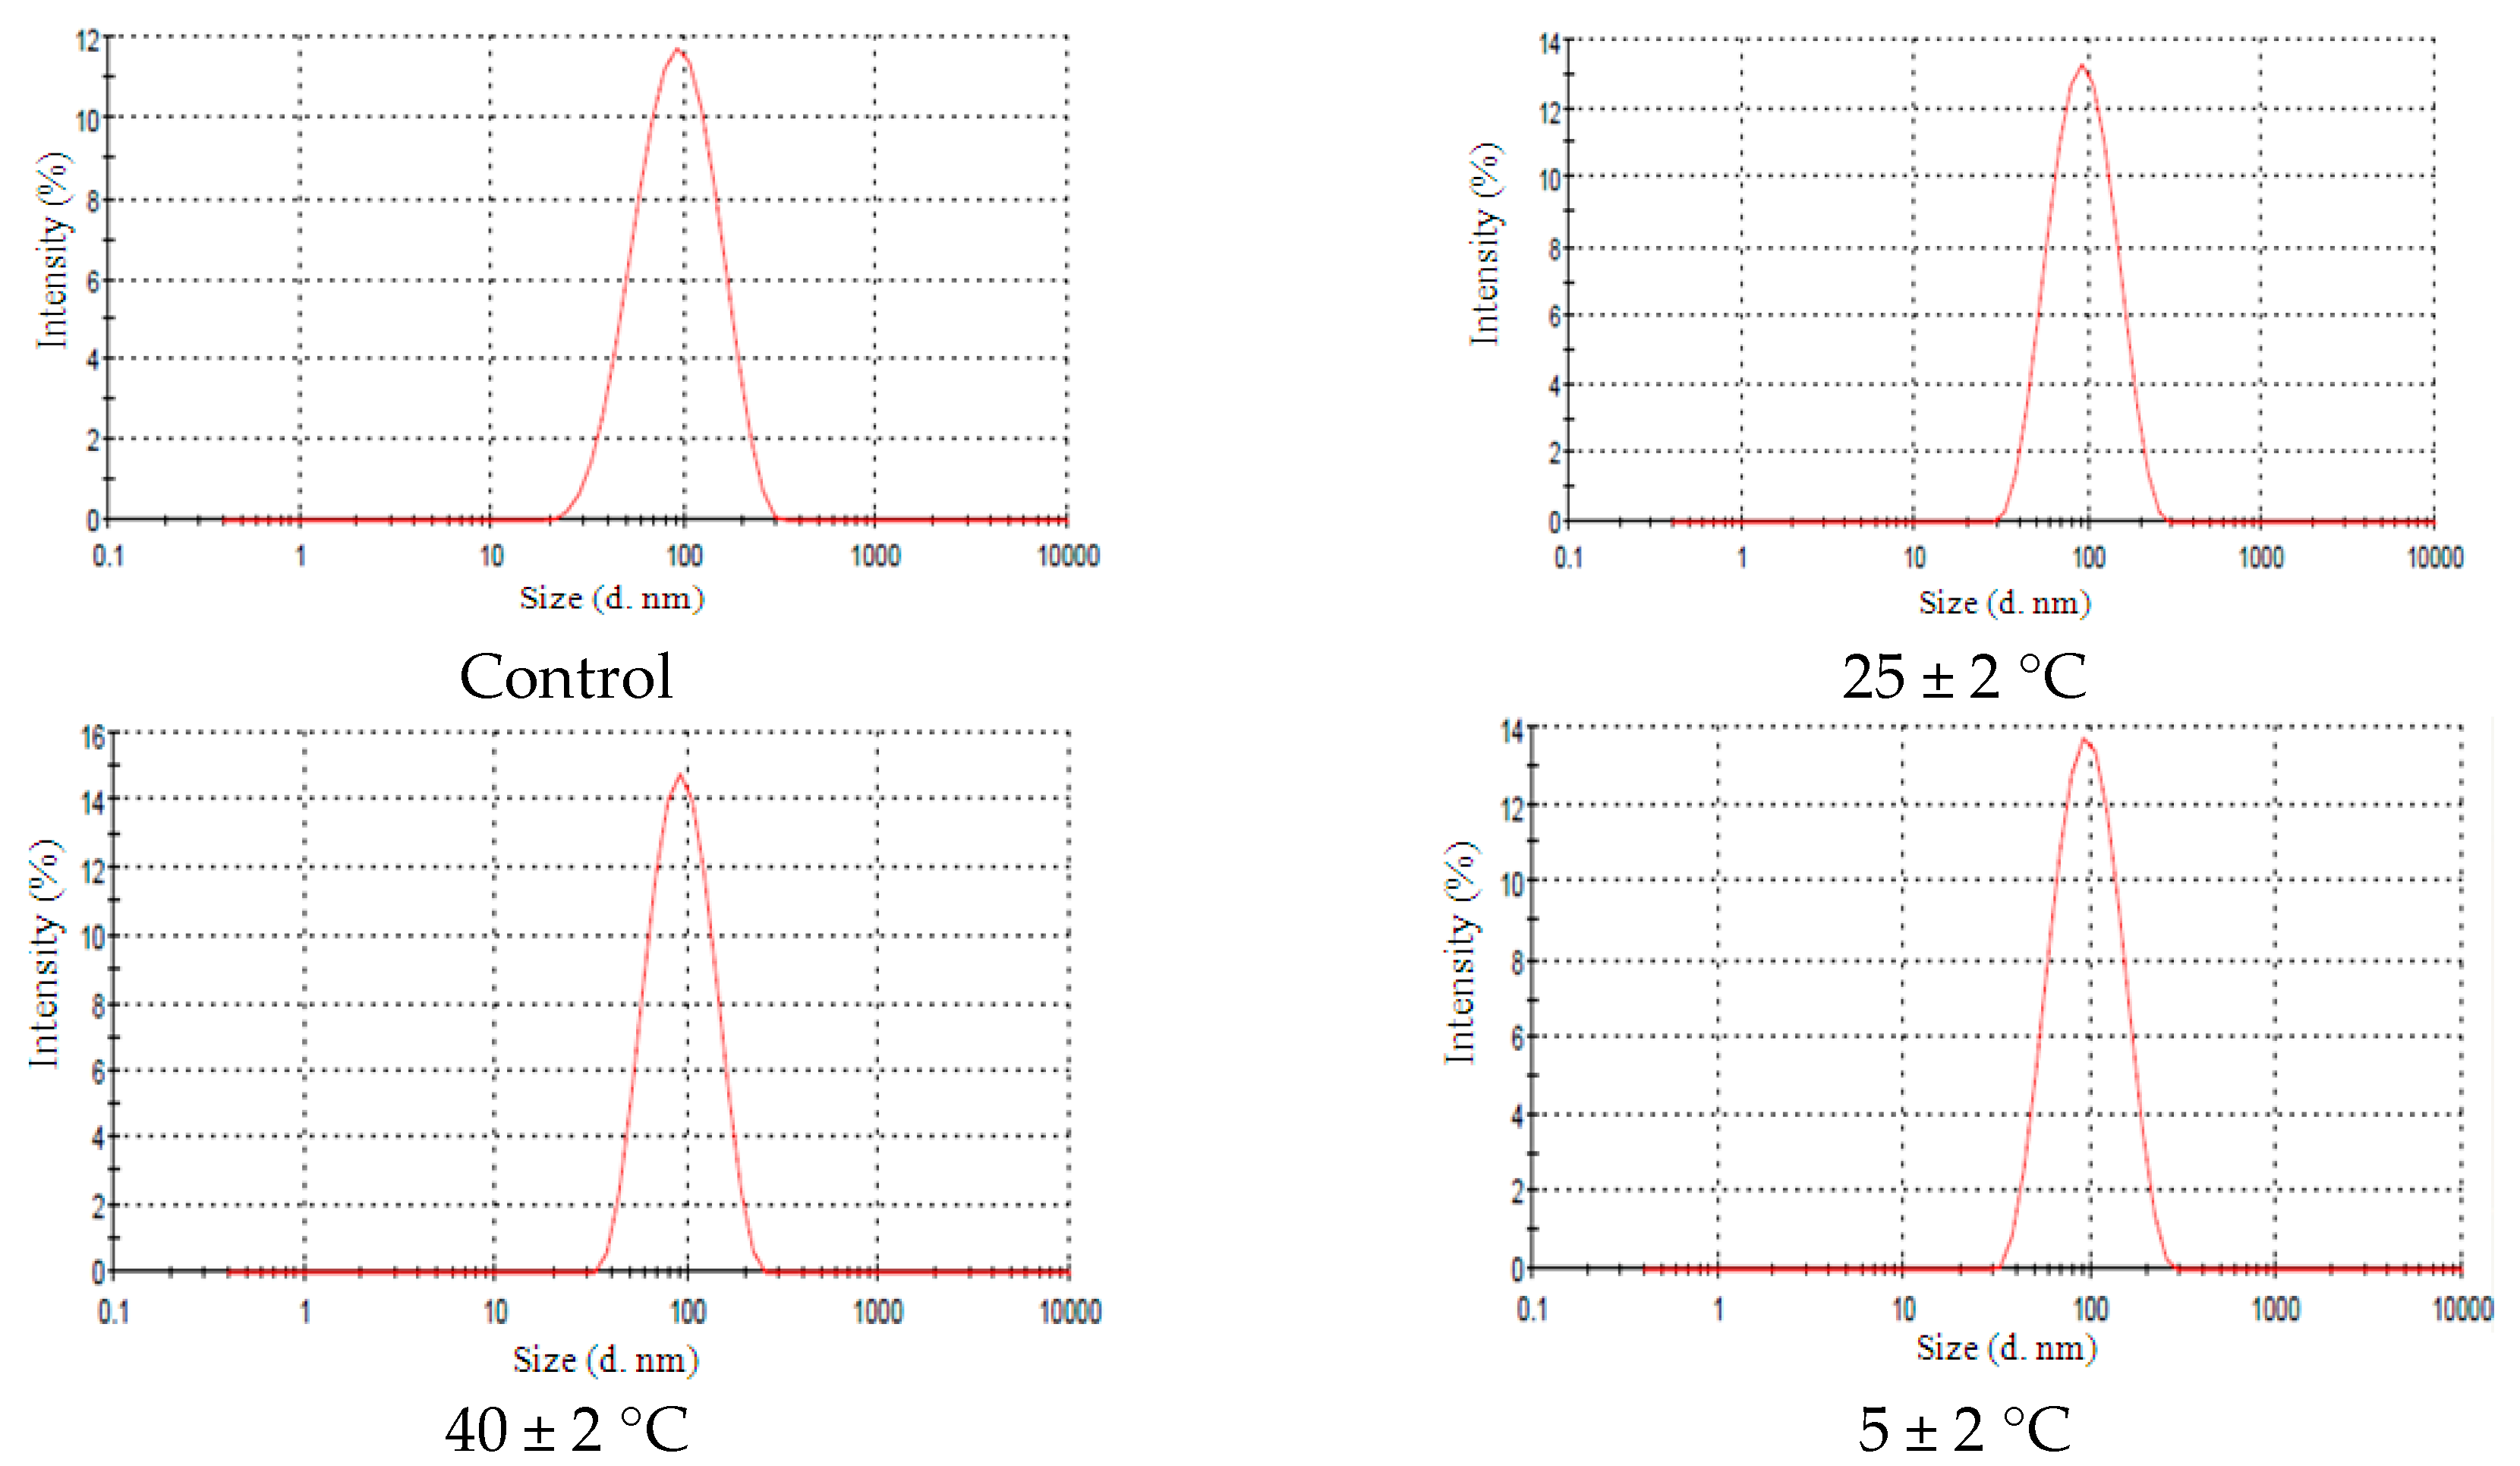
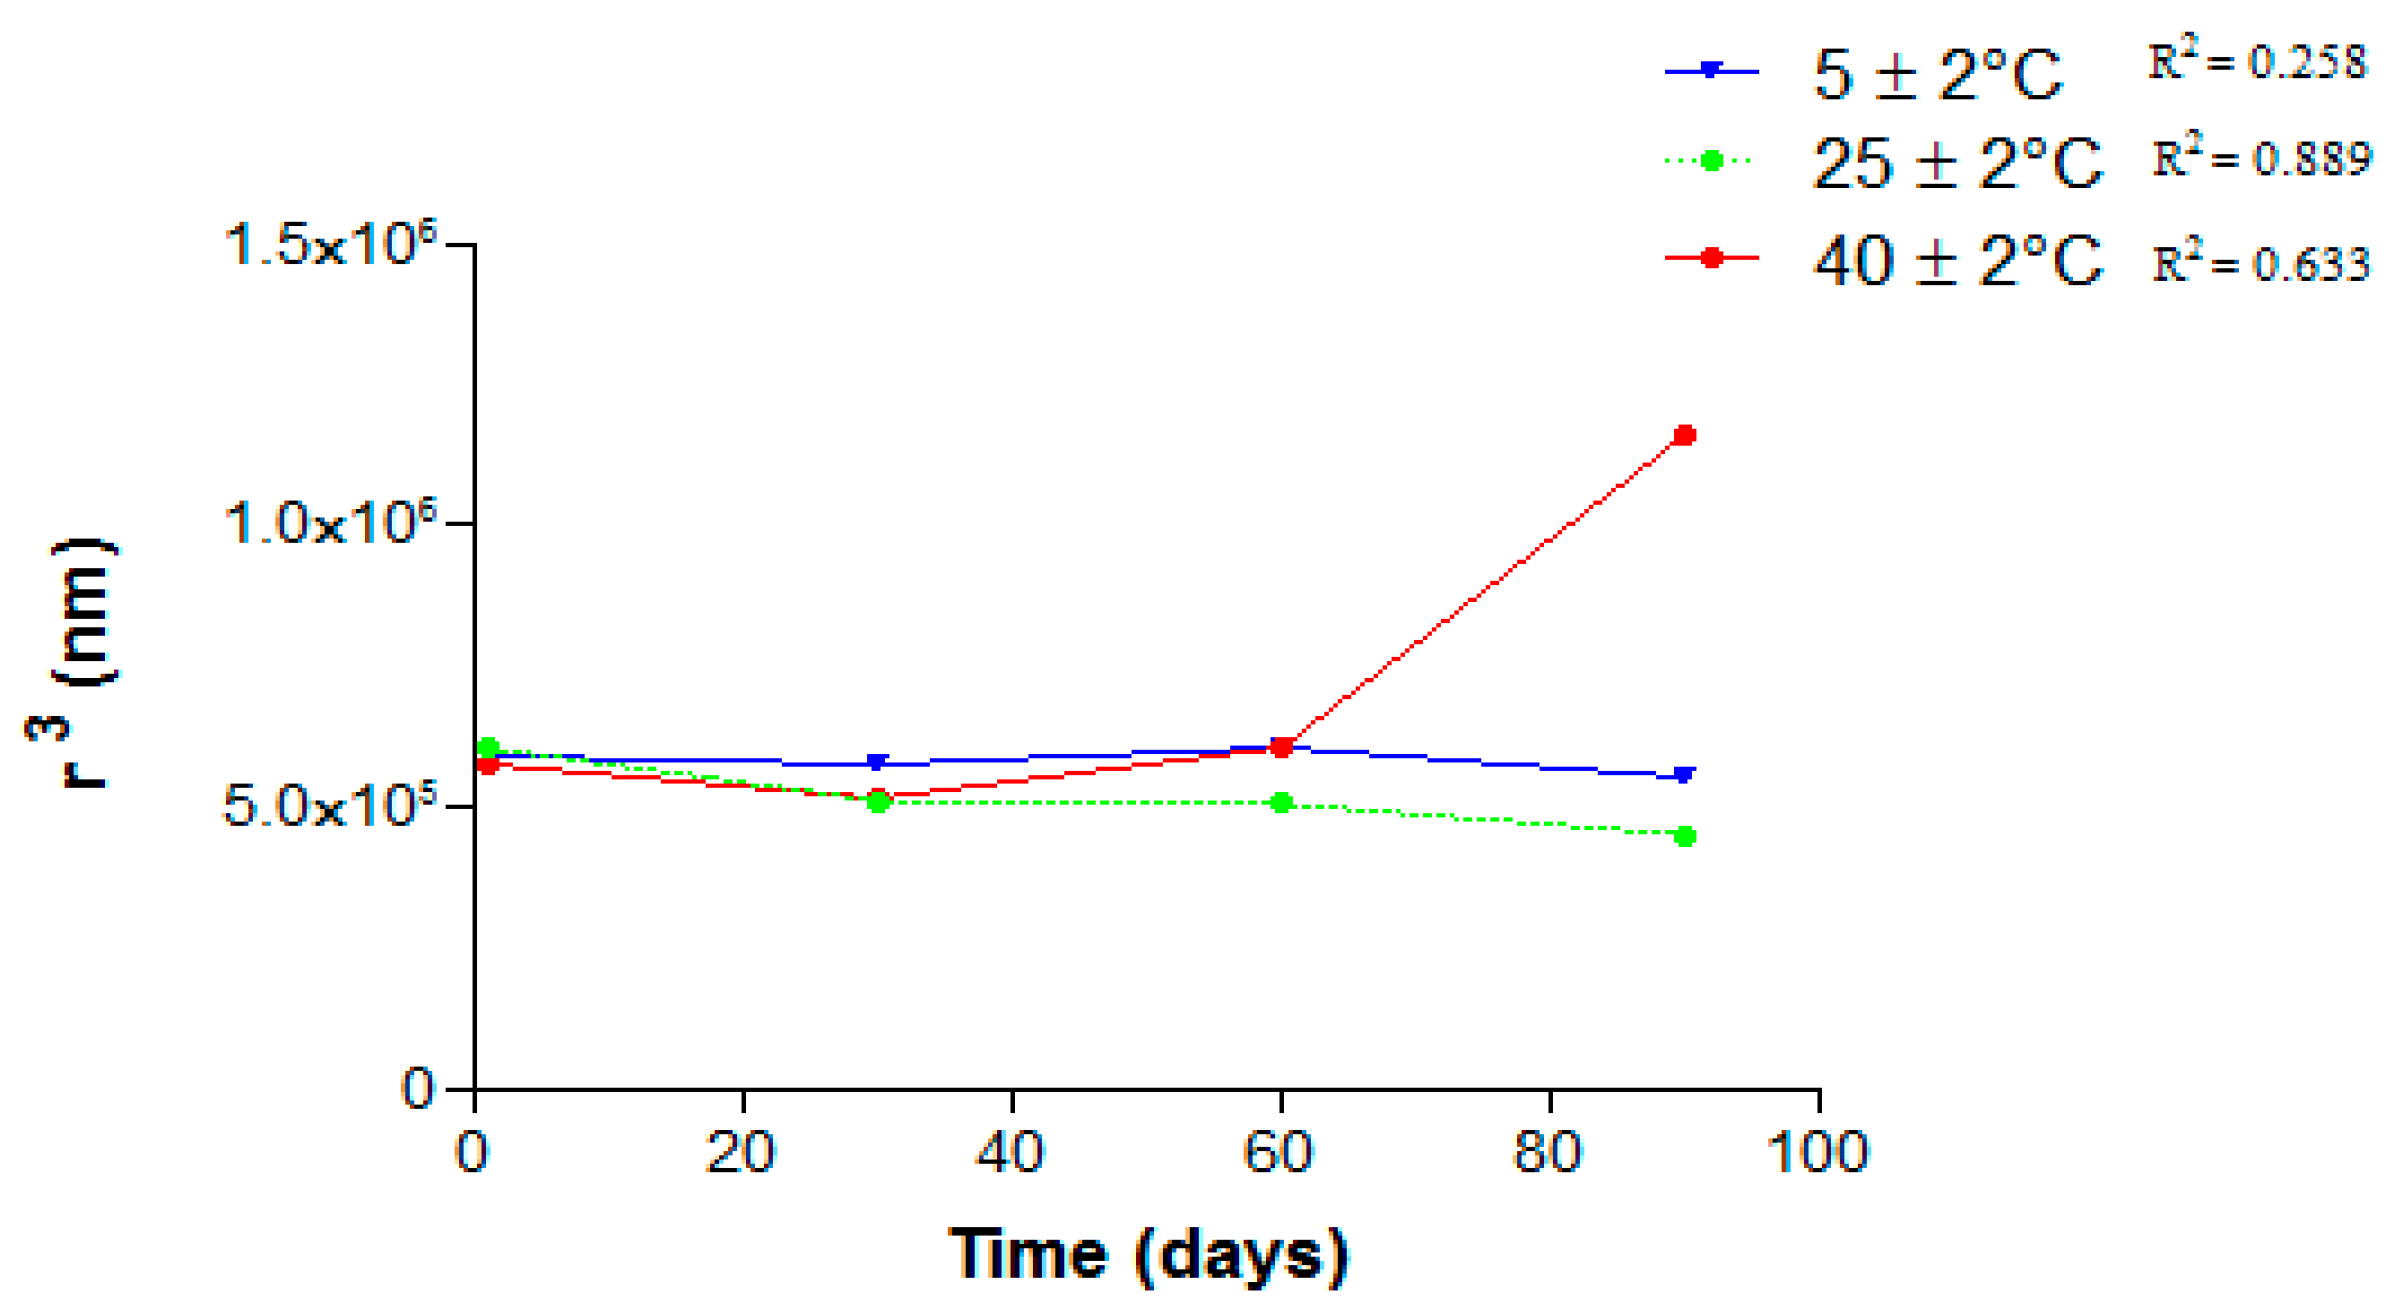
2.4. Stability Tests
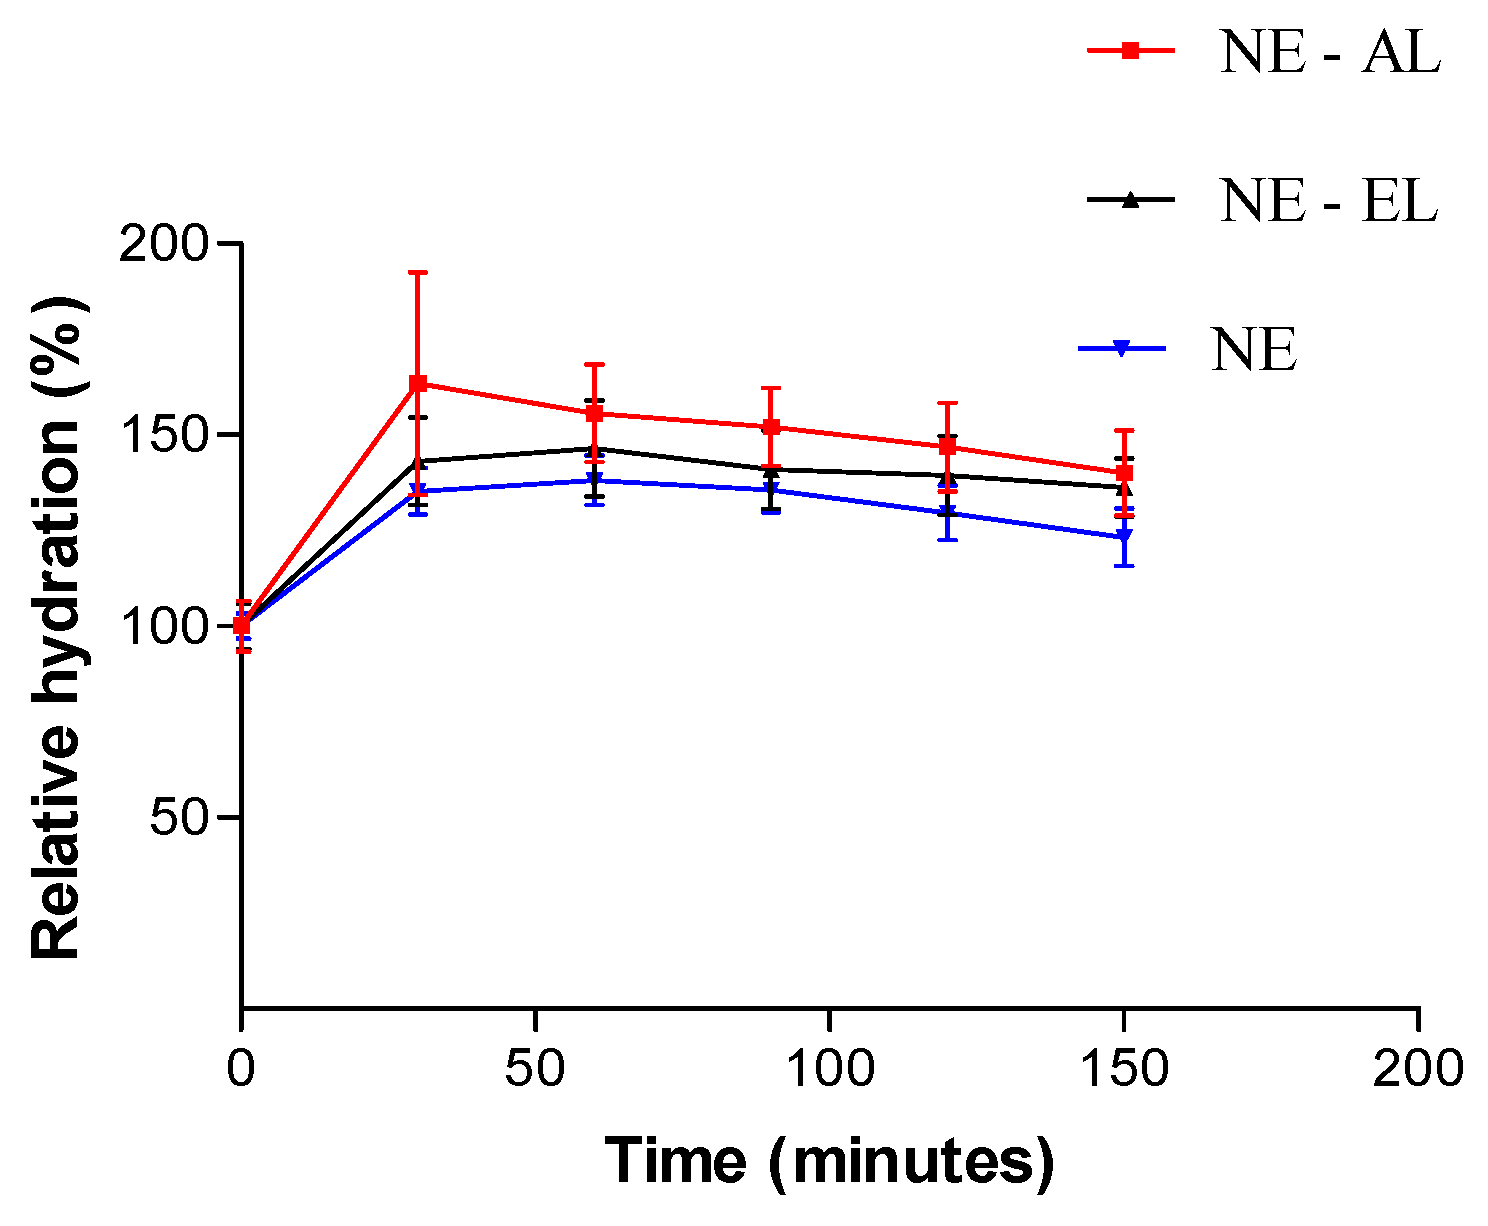
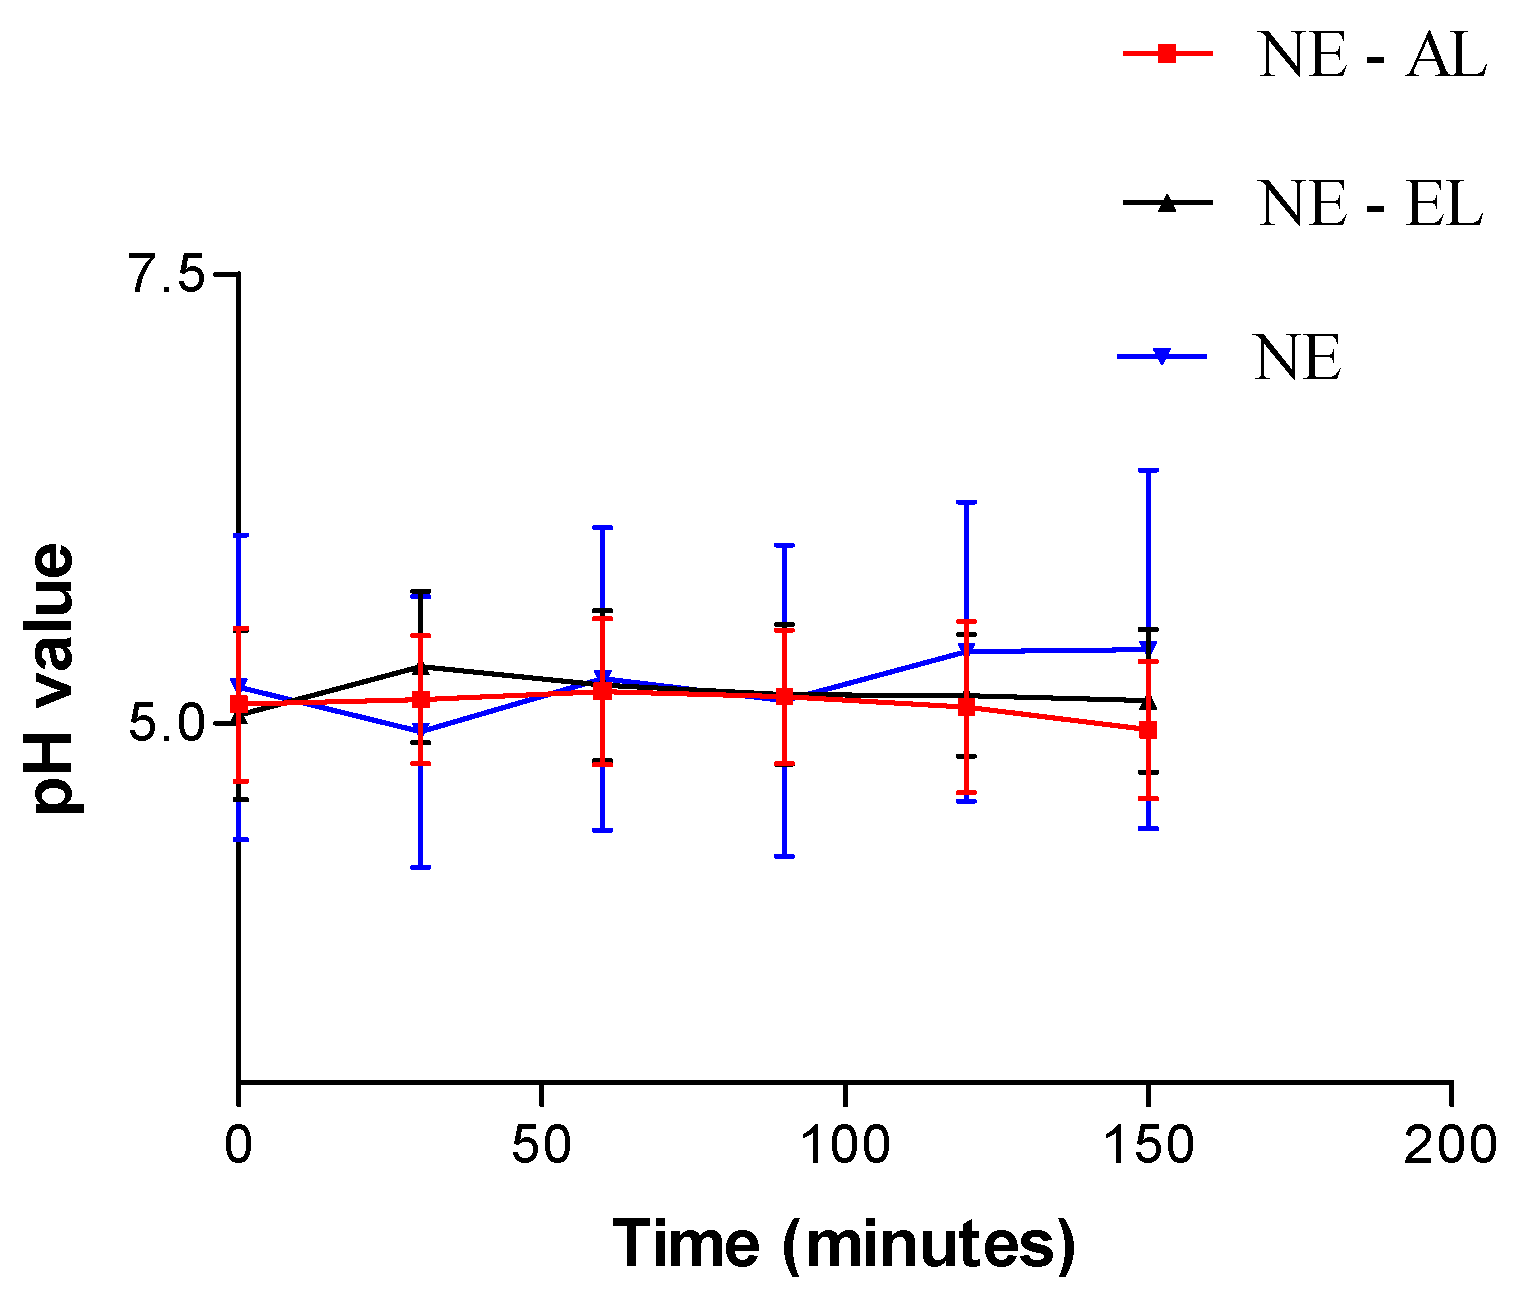
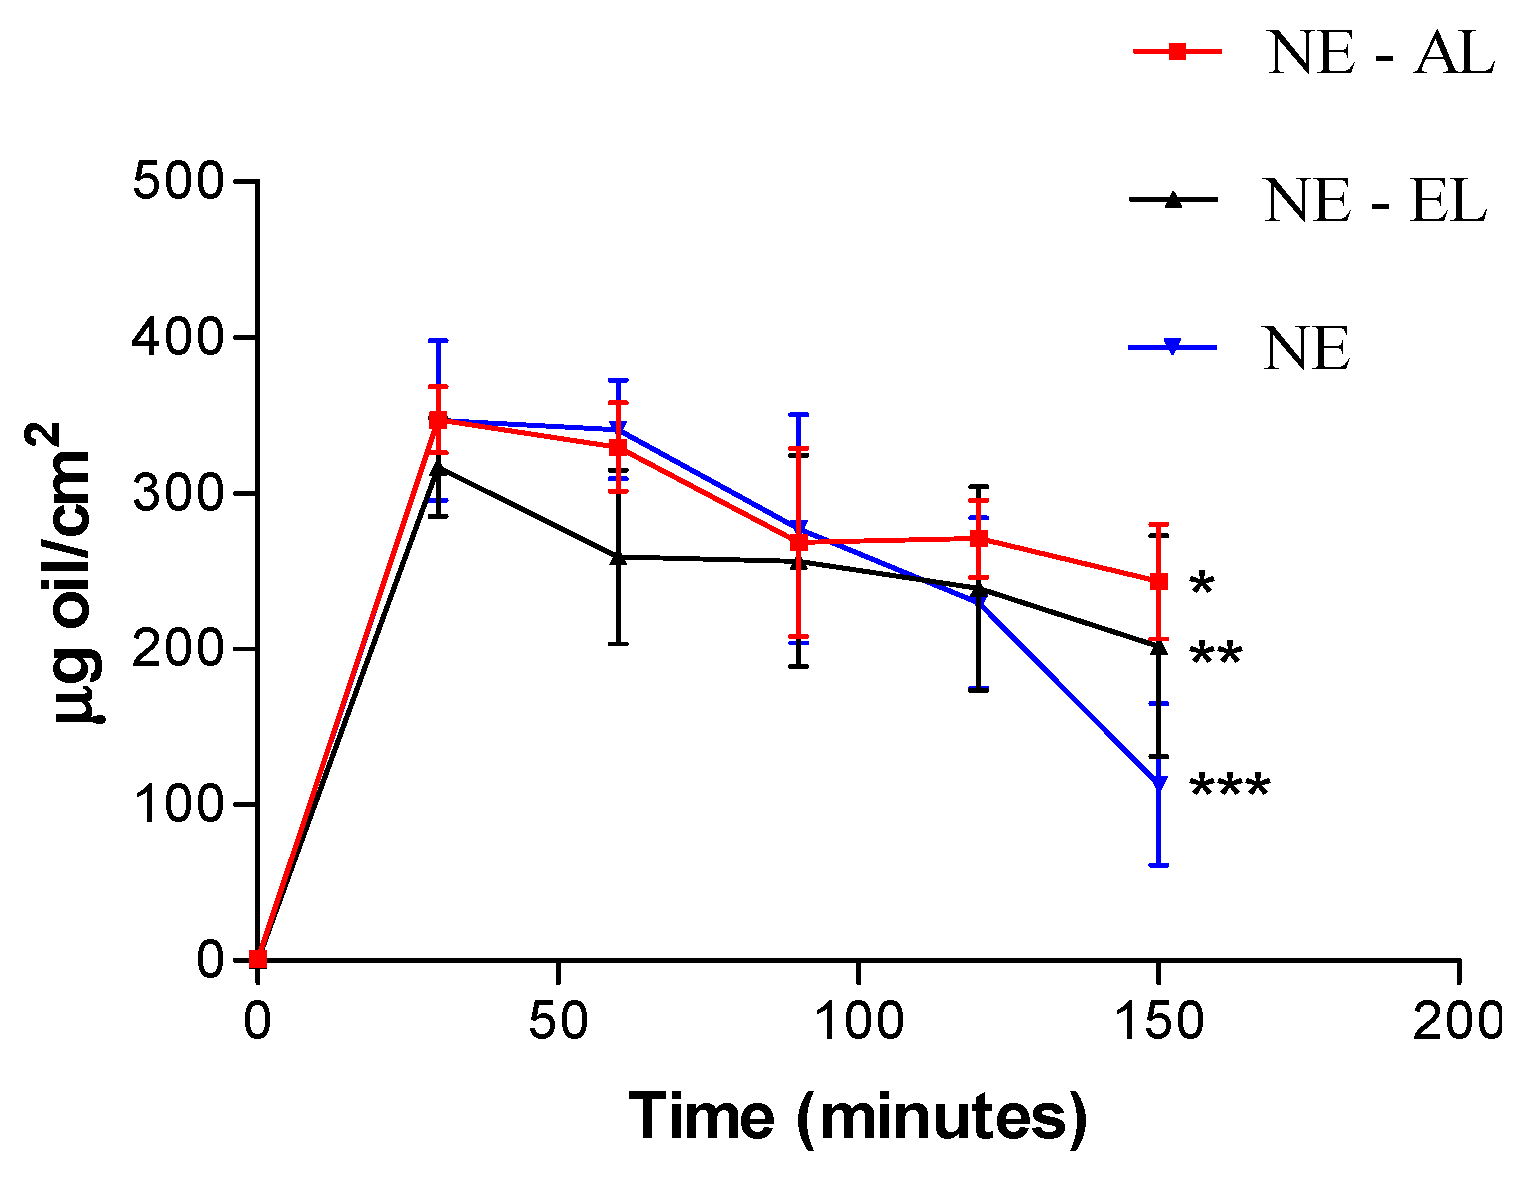
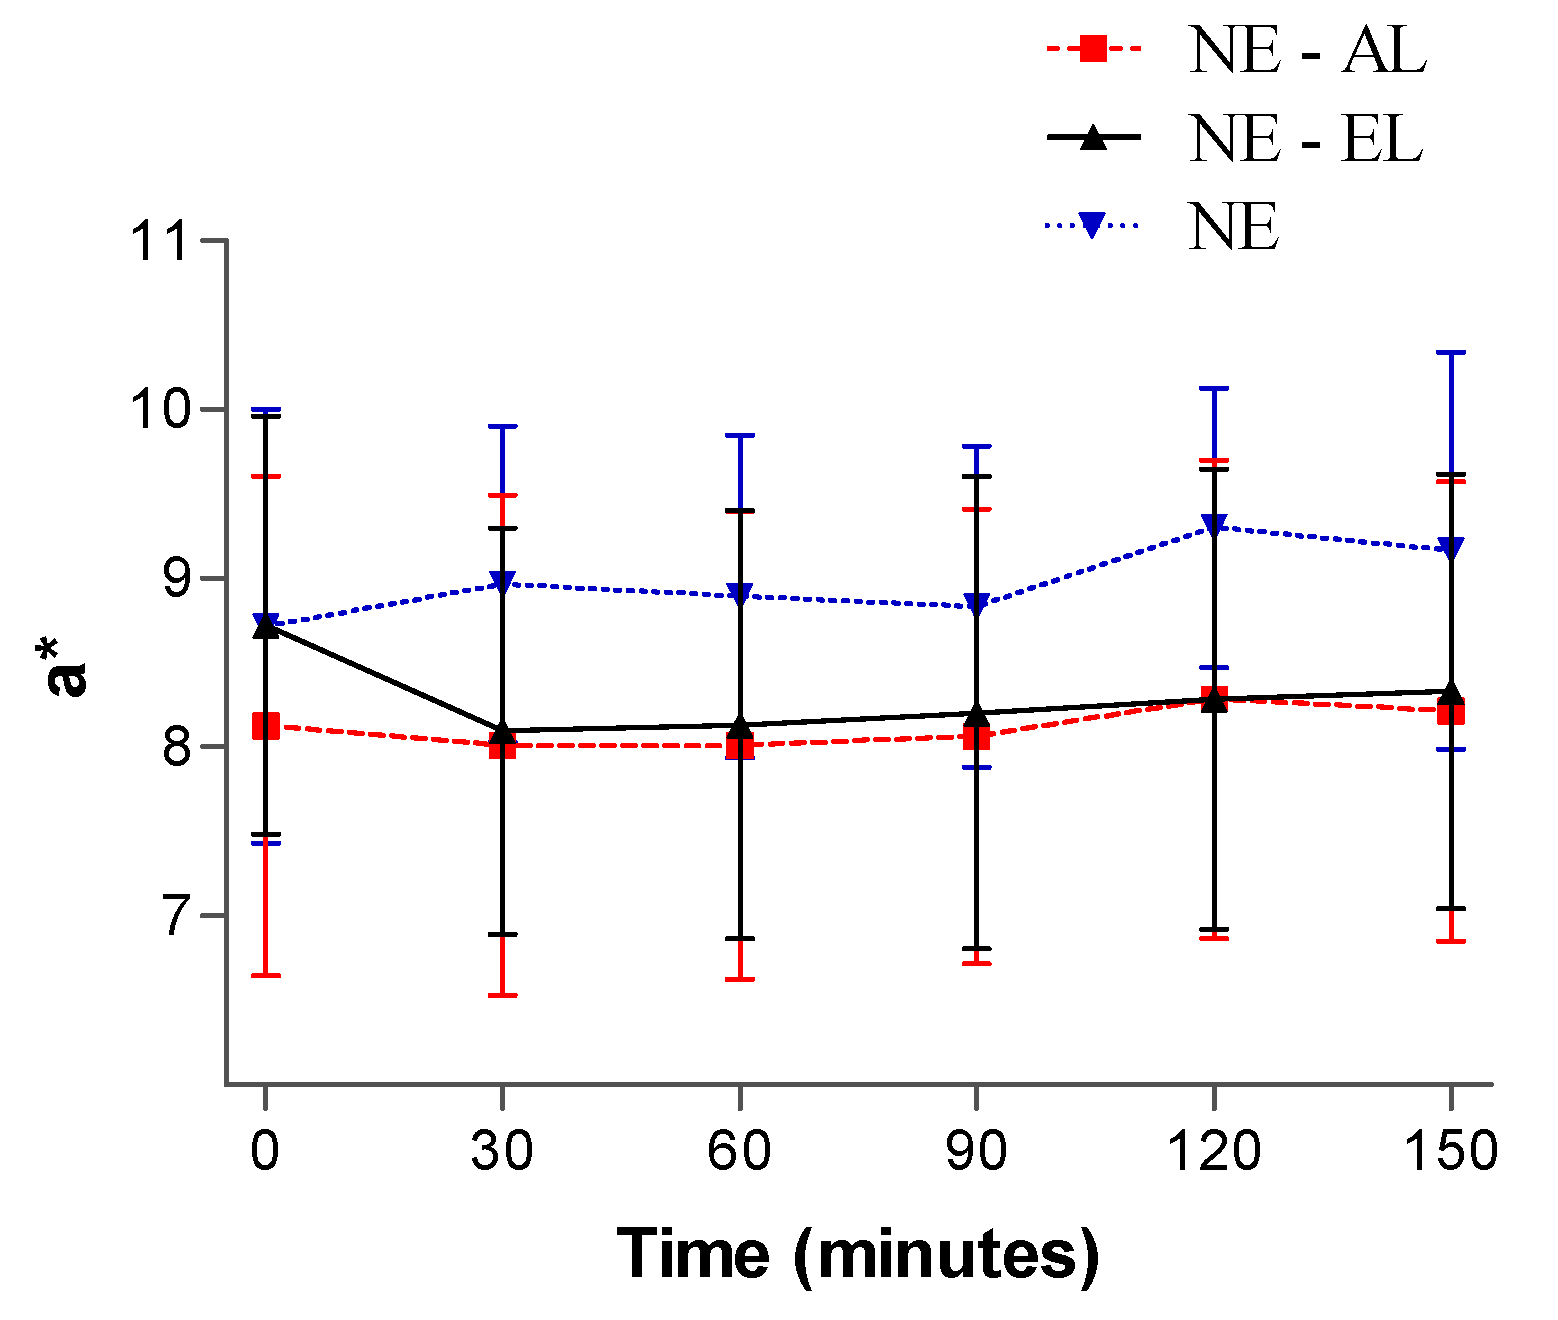
2.5. In Vivo Nano-Emulsions Evaluation: Hydration, Oiliness and pH Skin Evaluation
3. Materials and Methods
3.1. Materials
3.2. Methods
3.2.1. Formulation of Nanoemulsions
Nano-Emulsions’ Obtention
Centrifugation Test
Thermal Stress
3.2.2. Nanoemulsion Physicochemical Characterization
Diameter Mean Size
pH Values Determination
Electrical Conductivity Measurements
Interfacial Tension
3.2.3. Lanolin Derivatives’ Addition in Nanoemulsions
Physicochemical Characterization after Lanolin Derivatives’ Addition
Stability Tests
3.2.4. In Vivo Nanoemulsion Evaluation: Hydration, Oiliness and pH skin Evaluation
- (a)
- Inclusion and exclusion criteria for selecting volunteers
- (b)
- Application of formulations
- (1)
- nanoemulsions containing ethoxylated lanolin (6.0%);
- (2)
- nanoemulsions containing acetilated lanolin (2.0%);
- (3)
- nanoemulsions without additives.
Hydration Skin Evaluation
Skin pH Value Assessment
Skin Oiliness Evaluation
3.2.5. Irritant Potential Analysis
3.3. Statistical Analysis
4. Conclusions
Acknowledgments
Author Contributions
Conflicts of Interest
References
- Tadros, T.; Izquierdo, P.; Esquena, J.; Solans, C. Formation and stability of nano-emulsions. Adv. Colloid Interface Sci. 2004, 108–109, 303–318. [Google Scholar] [CrossRef] [PubMed]
- Maruno, M.; Rocha-Filho, P.A. O/W Nano-emulsion after 15 Years of Preparation: A Suitable Vehicle for Pharmaceutical and Cosmetic Applications. J. Dispers. Sci. Technol. 2010, 31, 17–22. [Google Scholar] [CrossRef]
- Stone, L. Medilan: A hypoallergenic lanolin for emollient therapy. Br. J. Nurs. 2000, 9, 54–57. [Google Scholar] [CrossRef] [PubMed]
- Porras, M.; Solans, C.; González, C.; Martínez, A.; Guinart, A.; Gutiérrez, J.M. Studies of formation of W/O nano-emulsions. Colloids Surf. A Physicochem. Eng. Asp. 2004, 249, 115–118. [Google Scholar] [CrossRef]
- Martins, E.F.; Pereira, L.M.; Lima, T.M.; Aguiar, G.R.; Chen, S.C.; Folador, A.; Curi, T.C.P.; Curi, R. Influência da lanolina na cicatrização. Saúde Rev. 2005, 7, 19–25. [Google Scholar]
- Morais, J.M.; Santos, O.D.H.; Delicato, T.; Gonçalves, R.A.; Rocha-Filho, P.A. Physicochemical characterization of canola oil/water nano-emulsions obtained by determination of required HLB number and emulsion phase inversion methods. J. Dispers. Sci. Technol. 2006, 27, 109–115. [Google Scholar] [CrossRef]
- Pey, C.M.; Maestro, A.; Solé, I.; Gonzalez, C.; Solans, C. Optimization of nano-emulsions prepared by low-energy emulsification methods at constant temperature using a factorial desing study. Colloids Surf. A Physicochem. Eng. Asp. 2006, 288, 144–150. [Google Scholar] [CrossRef]
- Peng, L.C.; Liu, C.H.; Kwan, C.C.; Huang, K.F. Optimization of water-in-oil nano-emulsions by mixed surfactants. Colloids Surf. A Physicochem. Eng. Asp. 2010, 370, 136–142. [Google Scholar] [CrossRef]
- Rocha-Filho, P.A.; Maruno, M.; Oliveira, B.; Bernardi, D.S.; Gumiero, V.C.; Pereira, T.A. Nanoemulsions as a Vehicle for Drugs and Cosmetics. Nanosci. Technol. 2014, 1, 5. [Google Scholar]
- Pereira, T.A. Obtenção e caracterização de nanoemulsões O/A à base de óleo de framboesa, maracujá e pêssego: Avaliação de propriedades cosméticas da formulação. In Tese de Mestrado—Faculdade de Ciências Farmacêuticas de Ribeirão Preto; University of São Paulo: SP, Brazil, 2011; p. 102. [Google Scholar]
- Fernandez, P.; Andre, V.; Rieger, J.; Kuhnle, A. Nano-emulsions formation by emulsion phase inversion. Colloids Surf. A Physicochem. Eng. Asp. 2004, 251, 53–58. [Google Scholar] [CrossRef]
- Hessien, M.; Singh, N.; Kim, C.; Prouzet, E. Stability and Tunability of O/W nano-emulsions prepared by phase inversion composition. Langmuir 2016. [Google Scholar] [CrossRef]
- Solans, C.; Izquierdo, P.; Nolla, J.; Azemar, N.; Celma, M.J.G. Nano-emulsions. Curr. Opin. Colloid Interface Sci. 2005, 10, 102–110. [Google Scholar] [CrossRef]
- Maestro, A.; Solé, I.; González, C.; Solans, C.; Gutiérrez, J.M. Influence of the phase behavior on the properties of ionic nano-emulsions prepared by the phase inversion composition method. J. Colloid Interface Sci. 2008, 327, 433–439. [Google Scholar] [CrossRef] [PubMed]
- Liu, W.; Sun, D.; Li, C.; Liu, Q.; Xu, J. Formation and stability of paraffin oil-in-water nano-emulsions prepared by emulsion inversion point method. J. Colloid Interface Sci. 2006, 303, 557–563. [Google Scholar] [CrossRef] [PubMed]
- Sajjadi, S. Formation of fine emulsions by emulsification at high viscosity or low interfacial tension: A comparative study. Colloids Surf. A Physicochem. Eng. Asp. 2007, 299, 73–78. [Google Scholar] [CrossRef]
- Spinelli, L.S.; Mansur, C.R.E.; González, G.; Lucas, E.F. Evaluation of process conditions and characterization of particle size stability of oil-in-water nano-emulsions. Colloid J. 2010, 72, 56–65. [Google Scholar] [CrossRef]
- Yang, H.J.; Cho, W.G.; Park, S.N. Stability of oil-in-water nano-emulsions prepared using the phase inversion composition method. J. Ind. Eng. Chem. 2009, 15, 331–335. [Google Scholar] [CrossRef]
- Chiesa, M.; Garg, J.; Kang, Y.T.; Chen, G. Thermal conductivity and viscosity of water-in-oil nano-emulsions. Colloids Surf. A Physicochem. Eng. Asp. 2008, 326, 67–72. [Google Scholar] [CrossRef]
- Morais, G.C.; Szantos, O.D.H.; Oliveira, W.P.; Rocha-Filho, P.A. Attainment of O/W emulsions containing liquid crystal fromannatto oil (Bixa orellana), coffee oil, and tea tree oil (Melaleuca alternifolia) as oily phase using HLB system and ternary phase diagram. J. Dispers. Sci. Technol. 2008, 29, 297–306. [Google Scholar] [CrossRef]
- Teo, B.S.X.; Basri, M.; Zakaria, M.R.S.; Salleh, A.B.; Rahman, R.N.Z.R.A.; Rahman, M.B.A. A potential tocopherol acetate loaded palm oil esters-in-water nano-emulsions for nanocosmeceuticals. J. Nanobiotechnol. 2010, 4, 1–11. [Google Scholar]
- Aulton, M.E. Delineamento de Formas Farmacêuticas, 2nd ed.; Porto Alegre: Artmed, Brazil, 2005. [Google Scholar]
- Weiss, J.; Coupland, J.N.; Mcclements, D.J. Solubilization of hydrocarbon emulsion droplets suspended in non- ionic surfactant micelle solutions. J. Phys. Chem. 1996, 100, 1066–1071. [Google Scholar] [CrossRef]
- Masmoudi, H.; le Dréau, Y.; Piccerelle, P.; Kister, J. The evaluation of cosmetic and pharmaceuticalemulsions aging process using classical techniques and a new method: FTIR. Int. J. Pharm. 2005, 289, 117–131. [Google Scholar] [CrossRef] [PubMed]
- Ramalho, V.C.; Jorge, N. Antioxidantes usados em óleos, gorduras e alimentos gordurosos. Quím. Nova 2006, 29, 755–760. [Google Scholar] [CrossRef]
- Ee, S.L.; Duan, X.; Liew, J.; Nguyen, D. Droplet size and stability of nano-emulsion produced by the temperature phase inversion method. Chem. Eng. J. 2008, 140, 626–631. [Google Scholar] [CrossRef]
- Wissing, S.A.; Muller, R.H. The influence of solid lipid nanoparticles on skin hydration and viscoelasticity—In vivo study. Eur. J. Pharm. Biopharm. 2003, 56, 67–72. [Google Scholar] [CrossRef]
- Pianovski, A.R.; Vilela, A.F.G.; Silva, A.A.S.; Lima, C.G.; Silva, K.K.; Carvalho, V.F.M.; Musis, C.R.; Machado, S.R.P.; Ferrari, M. Desenvolvimento e avaliação da estabilidade de emulsões múltiplas O/A/O com óleo de pequi (Caryocar brasiliense). Rev. Bras. Farm. 2008, 89, 155–159. [Google Scholar]
- Bernardi, D.S.; Pereira, T.A.; Maciel, N.R.; Bortoloto, J.; Viera, G.S.; Oliveira, G.C.; Rocha-Filho, P.A. Formation and stability of oil-in-water nanoemulsions containing rice bran oil: In vitro and in vivo assessments. J. Nanobiotechnol. 2011, 9, 1–9. [Google Scholar] [CrossRef] [PubMed] [Green Version]
- Sample Availability: Test compounds are commercially available. Samples of the compounds are not available from the authors.


| Formulation | Sorbitan Monooleate | PEG-15 Castor Oil | PEG-30 Castor Oil | PEG-36 Castor Oil | PEG-40 Castor Oil | PEG-54 Castor Oil |
|---|---|---|---|---|---|---|
| 1 | 3.65 | - | 6.35 | - | - | - |
| 2 | 4.34 | - | - | 5.66 | - | - |
| 3 | 4.60 | - | - | - | 5.40 | - |
| 4 | 5.34 | - | - | - | - | 4.66 |
| 5 | - | 7.93 | 2.07 | - | - | - |
| 6 | - | 8.36 | - | 1.64 | - | - |
| 7 | - | 8.51 | - | - | 1.49 | - |
| 8 | - | 8.83 | - | - | - | 1.15 |
| Formulation | Mean Diameter Size (nm ± SD) * |
|---|---|
| (1) Sorbitan monooleate/PEG 30 Castor oil | 51.0 ± 5.2 |
| (2) Sorbitan monooleate/PEG 36 Castor oil | 48.0 ± 7.2 |
| (3) Sorbitan monooleate/PEG 40 Castor oil | 118.0 ± 37.0 |
| (4) Sorbitan monooleate/PEG 54 Castor oil | 187.0 ± 34.0 |
| (5) PEG 15 Castor oil/PEG 30 Castor oil | 63.0 ± 10.0 |
| (6) PEG 15 Castor oil/PEG 36 Castor oil | 72.0 ± 16.0 |
| (7) PEG 15 Castor oil/PEG 40 Castor oil | 64.0 ± 16.0 |
| (8) PEG 15 Castor oil/PEG 54 Castor oil | 63.0 ± 16.0 |
| Temperature ( ±1 °C) | |||||||||
|---|---|---|---|---|---|---|---|---|---|
| Formulations | 40 | 45 | 50 | 55 | 60 | 65 | 70 | 75 | 80 |
| 1 (TMOS/T30OE) | n | n | n | sl | sl | sl | sl | sl | sl |
| 2 (TMOS/T36OE) | n | n | n | n | sl | sl | sl | sl | sl |
| 3 (TMOS/T40OE) | n | n | n | n | n | n | sl | sl | sl |
| 4 (TMOS/T54OE) | n | n | n | n | n | n | n | n | n |
| 5 (T15OE/T30OE) | n | n | n | sl | sl | sl | sl | sl | sl |
| 6 (T15OE/T36OE) | n | n | n | sl | sl | sl | sl | sl | sl |
| 7 (T15OE/T40OE) | n | n | n | sl | sl | sl | sl | sl | sl |
| 8 (T15OE/T45OE) | n | n | n | sl | sl | sl | sl | sl | sl |
© 2016 by the authors. Licensee MDPI, Basel, Switzerland. This article is an open access article distributed under the terms and conditions of the Creative Commons by Attribution (CC-BY) license ( http://creativecommons.org/licenses/by/4.0/).
Share and Cite
Pereira, T.A.; Guerreiro, C.M.; Maruno, M.; Ferrari, M.; Rocha-Filho, P.A. Exotic Vegetable Oils for Cosmetic O/W Nanoemulsions: In Vivo Evaluation. Molecules 2016, 21, 248. https://doi.org/10.3390/molecules21030248
Pereira TA, Guerreiro CM, Maruno M, Ferrari M, Rocha-Filho PA. Exotic Vegetable Oils for Cosmetic O/W Nanoemulsions: In Vivo Evaluation. Molecules. 2016; 21(3):248. https://doi.org/10.3390/molecules21030248
Chicago/Turabian StylePereira, Tatiana A., Carolina M. Guerreiro, Monica Maruno, Marcio Ferrari, and Pedro Alves Rocha-Filho. 2016. "Exotic Vegetable Oils for Cosmetic O/W Nanoemulsions: In Vivo Evaluation" Molecules 21, no. 3: 248. https://doi.org/10.3390/molecules21030248
APA StylePereira, T. A., Guerreiro, C. M., Maruno, M., Ferrari, M., & Rocha-Filho, P. A. (2016). Exotic Vegetable Oils for Cosmetic O/W Nanoemulsions: In Vivo Evaluation. Molecules, 21(3), 248. https://doi.org/10.3390/molecules21030248