1. Introduction
Sustainability is one of today’s most important goals in any human activity, and decreased environmental impacts must be a basic objective for its achievement. Therefore, many businesses are implementing environment management systems following such standards as the ISO 14001 [
1] or EMAS [
2], which are the starting point for pollution control.
There are several different methods for evaluating environmental impact. Life Cycle Assessment (LCA) is one of the most widely used. LCA includes four steps: goal and scope definition, inventory analysis, Life Cycle Impact Assessment (LCIA) and interpretation of results. In the first step (goal and scope), the limits of the system and the focus of the analysis are defined. Inventory analysis involves compiling an inventory of raw materials, energy consumption and pollutants production. In the LCIA step, the data from the inventory are assigned to different impact categories and characterized according to the corresponding factors. These impact categories depend on whether midpoint methods [
3,
4], defining only impacts in categories such as ozone depletion, climate change,
etc., or endpoint methods [
5,
6], which analyze final impacts on human health, environment or resources consumption, are used.
Environmental consequences can also be analysed using an environmental risk index, as provided for in Directive 96/82/EC [
7], which is to be replaced as of June 1, 2015, by Directive 2012/18/EU [
8]. It is based on the analysis of four parameters: risk sources (analysis of possible accidents including hazardous substances involved), primary control systems (preventive and protective measures to reduce the consequences of an accident, for example, retention ponds), transport systems (pollutant concentration profile in the area affected by a spill), and sensitive receptors (agricultural areas, protected species, monuments,
etc., present in the area affected by a spill). With these factors, the environmental consequences index can be calculated, which when combined with the probability of an accident, results in an environmental risk index.
A third method of environmental analysis is based on Directive 2004/35/CE [
9]. This Directive proposes a methodology very similar to the one used for risk evaluation in industrial safety. The first step is the identification of hazards and possible environmental accidents by techniques such as the event tree. The second step is modelling the accidents and evaluating their consequences, considering the setting where they occur. Then risk is evaluated by including their probability, estimated, for instance, by tree fault analysis. Finally, an economic assessment is made of damage caused by the accidents and the cost of recovery of affected areas.
Finally, the methodology (Arteche
et al. [
10]) selected for the estimation of environmental impact in this study is based on application of risk indexes [
11]. The first stage is identification of the steps in the processes under study in three different situations: normal, abnormal and emergency operations. The environmental impact is evaluated for each considering two aspects, pollution (wastewater, solids, air or soil) and consumption (raw materials, water, energy). Risk assessment is based on frequency (probability), hazard and amount (volume). Numerical criteria are provided to assign a value to the environmental risk, thus enabling comparison of the environmental impact of processes and/or operations. The numerical criteria proposed by Arteche
et al. [
10] were updated and adapted to the particular cases studied, which were laboratory or small pilot plant operations, and current legislation. The values found in this paper are therefore noticeably different from those originally proposed by Arteche
et al. [
10]. The final result is the Global Environmental Risk Index (E), which gives an overview of the environmental priority of each activity related to other analogous activities. Its evaluation is the main purpose of this paper. Other related indexes are also evaluated for comparison of the various process operations and aspects involved. This method is amply explained in the following sections, and a practical application is developed for two AOPs, photo-Fenton and heterogeneous photocatalysis with TiO
2 in suspension, both carried out in a Solarbox. This application enables evaluation of such processes according to their risk.
2. Results and Discussion
The environmental impact indexes are calculated as shown in
Table 1, where the operations involved in the evaluation are given on the left, and the points evaluated are at the top. As shown in the second column, three types of operations are considered: normal, abnormal and emergency. The operations included in each group are described in the third column. Photocatalytic treatment of metoprolol tartrate salt (MET), a common β-blocker found in wastewater [
12], in aqueous solution with TiO
2 in suspension in the Solarbox, is presented as an example. In this case, the operations included are (see third column in
Table 1):
Normal: Preparation of MET solution, Weighting TiO2, Experiment Development, Sampling, Analysis, Reactor emptying and cleaning.
Abnormal: Disassembly of experimental equipment for maintenance.
Emergency: Tank or reactor breakdown and/or solvent spillage.
Two aspects are evaluated—pollution and consumption (second row in
Table 1)—and each includes several specific parameters. Four parameters are considered for pollution: wastewater, solid waste, air emission and soil pollution (third row in
Table 1). Consumption includes raw materials (in our case, MET), water and energy (third row in
Table 1). For each of these (fourth row in
Table 1), frequency (A), hazard (B) and amount (C) are considered. The final result, which is calculated as the product of these values, as shown in Column R
ij, gives an idea of the risk of that aspect. Numerical values assigned to evaluate each item are from the criteria in
Table 2,
Table 3 and
Table 4. The values proposed by Arteche [
10] are taken as a first approximation. However, they have been modified and updated to current legislation and adapted to laboratory, pilot plant or industrial scale for this study.
Table 1.
Environmental Risk Identification and Evaluation. Process tested: MET treatment by photocatalysis with TiO
2 in the Solarbox. Parameters A–C are defined in
Table 2,
Table 3 and
Table 4, respectively.
Table 1.
Environmental Risk Identification and Evaluation. Process tested: MET treatment by photocatalysis with TiO2 in the Solarbox. Parameters A–C are defined in Table 2, Table 3 and Table 4, respectively.
| | Environmental Aspects | | |
|---|
| Pollution | Consumption |
|---|
| 1. Waste Water | 2. Solid Waste | 3. Air Emissions | 4. Soil Pollution | 5. Raw Materials | 6. Water | 7. Energy |
|---|
| A | B | C | Rij | A | B | C | Rij | A | B | C | Rij | A | B | C | Rij | A | B | C | Rij | A | B | C | Rij | A | B | C | Rij | EOi | %EOi, max |
|---|
| Operation | Normal Operation | 1. Preparation of MET solution | | | MET powders | | MET | Water | | | |
| | | | | | | | | 6 | 1 | 1 | 6 | | | | | 6 | 1 | 1 | 6 | 6 | 2 | 1 | 12 | | | | | 24 | 0.42 |
| 2. Weighting of TiO2 | | | TiO2 powders | | TiO2 | | | | |
| | | | | | | | | 6 | 1 | 1 | 6 | | | | | 6 | 1 | 1 | 6 | | | | | | | | | 12 | 0.21 |
| 3. Experiment Development | | Gloves | | | | | Electricity for lamp, pumps, stirrer | | |
| | | | | 6 | 1 | 1 | 6 | | | | | | | | | | | | | | | | | 6 | 5 | 2 | 60 | 66 | 1.16 |
| 4. Sampling | | Filters | | | | | | | |
| | | | | 6 | 1 | 2 | 12 | | | | | | | | | | | | | | | | | | | | | 12 | 0.21 |
| 5. Analysis | Aqueous solution with organics | | Air TOC | | Reagents | Water for preparations | Electricity for equipment | | |
| 6 | 10 | 3 | 180 | | | | | 6 | 5 | 2 | 60 | | | | | 6 | 10 | 2 | 120 | 6 | 2 | 1 | 12 | 6 | 5 | 3 | 90 | 462 | 8.11 |
| 6. Reactor emptying and cleaning | Aqueous solution with organics | Adsorbent paper | | | | Water for cleaning | Electricity for pump, stirrer | | |
| 6 | 3 | 4 | 72 | 6 | 1 | 1 | 6 | | | | | | | | | | | | | 6 | 2 | 2 | 24 | 6 | 5 | 2 | 60 | 162 | 2.84 |
| Abnormal Operation | 7. Disassembly of experimental equipment for maintenance | | Crashing of reactor | | | | | | | |
| | | | | 1 | 1 | 1 | 1 | | | | | | | | | | | | | | | | | | | | | 1 | 0.02 |
| Emergency Operation | 8. Tank or reactor breakdown and/or solvent spillage | Aqueous solution with organics | Adsorbent material | | | | | | | |
| 1 | 3 | 2 | 6 | 1 | 1 | 1 | 1 | | | | | | | | | | | | | | | | | | | | | 7 | 0.12 |
| | EAi | 258 | 26 | 72 | 0 | 132 | 48 | 210 | E = 746 | - |
| | %EAi,max | 3.23 | 0.33 | 0.90 | 0 | 1.65 | 3.00 | 5.25 | - | - |
Table 2.
Parameter A (Frequency): Numerical values for Parameter A, assigned by the frequency (probability) of occurrence of each event.
Table 2.
Parameter A (Frequency): Numerical values for Parameter A, assigned by the frequency (probability) of occurrence of each event.
| | Aspect to Be Evaluated |
|---|
| Waste-water | Solid Wastes | Air Emission | Soil Pollution | Raw Material | Water | Energy |
|---|
| Frequency | Accidental | 1 | 1 | 1 | 1 | 1 | 1 | 1 |
| Yearly | 2 | 2 | 2 | 2 | 2 | 2 | 2 |
| Monthly | 4 | 4 | 4 | 4 | 4 | 4 | 4 |
| Every two weeks | 5 | 5 | 5 | 5 | 5 | 5 | 5 |
| Weekly | 6 | 6 | 6 | 6 | 6 | 6 | 6 |
| Three times a week | 8 | 8 | 8 | 8 | 8 | 8 | 8 |
| Daily | 10 | 10 | 10 | 10 | 10 | 10 | 10 |
Table 3.
Parameter B (Hazard): Numerical values for Parameter B, assigned by how hazardous each event is.
Table 3.
Parameter B (Hazard): Numerical values for Parameter B, assigned by how hazardous each event is.
| Emission or Consumption Hazard | Rate | Notes |
|---|
| Wastewater |
| No contact with raw materials or products | 1 | |
| Contact Non-hazardous | 3 | (1),(3) |
| Contact with Products with signal word Warning | 6 | (1),(3) |
| Contact with Products with signal word Danger | 10 | (1),(3) |
| Solid Wastes |
| Not in Decision 2000/532/EC | 1 | (2),(3) |
| Not hazardous in Decision 2000/532/EC | 5 | (2),(3) |
| Hazardous in Decision 2000/532/EC | 10 | (2),(3) |
| Air Emissions |
| Non-hazardous | 1 | (1),(3) |
| Products with signal word Warning | 5 | (1),(3) |
| Products with signal word Danger | 10 | (1),(3) |
| Soil Pollution |
| Non-hazardous | 1 | (1),(3) |
| Products with signal word Warning | 5 | (1),(3) |
| Products with signal word Danger | 10 | (1),(3) |
| Raw Materials |
| Non-hazardous | 1 | (1),(3) |
| Products with signal word Warning | 5 | (1),(3) |
| Products with signal word Danger | 10 | (1),(3) |
| Water |
| Any water consumption | 2 | |
| Energy |
| Any energy consumption | 5 | |
Table 4.
Parameter C (Amount): Numerical values for Parameter C, assigned by the amount of product or energy consumption involved.
Table 4.
Parameter C (Amount): Numerical values for Parameter C, assigned by the amount of product or energy consumption involved.
| Discharge/Emissions or Consumption | Rate |
|---|
| Wastewater | |
| <0.001 m3/year | 1 |
| 0.001–0.01 m3/year | 2 |
| 0.01–0.1 m3/year | 3 |
| 0.1–1 m3/year | 4 |
| 1–10 m3/year | 5 |
| 10–100 m3/year | 6 |
| 100–1000 m3/year | 7 |
| 1000–10,000 m3/year | 8 |
| 10,000–100,000 m3/year | 9 |
| >100,000 m3/year | 10 |
| Solid Wastes |
| <0.001 tn/year | 1 |
| 0.001–0.01 tn/year | 2 |
| 0.01–0.1 tn/year | 3 |
| 0.1–1 tn/year | 4 |
| 1–10 tn/year | 5 |
| 10–100 tn/year | 6 |
| 100–1000 tn/year | 7 |
| 1000–10,000 tn/year | 8 |
| 10,000–100,000 tn/year | 9 |
| >100,000 tn/year | 10 |
| Air Emission (Polluted Air Flow-Rate) |
| <1 Nm3/year | 1 |
| 1–10 Nm3/year | 2 |
| 10–100 1Nm3/year | 3 |
| 100–1000 Nm3/year | 4 |
| 103–104 Nm3/year | 5 |
| 104–105 Nm3/year | 6 |
| 105–106 Nm3/year | 7 |
| 106–107 Nm3/year | 8 |
| 107–108 Nm3/year | 9 |
| >108 Nm3/year | 10 |
| Soil Pollution (Amount of Product Discharged) | |
| <0.001 tn/year | 1 |
| 0.001–0.01 tn/year | 2 |
| 0.01–0.1 tn/year | 3 |
| 0.1–1 tn/year | 4 |
| 1–10 tn/year | 5 |
| 10–100 tn/year | 6 |
| 100–1000 tn/year | 7 |
| 1000–10,000 tn/year | 8 |
| 10,000–100,000 tn/year | 9 |
| >100,000 tn/year | 10 |
| Raw Materials | |
| <0.001 tn/year | 1 |
| 0.001–0.01 tn/year | 2 |
| 0.01–0.1 tn/year | 3 |
| 0.1–1 tn/year | 4 |
| 1–10 tn/year | 5 |
| 10–100 tn/year | 6 |
| 100–1000 tn/year | 7 |
| 1000–10,000 tn/year | 8 |
| 10,000–100,000 tn/year | 9 |
| >100,000 tn/year | 10 |
| Water | |
| <0.1 m3/year | 1 |
| 0.1–1 m3/year | 2 |
| 1–10 m3/year | 3 |
| 10–100 m3/year | 4 |
| 100–1000 m3/year | 5 |
| 1000–10,000 m3/year | 6 |
| 10,000–100,000 m3/year | 8 |
| >100,000 m3/year | 10 |
| Energy | |
| <50 kW.h/year | 1 |
| 50–500 kW.h/year | 2 |
| 500–2500 kW.h/year | 3 |
| 2500–15,000 kW.h/year | 5 |
| 15,000–75,000 kW.h/year | 7 |
| 75,000–150,000 kW.h/year | 9 |
| >150,000 kW.h/year | 10 |
As an example, the proposed method has been applied to the photocatalytic treatment of MET with TiO
2 in suspension in a Solarbox (
Table 1). For each operation and each environmental aspect involved in the process, a R
ij index can be evaluated, where subscript
i indicates the operation and subscript
j indicates the environmental aspect. In our case,
i varies from 1–8, because eight operations are involved in the process (see third column in
Table 1). On the other hand, subscript
j varies from 1–7, because there are seven environmental aspects (see third row in
Table 1). The specific agent is shown in the cell corresponding to each operation and for each environmental aspect. For instance, in Environmental Aspect 1 (wastewater), the specific wastewater generated is shown in the corresponding cells (see
Table 1):
aqueous solution with organics for Operation 6 (Reactor emptying and cleaning) and
aqueous solution with organics for Operation 8 (Tank or reactor breakdown and/or solvent spillage).
Data related to energy or raw materials and reagent consumption are required for any environmental impact assessment. Electricity consumption data for photocatalytic treatment of MET in the Solarbox are shown in
Table 5. Obviously, the consumption of raw materials must be known. This is summarized in
Table 6. The consumption of reagents for analysis must also be included in raw materials consumption. These data are presented in
Table 7.
Table 5.
Electricity consumption in MET photocatalytic treatment experiments in a Solarbox for 50 experiments/year.
Table 5.
Electricity consumption in MET photocatalytic treatment experiments in a Solarbox for 50 experiments/year.
| Experiment |
|---|
| Equipment | Time Use Equipment (h/exp) | Power (kW) | Consumption (kWh) | Yearly Consumption (kWh/y) |
| Lamp (1000 W) | 5.5 | 1.00 | 5.50 | 275 |
| Pump (250–500 W) | 5.5 | 0.40 | 2.20 | 110 |
| Thermostatic bath (240 W at 20 °C) | 5.5 | 0.24 | 1.32 | 66 |
| Stirrer (1–5 W) | 5.5 | 0.003 | 0.02 | 0.8 |
| Total consumption/year (kWh/y) | | | | 452 |
| Analysis |
| Equipment | Time Use Equipment (h/exp) | Power (kW) | Consumption (kWh) | Yearly Consumption (kWh/y) |
| HPLC (12 samples × 15 min/sample) | 3 | 2.50 | 7.50 | 375 |
| TOC (12 samples × 15 min/sample) | 3 | 2.20 | 6.60 | 330 |
| Spectrophotometer (DQO+Fe+H2O2+SUVA) | 0.2 | 0.25 | 0.05 | 2.5 |
| Water deionization device (preparation 1 L water) | 0.1 | 0.10 | 0.01 | 0.5 |
| Total consumption/year (kWh/y) | | | | 708 |
Table 6.
Reagent consumption in the photocatalytic experiments with a 1 L reaction volume for 50 experiments/year.
Table 6.
Reagent consumption in the photocatalytic experiments with a 1 L reaction volume for 50 experiments/year.
| Reagents | Concentration—Amount/Exp | Total Amount/Exp | Yearly Consumption (kg) |
|---|
| Metoprolol tartrate salt | 50 mg/L | 50 mg | 0.003 |
| TiO2 | 0.4 g/L | 0.4 g | 0.02 |
| Millipore Water | | 1.00 L | 50 |
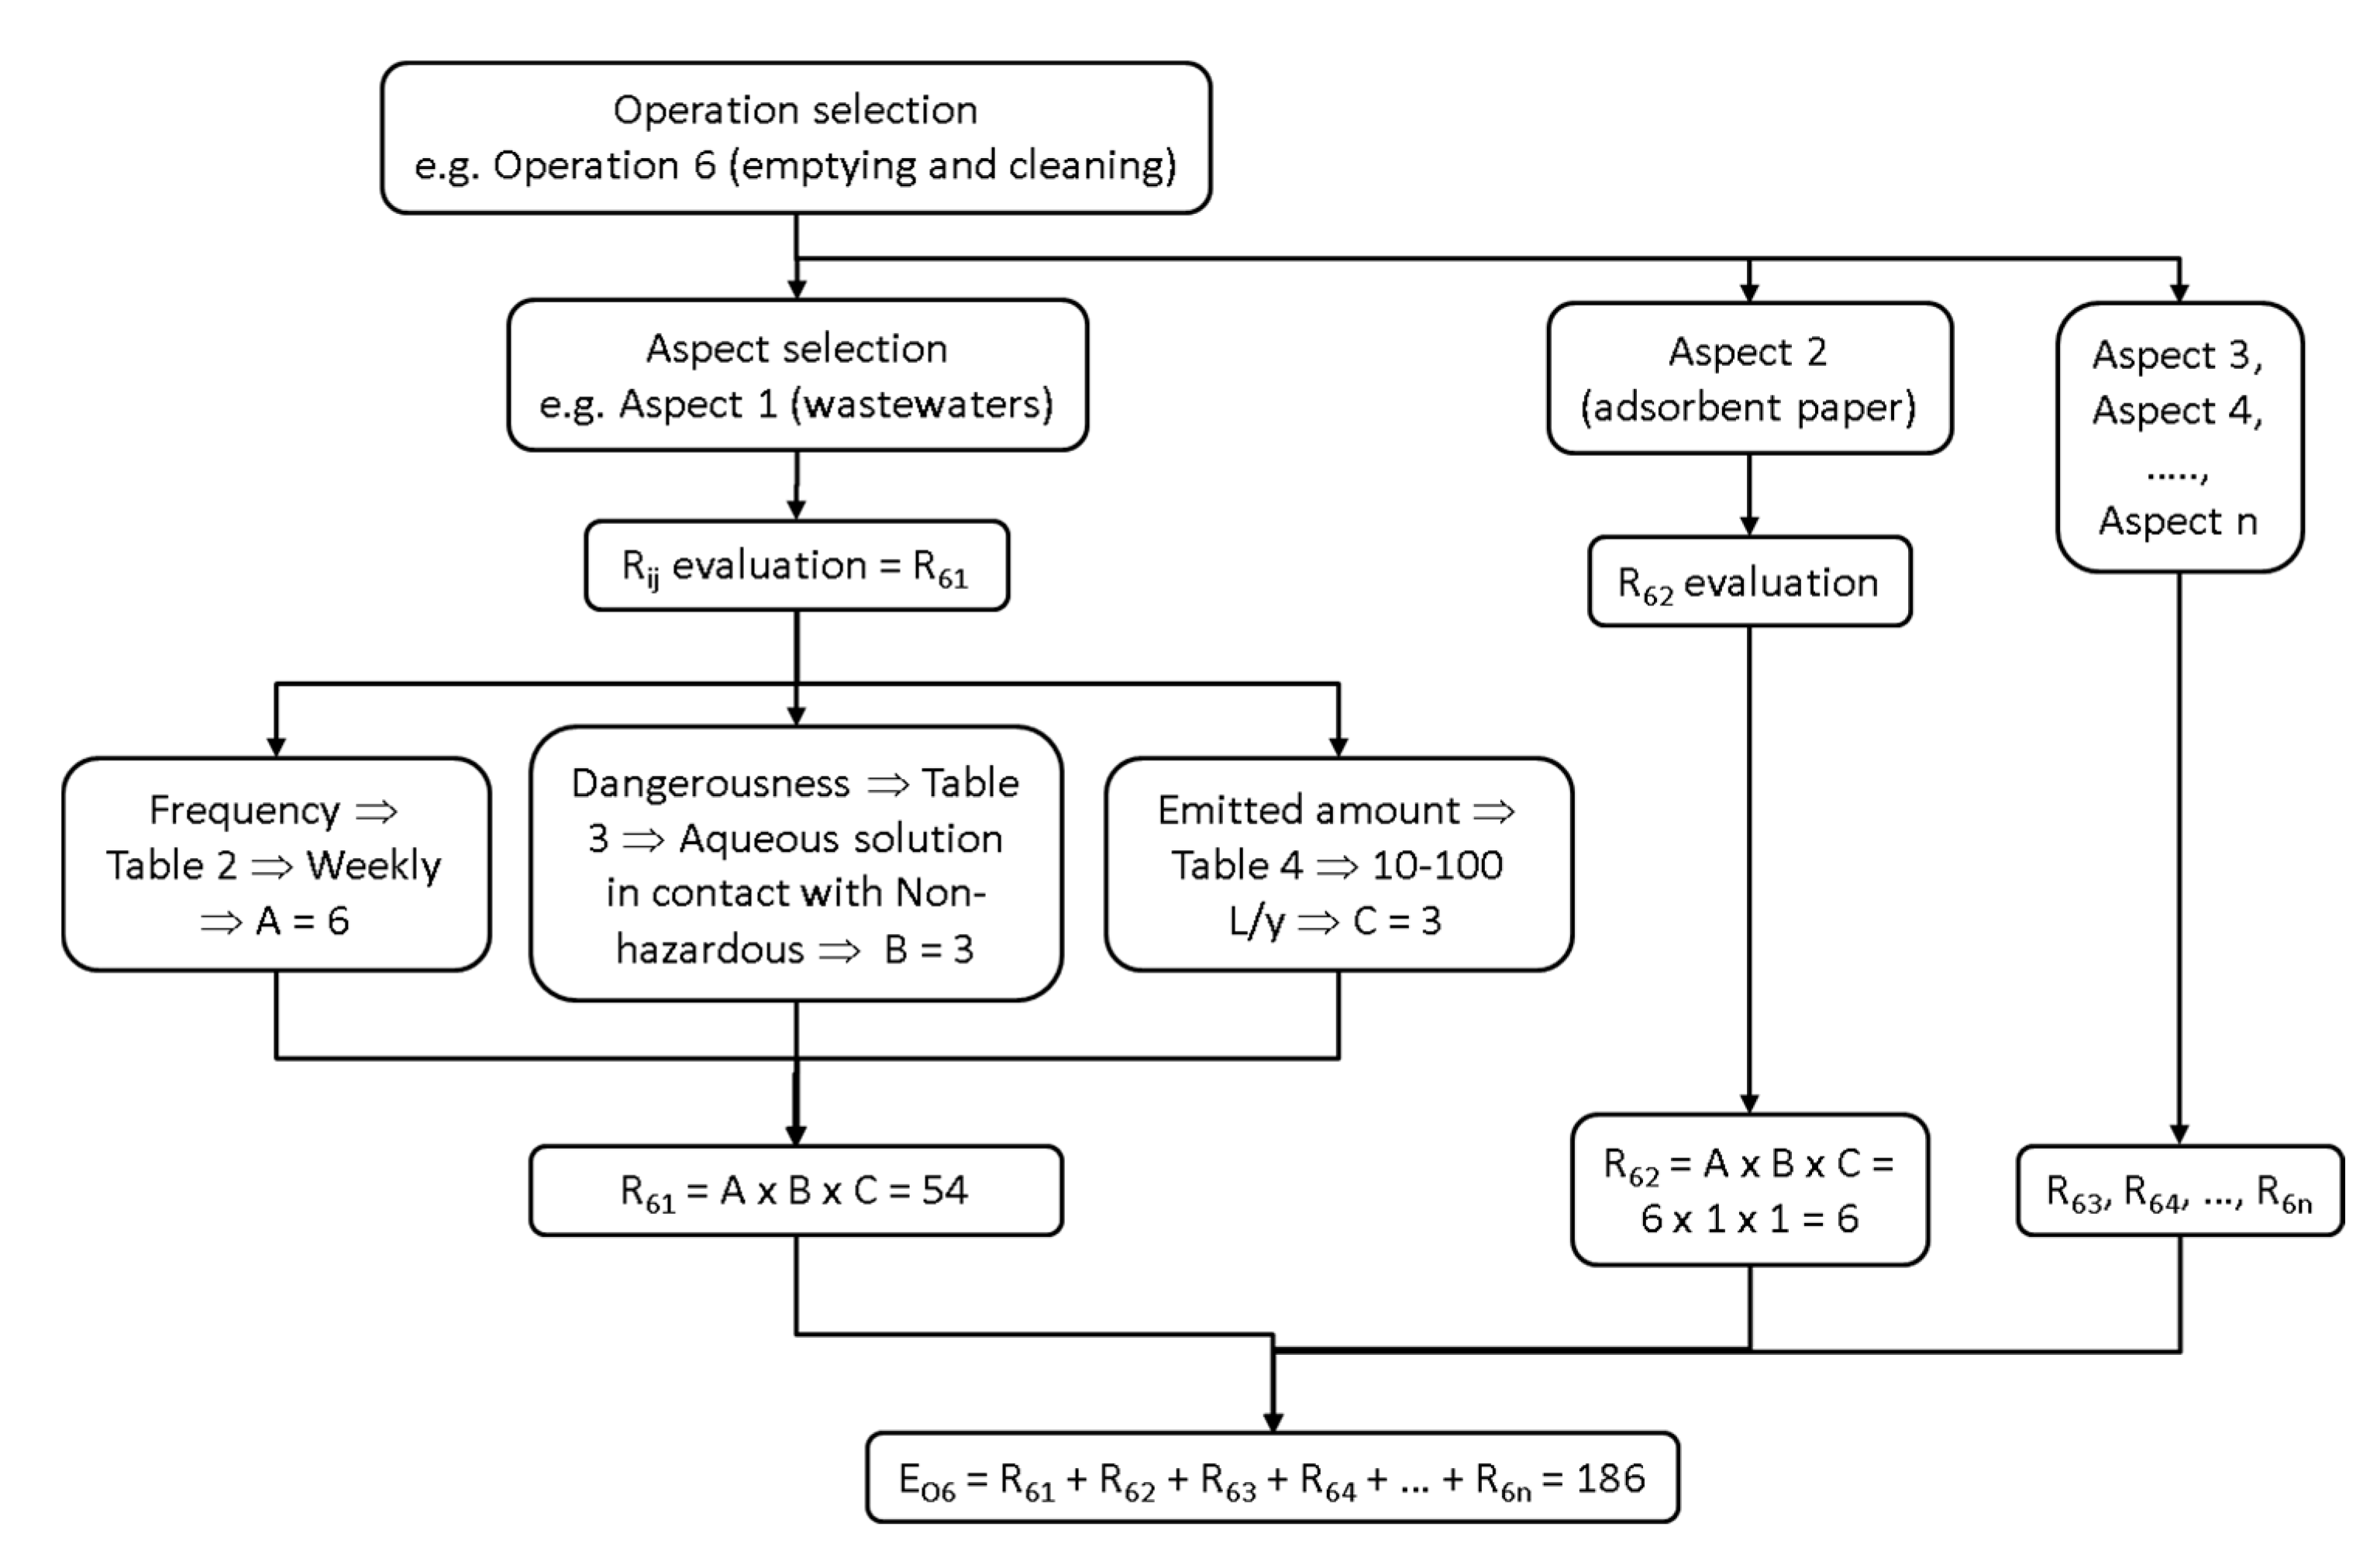
An explanation for one of the lines in
Table 1 is given below to clarify its use (see shaded cells). For instance, for
Reactor emptying and cleaning (Operation 6), subscript
i (1–8) in the R
ij index is 6. Wastewater is generated in this operation, which implies that subscript
j (1–7) in R
ij is 1. Wastewater frequency is weekly, and according to
Table 2 criteria, a value of 6 can be assigned to Parameter A. Considering that it is an aqueous solution in contact with non-hazardous products, a value of 3 is assigned to parameter B, according to
Table 3 criteria. Finally, the amount discharged is from 100 to 1000 L/year and a value of 4 is assigned to Parameter C, according to the criteria in
Table 4. Thus, risk R
ij (R
61) associated with Operation 6 and wastewater discharged has a value of 72 (product of AxBxC). Similarly, for the same operation (Operation 6), the risk for water consumption (Aspect 6) is R
66, and the value for Parameter A is 6 (weekly frequency). For Parameter B, the value is 2 (water consumption hazard). Finally, Parameter C is 2 (between 100 and 1000 L/year). Thus, R
66 = 24. The rest of the risk indexes associated with
reactor emptying and cleaning (Operation 6) can be calculated in a like manner.
Table 7.
Reagent consumption in the analysis of photocatalytic experiments for 50 experiments/year.
Table 7.
Reagent consumption in the analysis of photocatalytic experiments for 50 experiments/year.
| Parameter | Amount/Sample | Samples/Exp | Total Amount/Exp | Yearly Consumption |
|---|
| MET analysis |
| Acetonitrile HPLC | 2.55 mL | 15 | 38.25 mL | 1.5 kg |
| Acidified water HPLC | 10.2 mL | 15 | 153.00 mL | 7.7 kg |
| TOC analysis |
| Synthetic air TOC (150 mL/min × 15/min/sample) | 2250 mL | 15 | 33750 mL | 1.5 Nm3 |
| COD analysis |
| Dichromate COD | 1.5 mL | 4 | 6 mL | 0.3 kg |
| H2SO4 COD | 3.5 mL | 4 | 14 mL | 0.7 kg |
| BOD |
| Reagents | Negligible | 0 | | 0 |
| Lyophilized capsules | 0.0625 capsules | 4 | 0.25 | 12.5 capsules |
| Toxicity |
| Osmotic adjuster | 0.25 mL | 6 | 1.5 mL | 0.1 kg |
| Dilution water | 7.5 mL | 6 | 45 mL | 2.3 kg |
| Bacteria restorative (1 mL/container) | 0.056 mL | 6 | 0.333 mL | 0.02 kg |
| Bacteria | 0.056 containers | 6 | 0.333 cont. | 17 containers |
| Sampling |
| Filters for samples | 1 filter | 15 | 15 filters | 750 filters |
All the R
ij values in
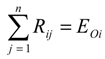
Table 1 were calculated as described in the examples above. When they have all been determined, the environmental risk index E
Oi associated with each operation, or the environmental risk index E
Aj associated with each environmental aspect, can be calculated. Thus, the second-last column in
Table 1 shows the environmental risk associated with each operation E
Oi, calculated as the sum of the risks:
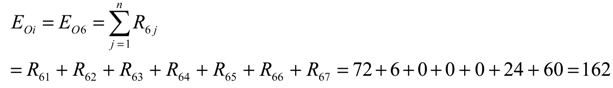
As an example, total risk E
O6 associated with Operation 6 can be calculated as the sum of the risks associated with each aspect:
This process is summarized schematically in
Figure 1.
Figure 1.
Evaluation of Environmental Risk Index: Schematic view.
Figure 1.
Evaluation of Environmental Risk Index: Schematic view.
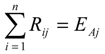
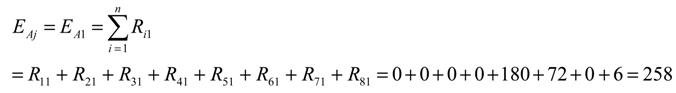
The last row in
Table 1 shows the environmental risk associated with each environmental aspect E
Ai, calculated as the sum of the risks for all the operations included in the process:
For example, for wastewater (see Environmental Aspect 1), the E
Ai is:
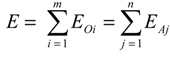
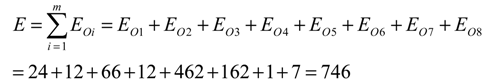
The Global Environmental Risk Index (E) for this process is the sum of the E
Oi or E
Aj values. This index appears in the second-to-the-last cell (bottom-right) in
Table 1:
Applying all of this to the values in
Table 1 results in:
An interesting index is the percentage of risk for the maximum possible (%E
Oi,max). The maximum R
ij possible for each of the first five aspects (wastewater, solid wastes, air emission, soil pollution, raw materials consumption), is 1000, which is the product of the maximums possible for A, B and C, according to
Table 2,
Table 3 and
Table 4. For water consumption, the maximum possible is 200 and for energy consumption the maximum is 500. Thus, the E
Oi maximum for any operation is 5700. Dividing 5700 by the E
Oi for each operation and multiplying by 100, %E
Oi,max can be found for each operation (see the last column of
Table 1).
Similar reasoning follows for EAi,max. Thus, the maximum EAi for each aspect is 8000 for the first five aspects (wastewater, solid waste, air emission, soil pollution, raw materials consumption), that is, 1000 for each aspect (10 for frequency, 10 for hazard and 10 for the amount) multiplied by the eight operations in our case. EAi,max is EAi × (100/8000). The maximum of EAi for water consumption is 1600. Thus, EAi,max for water consumption is 3.0%. For energy consumption, the maximum is 4000 and EAi,max is 5.25.
The environmental risk indexes can be found the same way for photo-Fenton MET treatment in a Solarbox. As in photocatalysis, first you need to know the electricity and raw materials consumed. The electricity consumption data are the same as for the photocatalytic experiments and the only change is the time needed for each experiment, which in this case is 3.5 h. Thus, the total consumption of electricity by year, corresponding to the experiments performed, is 288 kWh/y. The rest of the data are the same as in
Table 5.
Data corresponding to reagent consumption appears in
Table 8. Note that changes from
Table 6 (photocatalysis) are TiO
2 disappearance and FeSO
4 and H
2O
2 appearance.
Table 8.
Reagent consumption in photo-Fenton experiments with a 1-L reaction volume for 50 experiments/year.
Table 8.
Reagent consumption in photo-Fenton experiments with a 1-L reaction volume for 50 experiments/year.
| Reagents | Concentration—Amount/Exp | Total Amount Reagent/Exp. | Yearly Consumption (Kg) |
|---|
| Metoprolol tartrate salt | 50 mg/L | 50 mg | 0.003 |
| FeSO4.7H2O (7 mg/L Fe) | 7 mg/L | 34.75 mg | 0.002 |
| H2O2 (100 mg/L) | 100 mg/L | 333.3 mg | 0.017 |
| Millipore Water | | 1.00 L | 50 |
Neither reagents for analysis, nor filters for samples (
Table 7) are needed in this case, while Fe and H
2O
2 analyses are. These changes from
Table 7 (photocatalysis) are observed in
Table 9 (photo-Fenton).
The risk indexes for photo-Fenton experiments can be evaluated using the amounts shown in the tables above, similar to what was explained for photocatalysis. Results are presented in
Table 10.
Comparisons can be made by taking the value found for each operation in each process. For the two processes studied (photocatalysis and photo-Fenton), the operations with the most risk are those related to analysis (Operation 5 in
Table 1 and Operation 6 in
Table 10) due to the use of highly hazardous reagents. In both cases, Operation 7, related to reactor emptying and cleaning, is the second most risky, which seems logical because wastewater generated may contain hazardous products. Finally, the third position in this virtual ranking of environmental risk of operations is running the experiment (Operation 3 in
Table 1 and Operation 4 in
Table 10). For the seven aspects analysed in each operation, photo-Fenton values are usually higher. There are two reasons for that, the number of operations involved is higher and the products used in photo-Fenton are more hazardous than those used in photocatalysis.
Table 9.
Reagent consumption in photo-Fenton experiment analyses for 50 experiments/year.
Table 9.
Reagent consumption in photo-Fenton experiment analyses for 50 experiments/year.
| Parameter | Amount/Sample | Samples/Exp | Total Amount/Exp | Yearly Consumption |
|---|
| MET analysis |
| Acetonitrile HPLC | 2.55 mL | 15 | 38.25 mL | 1.5 kg |
| Acidified water HPLC | 10.2 mL | 15 | 153 mL | 7.7 kg |
| TOC analysis |
| Synthetic air TOC (150 mL/min × 15/min/sample) | 2250 mL | 15 | 33750 mL | 1.5 Nm3 |
| COD analysis |
| Dichromate COD | 1.5 mL | 4 | 6 mL | 0.3 kg |
| H2SO4 COD | 3.5 mL | 4 | 14 mL | 0.7 kg |
| H2O2 analysis |
| Reagents for H2O2 determination | 1.5 mL | 2 | 3 mL | 0.15 kg |
| Fe analysis |
| Phenanthroline for Fe determination | 1.0 mL | 2 | 2 mL | 0.1 kg |
| BOD |
| Reagents | Negligible | 0 | 0 | 0 |
| Lyophilized capsules | 0.0625 capsules | 4 | 0.25 capsules | 12.5 capsules |
| Toxicity |
| Osmotic adjuster | 0.25 mL | 6 | 1.5 mL | 0.1 kg |
| Dilution water | 7.5 mL | 6 | 45 mL | 2.3 kg |
| Bacteria restorative (1 mL/container) | 0.056 mL | 6 | 0.333 mL | 0.02 kg |
| Bacteria | 0.056 containers | 6 | 0.333 cont. | 17 containers |
Of course, when comparisons are made, it has to be taken into account that the absolute values of E depend on the number of operations involved in the process, and it seems logical for E to increase when the number of operations is higher. Thus, from the results of
Table 1 and
Table 10, photo-Fenton is more dangerous than photocatalysis because their risk indexes (E = E
Oi = E
Aj) are 994 and 746, respectively.
However, the ratio of E to the number of operations (E/NOP) can be instructive with respect to process risk and a good parameter for processes comparison, because it represents an average. In addition, this ratio gives information on how hazardous process operations are. Of course, high E/NOP ratios imply more risky operations. The same may be said of the ratio of E to the number of aspects in the process (E/NAS). There are always seven aspects analysed in the process, as seen in
Table 1 and
Table 10. Thus, an increase in the E/NAS ratio means that the process environmental hazard increases. The E/NOP and E/NAS ratios are the highest for photo-Fenton (see
Table 11).
Table 10.
Environmental Risk Identification and Evaluation. Process tested: photo-Fenton MET treatment in the solarbox.
Table 10.
Environmental Risk Identification and Evaluation. Process tested: photo-Fenton MET treatment in the solarbox.
| | Environmental Aspects | | |
|---|
| Pollution | Consumption |
|---|
| 1. Waste water | 2. Solid Wastes | 3. Air Emission | 4. Soil Pollution | 5. Raw Materials | 6. Water | 7. Energy |
|---|
| A | B | C | Rij | A | B | C | Rij | A | B | C | Rij | A | B | C | Rij | A | B | C | Rij | A | B | C | Rij | A | B | C | Rij | EOi | %EOi,max |
|---|
| Operation | Normal Operation | 1. Preparation of MET solution | | | MET powders | | MET | Water | | | |
| | | | | | | | | 6 | 1 | 1 | 6 | | | | | 6 | 1 | 1 | 6 | 6 | 2 | 1 | 12 | | | | | 24 | 0.42 |
| 2. FeSO4 addition | | | | | FeSO4 | | | | |
| | | | | | | | | | | | | | | | | 6 | 5 | 1 | 30 | | | | | | | | | 30 | 0.53 |
| 3. H2O2 addition | | | | | H2O2 | | | | |
| | | | | | | | | | | | | | | | | 6 | 10 | 1 | 60 | | | | | | | | | 60 | 1.05 |
| 4. Experiment Development | | Gloves | | | | | Electricity for lamp, pumps, stirrer | | |
| | | | | 6 | 1 | 1 | 6 | | | | | | | | | | | | | | | | | 6 | 5 | 2 | 60 | 66 | 1.16 |
| 5. Sampling | | | | | | | | | |
| | | | | | | | | | | | | | | | | | | | | | | | | | | | | 0 | 0 |
| 6. Analysis | Aqueous solution with organics | | Air TOC | | Reagents | Water for preparation | Electricity for equipment | | |
| 6 | 10 | 3 | 180 | | | | | 6 | 5 | 2 | 60 | | | | | 6 | 10 | 2 | 120 | 6 | 2 | 1 | 12 | 6 | 5 | 3 | 90 | 462 | 8.11 |
| 7. Reactor emptying and cleaning | Aqueous solution with organics | Adsorbent paper | | | | Water for cleaning | Electricity for pump, stirrer | | |
| 6 | 10 | 4 | 240 | 6 | 1 | 1 | 6 | | | | | | | | | | | | | 6 | 2 | 2 | 24 | 6 | 5 | 2 | 60 | 330 | 5.79 |
| Abnormal Operation | 8. Disassembly of experimental equipment for maintenance | | Crashing of reactor | | | | | | | |
| | | | | 1 | 1 | 1 | 1 | | | | | | | | | | | | | | | | | | | | | 1 | 0.02 |
| Emergency Operation | 9. Tank or reactor breakdown and/or solvent spillage | Aqueous solution with organics | Adsorbent material | | | | | | | |
| 1 | 10 | 2 | 20 | 1 | 1 | 1 | 1 | | | | | | | | | | | | | | | | | | | | | 21 | 0.37 |
| | EAi | 440 | 14 | 66 | 0 | 216 | 48 | 210 | E = 994 | - |
| | %EAi, max | 4.89 | 0.16 | 0.73 | 0 | 2.40 | 2.67 | 4.67 | - | - |
Table 11.
Summarized final basic parameters for the environmental comparison of the processes.
Table 11.
Summarized final basic parameters for the environmental comparison of the processes.
| Process | E | E/NOP | E/NAS | Av. %EOi max | Av. %EAi max |
|---|
| Photocatalysis | 746 | 93 | 107 | 1.64 | 2.05 |
| Photo-Fenton | 994 | 110 | 142 | 1.94 | 2.22 |
Another parameter that can give an idea of the risk involved in the tested process is the percentage with respect to the maximum possible to be achieved for each operation and aspect (see last row and last column in
Table 1 and
Table 10). The averages are presented in
Table 11, for both items and processes. The first comment to be made is that in all cases the values are very low. This means that the hazard levels of the processes analysed are very low.


