Antioxidant Properties of Pyroligneous Acid Obtained by Thermochemical Conversion of Schisandra chinensis Baill


Abstract
:1. Introduction

| Chemical Composition | Content (%) | Reference |
|---|---|---|
| Essential oil | 1.2–3.0 | [32] |
| Polysaccharides | 1.2–2.2 | [33] |
| Anthocyanins | 2.0–3.2 | [34] |
| Terpenoids | <1.5 | [35] |
| Organic acids (citric, malic, fumaric and tartaric acid) | <1.0 | [35] |
| Vitamins C and E | <0.5 | [35] |
| Tannins | <1.5 | [35] |
| Biphenyl cyclooctene lignans and derivatives | 7.2–19.2 | [36] |
2. Results and Discussion
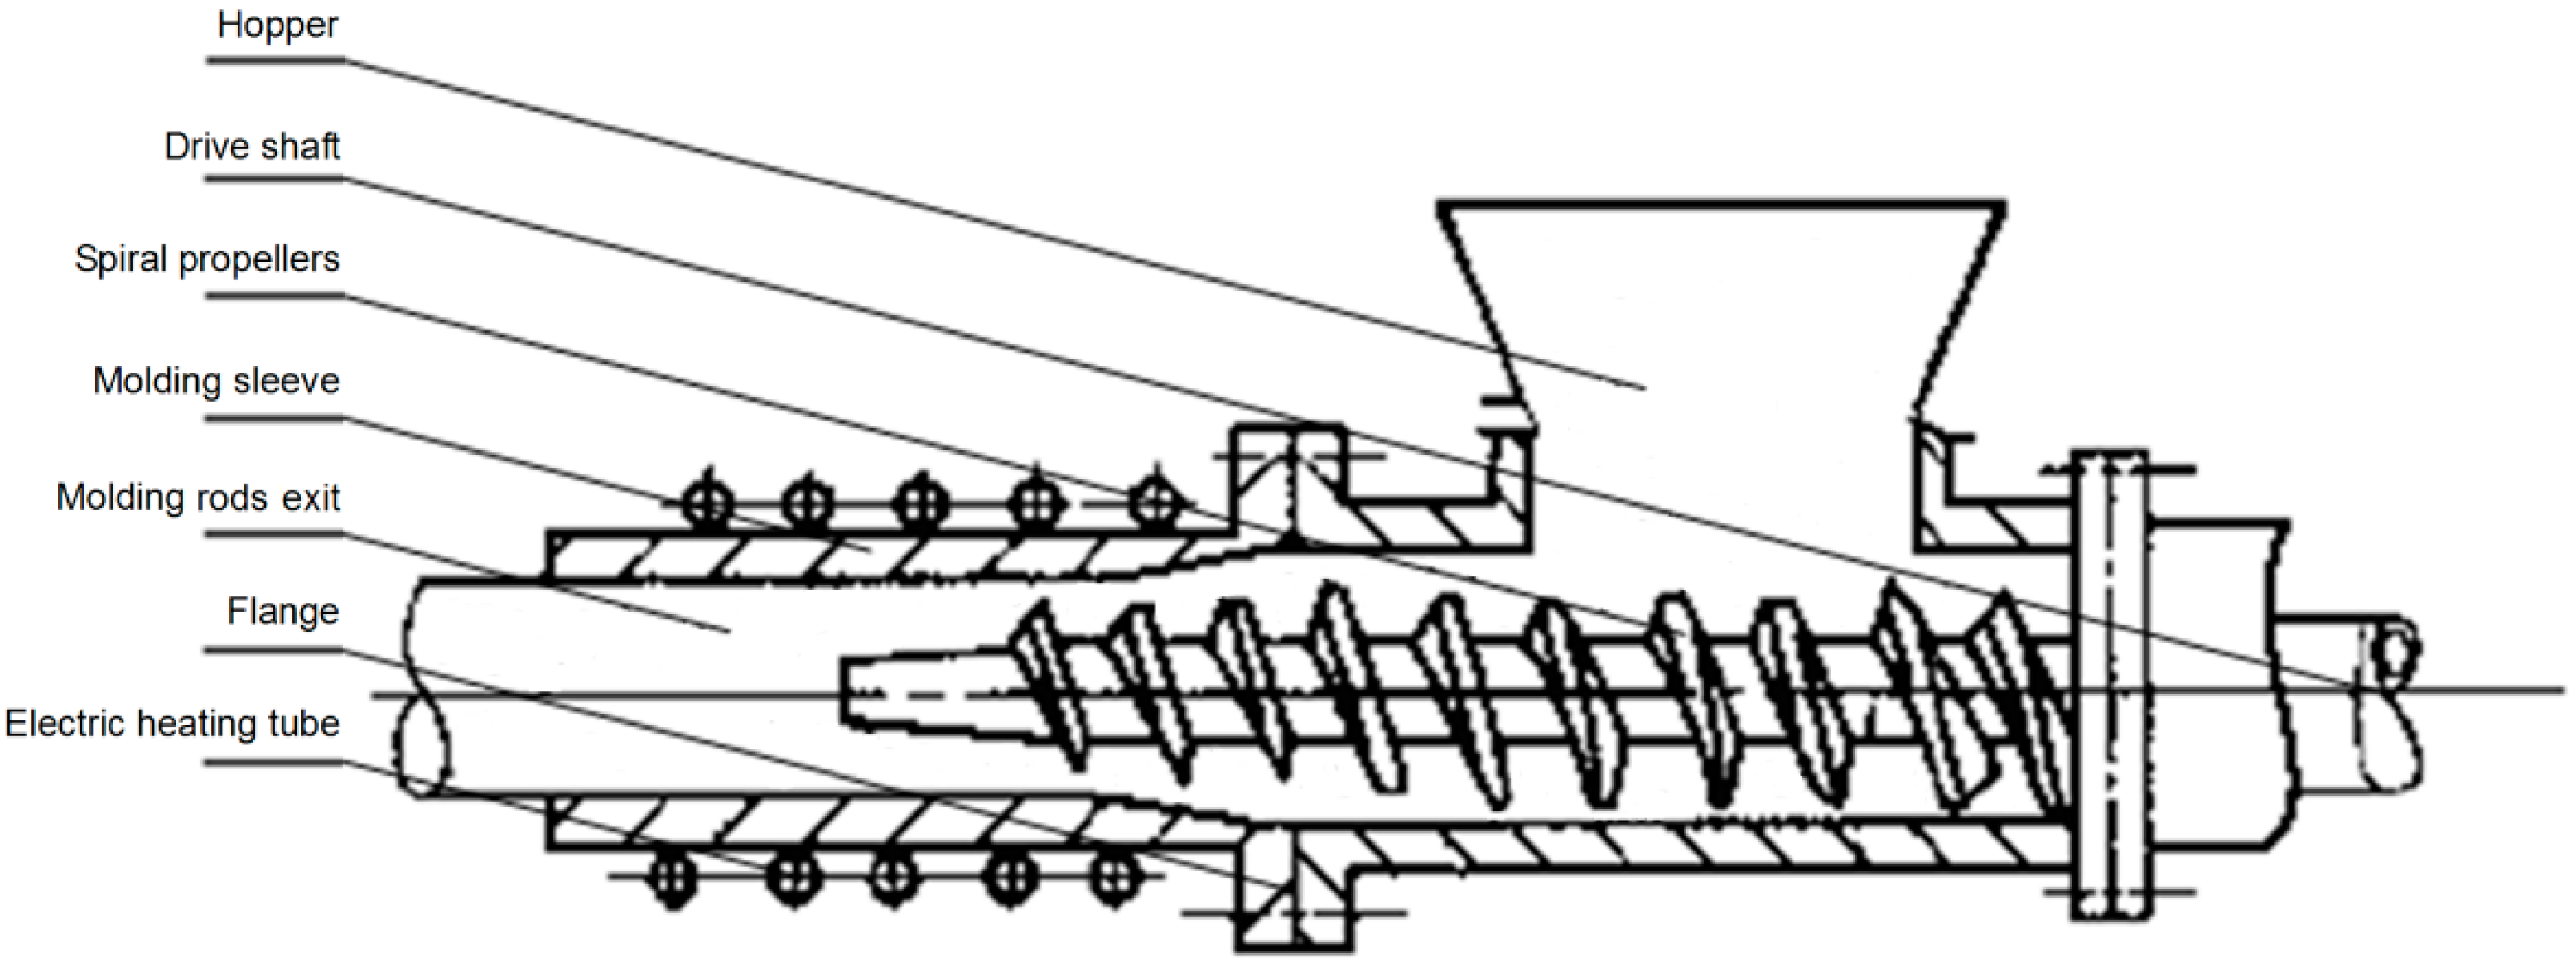
2.1. Influence of Moisture Content and Molding Temperature on the Briquetting Effect
| Moisture (%) | <5% | 5%–8% | 8%–13% | 13%–15% | >15% |
| Can be Briquetted | No | Almost not | Yes | Almost not | No |
| Briquetting Temperature (°C) | 50 | 100 | 150 | 200 | 250 | 300 | 350 | 400 |
|---|---|---|---|---|---|---|---|---|
| Can be briquetted | No | No | Yes | Yes | Yes | Yes | Almost not | No |
| Cracks on surface | —— | —— | Yes | No | Yes | Yes | A lot | —— |
| Carbonized on surface | —— | —— | No | No | A little | Partial | Totally | Seriously |
| Briquetting rate (kg/min) | —— | —— | 2.1 | 2.0 | 1.8 | 1.8 | 1.7 | —— |
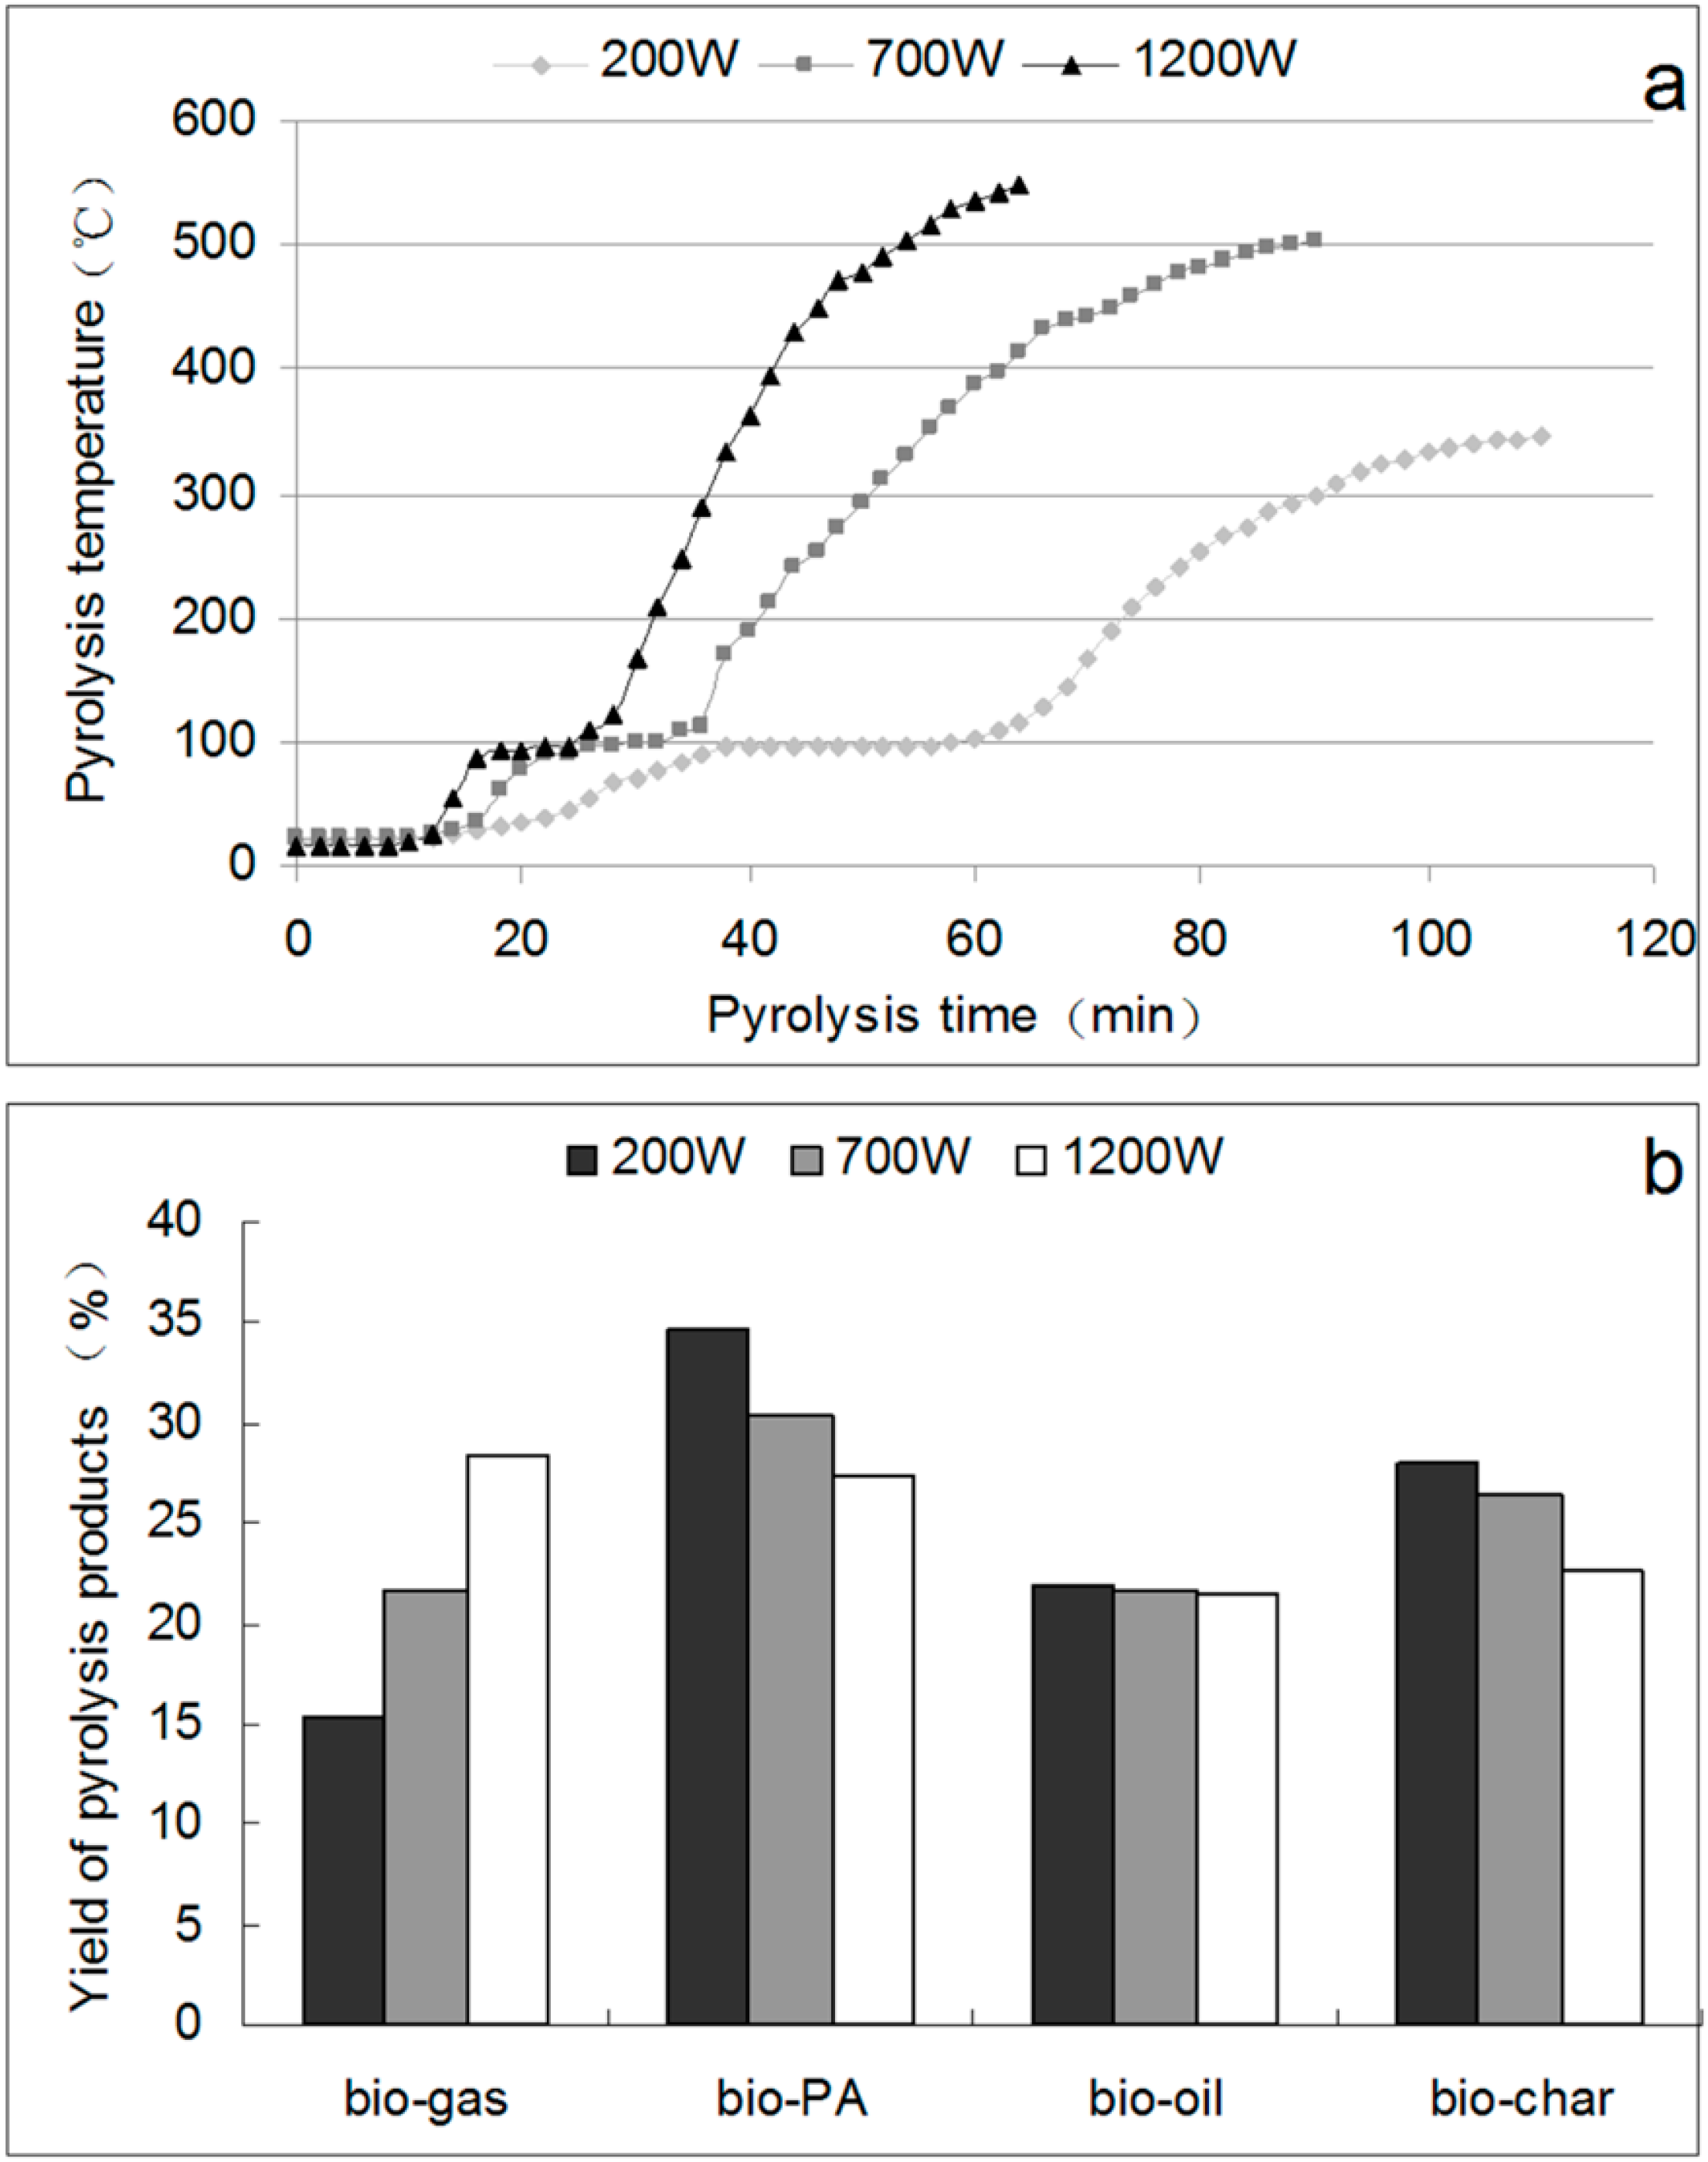
2.2. Pyrolysis Curves and Yields of Pyrolysis Products
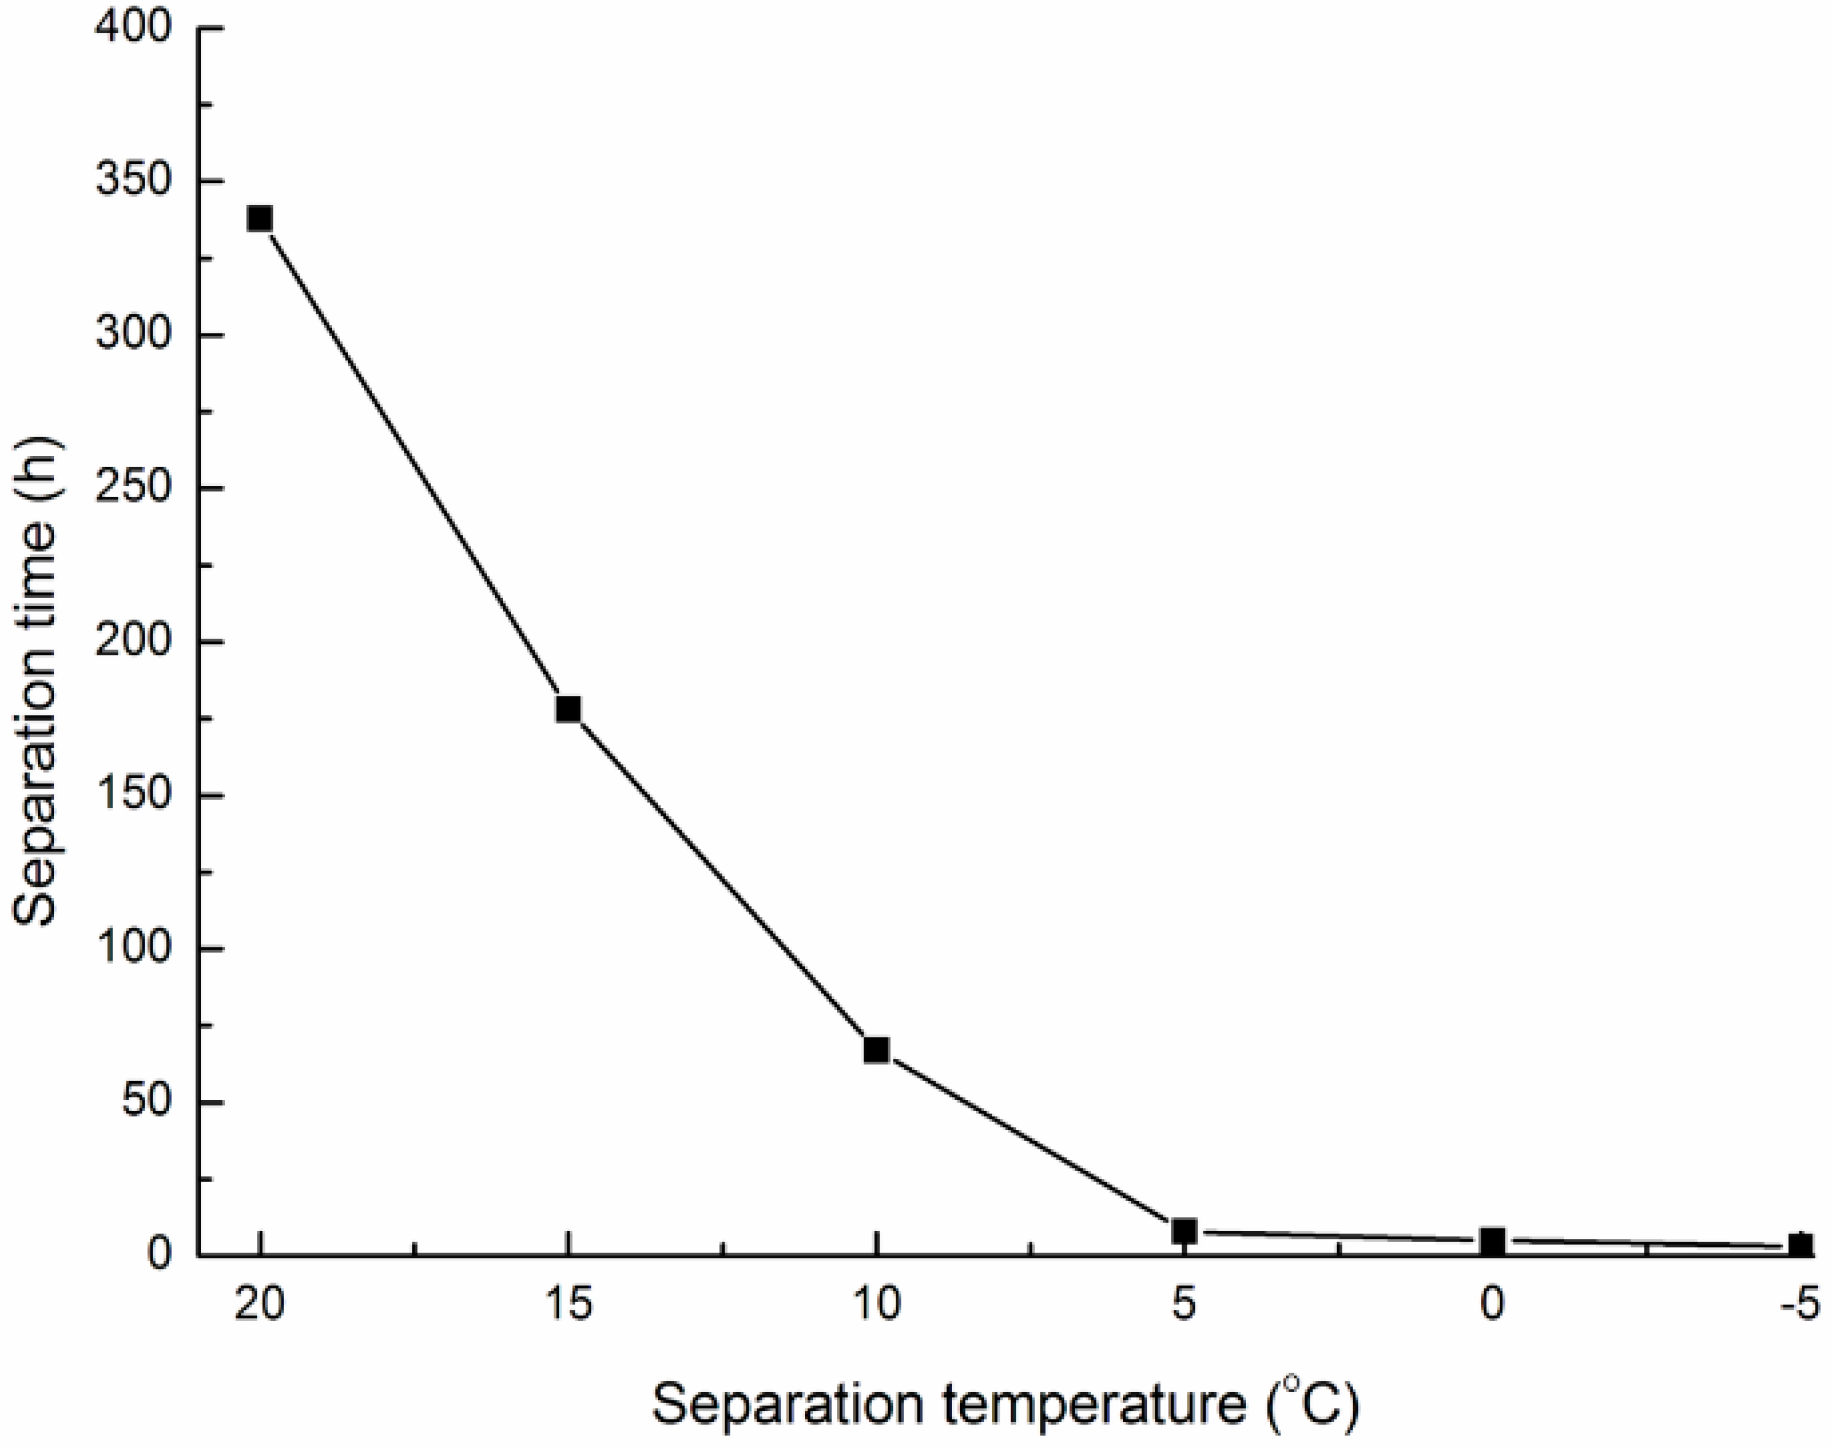
2.3. Separation of PA from Bio-Oil
2.4. Determination of Total Phenolics Content
| Heating Power (W) | Symbols | Gallic Acid Equivalents (mg/g) | |||
|---|---|---|---|---|---|
| EFEP a | DMEP b | MEP c | TFEP d | ||
| 200 | PA-200 | 2.36 ± 0.05 | 3.91 ± 0.13 | 3.79 ± 0.14 | 2.14 ± 0.10 |
| 700 | PA-700 | 2.35 ± 0.12 | 3.79 ± 0.11 | 3.47 ± 0.15 | 1.99 ± 0.06 |
| 1200 | PA-1200 | 2.30 ± 0.13 | 2.81 ± 0.14 | 2.69 ± 0.10 | 1.58 ± 0.08 |
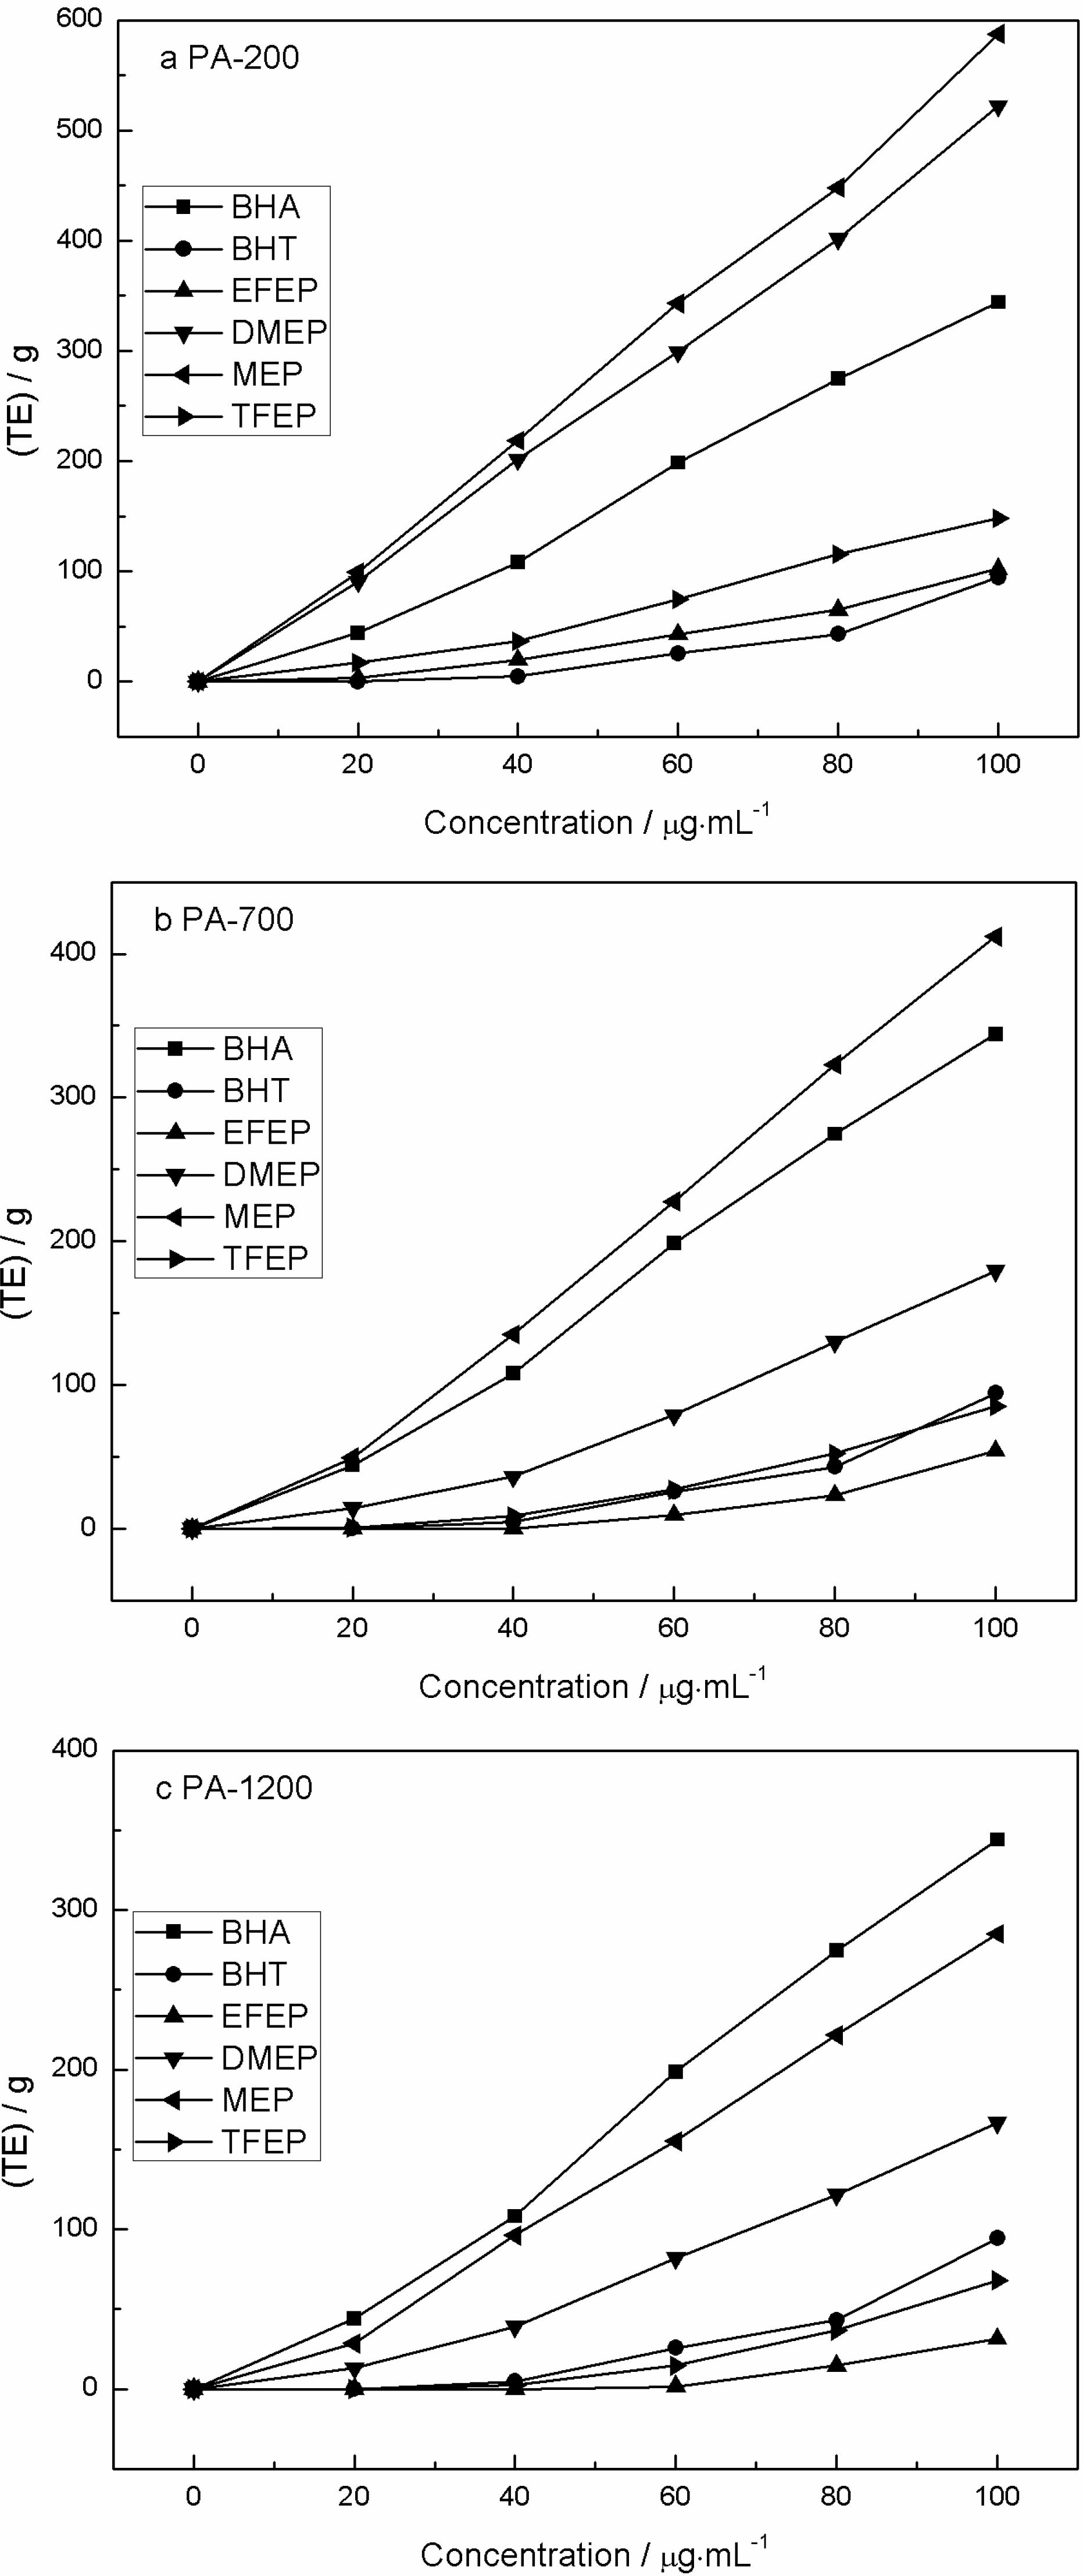
2.5. Ferric Reducing Power
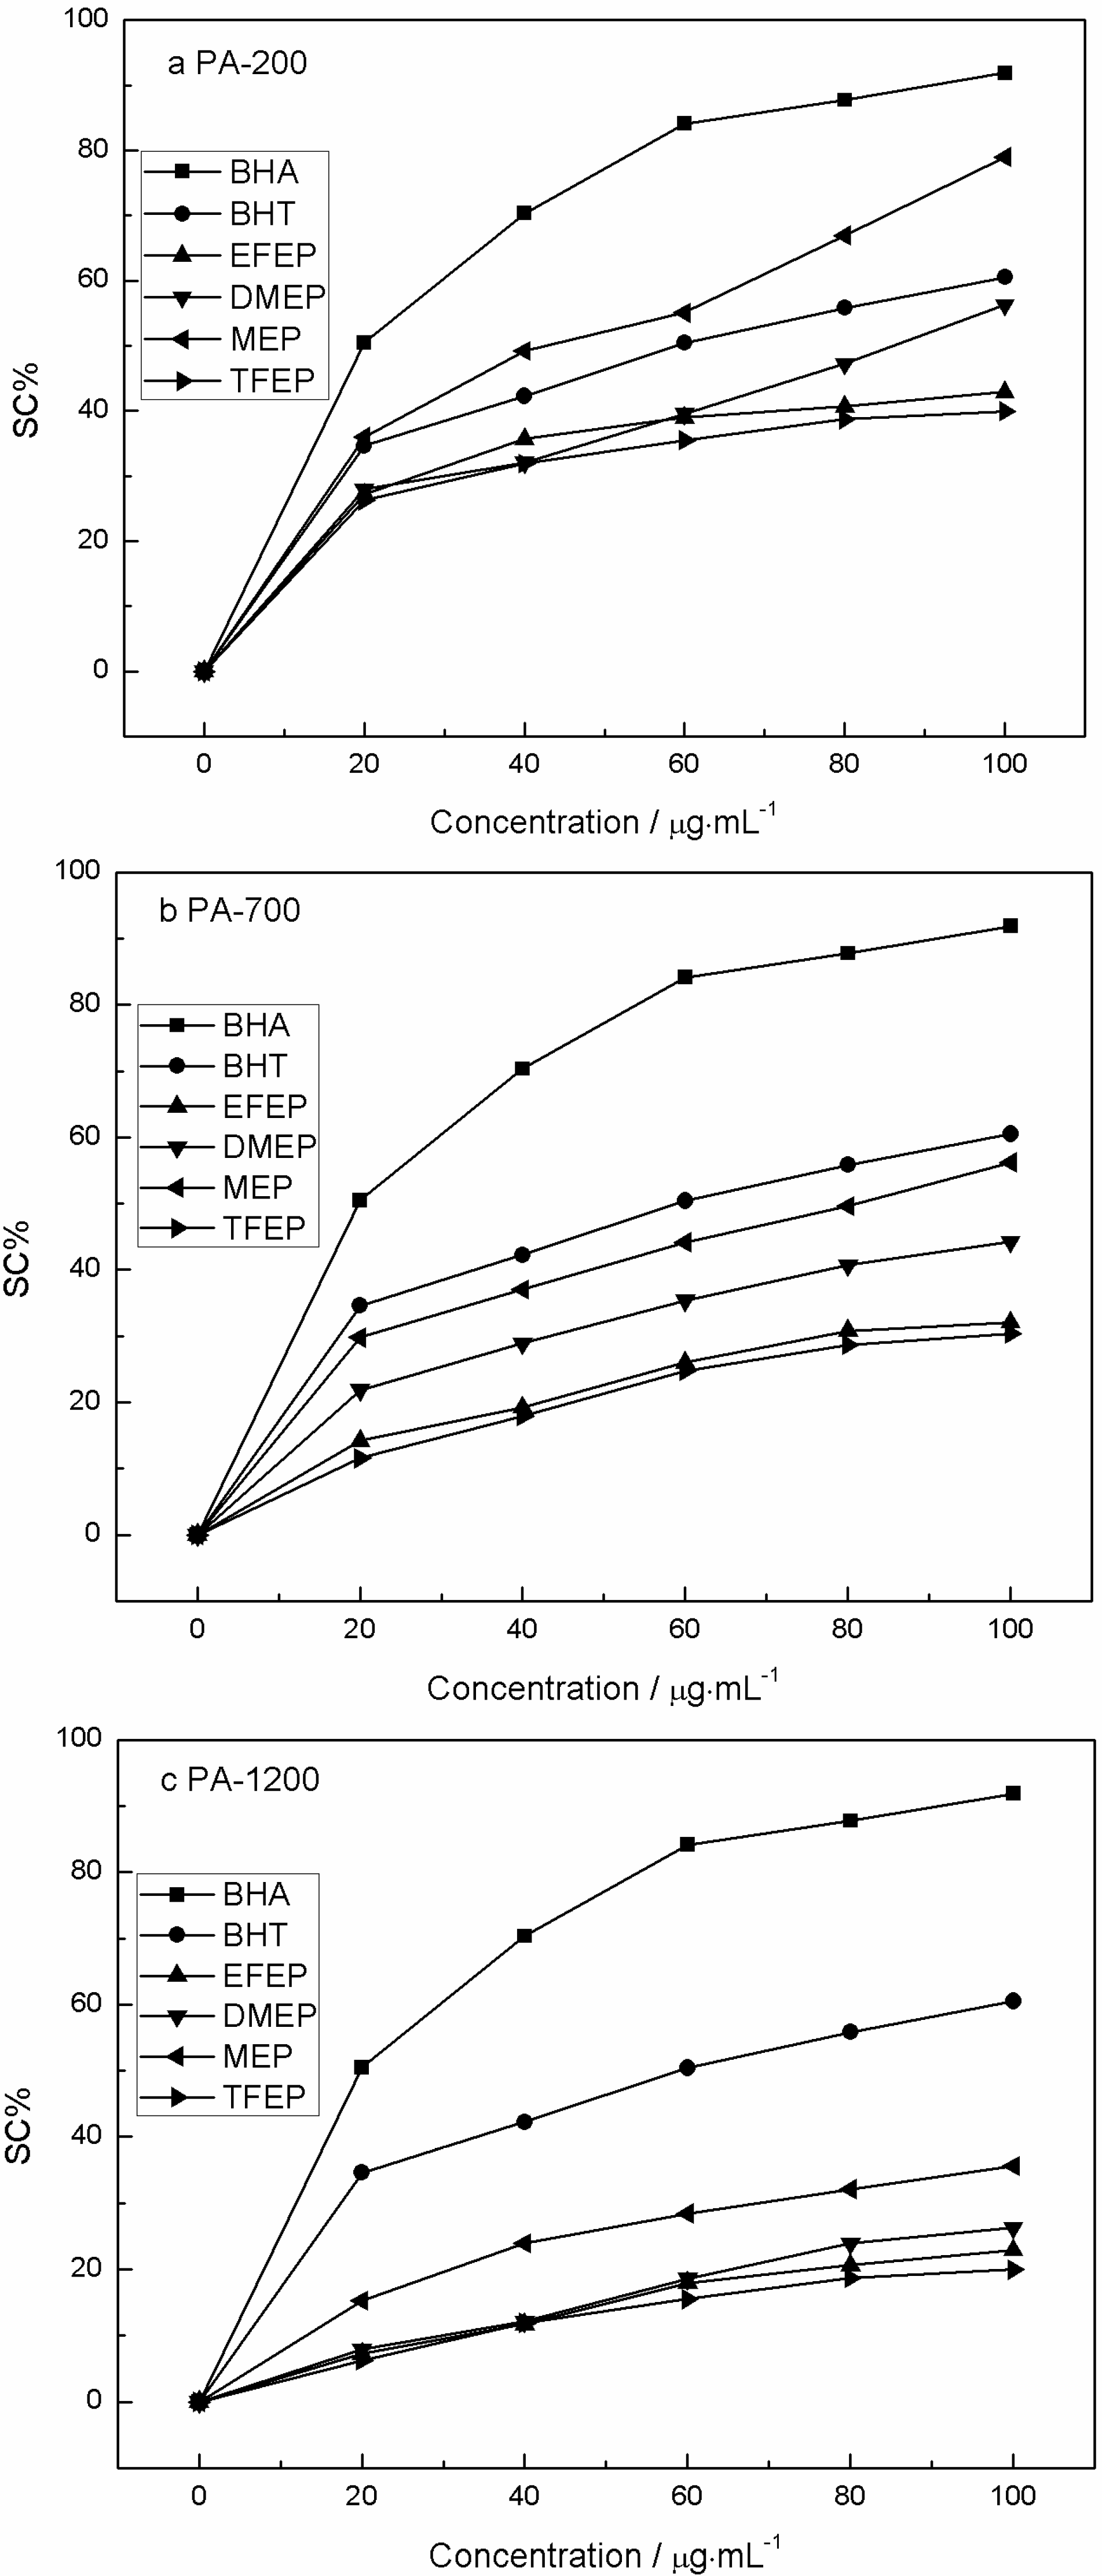
2.6. DPPH Free Radical Scavenging Activity
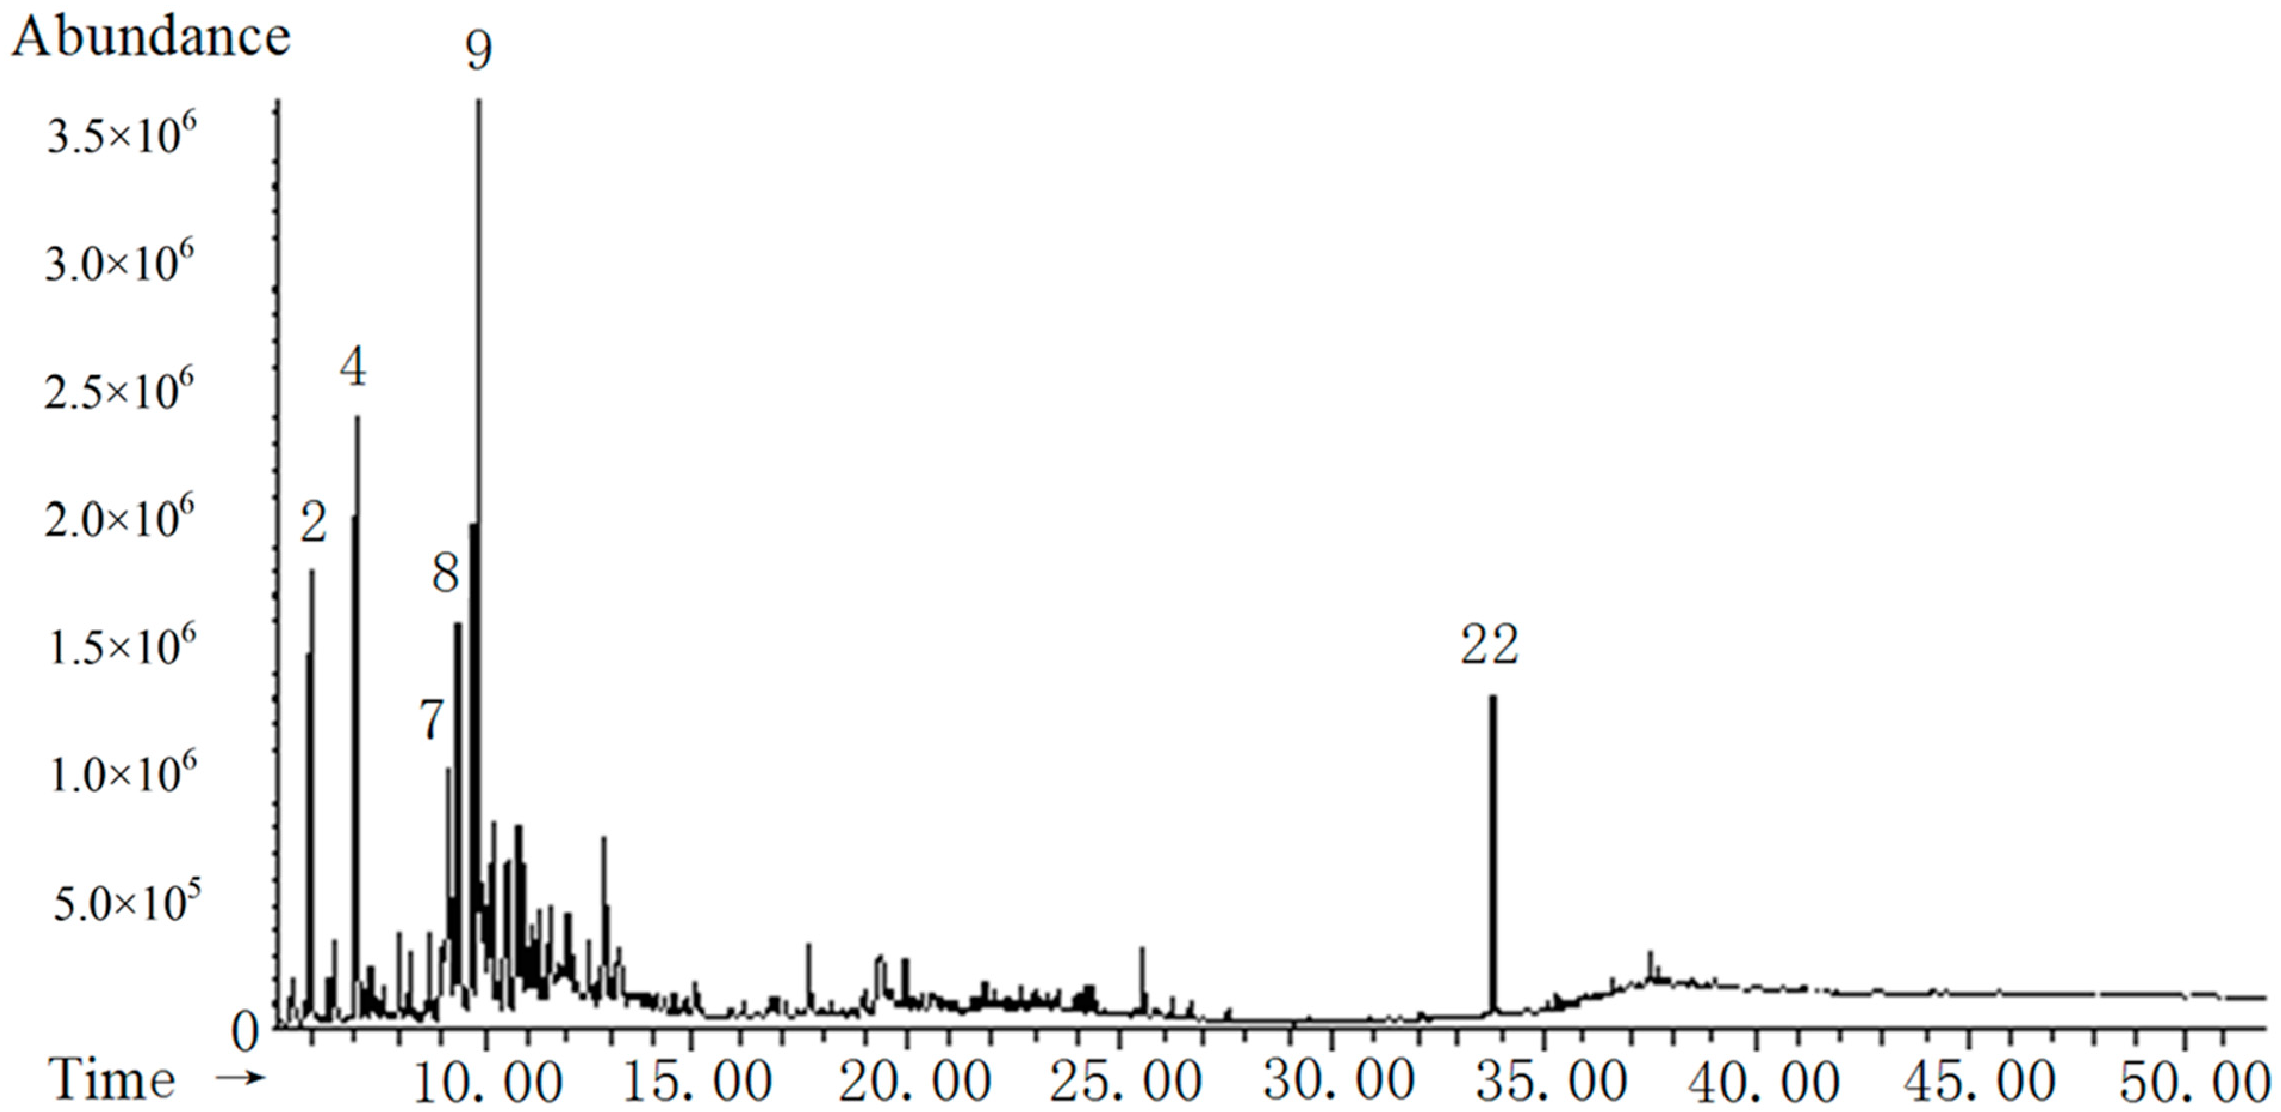
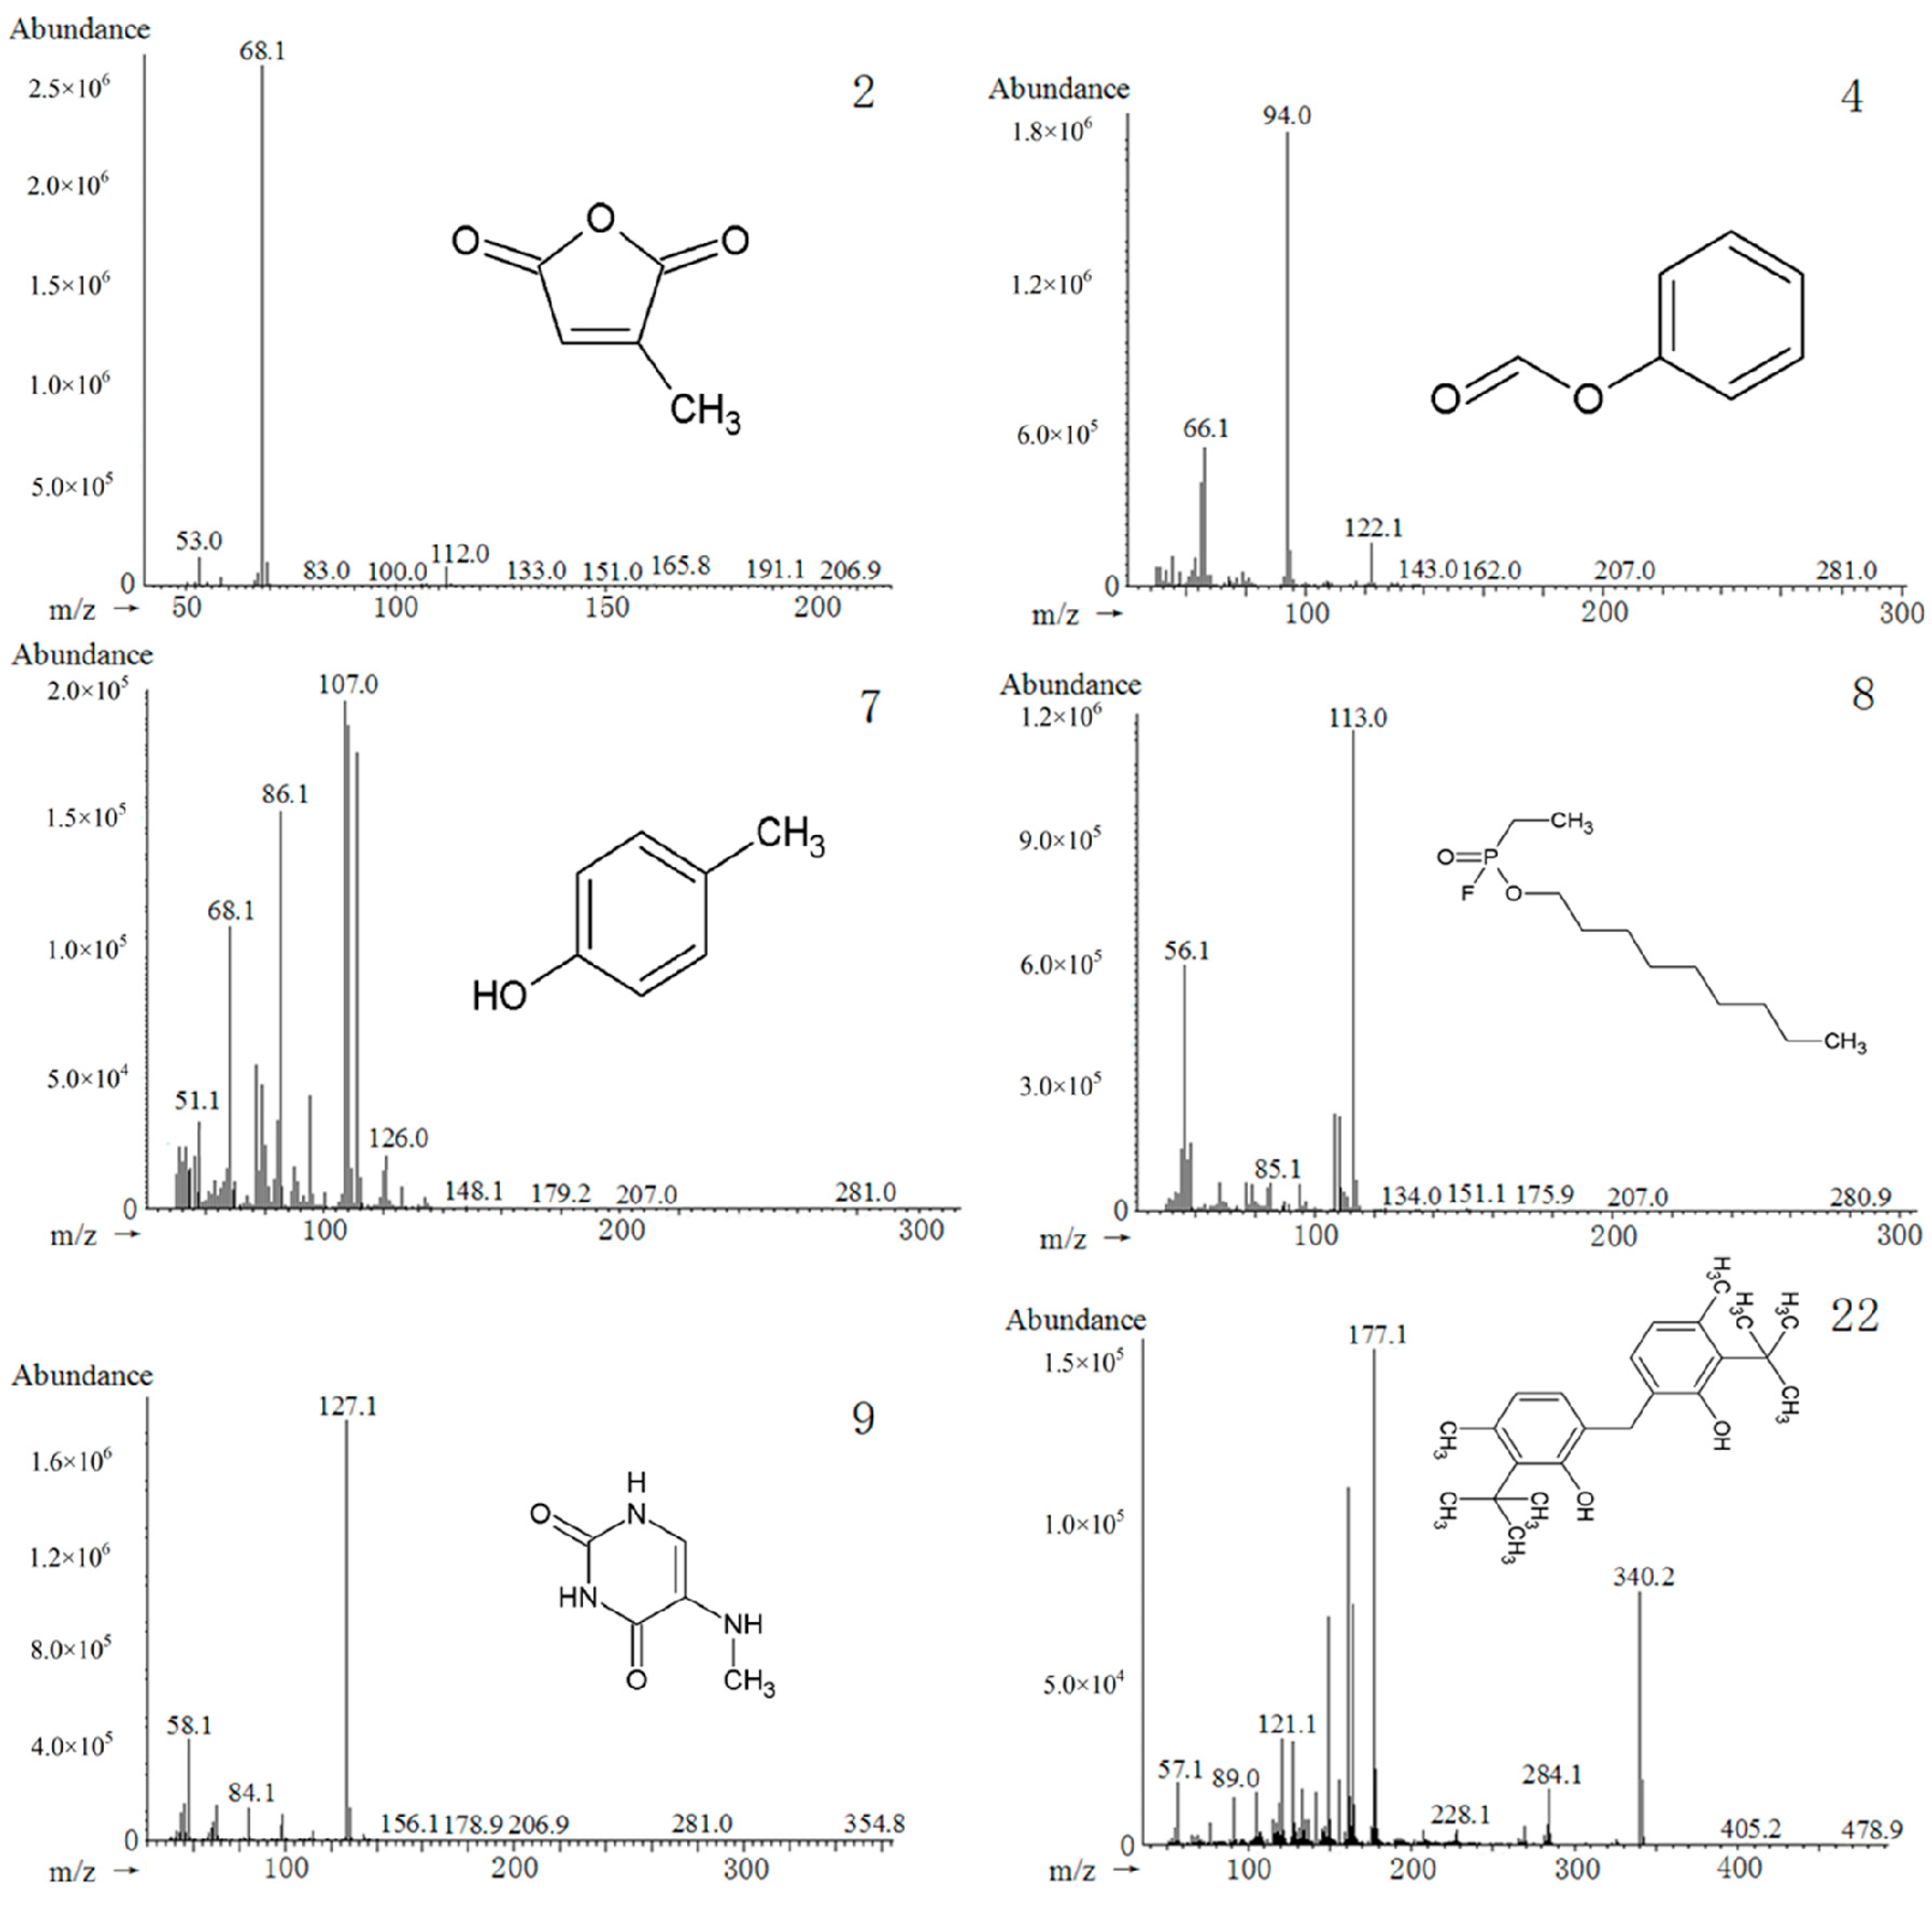
2.7. Chemical Composition of PA Extracts
| No. | Retention Time(min) | Compounds | CAS Number | Molecular Formula | RA% a | |||
|---|---|---|---|---|---|---|---|---|
| EFEP b | DMEP c | MEP d | TFEP e | |||||
| 1 | 5.498 | Pyridine, 3,4-dimethyl- | 000583-58-4 | C7H9N | —— | —— | —— | 9.07 |
| 2 | 6.106 | 2,5-Furandione, 3-methyl- | 000616-02-4 | C5H4O3 | 16.43 | 7.20 | 17.06 | 14.35 |
| 3 | 6.489 | 2-Cyclopenten-1-one, 3-methyl- | 002758-18-1 | C6H8O | 4.89 | 6.87 | —— | 2.82 |
| 4 | 7.078 | Formic acid phenyl ester | 001864-94-4 | C7H6O2 | 19.88 | 20.89 | 17.80 | 18.39 |
| 5 | 8.065 | 1,2-Cyclopentanedione, 3-methyl- | 000765-70-8 | C6H8O2 | 2.50 | —— | —— | —— |
| 6 | 8.686 | Ethylidenecyclobutane | 001528-21-8 | C6H10 | 1.70 | 3.15 | —— | 1.79 |
| 7 | 9.261 | p-Cresol | 000106-44-5 | C7H8O | 10.41 | 16.24 | 22.84 | 10.35 |
| 8 | 9.429 | Phosphonofluoridic acid, ethyl-, nonyl ester | 171741-07-4 | C11H24FO2P | 9.57 | 12.51 | 9.50 | 8.85 |
| 9 | 9.755 | 2,4(1H,3H)-Pyrimidinedione, 5-amino- | 000932-52-5 | C4H5N3O2 | 9.98 | 12.61 | 9.29 | 9.07 |
| 10 | 9.929 | 4-Piperidinone, 2,2,6,6-tetramethyl- | 000826-36-8 | C9H17NO | 2.41 | 3.74 | 1.87 | 2.29 |
| 11 | 9.996 | 1-Hexene, 2-methyl- | 006094-02-6 | C7H14 | 0.71 | —— | 2.38 | —— |
| 12 | 10.243 | 2,5-Pyrrolidinedione, 1-ethyl- | 002314-78-5 | C6H9NO2 | 1.21 | —— | 2.59 | —— |
| 13 | 10.294 | 4-Pyridinol | 000626-64-2 | C5H5NO | 1.66 | —— | 2.83 | —— |
| 14 | 10.510 | Succinimide | 000123-56-8 | C4H5NO2 | 2.03 | 7.71 | —— | 2.87 |
| 15 | 10.698 | Glutarimide | 001121-89-7 | C5H7NO2 | 3.60 | —— | 6.04 | 3.73 |
| 16 | 10.869 | 4,5,6-Pyrimidinetriamine | 000118-70-7 | C4H7N5 | 2.23 | 2.65 | —— | 3.68 |
| 17 | 10.926 | 3,3-Dimethylpyrrolidine-2,5-dione | 003437-29-4 | C6H9NO2 | 1.56 | —— | —— | 3.27 |
| 18 | 11.261 | Creosol | 000093-51-6 | C8H10O2 | 1.24 | —— | —— | 1.95 |
| 19 | 11.490 | 3-Pyridinol, 2,6-dimethyl- | 001122-43-6 | C7H9NO | —— | —— | —— | 0.54 |
| 20 | 11.655 | 1,4,3,6-Dianhydro-alpha-d-glucopyranose | 100009-81-8 | C6H8O4 | 5.01 | 3.51 | —— | 2.09 |
| 21 | 13.578 | Hydroquinone | 000123-31-9 | C6H6O2 | —— | —— | 5.75 | —— |
| 22 f | 33.801 | Phenol,2,2'-methylenebis[6-(1,1-dimethylethyl)-4-methyl- | 000119-47-1 | C23H32O2 | 2.98 | 2.92 | 2.05 | 4.89 |
3. Experimental Section
3.1. Material
3.1.1. Chemical Reagents
3.1.2. Raw Materials
3.2. Methods
3.2.1. Molding Method
3.2.2. Pyrolysis Method

3.2.3. Preparation Method of PA Extracts
3.2.4. Folin Ciocalteu Assay
3.2.5. Ferric Reducing Antioxidant Power (FRAP)
3.2.6. DPPH Free Radical Scavenging Activity
3.2.7. GC-MS Analysis
4. Conclusions
Acknowledgments
Author Contributions
Conflicts of Interest
References
- Minkova, V.; Marinov, S.P.; Zanzi, R.; Bjornbom, E.; Budinova, T.; Stefanova, M.; Lakov, L. Thermochemical treatment of biomass in a flow of steam or in a mixture of steam and carbon dioxide. Fuel Process. Technol. 2000, 62, 45–52. [Google Scholar]
- Schröder, E. Experiments on the pyrolysis of large beechwood particles in fixed beds. J. Anal. Appl. Pyrolysis 2004, 71, 669–694. [Google Scholar]
- Guerrero, M.; Ruiz, M.P.; Alzueta, M.U.; Bilbao, R.; Millera, A. Pyrolysis of eucalyptus at different heating rates: Studies of char characterization and oxidative reactivity. J. Anal. Appl. Pyrolysis 2005, 74, 307–314. [Google Scholar] [CrossRef]
- Guillén, M.D.; Manzanos, M.J. Study of the volatile composition of an aqueous oak smoke preparation. Food Chem. 2002, 79, 283–292. [Google Scholar] [CrossRef]
- Bubonja-Sonje, M.; Giacometti, J.; Abram, M. Antioxidant and antilisterial activity of olive oil, cocoa and rosemary extract polyphenols. Food Chem. 2011, 127, 1821–1827. [Google Scholar] [CrossRef]
- Mohan, D.; Pittman, C.U.; Steele, P.H. Pyrolysis of wood/biomass for bio-oil: A critical review. Energy Fuel 2006, 20, 848–889. [Google Scholar] [CrossRef]
- Nakai, T.; Kartel, S.N.; Hata, T.; Imamura, Y. Chemical characterization of pyrolysis liquids of wood-based composites and evaluation of their bioefficiency. Build. Environ. 2007, 42, 1236–1241. [Google Scholar] [CrossRef]
- Ratanapisit, J.; Apiraksakul, S.; Rerngnarong, A.; Chungsiriporn, J.; Bunyakarn, C. Preliminary evaluation of production and characterization of wood vinegar from rubber wood. Songklanakarin J. Sci. Technol. 2009, 31, 343–349. [Google Scholar]
- Chang, Y.; Zhao, S.; Ni, W.; Wo, N. Research of the antioxidative properties of bamboo vinegar. J. East China Univ. Sci. Technol. (Nat. Sci. Ed.) 2004, 30, 640–643. [Google Scholar]
- Loo, A.Y.; Jain, K.; Darah, I. Antioxidant and radical scavenging activities of the pyroligneous acid from a mangrove plant, Rhizophora apiculata. Food Chem. 2007, 107, 300–307. [Google Scholar] [CrossRef]
- Wei, Q.; Ma, X.; Zhao, Z.; Zhang, S.; Liu, S. Antioxidant activities and chemical profiles of pyroligneous acids from walnut shell. J. Anal. Appl. Pyrolysis 2010, 88, 149–154. [Google Scholar] [CrossRef]
- Cai, K.; He, Y. Antioxidant activities of the pyroligneous acid in living Caenorhabditis elegans. Adv. Mater. Res. 2011, 236–238, 2564–2569. [Google Scholar] [CrossRef]
- Amarowicz, R.; Estrella, I.; Hernández, T.; Robredo, S.; Troszyńska, A.; Kosińska, A.; Pegg, R.B. Free radical-scavenging capacity, antioxidant activity, and phenolic composition of green lentil (Lens culinaris). Food Chem. 2010, 121, 705–711. [Google Scholar] [CrossRef]
- Lu, Q.; Liu, W.; Yang, L.; Zu, Y.; Zu, B.; Zhu, M.; Zhang, Y.; Zhang, X.; Zhang, R.; Sun, Z.; et al. Investigation of the effects of different organosolv pulping methods on antioxidant capacity and extraction efficiency of lignin. Food Chem. 2012, 131, 313–317. [Google Scholar] [CrossRef]
- Yang, L.; Huang, J.; Zu, Y.; Ma, C.; Wang, H.; Sun, X.; Sun, Z. Preparation and radical scavenging activities of polymeric procyanidins nanoparticles by a supercritical antisolvent (SAS) process. Food Chem. 2011, 128, 1152–1159. [Google Scholar] [CrossRef]
- Wang, H.; Zu, G.; Yang, L.; Zu, Y.; Wang, H.; Zhang, Z.; Zhang, Y.; Zhang, L.; Wang, H. Effects of heat and ultraviolet radiation on the stability of pine nut oil supplemented with carnosic acid. J. Agric. Food Chem. 2011, 59, 13018–13025. [Google Scholar] [CrossRef] [PubMed]
- Ahmeda, A.; Hossain, M.A.; Ismail, Z. Antioxidant properties of the isolated flavonoids from the medicinal plant Phyllanthus niruri. Asian J. Food Agro-Ind. 2009, 2, 373–381. [Google Scholar]
- Valentao, P.; Fernandes, E.; Carvalho, F.; Andrade, P.B.; Seabra, R.M.; Bastos, M.L. Antioxidative properties of cardoon (Cynara cardunculus L.) infusion against superoxide radical hydroxyl radical, and hypochlorous acid. J. Agric. Food Chem. 2002, 50, 4989–4993. [Google Scholar] [CrossRef] [PubMed]
- Ma, C.; Song, K.; Yu, J.; Yang, L.; Zhao, C.; Wang, W.; Zu, G.; Zu, Y. Pyrolysis process and antioxidant activity of pyroligneous acid from Rosmarinus officinalis leaves. J. Anal. Appl. Pyrolysis 2013, 104, 38–47. [Google Scholar] [CrossRef]
- Pharmacopoeia of the People’s Republic of China; Peoples Medicinal Publishing House: Beijing, China, 2010; Volume I, pp. 61–62.
- Park, J.Y.; Shin, H.K.; Lee, Y.J.; Choi, Y.W.; Bae, S.S.; Kim, C.D. The mechanism of vasorelaxation induced by Schisandra chinensis extract in rat thoracic aorta. J. Ethnopharmacol. 2009, 121, 69–73. [Google Scholar] [CrossRef] [PubMed]
- Chang, G.T.; Kang, S.K.; Kim, J.H.; Chung, K.H.; Chang, Y.C.; Kim, C.H. Inhibitory effect of the Korean herbal medicine, Dae-Jo-Whan, on platelet-activating factor-induced platelet aggregation. J. Ethnopharmacol. 2005, 102, 430–439. [Google Scholar] [CrossRef] [PubMed]
- Chen, C.G. Basic Theory of Traditional Chinese Medicine; Shanghai of TCM Press: Shanghai, China, 2002. [Google Scholar]
- Deng, X.; Chen, X.; Yin, R.; Shen, Z.; Qiao, L.; Bi, K. Determination of deoxyschizandrin in rat plasma by LC-MS. J. Pharma. Biomed. Anal. 2008, 46, 121–126. [Google Scholar] [CrossRef]
- Fu, M.; Sun, Z.; Zong, M.; He, X.; Zuo, H.; Xie, Z. Deoxyschisandrin modulates synchronized Ca2+ oscillations and spontaneous synaptic transmission of cultured hippocampal neurons. Acta Pharmacol. 2008, 29, 891–898. [Google Scholar] [CrossRef]
- Guo, L.Y.; Hung, T.M.; Bae, K.H.; Shin, E.M.; Zhou, H.Y.; Hong, Y.N.; Kang, S.S.; Kim, H.P.; Kim, Y.S. Anti-inflammatory effects of schisandrin isolated from the fruit of Schisandra chinensis Baill. Eur. J. Pharmacol. 2008, 591, 293–299. [Google Scholar] [CrossRef] [PubMed]
- Peng, J.; Fan, G.; Qu, L.; Zhou, X.; Wu, Y. Application of preparative high-speed counter-current chromatography for isolation and separation of schizandrin and gomisin A from Schisandra chinensis. J. Chromatogr. A 2005, 1082, 203–207. [Google Scholar] [CrossRef] [PubMed]
- Zhao, J.; Meng, Z.; Li, G.; Wang, Y. Study on processing of coagulation Schizandra chinensis yogurt. Food Sci. Technol. 2009, 34, 49–51. [Google Scholar]
- Liang, X.; Wen, J. Progress on Schisandra chinensis (Turcz.) Baill. Health Food Drug 2009, 11, 70–73. [Google Scholar]
- Guan, X.; Huo, F.; Yu, W.; Hu, Y. The exploitation for the extractive of fructus schisandrae chinensis in natural sapid substance. China Food Addit. 2007, 18, 110–113. [Google Scholar]
- Sun, C.; Wang, S.; Ding, X.; Li, Z. Application and development prospects of the fruits of Schisandra chinensis in food industry. Food Mach. 2003, 19, 9–10. [Google Scholar]
- Ma, C.; Yang, L.; Zu, Y.; Liu, T. Optimization of conditions of solvent-free microwave extraction and study on antioxidant capacity of essential oil from Schisandra chinensis (Turcz.) Baill. Food Chem. 2012, 4, 2532–2539. [Google Scholar] [CrossRef]
- Chen, Y.; Tang, J.; Wang, X.; Sun, F.; Liang, S. An immunostimulatory polysaccharide (SCP-IIa) from the fruit of Schisandra chinensis (Turcz.) Baill. Int. J. Boil. Macromol. 2012, 50, 844–848. [Google Scholar] [CrossRef]
- Ma, C.; Yang, L.; Yang, F.; Wang, W.; Zhao, C.; Zu, Y. Content and colour stability of anthocyanins isolated from Schisandra chinensis (Turcz.) Baill fruits. Int. J. Mol. Sci. 2012, 13, 14294–14310. [Google Scholar] [CrossRef] [PubMed]
- Hancke, J.L.; Burgos, R.A.; Ahumada, F. Review Schisandra chinensis (Turcz.) Baill. Fitoterapia 1999, 70, 451–471. [Google Scholar] [CrossRef]
- Ma, C.H.; Liu, T.T.; Yang, L.; Zu, Y.G.; Yang, F.J.; Zhao, C.J.; Zhang, L.; Zhang, Z.H. Preparation of high purity biphenyl cyclooctene lignans from Schisandra extract by ion exchange resin catalytic transformation combined with macroporous resin separation. J. Chromatogr. B 2011, 879, 3444–3451. [Google Scholar] [CrossRef]
- Jerez, M.; Pinelo, M.; Sineiro, J.; Nuñez, M.J. Influence of extraction conditions on phenolic yields from pine bark: Assessment of procyanidins polymerization degree by thiolysis. Food Chem. 2004, 94, 406–414. [Google Scholar] [CrossRef]
- Siddhuraju, P. Antioxidant activity of polyphenolic compounds extracted from defatted raw and dry heated Tamarindus indica seed coat. LWT-Food Sci. Technol. 2007, 40, 982–990. [Google Scholar] [CrossRef]
- Soares, J.R.; Dins, T.C.P.; Cunha, A.P.; Ameida, L.M. Antioxidant activity of some extracts of Thymus zygis. Free Radic. Res. 1997, 26, 469–478. [Google Scholar] [CrossRef] [PubMed]
- Mansaray, K.G.; Ghaly, A.E. Physical and thermochemical properties of rice husk. Energy Sources 1997, 19, 989–1004. [Google Scholar] [CrossRef]
- Baker, R.R. Kinetic parameters from the nonisothermal decomposition of a multicomponent solid. Thermochim. Acta 1978, 23, 201–212. [Google Scholar] [CrossRef]
- Bradbury, A.G.W.; Sakai, Y.; Shafizadeh, F. A kinetic model for pyrolysis of cellulose. J. Appl. Polym. Sci. 1979, 23, 3271–3280. [Google Scholar] [CrossRef]
- Liu, X.; Jia, J.; Yang, L.; Yang, F.; Ge, H.; Zhao, C.; Zhang, L.; Zu, Y. Evaluation of antioxidant activities of aqueous extracts and fractionation from different parts of Elsholtzia ciliate. Molecules 2012, 17, 5430–5441. [Google Scholar] [CrossRef] [PubMed]
- Zu, S.; Yang, L.; Huang, J.; Ma, C.; Wang, W.; Zhao, C.; Zu, Y. Micronization of taxifolin by supercritical antisolvent process and evaluation of radical scavenging activity. Int. J. Mol. Sci. 2012, 13, 8869–8881. [Google Scholar] [CrossRef] [PubMed]
- Sample Availability: Samples of S. chinensis fruits are available from the authors.
© 2014 by the authors. Licensee MDPI, Basel, Switzerland. This article is an open access article distributed under the terms and conditions of the Creative Commons Attribution license ( http://creativecommons.org/licenses/by/4.0/).
Share and Cite
Ma, C.; Li, W.; Zu, Y.; Yang, L.; Li, J. Antioxidant Properties of Pyroligneous Acid Obtained by Thermochemical Conversion of Schisandra chinensis Baill. Molecules 2014, 19, 20821-20838. https://doi.org/10.3390/molecules191220821
Ma C, Li W, Zu Y, Yang L, Li J. Antioxidant Properties of Pyroligneous Acid Obtained by Thermochemical Conversion of Schisandra chinensis Baill. Molecules. 2014; 19(12):20821-20838. https://doi.org/10.3390/molecules191220821
Chicago/Turabian StyleMa, Chunhui, Wei Li, Yuangang Zu, Lei Yang, and Jian Li. 2014. "Antioxidant Properties of Pyroligneous Acid Obtained by Thermochemical Conversion of Schisandra chinensis Baill" Molecules 19, no. 12: 20821-20838. https://doi.org/10.3390/molecules191220821
APA StyleMa, C., Li, W., Zu, Y., Yang, L., & Li, J. (2014). Antioxidant Properties of Pyroligneous Acid Obtained by Thermochemical Conversion of Schisandra chinensis Baill. Molecules, 19(12), 20821-20838. https://doi.org/10.3390/molecules191220821