DNA Condensation by Partially Acetylated Poly(amido amine) Dendrimers: Effects of Dendrimer Charge Density on Complex Formation


Abstract
:1. Introduction
2. Results and Discussion
2.1. Dynamic Light Scattering
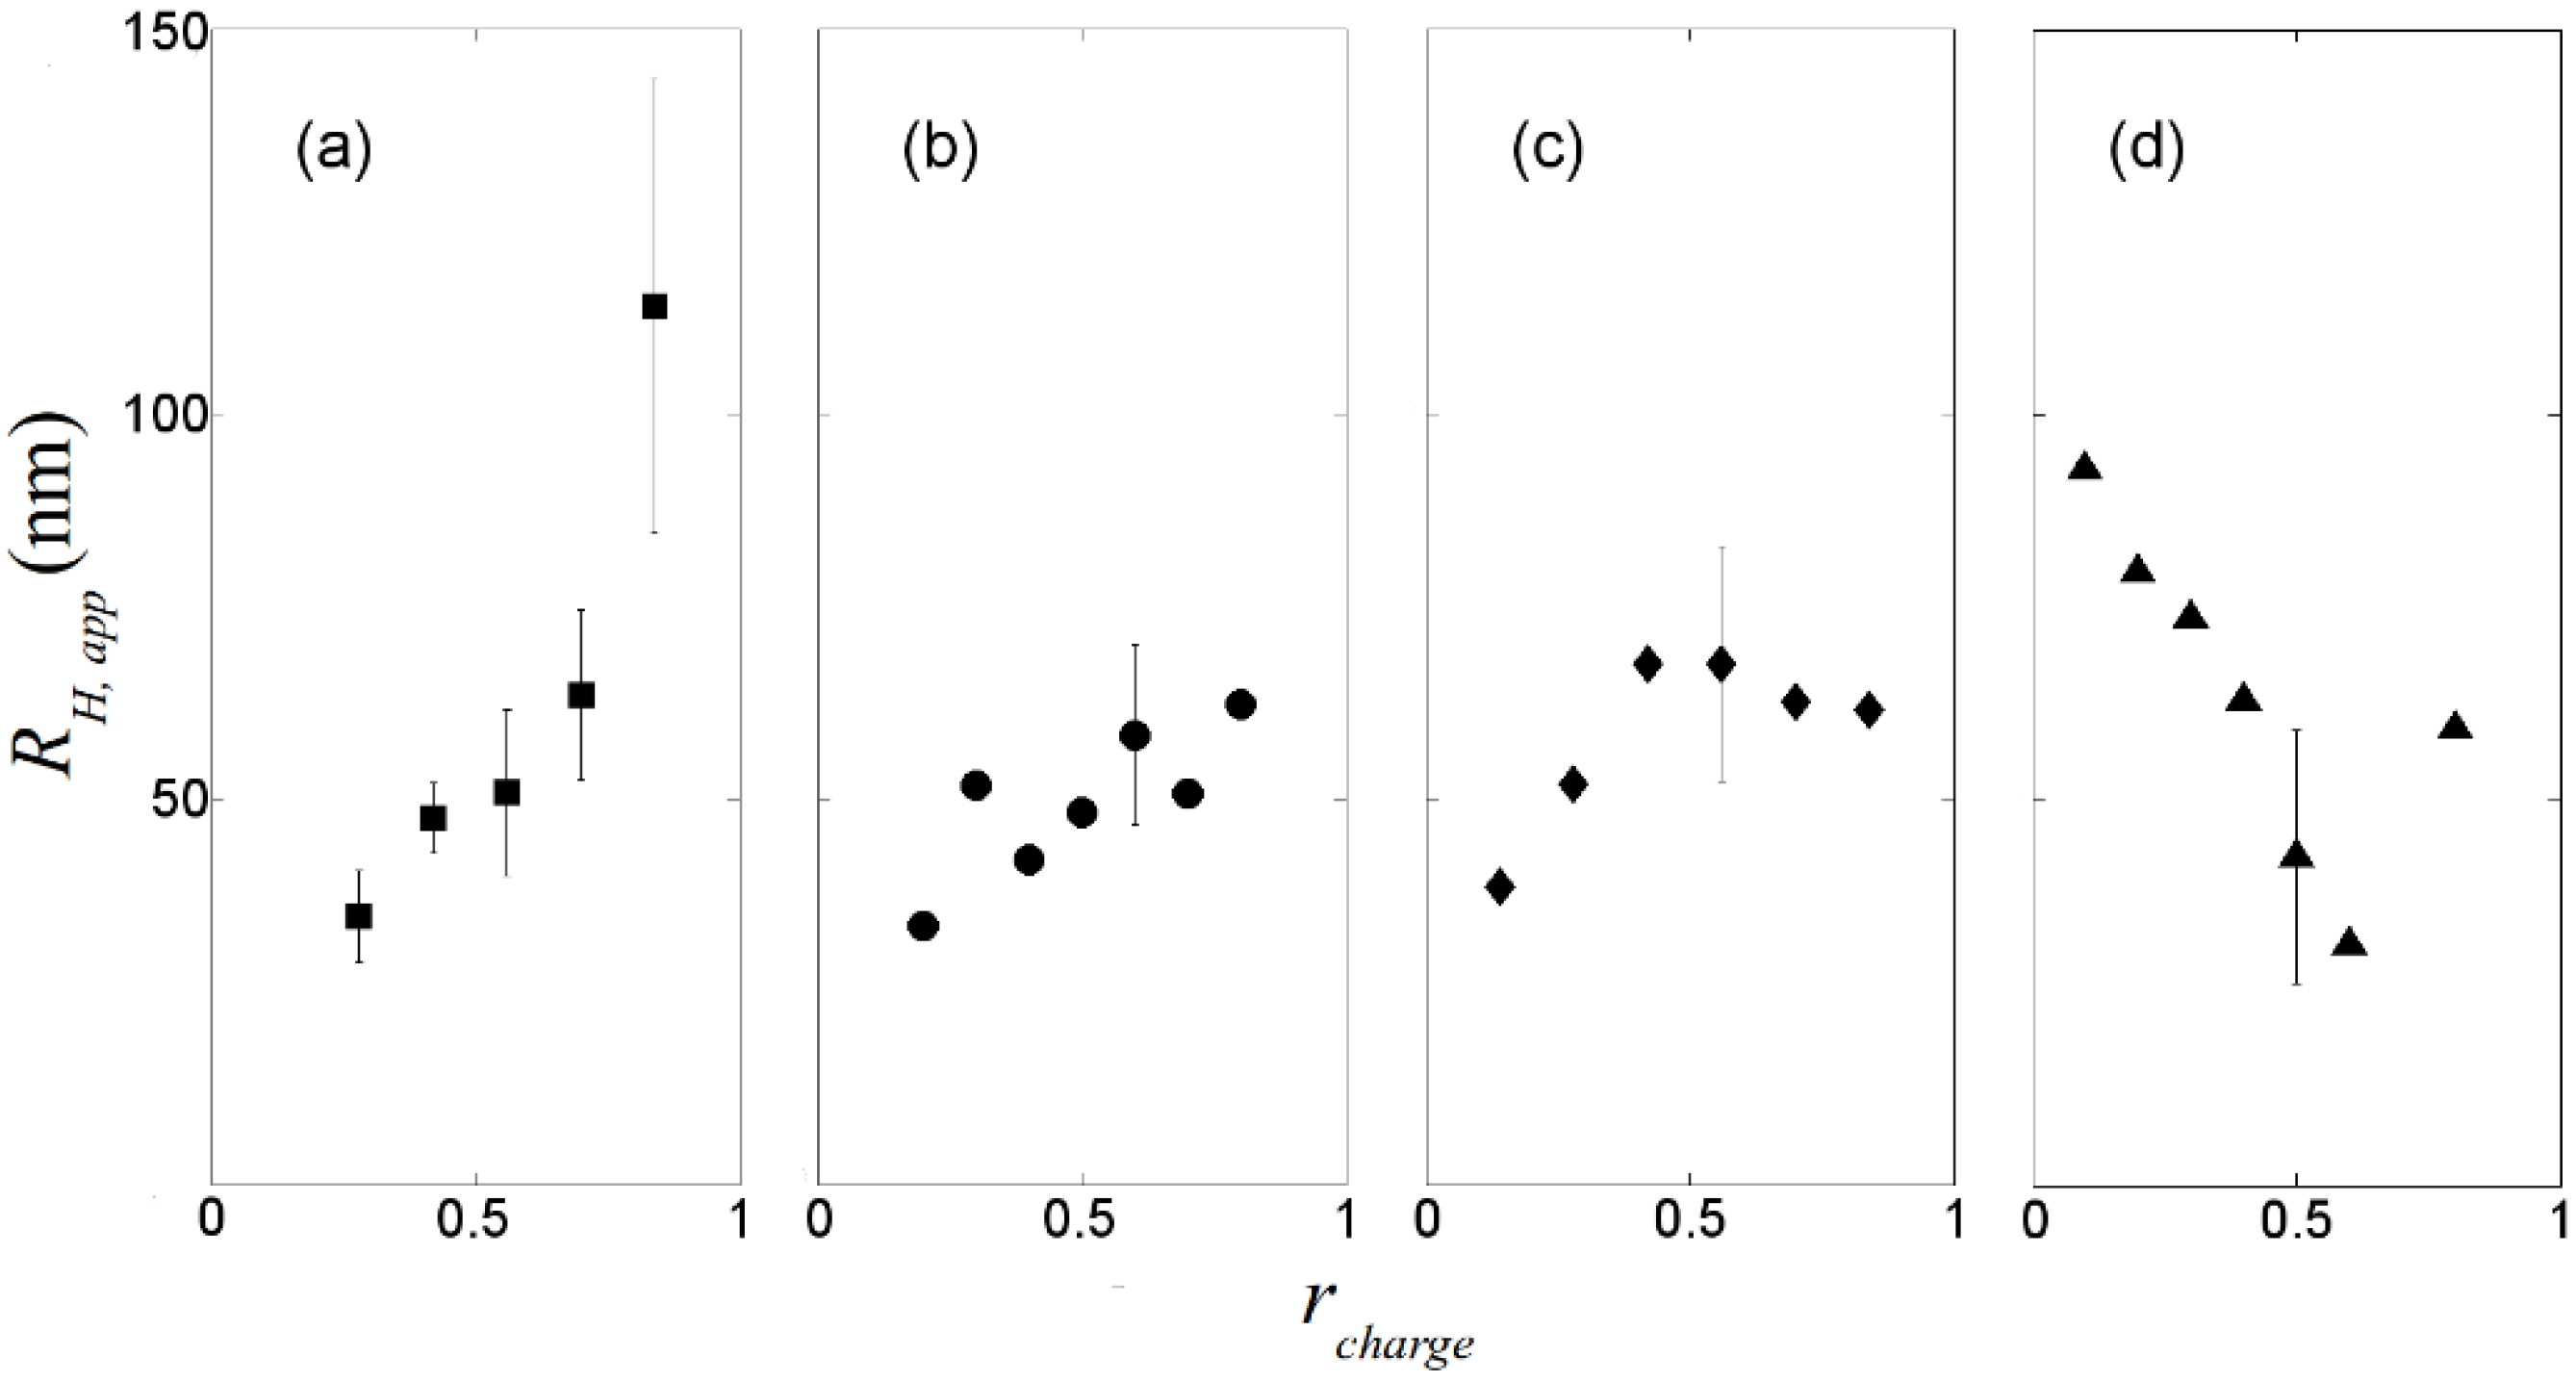
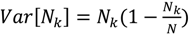 , where N is the maximum number of charges possible, which equals 128, and Nk is the measured mean value of 114. If the acetylation of dendrimer terminal groups is also taken to be random, the standard deviation of the number of charges on an individual acetylated dendrimer can also be approximated by the equation above. Thus, the numbers of positive charges, and their standard deviations computed by propagation of errors using both sources of variation mentioned above, on dendrimers acetylated to 0%, 15%, 30%, 50%, 65%, and 85%, are 114 ± 3.5, 97 ± 5.2, 80 ± 6.0, 57 ± 6.5, 40 ± 6.2, 17 ± 4.0, respectively. The relaxation time distributions of pure dsDNA as well as DNA-dendrimer complexes were obtained from autocorrelation functions of scattering light intensities using analysis with CONTIN 2DP. Selected relaxation time distributions of DNA-dendrimer complexes are shown in Figure 1 with scattering angle θ fixed at 50°. The apparent hydrodynamic radii of the DNA-dendrimer complexes were computed using the peaks of the relaxation time distributions along with the Einstein-Stokes equation, and plotted in Figure 2. Note that rcharge here and in the following discussion is defined as the ratio of the total number of positive charges on all dendrimers to the total number of negative charges on all DNA molecules in the solution, that is, rcharge = [NH3+]/[PO4−]. All the primary amine groups (pKa = 9.0 [18] ~10.77 [19]) were assumed to be protonated in pH 7~8 in this study. This assumption was supported by titration experiments and the observation that solutions become cloudy when rcharge defined above is close to unity. In this paper, we limit ourselves to the cases with rcharge less than 1 to study DNA-dendrimer complexes before phase separation takes place.
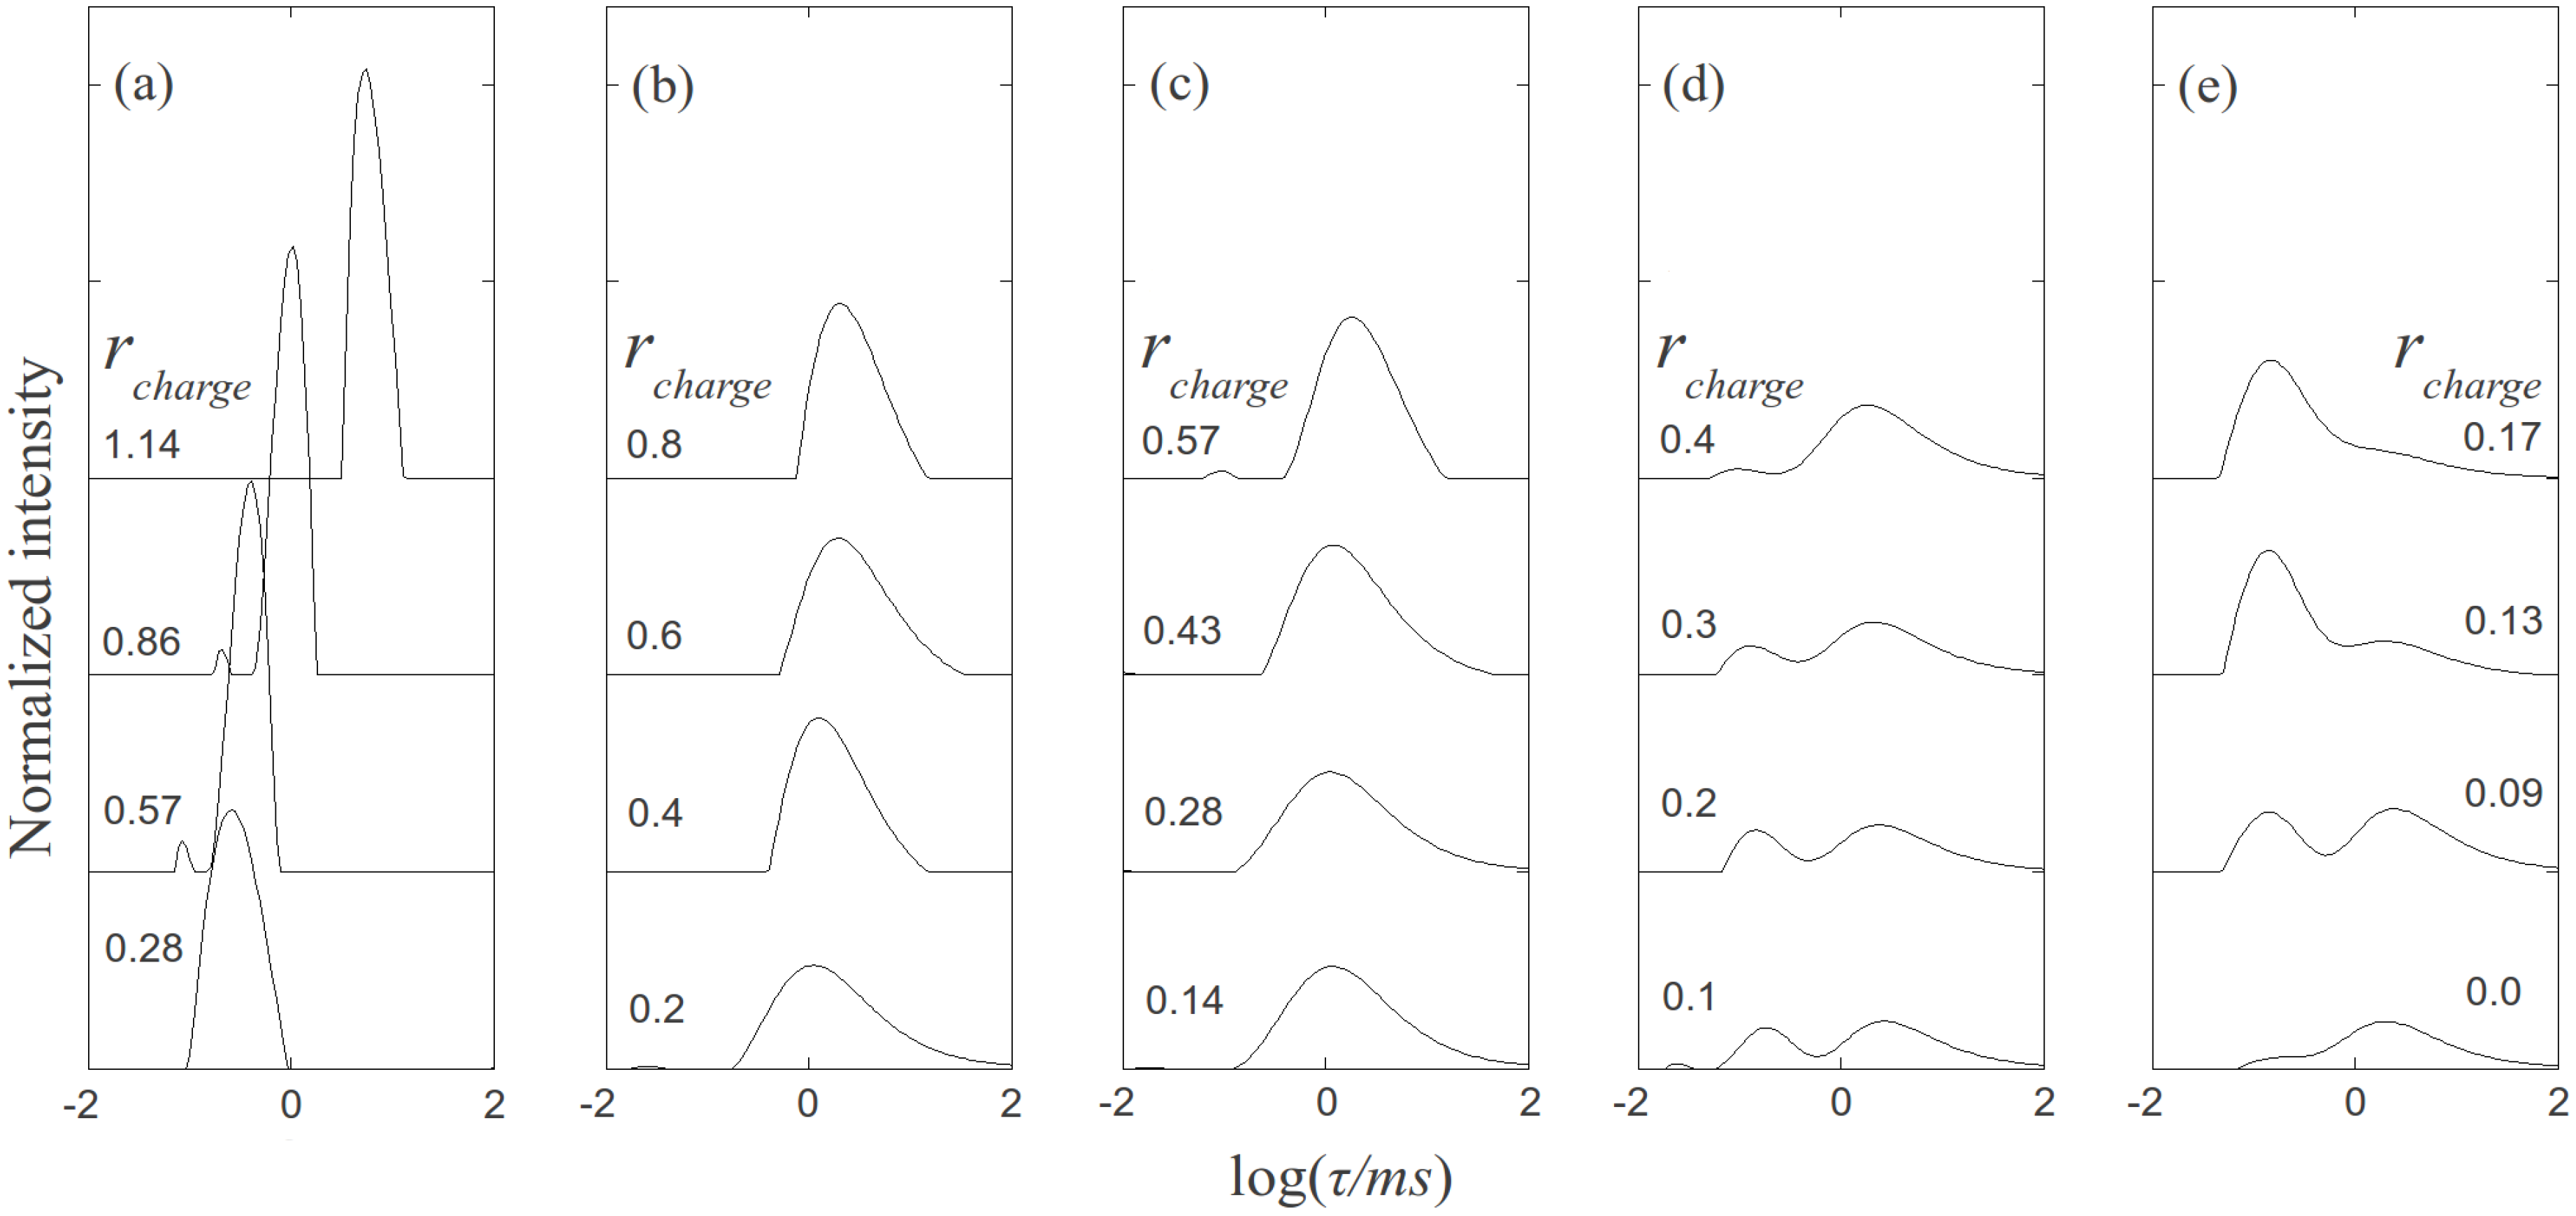
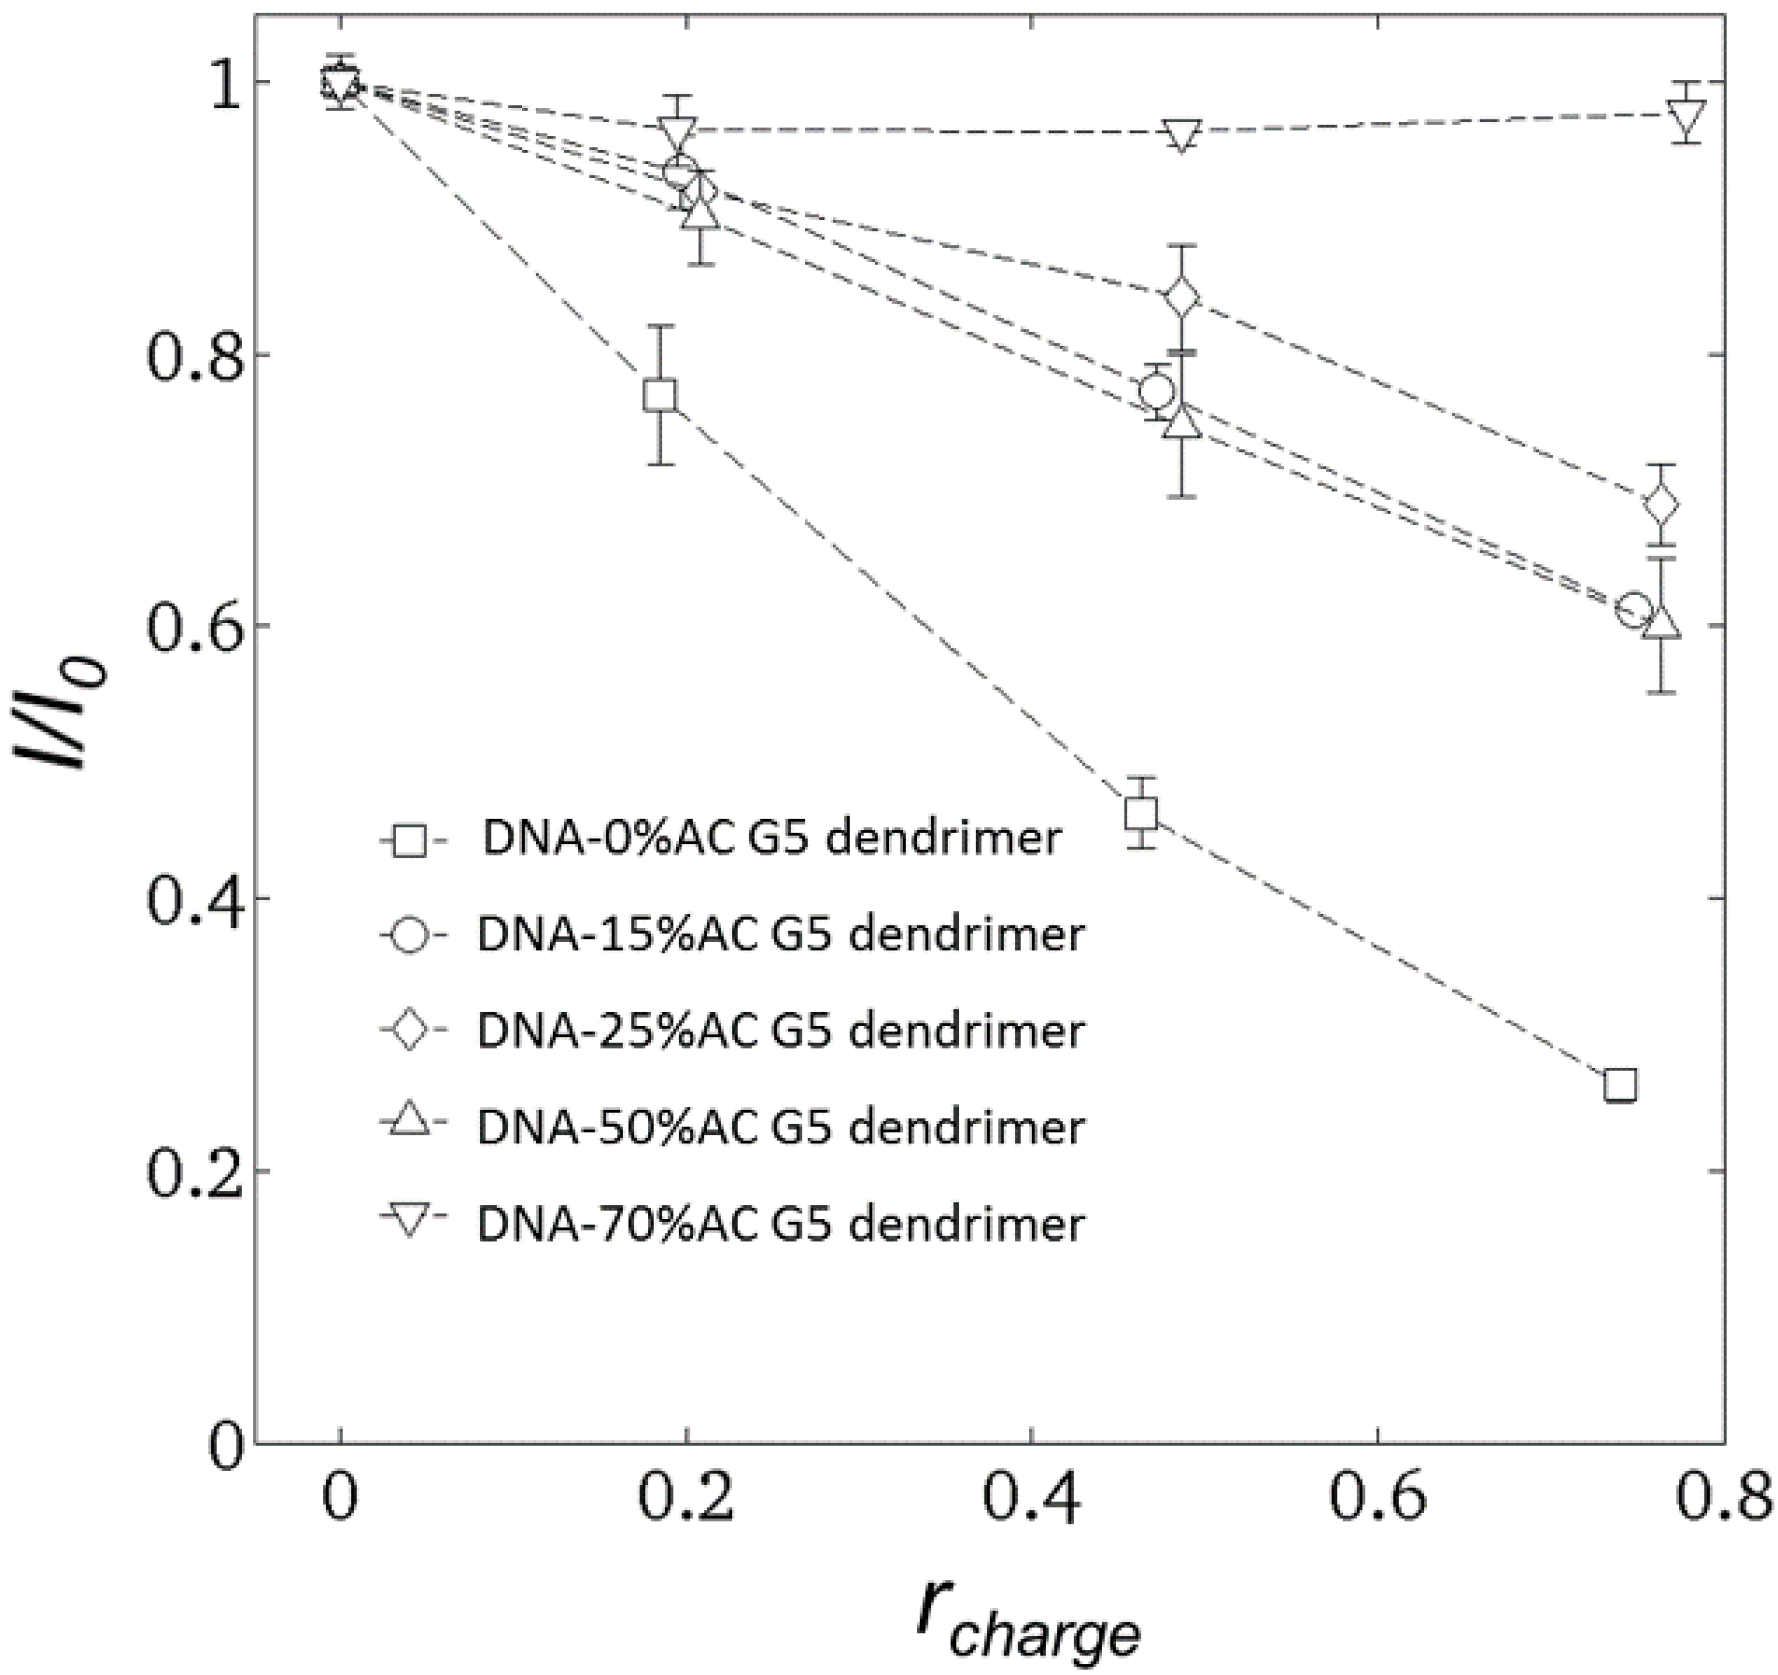
2.2. Steady-State Fluorescence Spectroscopy

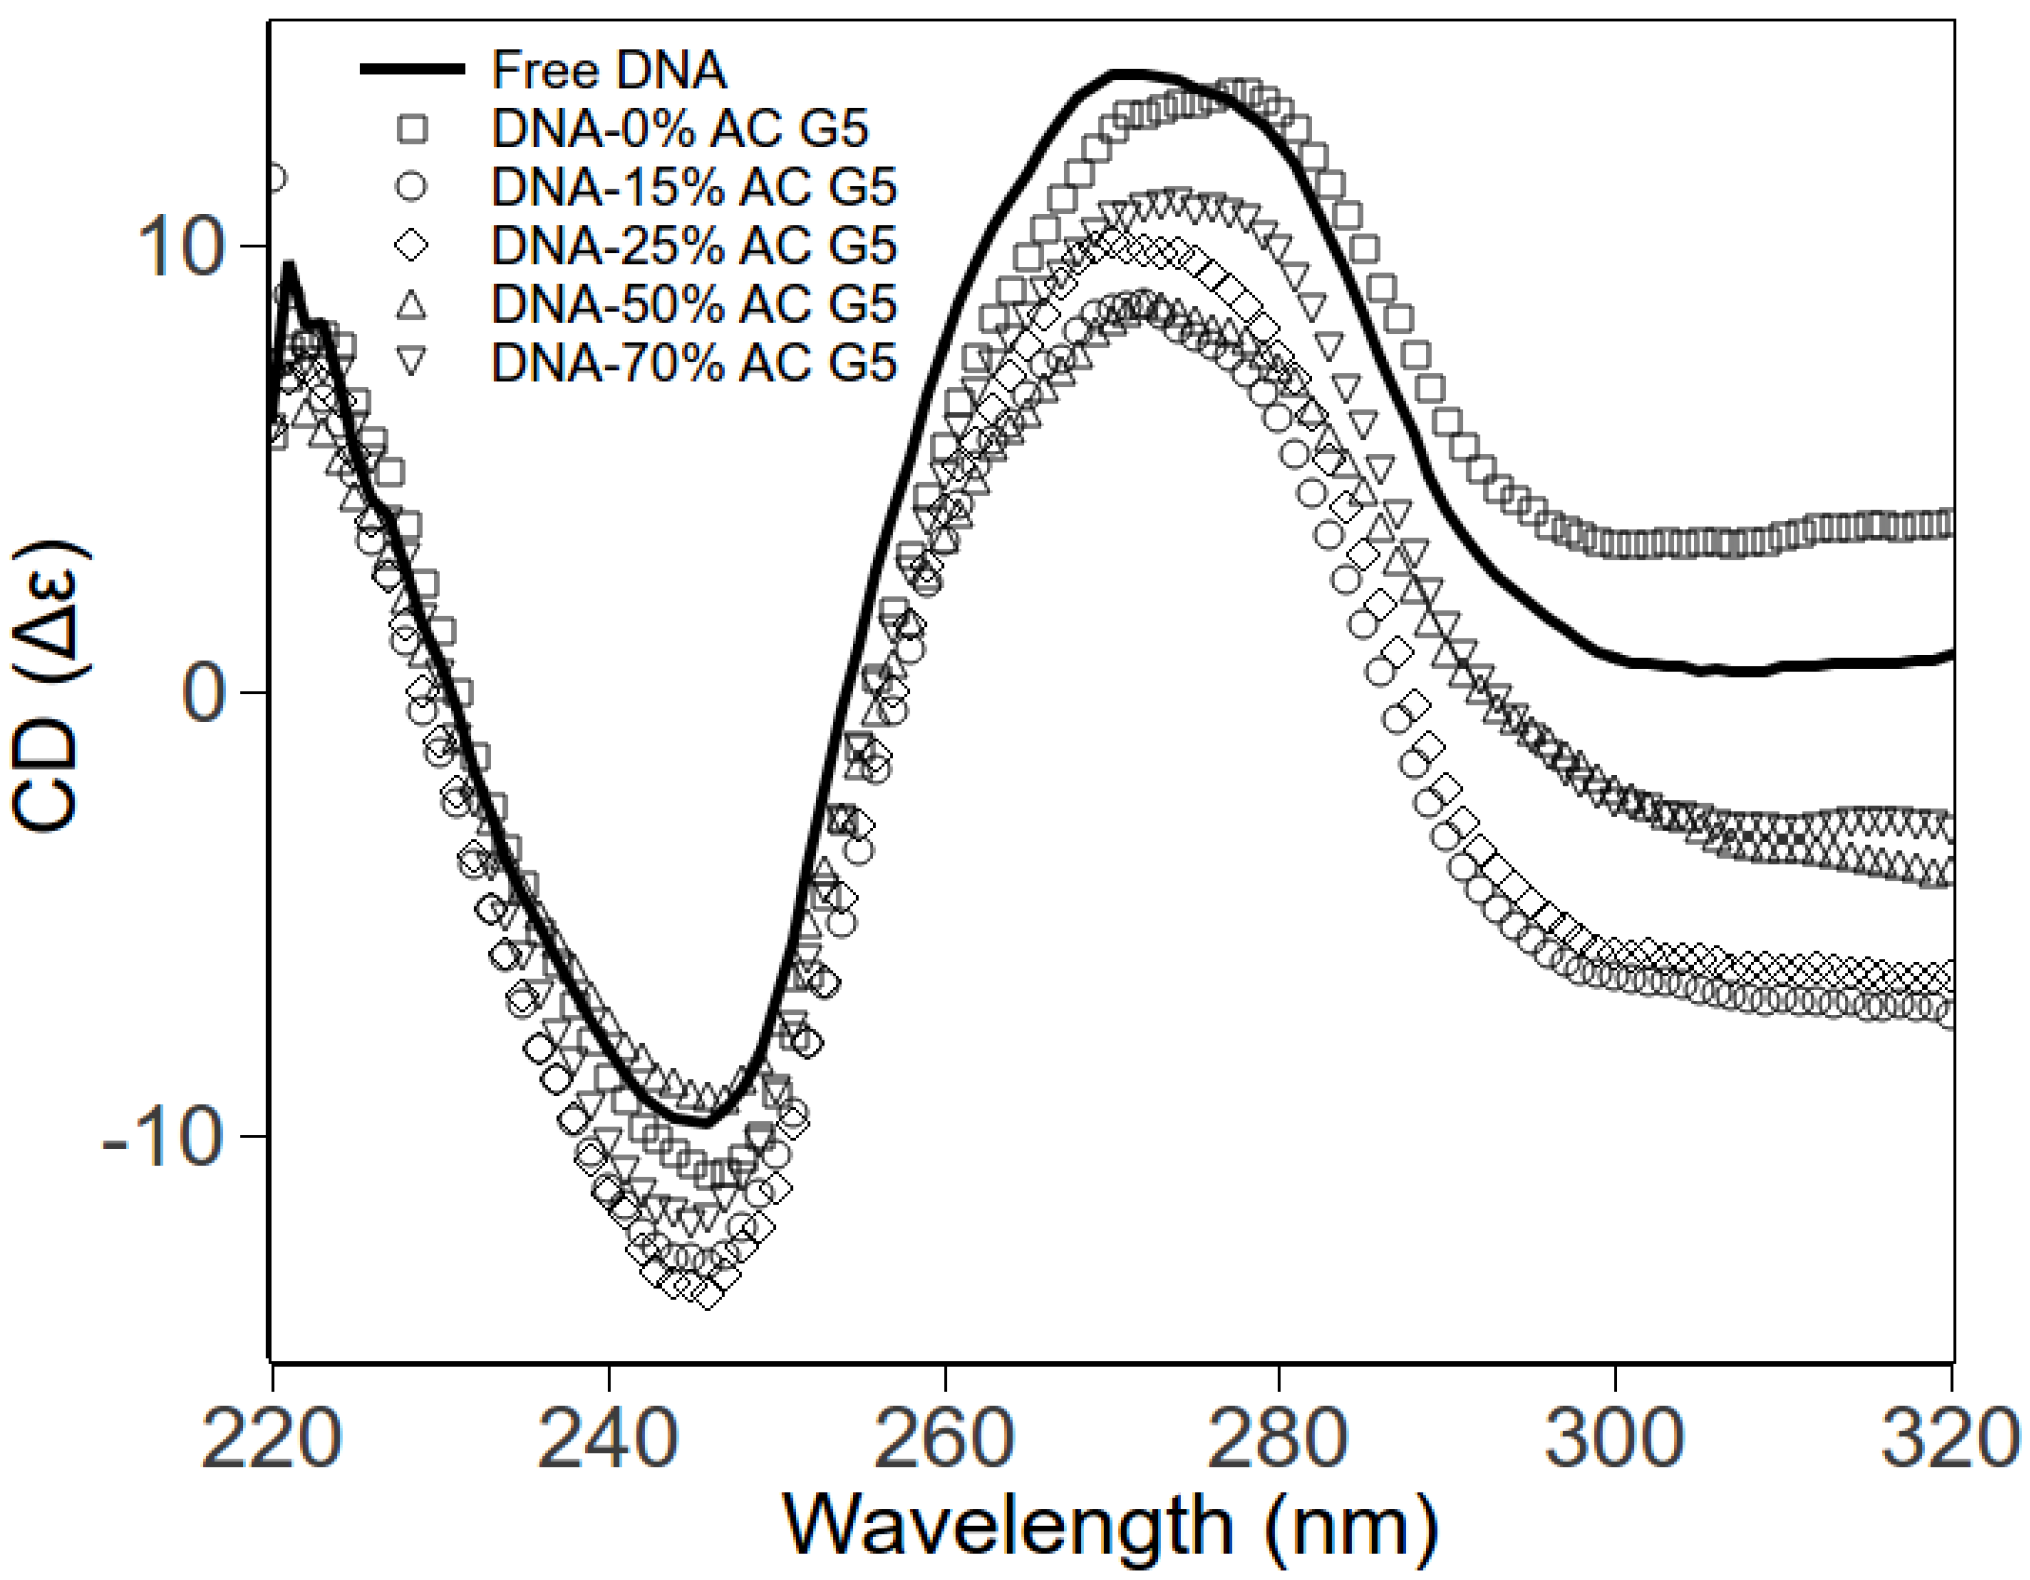
2.3. Circular Dichroism Spectroscopy
2.4. Molecular Combing Assay
2.5. Flow Stretching Assay
, where Nk is the number of data points of kth bin and N is the total number of data points. The lengths distributions are wide, which is mainly due to the photocleavage of λ-DNA, which shortens some of the DNA molecules before imaging is complete. However, these two histograms indicate that flow-stretched tethered DNA molecules are condensed by G5 dendrimer bound to the DNA chains, agreeing with optical tweezer experiments [11].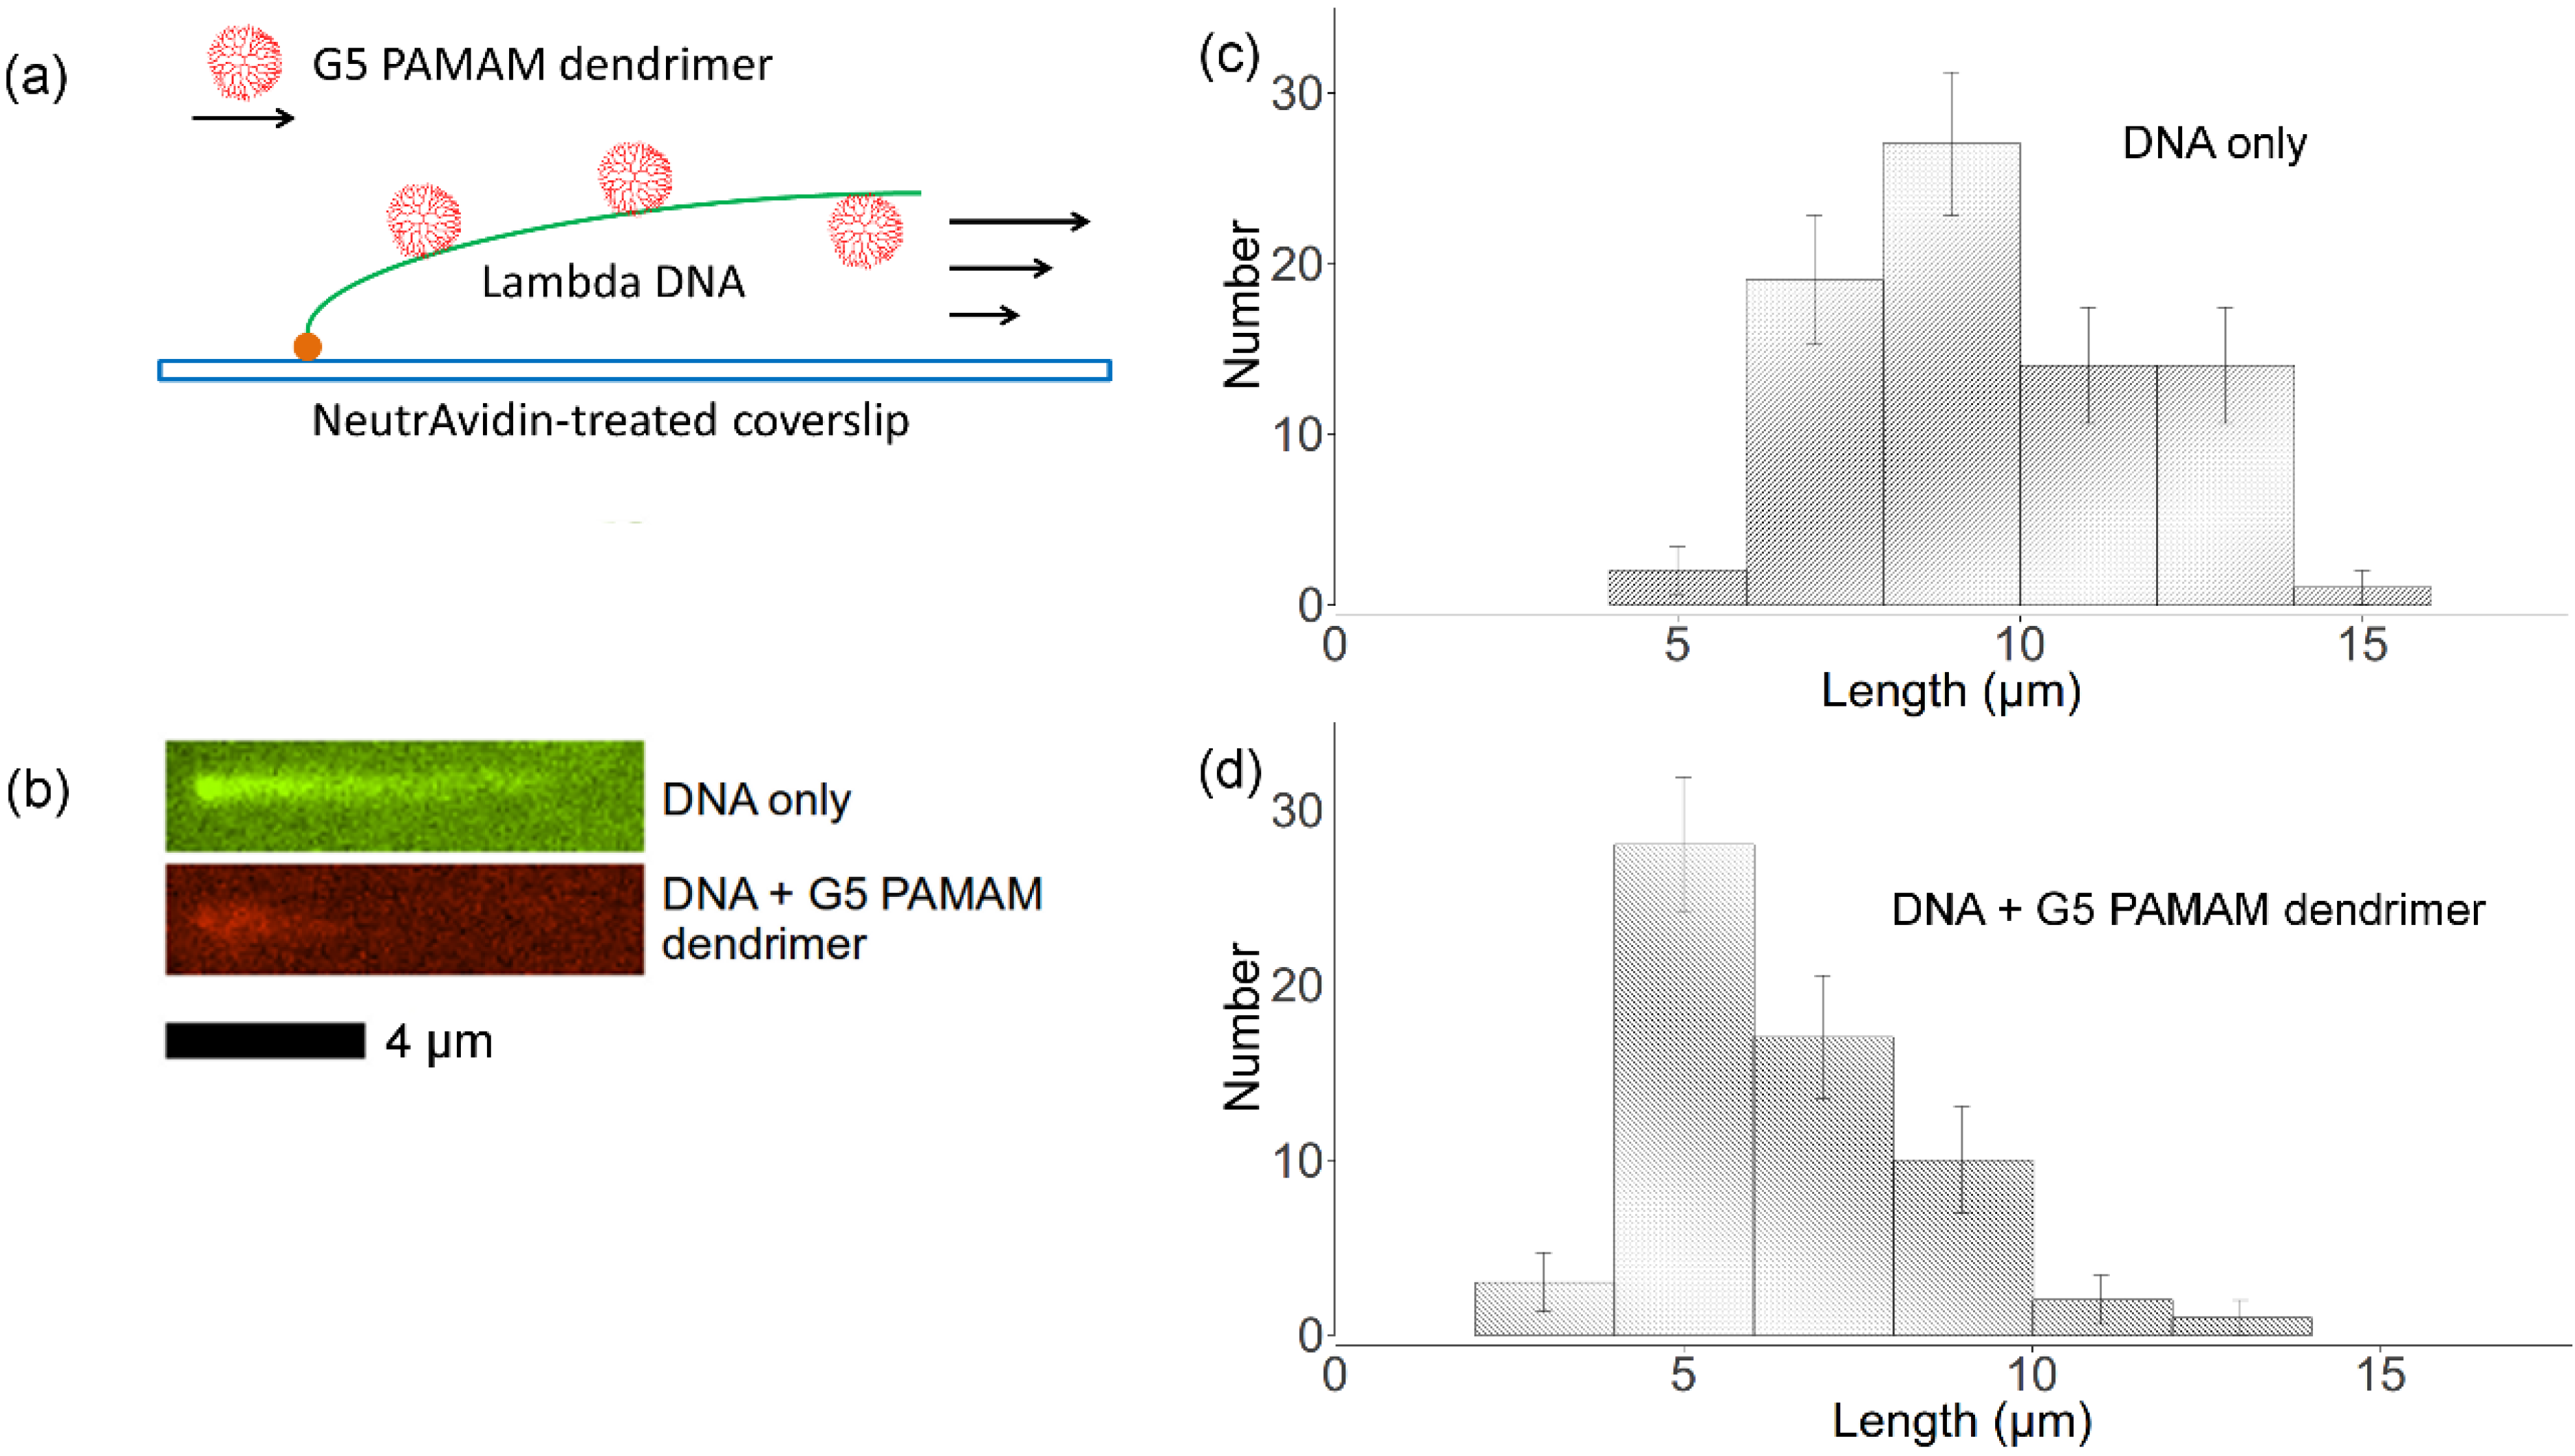
2.6. Cooperative Binding vs. Diffusion Limited Reaction
3. Experimental
3.1. DNA Preparation
3.2. PAMAM Dendrimer Preparation
3.3. Dynamic Light Scattering
3.4. Fluorescence Spectroscopy
3.5. Circular Dichroism Spectroscopy
3.6. Molecular Combing Assay
3.7. Flow Stretching Assay
3.8. Fluorescence Microscopy
4. Conclusions
Acknowledgments
Conflicts of Interest
References
- Orberg, M.-L.; Schillén, K.; Nylander, T. Dynamic light scattering and fluorescence study of the interaction between double-stranded DNA and poly(amido amine) dendrimers. Biomacromolecules 2007, 8, 1557–1563. [Google Scholar] [CrossRef]
- Froehlich, E.; Mandeville, J.S.; Weinert, C.M.; Kreplak, L.; Tajmir-Riahi, H.A. Bundling and aggregation of DNA by cationic dendrimers. Biomacromolecules 2011, 12, 511–517. [Google Scholar] [CrossRef]
- Akitaya, T.; Seno, A.; Nakai, T.; Hazemoto, N.; Murata, S.; Yoshikawa, K. Weak interaction induces an ON/OFF switch, whereas strong interaction causes gradual change: Folding transition of a long duplex DNA chain by poly-L-lysine. Biomacromolecules 2007, 8, 273–278. [Google Scholar] [CrossRef]
- Perevyazko, I.Y.; Bauer, M.; Pavlov, G.M.; Hoeppener, S.; Schubert, S.; Fischer, D.; Schubert, U.S. Polyelectrolyte complexes of DNA and linear PEI: Formation, composition and properties. Langmuir 2012, 28, 16167–16176. [Google Scholar] [CrossRef]
- Schille, K.; Nylander, T. DNA Compaction by cationic surfactant in solution and at polystyrene particle solution interfaces: a dynamic light scattering study. Phys. Chem. Chem. Phys. 2004, 1603–1607. [Google Scholar]
- Ainalem, M.-L.; Carnerup, A.M.; Janiak, J.; Alfredsson, V.; Nylander, T.; Schillén, K. Condensing DNA with poly(amido amine) dendrimers of different generations: Means of controlling aggregate morphology. Soft Matter 2009, 5, 2310–2320. [Google Scholar] [CrossRef]
- Ainalem, M.-L.; Nylander, T. DNA condensation using cationic dendrimers—Morphology and supramolecular structure of formed aggregates. Soft Matter 2011, 7, 4577–4594. [Google Scholar] [CrossRef]
- Dootz, R.; Toma, A.C.; Pfohl, T. PAMAM6 dendrimers and DNA: pH dependent “beads-on-a-string” behavior revealed by small angle X-ray scattering. Soft Matter 2011, 7, 8343–8351. [Google Scholar] [CrossRef]
- Wang, X.; He, Y.; Wu, J.; Gao, C.; Xu, Y. Synthesis and evaluation of phenylalanine-modified hyperbranched poly (amido amine) s as promising gene carriers. Biomacromolecules 2009, 11, 245–251. [Google Scholar] [CrossRef]
- Carnerup, A.M.; Ainalem, M.-L.; Alfredsson, V.; Nylander, T. Watching DNA condensation induced by poly(amido amine) dendrimers with time-resolved cryo-TEM. Langmuir 2009, 25, 12466–12470. [Google Scholar] [CrossRef]
- Ritort, F.; Mihardja, S.; Smith, S.; Bustamante, C. Condensation transition in DNA-polyaminoamide dendrimer fibers studied using optical tweezers. Phys. Rev. Lett. 2006, 96, 1–4. [Google Scholar]
- Fant, K.; Rner, E.E.; Jenkins, A. Effects of PEGylation and acetylation of PAMAM dendrimers on DNA binding, cytotoxicity and in vitro transfection efficiency. Mol. Pharm. 2010, 7, 1734–1746. [Google Scholar] [CrossRef]
- Boroudjerdi, H. Interactions between polyelectrolyte-macroion complexes. Europhys. Lett. 2003, 64, 413–419. [Google Scholar] [CrossRef]
- Qamhieh, K.; Nylander, T.; Ainalem, M.-L. Analytical model study of dendrimer/DNA complexes. Biomacromolecules 2009, 10, 1720–1726. [Google Scholar] [CrossRef]
- Railsback, J.G.; Singh, A.; Pearce, R.C.; McKnight, T.E.; Collazo, R.; Sitar, Z.; Yingling, Y.G.; Melechko, A.V. Weakly charged cationic nanoparticles induce DNA bending and strand separation. Adv. Materials 2012, 24, 4261–4265. [Google Scholar] [CrossRef]
- Fant, K.; Esbjörner, E.K.; Lincoln, P.; Nordén, B. DNA condensation by PAMAM dendrimers: Self-assembly characteristics and effect on transcription. Biochemistry 2008, 47, 1732–1740. [Google Scholar] [CrossRef]
- Choi, S.; Leroueil, P.; Li, M.; Desai, A. Specificity and negative cooperativity in dendrimer-oxime drug complexation. Macromolecules 2011, 4026–4029. [Google Scholar]
- Cakara, D.; Kleimann, J.; Borkovec, M. Microscopic Protonation equilibria of poly(amidoamine) dendrimers from macroscopic titrations. Macromolecules 2003, 36, 4201–4207. [Google Scholar] [CrossRef]
- Diallo, M.S.; Christie, S.; Swaminathan, P.; Balogh, L.; Shi, X.; Um, W.; Papelis, C.; Goddard, W.A; Johnson, J.H. Dendritic chelating agents. 1. Cu(II) binding to ethylene diamine core poly(amidoamine) dendrimers in aqueous solutions. Langmuir 2004, 20, 2640–2651. [Google Scholar]
- Vorlícková, M. Conformational transitions of alternating purine-pyrimidine DNAs in perchlorate ethanol solutions. Biophys. J. 1995, 69, 2033–2043. [Google Scholar] [CrossRef]
- Kypr, J.; Vorlícková, M. Circular dichroism spectroscopy reveals invariant conformation of guanine runs in DNA. Biopolymers 2002, 67, 275–277. [Google Scholar] [CrossRef]
- Bensimon, A.; Simon, A.; Chiffaudel, A.; Croquette, V. Alignment and sensitive detection of DNA by a moving interface. Science 1994, 265, 2096–2098. [Google Scholar]
- Kim, J.H.; Shi, W.-X.; Larson, R.G. Methods of stretching DNA molecules using flow fields. Langmuir 2007, 23, 755–64. [Google Scholar]
- Minoura, I.; Katayama, E.; Sekimoto, K.; Muto, E. One-dimensional Brownian motion of charged nanoparticles along microtubules: A model system for weak binding interactions. Biophys. J. 2010, 98, 1589–9157. [Google Scholar]
- Choi, S.K.; Thomas, T.P.; Leroueil, P.; Kotlyar, A.; Van Der Spek, A.F.L.; Baker, J.R. Specific and cooperative interactions between oximes and PAMAM dendrimers as demonstrated by 1H NMR study. J. Phys. Chem. B 2012, 116, 10387–10397. [Google Scholar]
- Majoros, I.; Keszler, B.; Woehler, S. Acetylation of poly (amidoamine) dendrimers. Macromolecules 2003, 5526–5529. [Google Scholar] [CrossRef]
- Sample Availability: Not available.
© 2013 by the authors; licensee MDPI, Basel, Switzerland. This article is an open access article distributed under the terms and conditions of the Creative Commons Attribution license (http://creativecommons.org/licenses/by/3.0/).
Share and Cite
Yu, S.; Li, M.-H.; Choi, S.K.; Baker, J.R., Jr.; Larson, R.G. DNA Condensation by Partially Acetylated Poly(amido amine) Dendrimers: Effects of Dendrimer Charge Density on Complex Formation. Molecules 2013, 18, 10707-10720. https://doi.org/10.3390/molecules180910707
Yu S, Li M-H, Choi SK, Baker JR Jr., Larson RG. DNA Condensation by Partially Acetylated Poly(amido amine) Dendrimers: Effects of Dendrimer Charge Density on Complex Formation. Molecules. 2013; 18(9):10707-10720. https://doi.org/10.3390/molecules180910707
Chicago/Turabian StyleYu, Shi, Ming-Hsin Li, Seok Ki Choi, James R. Baker, Jr., and Ronald G. Larson. 2013. "DNA Condensation by Partially Acetylated Poly(amido amine) Dendrimers: Effects of Dendrimer Charge Density on Complex Formation" Molecules 18, no. 9: 10707-10720. https://doi.org/10.3390/molecules180910707
APA StyleYu, S., Li, M.-H., Choi, S. K., Baker, J. R., Jr., & Larson, R. G. (2013). DNA Condensation by Partially Acetylated Poly(amido amine) Dendrimers: Effects of Dendrimer Charge Density on Complex Formation. Molecules, 18(9), 10707-10720. https://doi.org/10.3390/molecules180910707