Phenolic Constituents, Antioxidant and Preliminary Antimycoplasmic Activities of Leaf Skin and Flowers of Aloe vera (L.) Burm. f. (syn. A. barbadensis Mill.) from the Canary Islands (Spain)

Abstract
:
1. Introduction
2. Results and Discussion
2.1. Determination of the Phenolic Profile by HPLC

| Compounds | Regression equation (r) | LOD a μg·mL−1 | LOQ a μg·mL−1 | Recovery b (%) | RSD c (%) |
|---|---|---|---|---|---|
| Sinapic acid | y = 34493x − 25074 (0.9988) | 0.10661 | 0.3554 | 118 ± 3 | 2.57 |
| Quercitrin | y = 88302x − 20416 (0.9976) | 0.03640 | 0.1235 | 116 ± 4 | 3.69 |
| Kaempferol | y = 15436x − 28177 (0.9998) | 0.09775 | 0.3258 | 105 ± 8 | 7.61 |
| Apigenin | y = 20306x − 67494 (0.9993) | 0.03196 | 0.1065 | 99 ± 3 | 2.66 |
| Phenolic compound | Leaf skin a | Flowers a |
|---|---|---|
| Sinapic acid | 54 ± 3 | 15.0 ± 0.6 |
| Quercitrin | 23 ± 1 | 31.9 ± 0.5 |
| Kaempferol | 4.03 ± 0.03 | 2.86 ± 0.01 |
| Apigenin | 3.3 ± 0.4 | 3.03 ± 0.00 |
| Gallic acid | nd b | 12.6 ± 0.2 |
| Protocatechuic | 1.1 ± 0.0 | 0.57 ± 0.02 |
| Catechin | 95 ± 3 | 7.6 ± 0.2 |
| Vanillic acid | 2.30 ± 0.04 | 0.8 ± 0.1 |
| Epicatechin | 16.2 ± 0.7 | 58.0 ± 0.1 |
| Syringic acid | 4.9 ± 0.5 | 5.0 ± 0.3 |
| Chlorogenic acid | 7.8 ± 0.2 | 2.8 ± 0.2 |
| Gentisic acid | 6.0 ± 0.3 | 101 ± 2 |
| Caffeic acid | 4.9 ± 0.1 | 9.3 ± 0.1 |
| Coumaric acid | 0.8 ± 0.0 | 7.6 ± 0.4 |
| Ferulic acid | 7.9 ± 0.4 | 3.1 ± 0.1 |
| Rutin | 22.3 ± 2 | 11.6 ± 0.2 |
| Miricetin | 19.6 ± 0.7 | 1.76 ± 0.02 |
| Quercetin | 34.4 ± 2 | nd b |
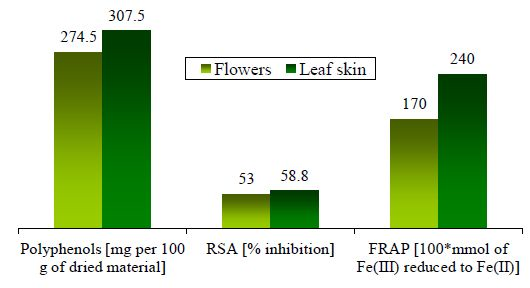
| Sum | 307.5 | 274.5 |
2.2. Radical Scavenging Activity (RSA) on DPPH and Ferric Reducing Antioxidant Power (FRAP)
| Extract | RSA a,b | FRAP a,c | Antimycoplasmal activity a,d | |||
|---|---|---|---|---|---|---|
| M. mycoides capri | M. agalactiae | Acholeplasma laidlawii | M. gallisepticum | |||
| Leaf skin | 58.8 ± 0.4 | 2.4 ± 0.1 | 239 ± 51 b | CCM | 2253 ± 123 | 1466 ± 213 |
| Flowers | 53 ± 2 | 1.7 ± 0.0 | - | - | - | - |
2.3. Antimycoplasmic Activity
3. Experimental
3.1. Chemicals
3.2. Mycoplasmas
3.3. Plant Material
3.4. Preparation of Aloe Extracts
3.5. Free Radical Scavenging Activity on DPPH
3.6. Ferric Reducing Antioxidant Power Assay (FRAP Assay)
3.7. Determination of the Phenolic Profile by RP-HPLC
3.8. Evaluation of the Antimycoplasmic Activity
4. Conclusions
Acknowledgments
Conflicts of Interest
References
- Surjushe, A.; Vasani, R.; Saple, D.G. Aloe vera: A short review. Indian J. Dermatol. 2008, 53, 163–166. [Google Scholar] [CrossRef]
- Wani, M.Y.; Hasan, N.; Malik, M.A. Chitosan and Aloe vera: Two gifts of nature. J. Disper. Sci. Technol. 2010, 31, 799–811. [Google Scholar] [CrossRef]
- Ah, Y.E.; Dae, K.S.; Min, L.W.; Jin, P.H.; Keun, K.S.; Youl, C.J.; Wongi, M.; Hee, R.M. Evaluation of antioxidant, antinociceptive, and anti-inflamatory activities of ethanol extracts from Aloe saponaria. Phytother. Res. 2008, 22, 1389–1395. [Google Scholar] [CrossRef]
- Yu, Z.H.; Jin, C.; Xin, M.; Jian-Min, H. Effect of Aloe vera polysaccharides on immunity and antioxidant activities in oral ulcer animal models. Carbohyd. Polym. 2009, 75, 307–311. [Google Scholar] [CrossRef]
- Lin, M.L.; Lu, Y.C.; Chung, J.G.; Li, Y.C.; Wang, S.G.; NG, S.H.; Wu, C.Y.; Su, H.L.; Chen, S.S. Aloe-emodin induces apoptosis of human nasopharyngeal carcinoma cells via caspase-8-mediated activation of the mitochondrial death pathway. Cancer Lett. 2010, 291, 46–58. [Google Scholar] [CrossRef]
- Subramanian, S.; Kumar, D.S.; Arulselvan, P.; Senthilkumar, G.P. In vitro antibacterial and antifungal activities of ethanolic extract of Aloe vera leaf gel. J. Plant Sci. 2006, 1, 348–355. [Google Scholar] [CrossRef]
- Eshun, K.; He, Q. Aloe vera: A valuable ingredient for the food, pharmaceutical and cosmetic industries—A review. Crit. Rev. Food Sci. 2004, 44, 91–96. [Google Scholar] [CrossRef]
- Rodríguez, E.; Darias, J.; Díaz, C. Aloe vera as a functional food. Crit. Rev. Food Sci. 2010, 50, 305–326. [Google Scholar] [CrossRef]
- Bhattacharya, M.; Malik, S.; Singh, A. Aloe vera Barbadensis: A review on its ethanopharmacological value. J. Pharm. Res. 2011, 4, 4507–4510. [Google Scholar]
- Williamson, G.; Coppens, P.; Serra-Majem, L.; Dew, T. Review of the efficacy of green tea, isoflavones and Aloe vera supplements based on randomized controlled trials. Food Funct. 2011, 2, 753–759. [Google Scholar] [CrossRef]
- Ahlawat, K.S.; Khatkar, B.S. Processing, food applications and safety of Aloe vera products: A review. J. Food Sci. Technol. 2011, 48, 525–533. [Google Scholar] [CrossRef]
- Farooqi, A.H.A.; Kumar, V.S. Review of biological and therapeutic effects of Aloe vera L. and its active constituents. J. Med. Aromat. Plant Sci. 2009, 31, 159–165. [Google Scholar]
- Harborne, J.B.; Williams, C.A. Advances in flavonoid research since 1992. Phytochemistry 2000, 55, 481–504. [Google Scholar] [CrossRef]
- Ferrazzano, G.F.; Amato, I.; Ingenito, A.; Zarrelli, A.; Pinto, G.; Pollio, A. Plant polyphenols and their anti-cariogenic properties: A review. Molecules 2011, 16, 1486–1507. [Google Scholar]
- Quideau, S.; Deffieux, D.; Douat-Casassus, C.; Pouységu, L. Plant polyphenols: Chemical properties, biological activities, and synthesis. Angew. Chem. Int. Ed. 2011, 50, 586–621. [Google Scholar] [CrossRef]
- Yao, L.H.; Jiang, Y.M.; Shi, J.; Barbera, S.; Toma, F.A.; Datta, N.N.; Singanusong, R.; Chen, S.S. Flavonoids in food and their health benefits. Plant Food Hum. Nutr. 2004, 59, 113–122. [Google Scholar] [CrossRef]
- Sathyaprabha, G.; Kumaravel, S.; Ruffina, D.; Praveenkumar, P. A comparative study on antioxidant, proximate analysis, antimicrobial activity and phytochemical analysis of Aloe vera and Cissus quadrangularis by GC-MS. J. Pharm. Res. 2010, 3, 2970–2973. [Google Scholar]
- Zanh, M.; Trinth, T.; Jeong, M.L.; Wang, D.; Abeysinghe, P.; Jia, Q.; Ma, W. A reversed-phase high-performance liquid chromatographic method for the determination of aloesin, aloeresin A and anthraquinone in Aloe ferox. Phytochem. Anal. 2008, 19, 122–126. [Google Scholar] [CrossRef]
- Okamura, N.; Asai, M.; Hine, N.; Yagi, A. High-performance liquid chromatographic determination of phenolic compounds in Aloe species. J. Chromatogr. A 1996, 746, 225–231. [Google Scholar] [CrossRef]
- Park, M.K.; Park, J.H.; Kim, N.Y.; Shin, Y.G.; Choi, Y.S.; Lee, J.G.; Kim, K.H.; Lee, S.K. Analysis of 13 phenolic compounds in Aloe species by high performance liquid chromatography. Phytochem. Anal. 1998, 9, 186–191. [Google Scholar] [CrossRef]
- Rebecca, W.; Kayser, O.; Hagels, H.; Zessin, K.-H.; Madundo, M.; Gambal, N. The phytochemical profile and identification of main phenolic compounds from the leaf exudate of Aloe secundiflora by highperformance liquid chromatography-mass spectroscopy. Phytochem. Anal. 2003, 14, 83–86. [Google Scholar] [CrossRef]
- Keyhanian, S.; Stahl-Biskup, E. Phenolic constituents in dried flowers of Aloe vera (Aloe barbadensis) and their in vitro antioxidative capacity. Planta Med. 2007, 73, 599–602. [Google Scholar] [CrossRef]
- Brown, D.R.; May, M.; Bradbury, J.M.; Johansson, K.E. Class I. Mollicutes Edward and Freundt 1967, 267AL. In Bergey’s Manual of Systematic Bacteriology; Krieg, N.R., Ludwig, W., Whitman, W.B., Hedlund, B.P., Paster, B.J., Staley, J.T., Ward, N., Brown, D., Parte, A., Eds.; Springer: New York, NY, USA, 2010; Volume 4, pp. 568–723. [Google Scholar]
- Béven, L.; Duval, D.; Rebuffat, S.; Riddell, F.G.; Bodo, B.; Wróblewski, H. Membrane permeabilisation and antimycoplasmic activity of the 18-residue peptaibols, trichorzins. Biochim. Biophys. Acta 1998, 1372, 78–90. [Google Scholar] [CrossRef]
- Taverniers, I.; de Loose, M.; van Bockstaele, E. Trends in quality in the analytical laboratory. Traceability and measurement uncertainty of analytical results. Trends Anal. Chem. 2004, 23, 480–490. [Google Scholar] [CrossRef]
- Shabir, G.A. Validation of high-performance liquid chromatography methods for pharmaceutical analysis. Understanding the differences and similarities between validation requirements of the US Food and Drug Administration, the US Pharmacopeia and the International Conference on Harmonization. J. Chromatogr. A 2003, 987, 57–66. [Google Scholar] [CrossRef]
- López, A.; Rico, M.; Rivero, A.; Suarez de Tangil, M. The effects of solvents on the phenolic contents and antioxidant activity of Stypocaulon scoparium algae extracts. Food Chem. 2011, 125, 1104–1111. [Google Scholar] [CrossRef]
- Silva, M.M.; Santos, M.R.; Caroco, G.; Rocha, R.; Justino, G.; Mira, L. Structure-antioxidant activity relationship of flavonoids: A re-examination. Free Radic. Res. 2002, 36, 1219–1227. [Google Scholar] [CrossRef]
- Zhao, M.; Yang, B.; Wang, J.; Li, B.; Jiang, Y. Identification of the major flavonoids from pericarp tissues of lychie fruit in relation to their antioxidant activities. Food Chem. 2006, 98, 539–544. [Google Scholar] [CrossRef]
- Al-Momani, W.; Abu-Basha, E.; Janakat, S.; Nicholas, R.A.; Ayling, R.D. In vitro antimycoplasmal activity of six Jordanian medicinal plants against three Mycoplasma species. Trop. Anim. Health Prod. 2007, 39, 515–519. [Google Scholar] [CrossRef]
- Rodríguez Vaquero, M.J.; Alberto, M.R.; Manmca de Nadra, M.C. Antibacterial effect of phenolic compounds from different wines. Food Control. 2007, 18, 93–101. [Google Scholar] [CrossRef]
- Wright, J.S.; Johnson, E.R.; DiLabio, G.A. Predicting the activity of phenolic antioxidants: Theoretical method, analysis of substituent effects, and application to major families of antioxidants. J. Am. Chem. Soc. 2001, 123, 1173–1183. [Google Scholar] [CrossRef]
- Jacobo-Velazquez, D.A.; Cisneros-Zevallos, L. Correlations of antioxidant activity against phenolic content revisited: A new approach in data analysis for food and medicinal plants. J. Food Sci. 2009, 74, 107–113. [Google Scholar] [CrossRef]
- Rico, M.; López, A.; Santana-Casiano, J.M.; González, A.G.; González-Dávila, M. Variability of the phenolic profile in the diatom Phaeodactylum tricornutum growing under copper and iron stress. Limnol. Oceanogr. 2013, 58, 144–152. [Google Scholar] [CrossRef]
- Tafesh, A.; Najami, N.; Jadoun, J.; Halahlih, F.; Riepl, H.; Azaizeh, H. Synergistic antibacterial effects of polyphenolic compounds from olive mill wastewater. Evid. Based Complement. Alternat. Med. 2011. [Google Scholar] [CrossRef]
- Gao, Y.-N.; Liu, B.-Y.; Xu, D.; Zhou, Q.-H.; Hu, C.-Y.; Ge, F.-J.; Zhang, L.-P.; Wu, Z.-B. Phenolic compounds exuded from two submerged freshwater macrophytes and their allelopathic effects on Microcystis aeruginosa. Pol. J. Environ. Stud. 2011, 20, 1153–1159. [Google Scholar]
- Kirchhoff, H.; Rosengarten, R. Isolation of a motile mycoplasma from fish. J. Gen. Microbiol. 1984, 130, 2439–2445. [Google Scholar]
- Ramírez, A.S.; González, M.; Déniz, S.; Fernández, A.; Poveda, J.B. Evaluation of a Modified SP-4 Medium in the Replication of Mycoplasma spp. In Mycoplasmas of Ruminants: Pathogenicity, Diagnostics, Epidemiology and Molecular Genetics; Frey, J., Sarris, K., Eds.; European Cooperation on Scientific and Technical Research: Luxembourg, 1997; Volume 2, pp. 36–39. [Google Scholar]
- Hayouni, E.A.; Abedrabba, M.; Bouix, M.; Hamdi, M. The effects of solvents and extraction method on the phenolic contents and biological activities in vitro of Tunisian Quercus coccifera L. and Juniperus phoenicea L. fruit extracts. Food Chem. 2007, 105, 267–273. [Google Scholar]
- Cock, I. Antimicrobial activity of Eucalyptus major and Eucalyptus baileyana methanolic extracts. Int. J. Microbiol. 2009, 6. [Google Scholar] [CrossRef]
- Bondet, V.; Brand-Williams, W.; Berset, C. Kinetics and mechanisms of antioxidant activity using the DPPH free radical method. Lebensm. Wiss. Technol. 1997, 30, 609–615. [Google Scholar]
- Benzie, I.F.F.; Strain, J. The ferric reducing ability of plasma (FRAP) as a measure of antioxidant power: The FRAP assay. Anal. Biochem. 1996, 239, 70–76. [Google Scholar] [CrossRef]
- Poveda, J.B.; Nicholas, R. Serological Identification of Mycoplasmas by Growth and Metabolic Inhibition Tests. In Methods in Molecular Biology; Miles, R., Nicholas, R., Eds.; Humana Press Inc.: Totowa, NJ, USA, 1998; Volume 104, pp. 105–111. [Google Scholar]
- Sample Availability: Commerical available.
© 2013 by the authors; licensee MDPI, Basel, Switzerland. This article is an open access article distributed under the terms and conditions of the Creative Commons Attribution license (http://creativecommons.org/licenses/by/3.0/).
Share and Cite
López, A.; De Tangil, M.S.; Vega-Orellana, O.; Ramírez, A.S.; Rico, M. Phenolic Constituents, Antioxidant and Preliminary Antimycoplasmic Activities of Leaf Skin and Flowers of Aloe vera (L.) Burm. f. (syn. A. barbadensis Mill.) from the Canary Islands (Spain). Molecules 2013, 18, 4942-4954. https://doi.org/10.3390/molecules18054942
López A, De Tangil MS, Vega-Orellana O, Ramírez AS, Rico M. Phenolic Constituents, Antioxidant and Preliminary Antimycoplasmic Activities of Leaf Skin and Flowers of Aloe vera (L.) Burm. f. (syn. A. barbadensis Mill.) from the Canary Islands (Spain). Molecules. 2013; 18(5):4942-4954. https://doi.org/10.3390/molecules18054942
Chicago/Turabian StyleLópez, Aroa, Miguel Suárez De Tangil, Orestes Vega-Orellana, Ana S. Ramírez, and Milagros Rico. 2013. "Phenolic Constituents, Antioxidant and Preliminary Antimycoplasmic Activities of Leaf Skin and Flowers of Aloe vera (L.) Burm. f. (syn. A. barbadensis Mill.) from the Canary Islands (Spain)" Molecules 18, no. 5: 4942-4954. https://doi.org/10.3390/molecules18054942
APA StyleLópez, A., De Tangil, M. S., Vega-Orellana, O., Ramírez, A. S., & Rico, M. (2013). Phenolic Constituents, Antioxidant and Preliminary Antimycoplasmic Activities of Leaf Skin and Flowers of Aloe vera (L.) Burm. f. (syn. A. barbadensis Mill.) from the Canary Islands (Spain). Molecules, 18(5), 4942-4954. https://doi.org/10.3390/molecules18054942