3D-QSAR and Cell Wall Permeability of Antitubercular Nitroimidazoles against Mycobacterium tuberculosis

1. Introduction
2. Result and Disscussion
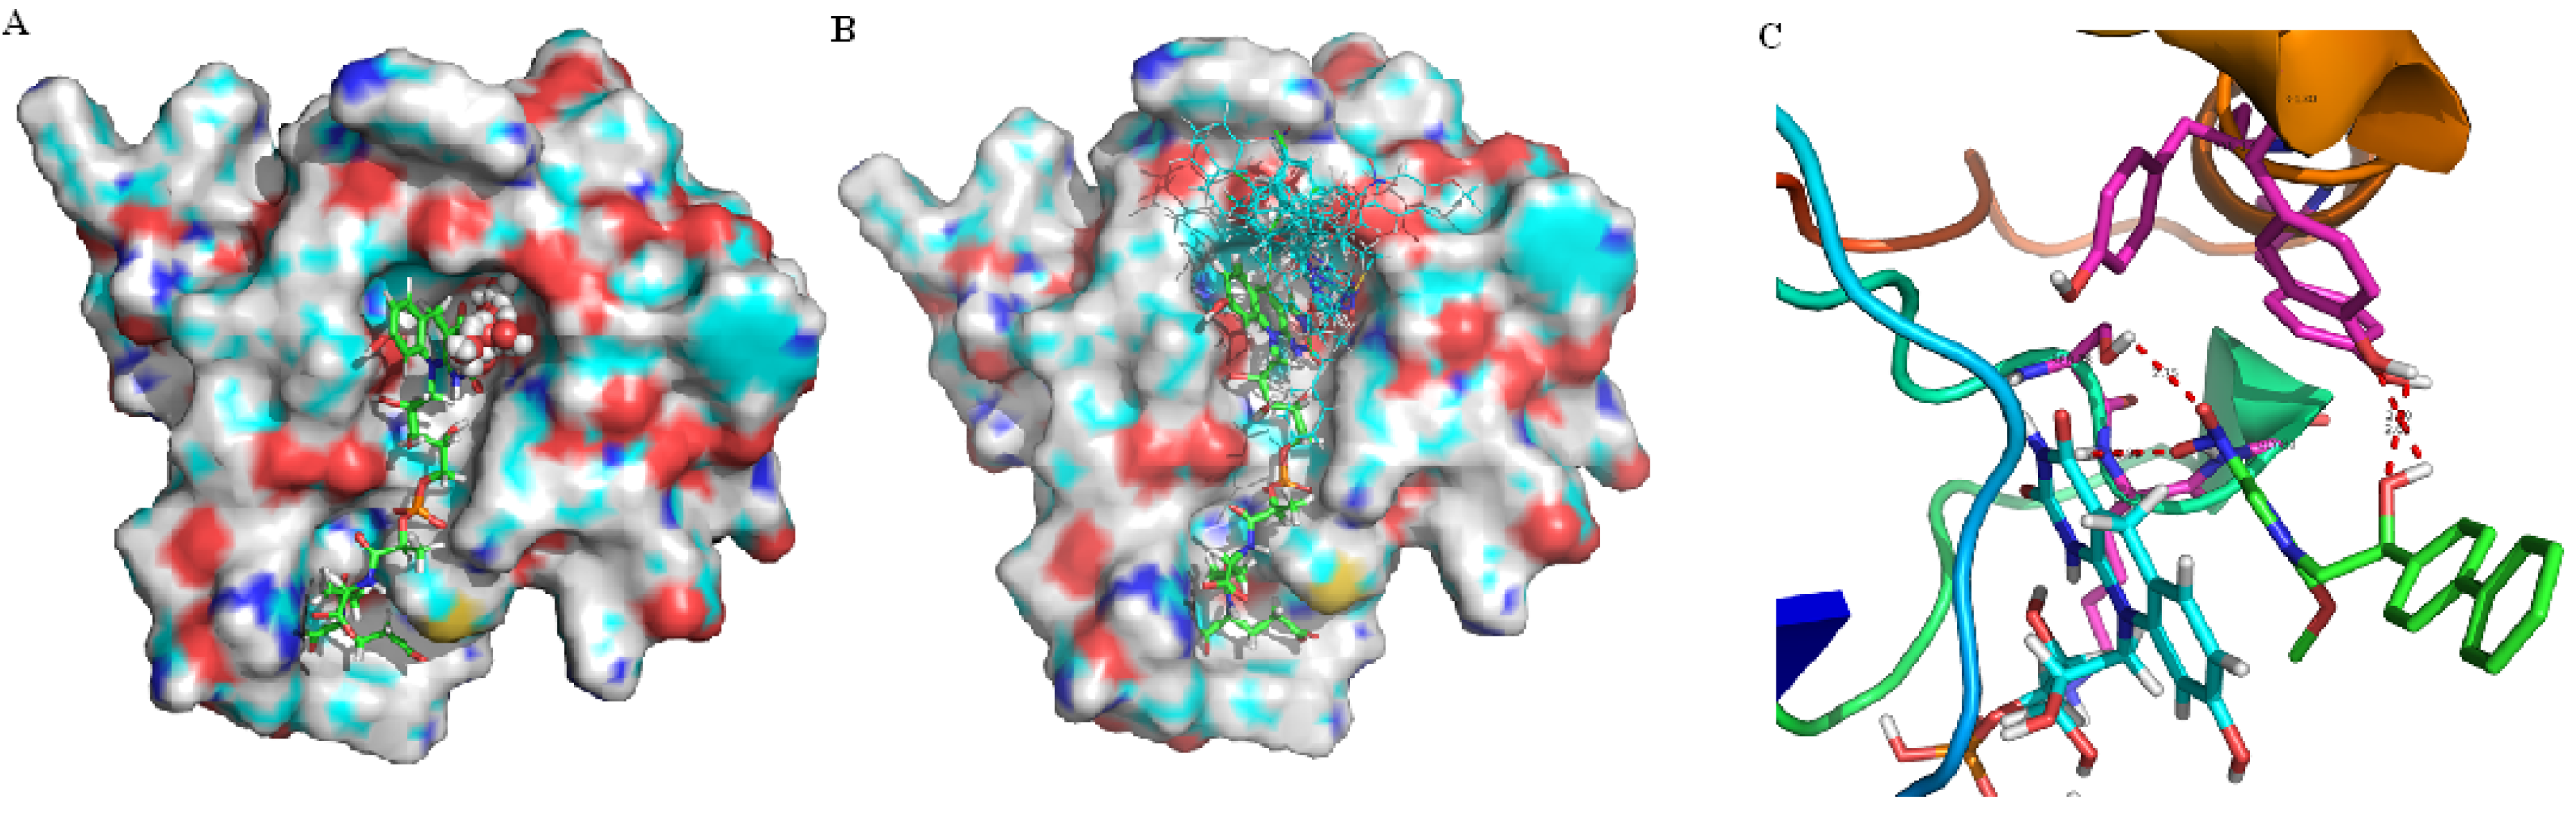
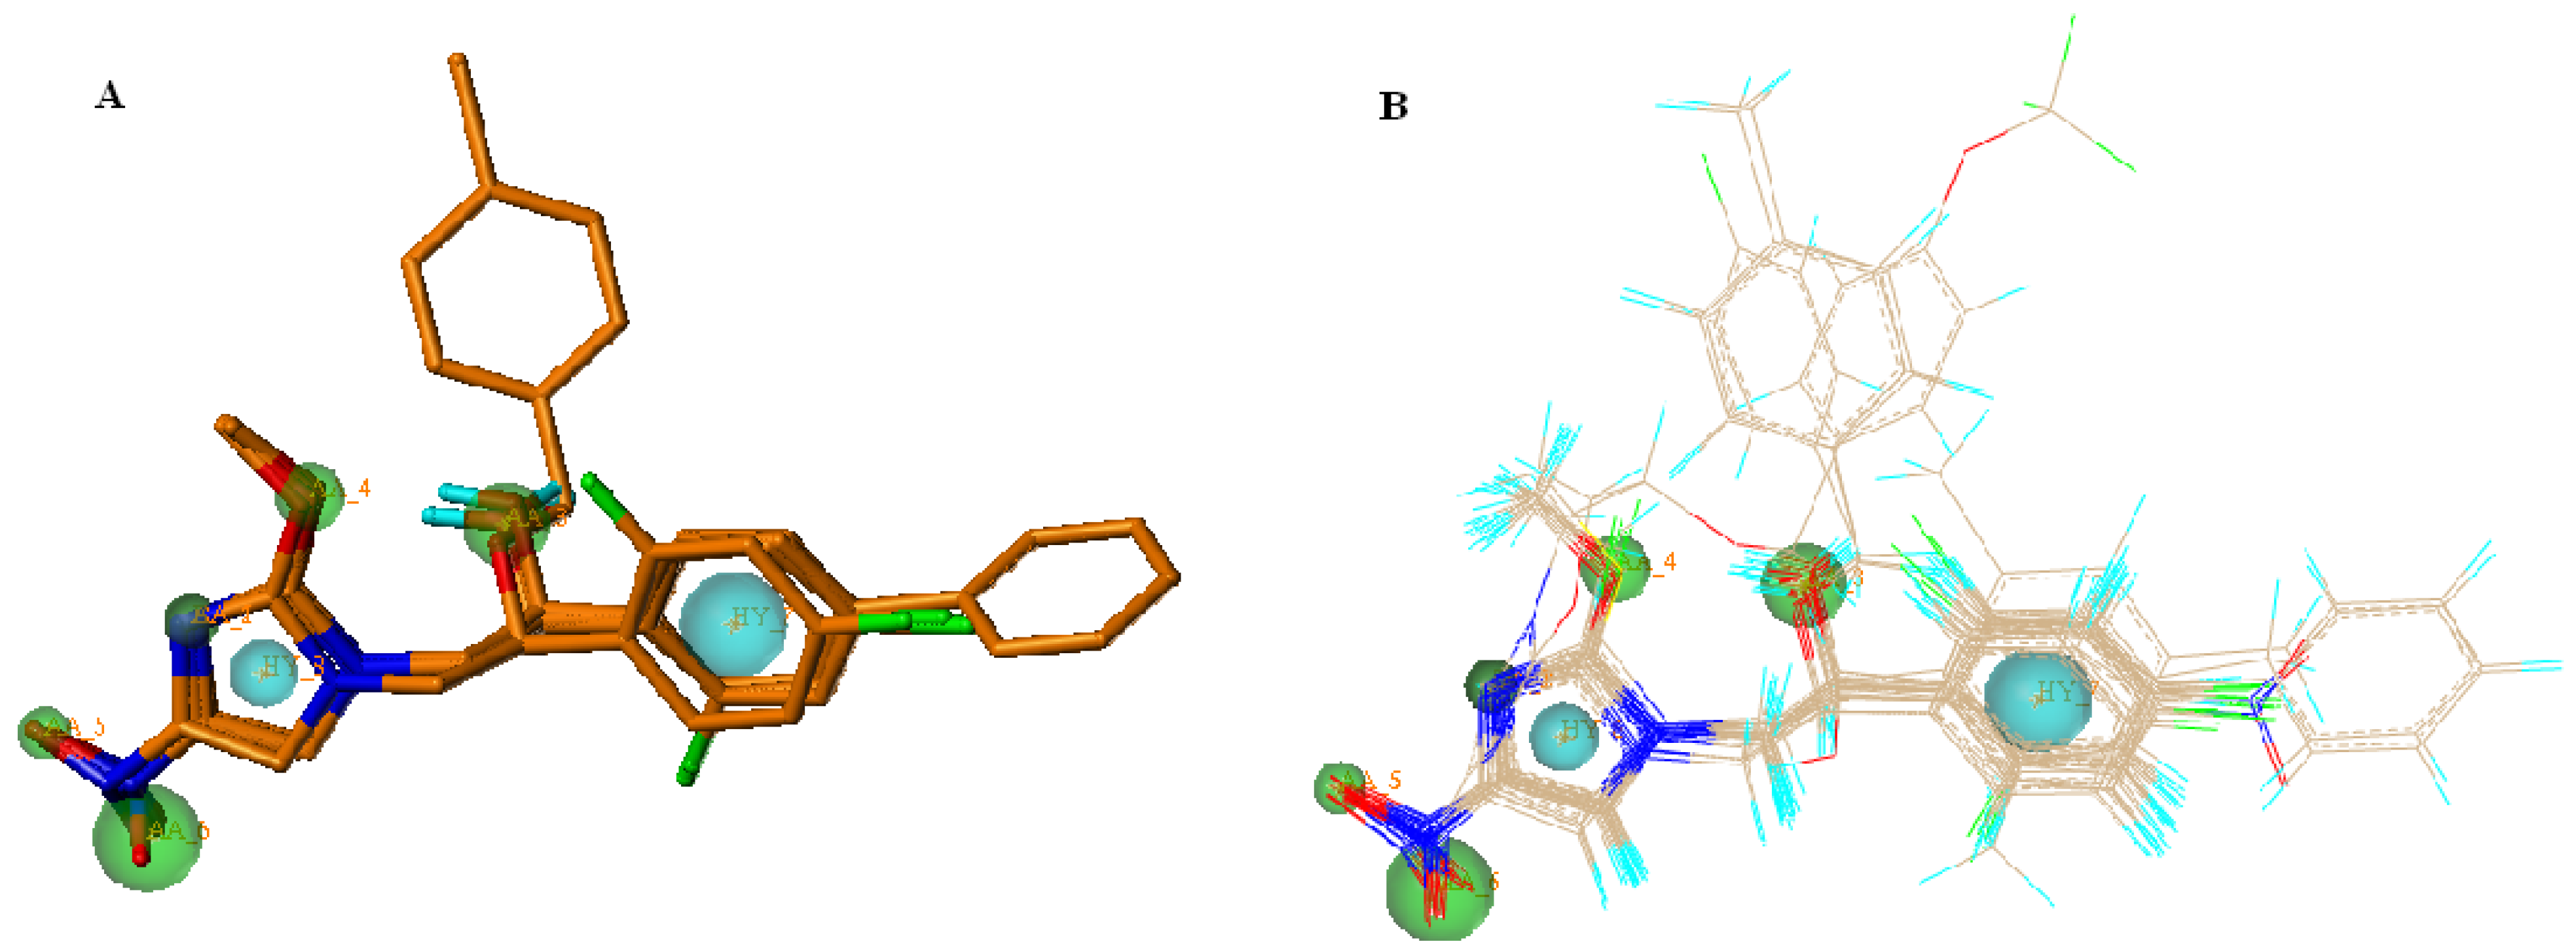
2.1. Binding Site and Docking Results

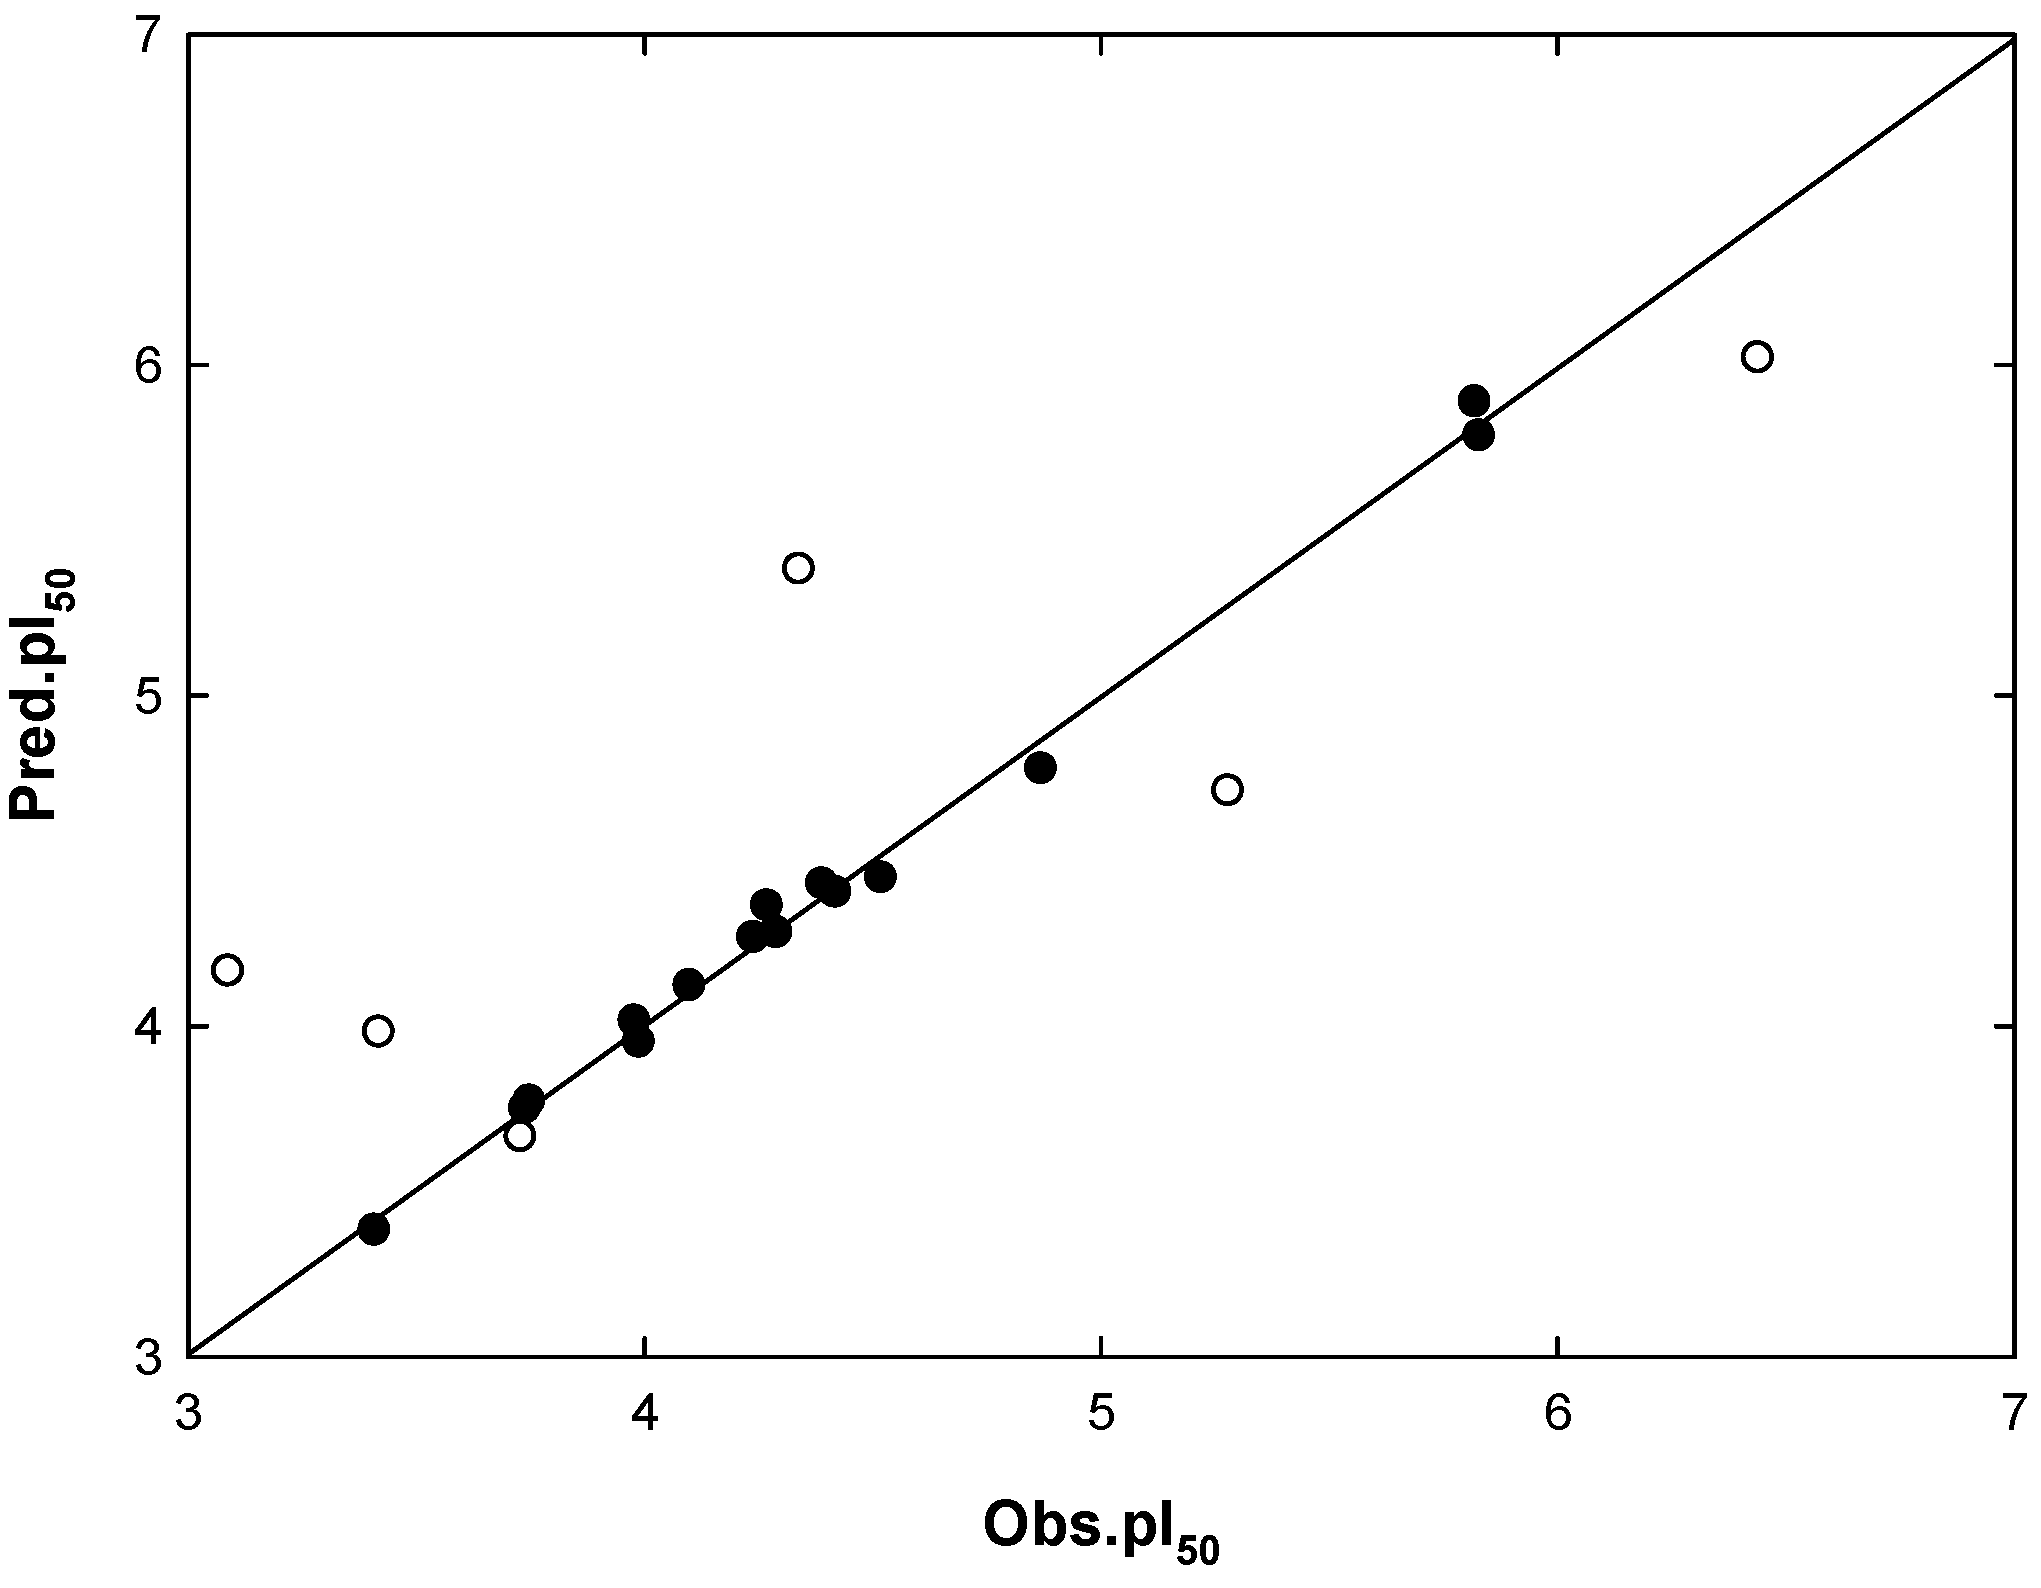
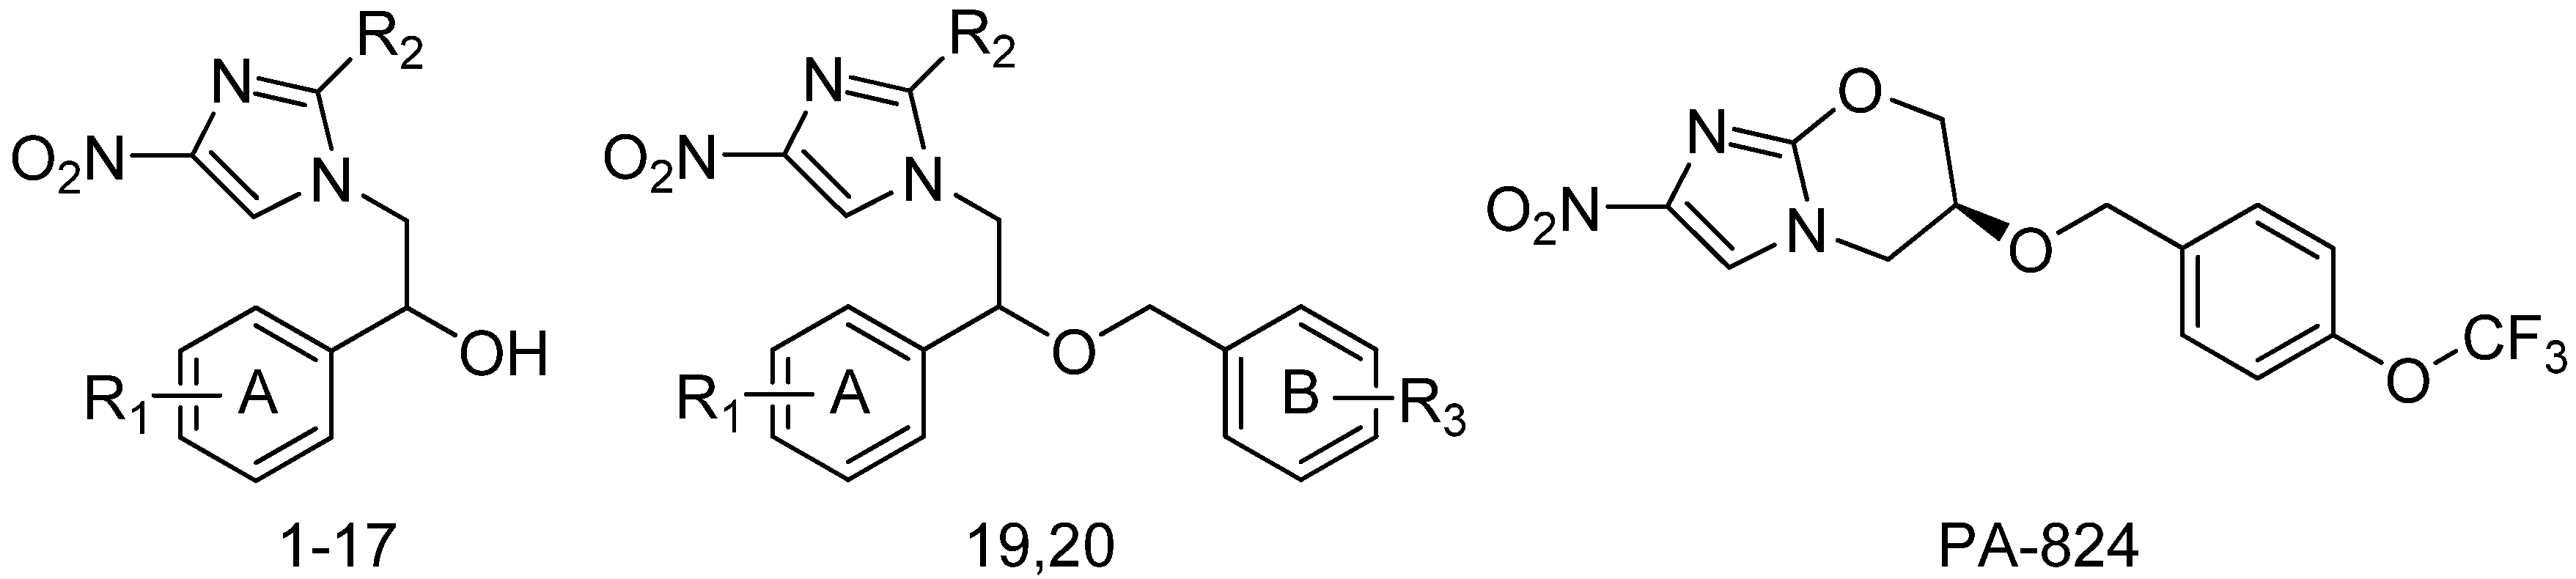
| No. | R1 | R2 | R3 | Obs.pI50 a | Pred.pI50 b | Dev. c | DS d |
|---|---|---|---|---|---|---|---|
| 1 | 2,4-Cl | H | 3.98 | 4.013 | −0.033 | −7.1 | |
| 2 f | 2,4-Cl | Br | 5.28 | 4.710 | 0.570 | −7.3 | |
| 3 f | 2,4-F | H | 3.02 | 4.164 | −1.144 | −7.2 | |
| 4 | 2,4-F | Br | 3.74 | 3.749 | −0.009 | −7.6 | |
| 5 | 4-F | Br | 3.41 | 3.381 | 0.029 | −7.6 | |
| 6 f | 4-Cl | Br | 3.73 | 3.663 | 0.067 | −7.5 | |
| 7 | 4-NO2 | Br | 3.75 | 3.772 | −0.022 | −7.1 | |
| 8 | H | Br | 3.99 | 3.950 | 0.040 | −7.2 | |
| 9 f | 2,4-CH3 | Br | 3.42 | 3.980 | −0.560 | −7.7 | |
| 10 e | 2,4-Cl | O | 5.82 | 5.886 | −0.066 | −7.3 | |
| 11 e | 2,4-Cl | O | 4.87 | 4.776 | 0.094 | −7.3 | |
| 12 | 4-F | O | 4.24 | 4.266 | −0.026 | −7.6 | |
| 13 | 4-Cl | O | 4.27 | 4.362 | −0.092 | −7.1 | |
| 14 | 4-NO2 | O | 4.29 | 4.281 | 0.009 | −7.3 | |
| 15 e | 4-Phenyl | O | 5.83 | 5.784 | 0.046 | −7.2 | |
| 16 f | 2,4-Cl | S | 4.34 | 5.380 | −1.040 | −6.9 | |
| 17 e | H | O | 4.52 | 4.447 | 0.073 | −7.4 | |
| 18 | 2,4-CH3 | O | 4.39 | 4.429 | −0.039 | −7.2 | |
| 19 e | 2,4-F | 4-Cl | 4.42 | 4.403 | 0.017 | −7.0 | |
| 20 | 2,4-F | 4-F | 4.10 | 4.121 | −0.021 | −8.2 | |
| 21 f,g | 6.44 | 6.020 | 0.420 | −7.6 |
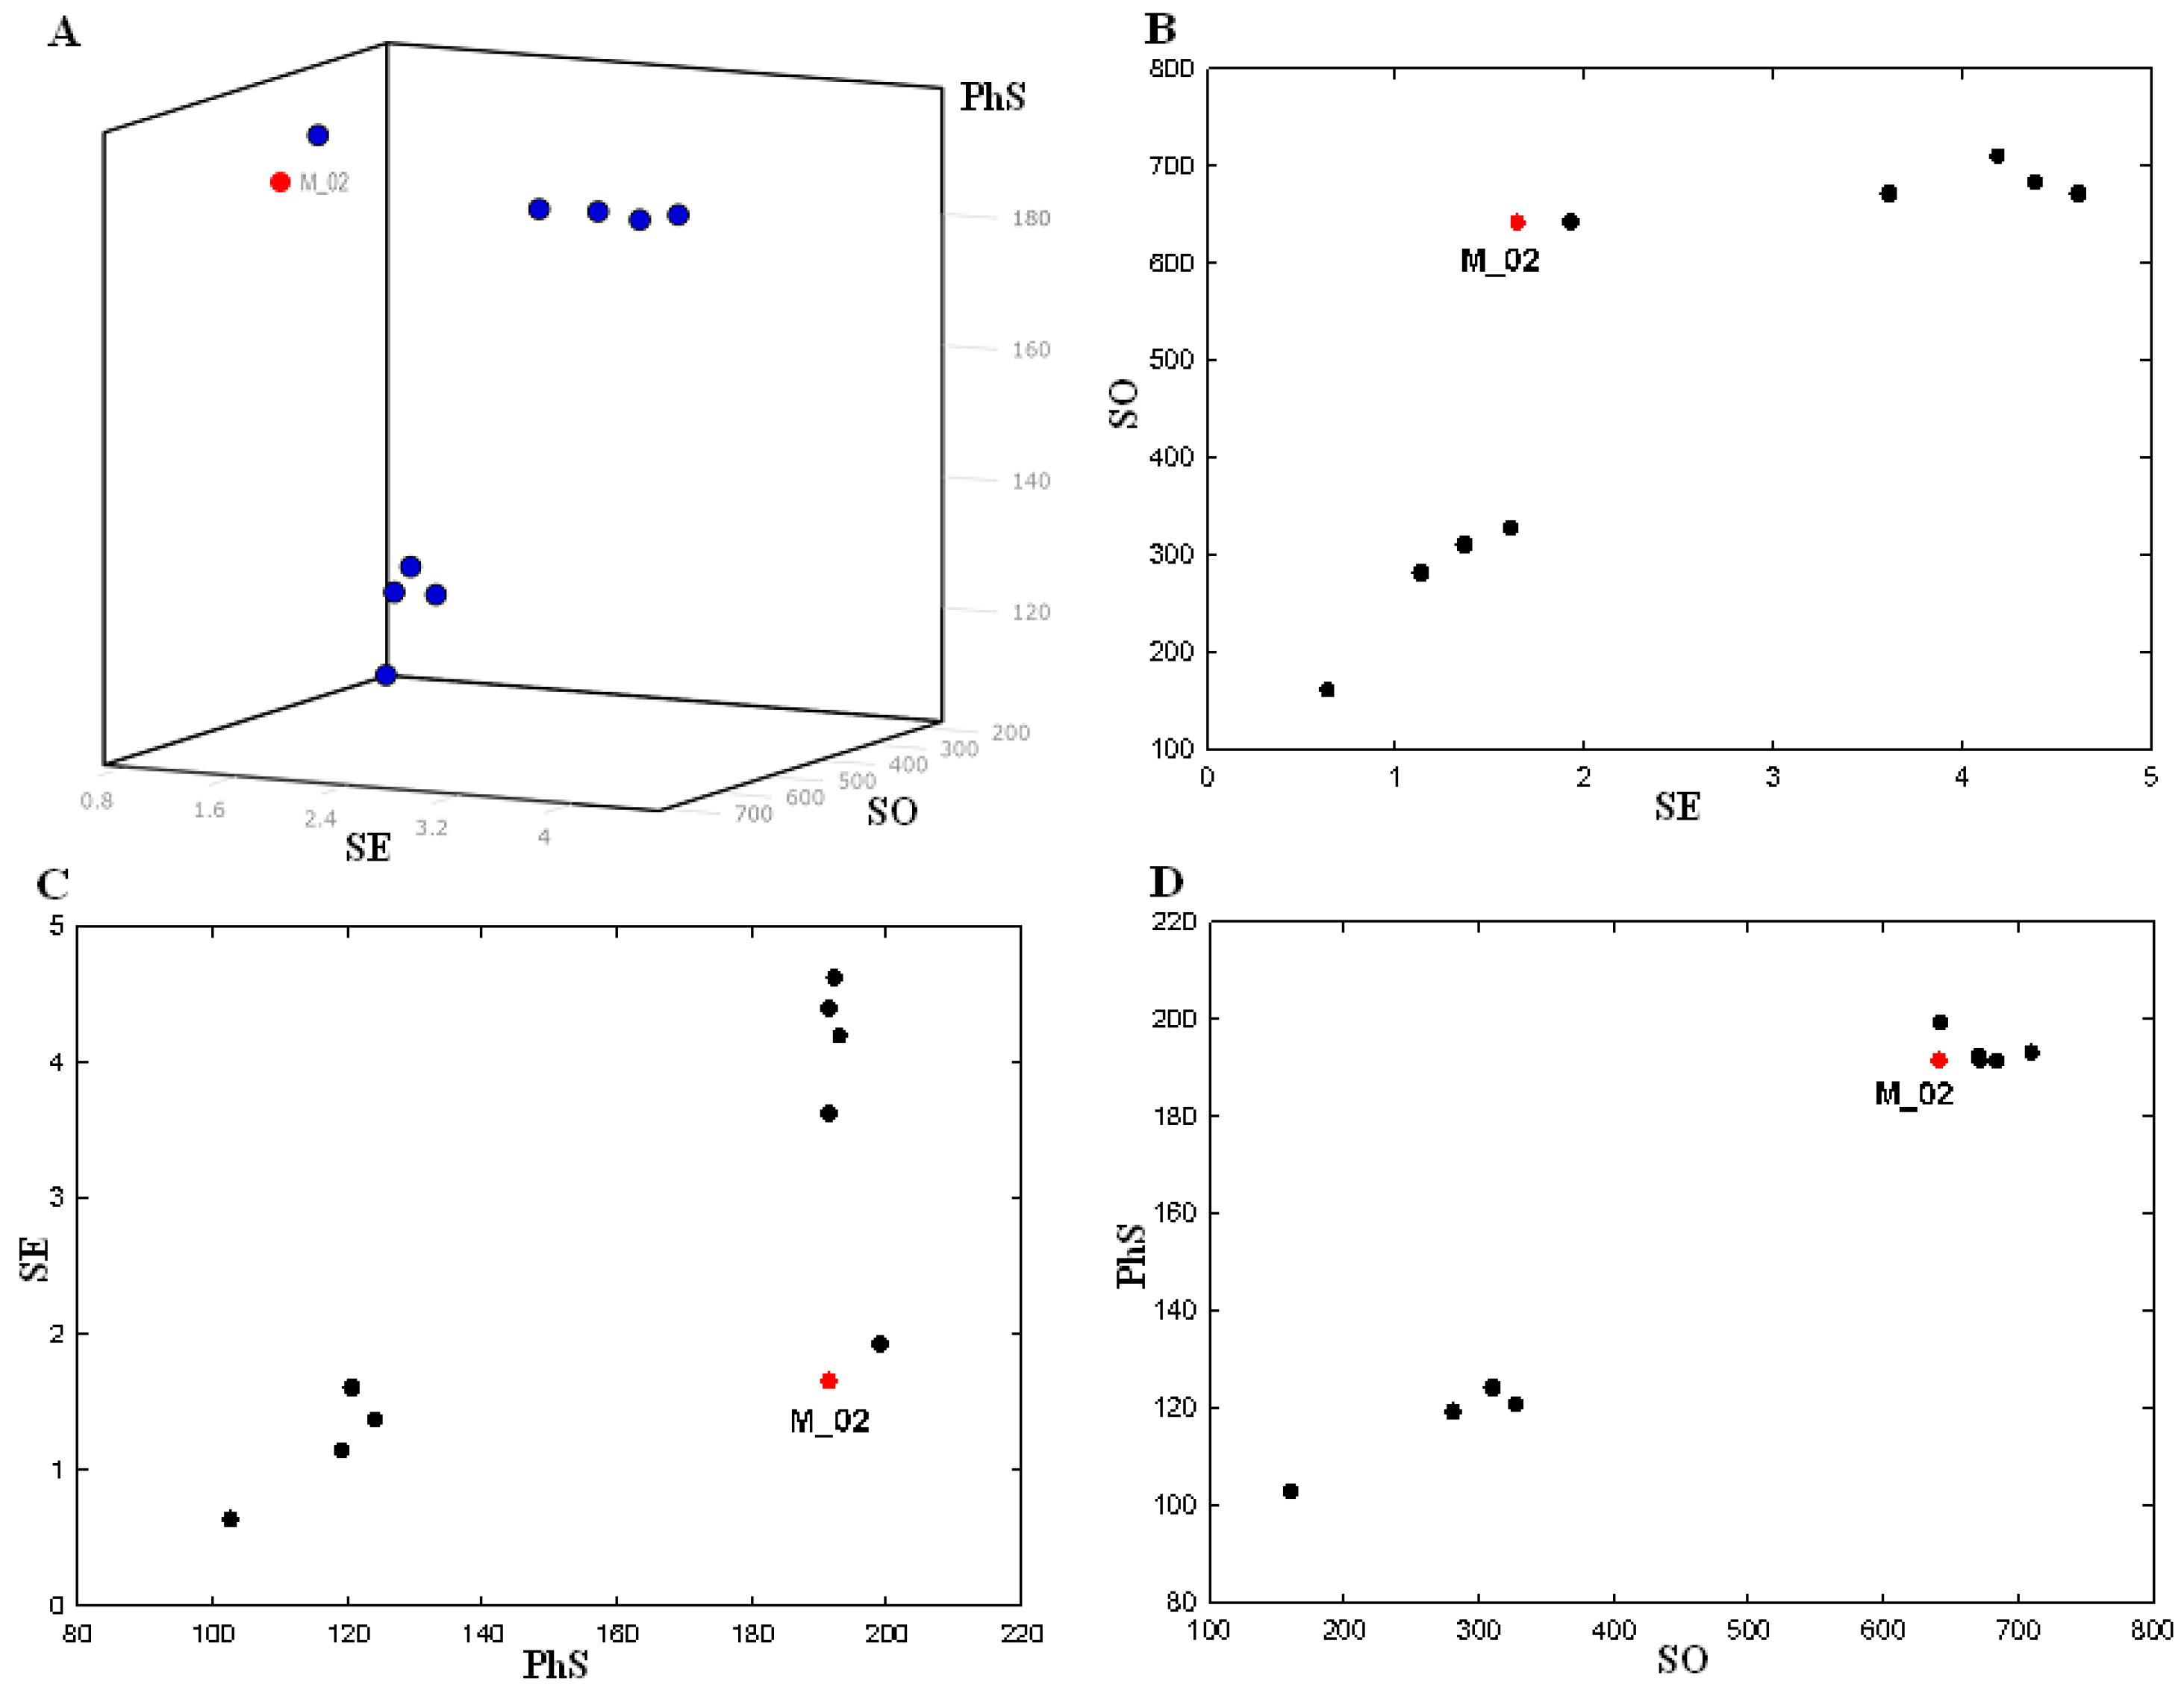
2.2. Pharmacophore and Alignments
| Model | FEATS | SE | SO | PhS |
|---|---|---|---|---|
| M_01 | 9 | 1.93 | 642.6 | 199.1 |
| M_02 | 8 | 1.65 | 641.6 | 191.5 |
| M_03 | 8 | 3.62 | 671.7 | 191.5 |
| M_04 | 9 | 4.39 | 684 | 191.5 |
| M_05 | 8 | 4.19 | 710.3 | 193.1 |
| M_06 | 8 | 4.62 | 671 | 192.3 |
| M_09 | 8 | 1.37 | 310.4 | 124.1 |
| M_10 | 8 | 1.61 | 327.4 | 120.7 |
| M_13 | 7 | 1.14 | 280.9 | 119.2 |
| M_17 | 7 | 0.64 | 160.7 | 102.7 |
| Min a | 0.64 | 160.7 | 102.7 | |
| Max b | 4.62 | 710.3 | 199.1 | |
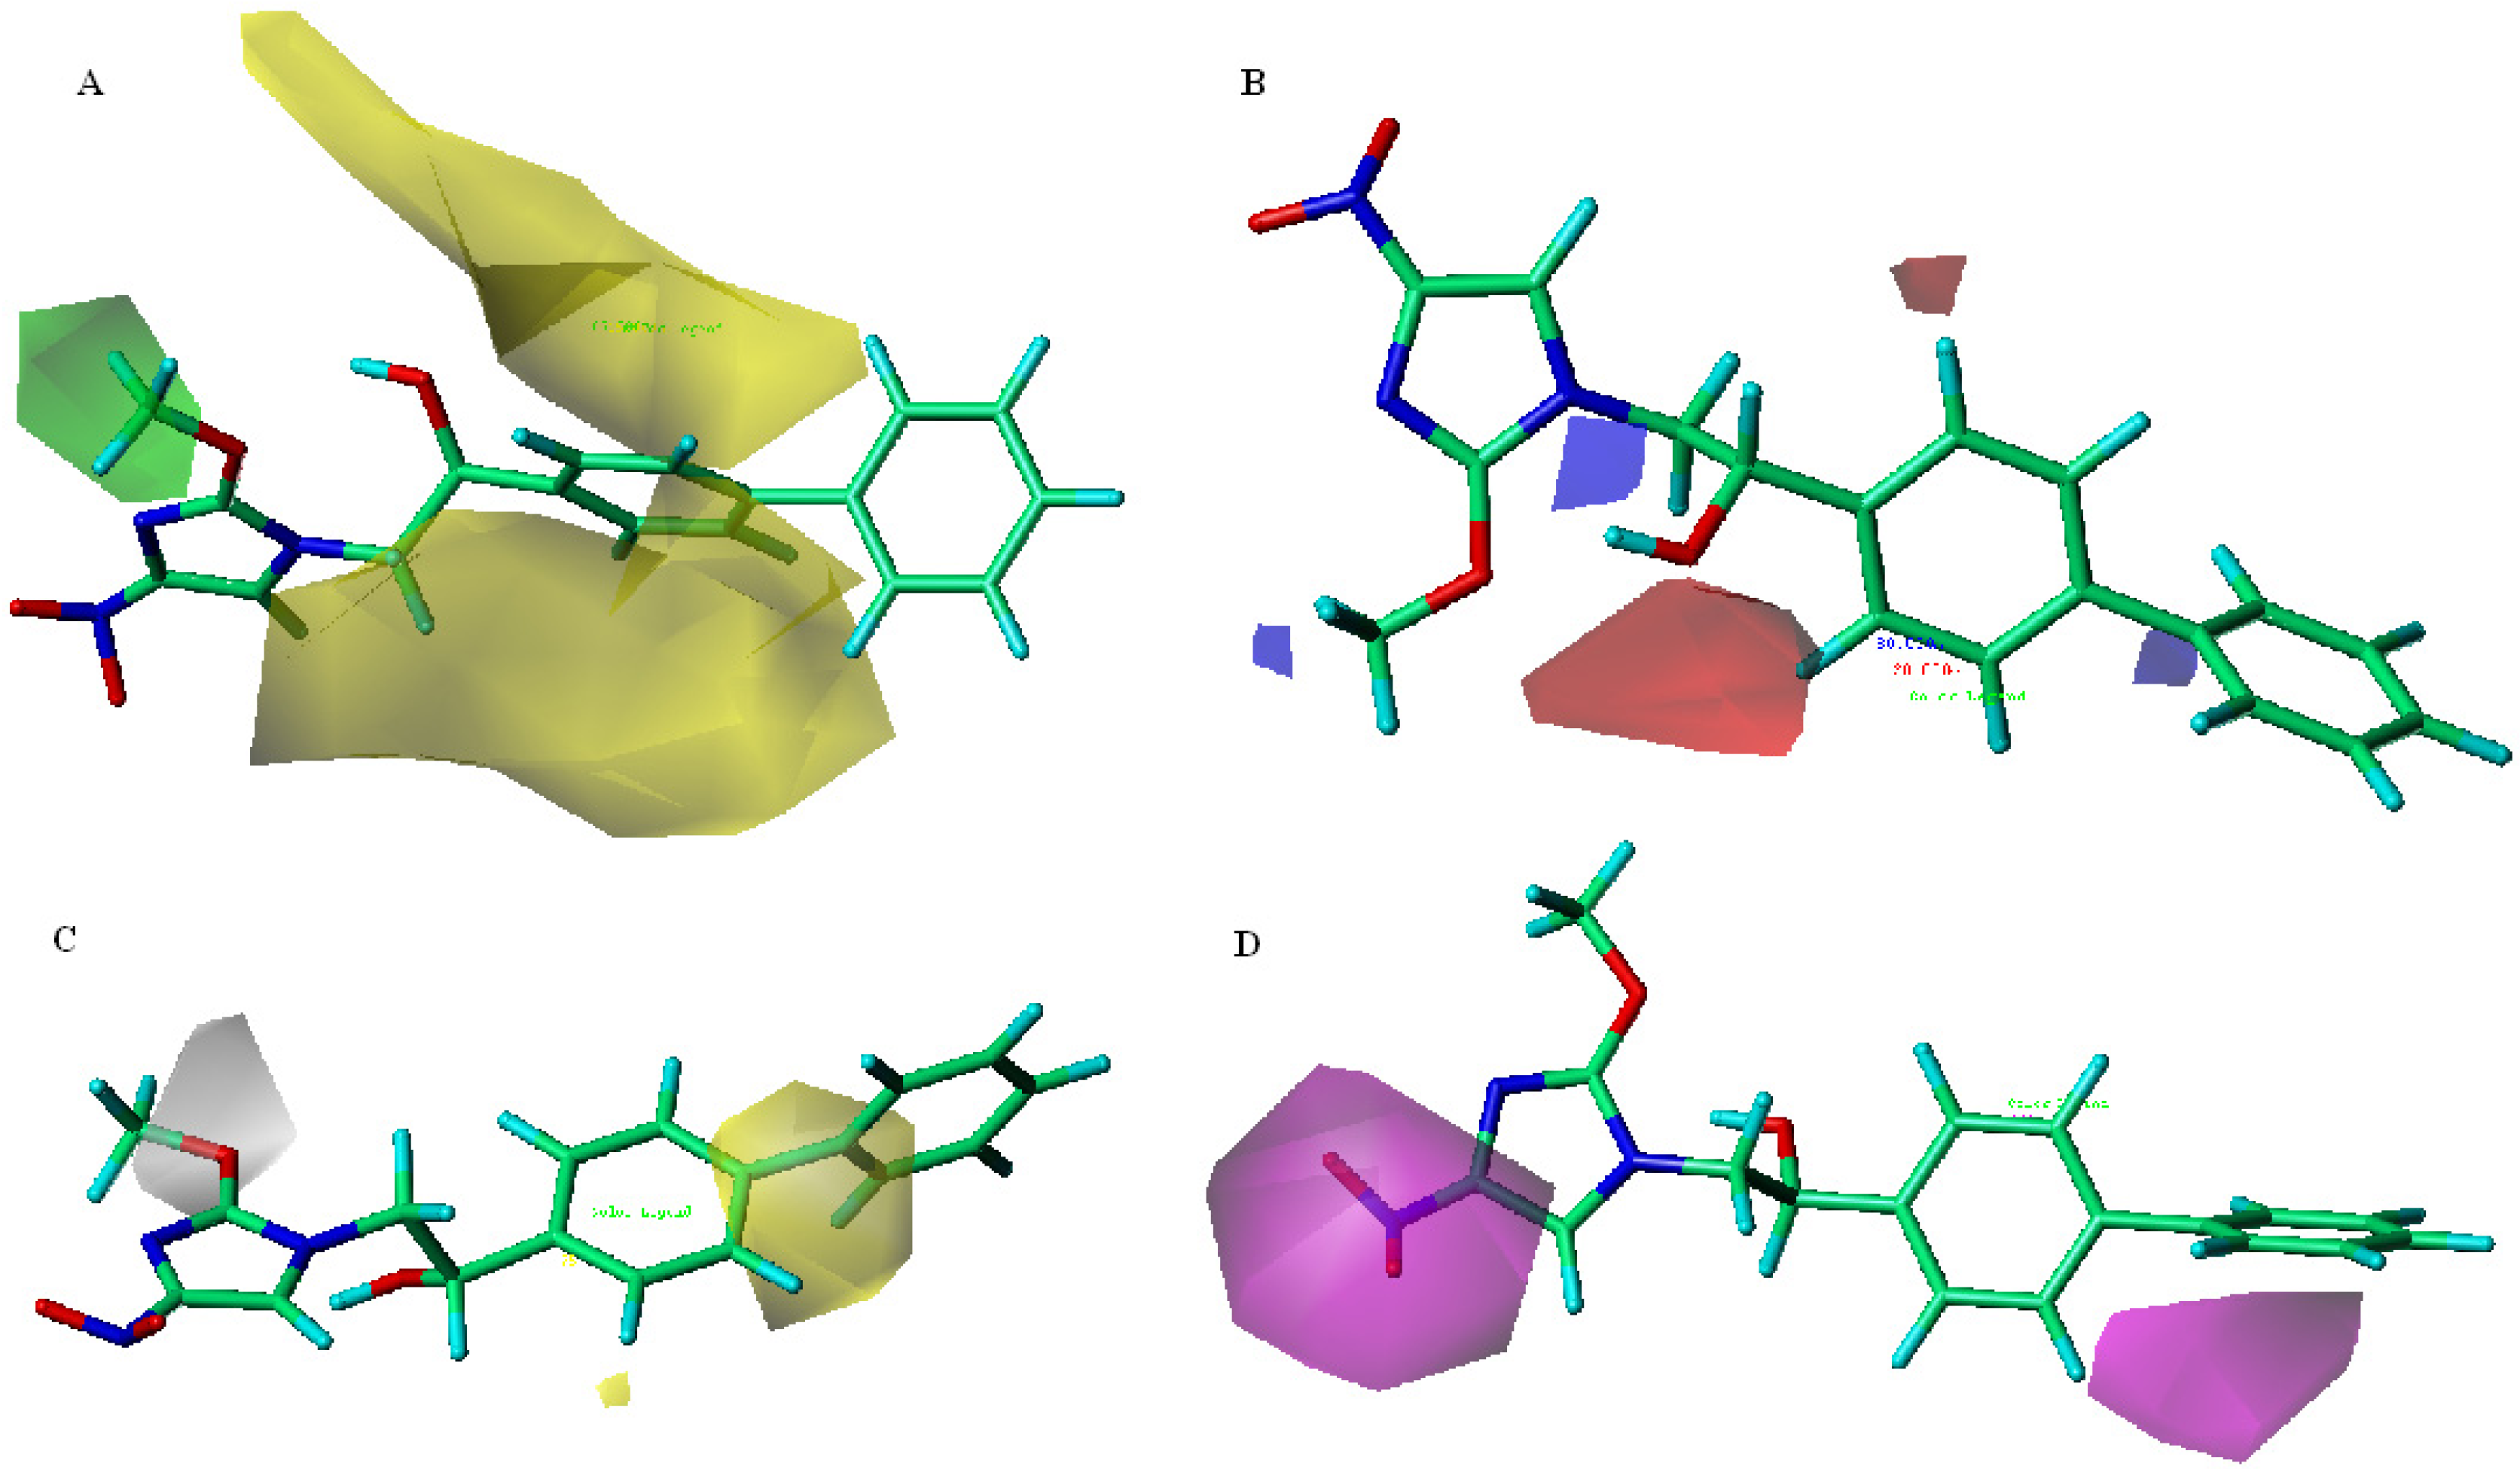
2.3. 3D-QSAR
 ) > 0.6 was verified by statistical criteria [17].
 (0.999) and F (1049.253) as well as small SEE (0.032), but it had a high deviation Scv (0.629) and a low external prediction (0.446) which indicates that the CoMFA model was a non-reliable. Therefore we did not consider the CoMFA model. = 0.995) was better than other models for internal CoMSIA statistical values, but the external test set predictive value indicated that the model IC (0.611) was better than ID (0.554), in the above criteria with CoMSIA analyses thus the best model IC was selected. The best CoMSIA model included S∙E∙H∙HA fields and had a q2 (0.681), (0.995), F (243.308) and a small SEE (0.067) using six components.
| Parameters | COMFA | COMSIA | |||||
|---|---|---|---|---|---|---|---|
| IA | IB | IC | ID | IE | IF | ||
| Component | 6 | 6 | 6 | 6 | 6 | 6 | 6 |
| q2a | 0.521 | 0.694 | 0.736 | 0.681 | 0.749 | 0.714 | 0.671 |
| Scvb | 0.629 | 0.503 | 0.467 | 0.514 | 0.455 | 0.487 | 0.522 |
| rcv c | 0.488 | 0.655 | 0.702 | 0.687 | 0.722 | 0.707 | 0.758 |
| rncv2 d | 0.999 | 0.992 | 0.992 | 0.995 | 0.995 | 0.992 | 0.994 |
| F e | 1049.253 | 174.433 | 163.561 | 243.308 | 291.917 | 174.561 | 214.532 |
| SEE f | 0.032 | 0.079 | 0.082 | 0.067 | 0.061 | 0.079 | 0.071 |
| Fraction | |||||||
| Steric | 0.466 | 0.084 | 0.095 | 0.087 | 0.119 | 0.096 | |
| Electrostatic | 0.534 | 0.425 | 0.503 | 0.553 | 0.708 | 0.484 | 0.488 |
| Hydrophobic | 0.130 | 0.147 | 0.152 | 0.173 | 0.143 | ||
| Donor | 0.199 | 0.255 | 0.193 | 0.233 | |||
| Acceptor | 0.157 | 0.209 | 0.180 | 0.192 | |||
| g | 0.446 | 0.516 | 0.435 | 0.611 | 0.554 | 0.548 | 0.477 |
2.4. Mtb Cell Wall Permeability Prediction
| Parameters | IIA | IIB | IIC | IID | IIE | IIF | IIG |
|---|---|---|---|---|---|---|---|
| n a | 77 | 77 | 77 | 77 | 77 | 77 | 77 |
| q2 b | 0.475 | 0.468 | 0.436 | 0.594 | 0.583 | 0.597 | 0.598 |
| r2c | 0.497 | 0.497 | 0.463 | 0.624 | 0.609 | 0.645 | 0.648 |
| r | 0.704 | 0.704 | 0.680 | 0.789 | 0.780 | 0.803 | 0.804 |
| F d | 73.98 | 74.03 | 64.68 | 61.29 | 57.51 | 67.20 | 67.98 |
| SEE e | 0.537 | 0.537 | 0.554 | 0.467 | 0.477 | 0.454 | 0.450 |
| logD f | 0.313 | 0.212 | 0.192 | 0.225 | 0.200 | ||
| PSA g | −0.006 | −0.004 | −0.004 | ||||
| HCPSA h | −0.011 | −0.007 | −0.007 | ||||
| rgyr i | −0.082 | −0.130 | |||||
| frtobj | 0.431 | 0.362 | |||||
| c k | −5.261 | −4.313 | −4.278 | −4.685 | −4.707 | −4.497 | −4.313 |
| No. | logPeff a | rgyr b | frtob c | logD d | PSA e |
|---|---|---|---|---|---|
| 1 | −4.6116343 | 4.0313 | 0.2000 | 2.46 | 149.838 |
| 2 | −4.5404066 | 3.9282 | 0.1904 | 2.67 | 147.268 |
| 3 | −4.8524414 | 3.8254 | 0.2000 | 1.39 | 152.410 |
| 4 | −4.7692208 | 3.6884 | 0.1904 | 1.59 | 145.796 |
| 5 | −4.7926759 | 3.7089 | 0.2000 | 1.50 | 147.788 |
| 6 | −4.7023681 | 3.9511 | 0.2000 | 2.05 | 150.179 |
| 7 | −5.0909159 | 4.0777 | 0.2272 | 1.24 | 239.008 |
| 8 | −4.7872804 | 3.4399 | 0.2105 | 1.31 | 150.507 |
| 9 | −4.6492473 | 3.6979 | 0.1904 | 2.15 | 156.862 |
| 10 | −4.5570507 | 4.0205 | 0.2272 | 2.41 | 127.883 |
| 11 | −4.8030476 | 3.8244 | 0.2272 | 1.33 | 130.829 |
| 12 | −4.8236766 | 3.8606 | 0.2380 | 1.24 | 130.382 |
| 13 | −4.7282331 | 4.0861 | 0.2380 | 1.79 | 131.800 |
| 14 | −5.1202633 | 4.2235 | 0.2608 | 0.98 | 219.603 |
| 15 | −4.5974279 | 4.8307 | 0.2222 | 2.89 | 130.405 |
| 16 | −4.4095507 | 4.0205 | 0.2272 | 3.09 | 141.513 |
| 17 | −4.8078457 | 3.5847 | 0.2500 | 1.05 | 129.134 |
| 18 | −4.6659152 | 3.8600 | 0.2272 | 1.89 | 130.823 |
| 19 | −4.0633268 | 4.0268 | 0.2580 | 4.05 | 103.310 |
| 20 | −4.1658948 | 4.2228 | 0.2580 | 3.79 | 102.466 |
| 21 | −4.5433115 | 4.2727 | 0.2222 | 2.86 | 152.777 |
3. Experimental
3.1. Data Set

3.2. Predicted Binding Sites and Docking Simulation of DDN
3.3. Pharmacophore Model and Molecular Alignment
3.4. 3D-QSAR Models
)and predictability (q2 or  ) among derived models was selected to test the utility of the model as a predictive tool. The prediction of the model between training sets (internal) and test sets (external) was calculated from according to equation (2):
 ) > 0.50, coefficient of determination ( ) > 0.60 [17] for the two statistical criteria was selected. To analyze the visualized structural distinctions of inhibitors, information from the best model was expressed in three dimensional space on contour maps (steve*coeff).
3.5. MTB Cell Wall Permeability Prediction
4. Conclusions
= 0.995, q2 = 0.681) and the predictive correlation coefficient ( = 0.611) for the test set determined. The Mtb cell wall permeability was predicted through Caco-2 cell permeability. The distribution coefficient ranges were 2.41 < logD < 2.89 for the Mtb cell wall permeability. A combined docking, pharmacophore searching and 3D-QSAR study can thus effectively direct drug molecular design.Acknowledgments
Conflicts of Interest
References
- Ducati, R.G.; Ruffino-Netto, A.; Basso, L.A.; Santos, D.S. The resumption of consumption-A review on tuberculosis. Mem. Inst. Oswaldo. Cruz. 2006, 101, 697–714. [Google Scholar]
- World Health Organization. Tuberculosis. Available online: http://www.who.int/mediacentre/factsheets/fs104/en/en/ (accessed on 20 August 2013).
- Andersen, P. Vaccine strategies against latent tuberculosis infection. Trends Microbiol. 2007, 15, 7–13. [Google Scholar]
- Barry, C.E.; Boshoff, H.I.; Dowd, C.S. Prospects for clinical introduction of nitroimidazole antibiotics for the treatment of tuberculosis. Curr. Pharm. Design 2004, 10, 3239–3262. [Google Scholar] [CrossRef]
- ClinicalTrials.gov. Available online: http://clinicaltrials.gov/ct2/show/NCT00567840 (accessed on 8 August 2013).
- Manjunatha, U.H.; Boshoff, H.; Dowd, C.S.; Zhang, L.; Albert, T.J.; Norton, J.E.; Daniels, L.; Dick, T.; Pang, S.S.; Barry, C.E., 3rd. Identification of a nitroimidazo-oxazine-specific protein involved in PA-824 resistance in Mycobacterium tuberculosis. Proc. Natl. Acad. Sci. USA 2006, 103, 431–436. [Google Scholar] [CrossRef]
- Ghader, B.; Squire, C.J; Edward, N.B.; Nicole, J.M. Expression, purification and crystallization of native and selenomethionine labeled Mycobacterium tuberculosis FGD1 (Rv0407) using a Mycobacterium smegmatis expression system. Protein Express. Purif. 2007, 54, 38–44. [Google Scholar] [CrossRef]
- Stover, C.K.; Warrener, P.; VanDevanter, D.R.; Sherman, D.R.; Arain, T.M.; Langhorne, M.H.; Anderson, S.W.; Towell, J.A.; Yuan, Y.; McMurray, D.N.; et al. A small-molecule nitroimidazopyran drug candidate for the treatment of tuberculosis. Nature 2000, 405, 962–966. [Google Scholar] [CrossRef]
- Choi, K.P.; Bair, T.B.; Bae, Y.M.; Daniels, L. Use of transposon Tn5367 mutagenesis and a nitroimidazopyran-based selection system to demonstrate a requirement for fbiA and fbiB in coenzyme F(420) biosynthesis by Mycobacterium bovis BCG. J. Bacteriol. 2001, 183, 7058–7066. [Google Scholar] [CrossRef]
- Choi, K.P.; Kendrick, N.; Daniels, L. Demonstration that fbiC is required by Mycobacterium bovis BCG for coenzyme F(420) and FO biosynthesis. J. Bacteriol. 2002, 184, 2420–2428. [Google Scholar] [CrossRef]
- Leder, L.; Freuler, F.; Forstner, M.; Mayr, L.M. New methods for efficient protein production in drug discovery. Curr. Opin. Drug Discov. Devel. 2007, 10, 193–202. [Google Scholar]
- Manjunatha, U.; Boshoff, H.I.; Barry, C.E. The mechanism of action of PA-824: Novel insights from transcriptional profiling. Commun. Integr. Biol. 2009, 2, 215–218. [Google Scholar]
- Kmentova, I.; Sutherland, H.S.; Palmer, B.D.; Blaser, A.; Franzblau, S.G.; Wan, B.; Wang, Y.; Ma, Z.; Denny, W.A.; Thompson, A.M. Synthesis and structure-activity relationships of aza- and diazabiphenyl analogues of the antitubercular drug (6S)-2-nitro-6-{[4-(trifluorometho-xy)benzyl]oxy}-6,7-dihydro-5H-imidazo[2,1-b][1,3]oxazine (PA-824). J. Med. Chem. 2010, 53, 8421–8439. [Google Scholar] [CrossRef]
- Nagarajan, K.; Shankar, R.G.; Rajappa, S.; Shenoy, S.J.; Costa-Pereira, R. Nitroimidazoles XXI 2,3-dihydro-6-nitroimidazo [2,1-b] oxazoles with antitubercular activity. Eur. J. Med. Chem. 1989, 24, 631–633. [Google Scholar] [CrossRef]
- Singh, R.; Manjunatha, U.; Boshoff, H.I.; Ha, Y.H.; Niyomrattanakit, P.; Ledwidge, R.; Dowd, C.S.; Lee, I.Y.; Kim, P.; Zhang, L.; et al. PA-824 Kills nonreplicating Mycobacterium tuberculosis by Intracellular NO Release. Science 2008, 322, 1392–1395. [Google Scholar] [CrossRef]
- Kim, R.; Skolnick, J. Assessment of programs for ligand binding affinity prediction. J. Comput. Chem. 2008, 29, 1316–1331. [Google Scholar] [CrossRef]
- Tropsha, A.; Golbraikh, A. Predictive QSAR modeling workflow, Model applicability domains, And virtual screening. Curr. Pharm. Design 2007, 13, 3494–3504. [Google Scholar] [CrossRef]
- Stenberg, P.; Luthman, K.; Artursson, P. Virtual Screening of Intestinal Drug Per- meability. J. Control. Release 2000, 65, 231–243. [Google Scholar] [CrossRef]
- Egan, W.J.; Lauri, G. Prediction of Intestinal Permeability. Adv. Drug Deliv. Rev. 2002, 54, 273–289. [Google Scholar] [CrossRef]
- Walter, A.; Gutknecht, J. Permeability of small nonelectrolytes through lipid bilayer membranes. J. Membr. Biol. 1986, 90, 207–217. [Google Scholar] [CrossRef]
- Espinoza, M.M.; Njuguna, N.M.; Mugumbate, G.; Caballero, J.; Chibale, K. In silico comparison of antimycobacterial natural products with known antituberculosis drugs. J. Chem. Inf. Model. 2013, 53, 649–660. [Google Scholar] [CrossRef]
- Lee, S.H.; Kim, S.Y.; Lee, M.H.; Lee, Y.S.; Cho, S.N.; Oh, T.; Kim, P. Synthesis and antitubercular activity of monocyclic nitroimidazoles: Insights from econazole. Bioorg. Med. Chem. Lett. 2011, 21, 1515–1518. [Google Scholar]
- Cellitti, S.E.; Shaffer, J.; Jones, D.H.; Mukherjee, T.; Gurumurthy, M.; Bursulaya, B.; Boshoff, H.I.; Choi, I.; Nayyar, A.; Lee, Y.S.; et al. Structure of ddn, the deazaflavin-dependent nitroreductase from mycobacterium tuberculosis involved in bioreductive activation of PA-824. Structure 2012, 11, 101–120. [Google Scholar]
- SYBYL-X, version 2.0. Tripos Associates: St. Louis, MO, USA, 2012.
- Fraaije, M.W.; Mattevi, A. Flavoenzymes: Diverse catalysts with recurrent features. Trends Biochem. Sci. 2000, 25, 126–132. [Google Scholar] [CrossRef]
- Morris, G.M.; Goodsell, D.S.; Halliday, R.S.; Huey, R.; Hart, W.E.; Belew, R.K.; Olson, A.J. Automated docking using a Lamarckian genetic algorithm and an empirical binding free energy function. J. Comput. Chem. 1998, 19, 1639–1662. [Google Scholar] [CrossRef]
- Clark, M.; Cramer, R.D.; Opdenbosch, N.V. Validation of the general purpose tripos 5.2 force field. J. Comput. Chem. 1989, 10, 982–1012. [Google Scholar] [CrossRef]
- Cramer, R.D.; Patterson, D.E.; Bunce, J.D. Comparative molecular field analysis (CoMFA). 1. Effect of shape on binding of steroids to carrier proteins. J. Am. Chem. Soc. 1998, 18, 5959–5967. [Google Scholar]
- Shao, J. Linear model selection by cross-validation. J. Am. Stat. Assoc. 1993, 88, 486–494. [Google Scholar] [CrossRef]
- Cruciani, G.; Baroni, M.; Clementi, S.; Costantino, G.; Riganelli, D.; Skagerberg, B. Predictive ability of regression models. Part I: Standard deviation of prediction errors (SDEP). J. Chemom. 1992, 6, 335–346. [Google Scholar] [CrossRef]
- ACDLab, version 6.0; Advanced Chemistry Development, Inc: Toronto, ON, Canada, 2002.
- Tetko, I.V. Computing chemistry on the web. Drug Discov. Today 2005, 10, 1497–1500. [Google Scholar] [CrossRef]
- Wegner, J.K. An open source chemoinformatics library for data mining and graph mining on molecular structures. eCheminfo 2004. 8-19 November. Available online: http://www.ra.cs.uni-tuebingen.de/software/joelib/introduction.html (accessed on 7 July 2013).
- Hou, T.J.; Zhang, W.; Xia, K.; Qiao, X.B.; Xu, X.J. ADME evaluation in drug discovery. 5. correlation of caco-2 permeation with simple molecular properties. J. Chem. Inform. Comput. Sci. 2004, 44, 1585–1600. [Google Scholar]
- ADMET/T prediction models and database. Available online: http://modem.ucsd.edu/adme/databases/databases_extend.htm (accessed on 10 July 2013).
- Sample Availability: Samples of the generated models are available from the authors.
© 2013 by the authors; licensee MDPI, Basel, Switzerland. This article is an open access article distributed under the terms and conditions of the Creative Commons Attribution license (http://creativecommons.org/licenses/by/3.0/).
Share and Cite
Lee, S.-H.; Choi, M.; Kim, P.; Myung, P.K. 3D-QSAR and Cell Wall Permeability of Antitubercular Nitroimidazoles against Mycobacterium tuberculosis. Molecules 2013, 18, 13870-13885. https://doi.org/10.3390/molecules181113870
Lee S-H, Choi M, Kim P, Myung PK. 3D-QSAR and Cell Wall Permeability of Antitubercular Nitroimidazoles against Mycobacterium tuberculosis. Molecules. 2013; 18(11):13870-13885. https://doi.org/10.3390/molecules181113870
Chicago/Turabian StyleLee, Sang-Ho, Minsung Choi, Pilho Kim, and Pyung Keun Myung. 2013. "3D-QSAR and Cell Wall Permeability of Antitubercular Nitroimidazoles against Mycobacterium tuberculosis" Molecules 18, no. 11: 13870-13885. https://doi.org/10.3390/molecules181113870
APA StyleLee, S.-H., Choi, M., Kim, P., & Myung, P. K. (2013). 3D-QSAR and Cell Wall Permeability of Antitubercular Nitroimidazoles against Mycobacterium tuberculosis. Molecules, 18(11), 13870-13885. https://doi.org/10.3390/molecules181113870