2.1. DBDCT Reduced the Liver Weight Ratio, Decreased Microsomal Protein and CYP450 Content in Rat Liver
Male SD rats were treated with 1.25, 2.5 and 5.0 mg/kg DBDCT i.p. once daily for 2 days after being induced of CYP3A with DEX (100 mg/kg, i.p.) for 4 days. Blank control animals were treated with saline after DEX induction. Each value represented the mean ± SD for six animals.
Rat liver weight ratio and CYP450 content in the LPS group (5.0 mg/kg) were markedly decreased (
p < 0.01) compared with those in the control group, which demonstrated that our models were successfully established. The liver weight ratio was the relative value of liver weight compared with rat body weight. The body weight of rats treated with DBDCT did not change significantly (
p > 0.05), however, the rat liver weight ratio decreased significantly compared with that in the control group (
Table 1). Compared with the control group, the relative liver ratio of rats treated with DBDCT at doses of 1.25, 2.5 and 5.0 mg/kg decreased by 7.9% (
p > 0.05), 22.7% (
p < 0.001) and 20.8% (
p < 0.001), respectively. Liver microsomal protein concentration in the 2.5 and 5.0 mg/kg DBDCT-treated groups and CYP450 content were significantly reduced (
p < 0.01) compared with those in the control group (
Table 1).
Table 1.
The influence of DBDCT on rats liver.
Table 1.
The influence of DBDCT on rats liver.
| Parameters | Control | LPS group | DBDCT (mg/kg) |
|---|
| 1.25 (L) | 2.50 (M) | 5.0 (H) |
|---|
| Rat weight (g) | 210 ± 14 | 200 ± 6 | 207 ± 9 | 203 ± 12 | 208 ± 15 |
| Liver weight ratio (g/g)% | 6.31 ± 0.46 | 4.97 ± 0.34 ** | 5.80 ± 0.40 | 4.88 ± 0.53 ** | 4.99 ± 0.32 * |
| Protein (mg·g−1liver) | 16.40 ± 2.74 | 14.02 ± 3.16 | 17.06 ± 2.27 | 11.02 ± 1.82 ** | 11.63 ± 1.39 ** |
| CYP450 (nmol·mL−1) | 1.12 ± 0.11 | 0.52 ± 0.11 ** | 0.66 ± 0.08 ** | 0.56 ± 0.07 ** | 0.53 ± 0.05 ** |
2.3. DBDCT Reduced Liver Microsomal Proteins and mRNA Expression of CYP 3A1/2 in Rats
Immunoblotting studies were conducted to investigate the effects of DBDCT on CYP3A1 and CYP3A2 protein level in rat liver microsomes. Liver microsomal proteins were subjected to gel electrophoresis and immunoblot analysis using antibodies against CYP3A1 and CYP3A2 (
Figure 2). The results of immunoblot analysis showed that the expression of CYP3A1 and CYP3A2 proteins in rat liver was markedly decreased (
p < 0.05) following treatment with DBDCT at different doses, the strongest inhibitory effect was demonstrated in the DBDCT 5.0 mg/kg dose group compared with the control group, which was consistent with CYP450 content. The CYP3A1 expression levels of microsomal proteins in rats treated with 1.25, 2.5 and 5.0 mg/kg DBDCT decreased by 13.7%, 30.4% (
p < 0.05) and 53.5% (
p < 0.001), respectively, while CYP3A2 expression decreased by 30.9% (
p < 0.05), 32.2% (
p < 0.05) and 54.4% (
p < 0.001), respectively.
Figure 2.
Repression effect of DBDCT on CYP3A1/2 protein expression in rat liver microsomes. (A) Immunoblots of CYP3A1/2 from rat liver microsomes. Microsomal proteins from blank controls and DBDCT-treated rats were subjected to protein blot analyses in which antibodies against CYP3A1/2 and β-actin were used to probe for immunorelated proteins as described in text; (B) Relative protein expression level of CYP3A1/2 in rat liver. The results were expressed as a ratio to the expression levels of the reference protein β-actin. Each value represents the mean ± SD for six animals; * p < 0.05, ** p < 0.01, compared with control group.
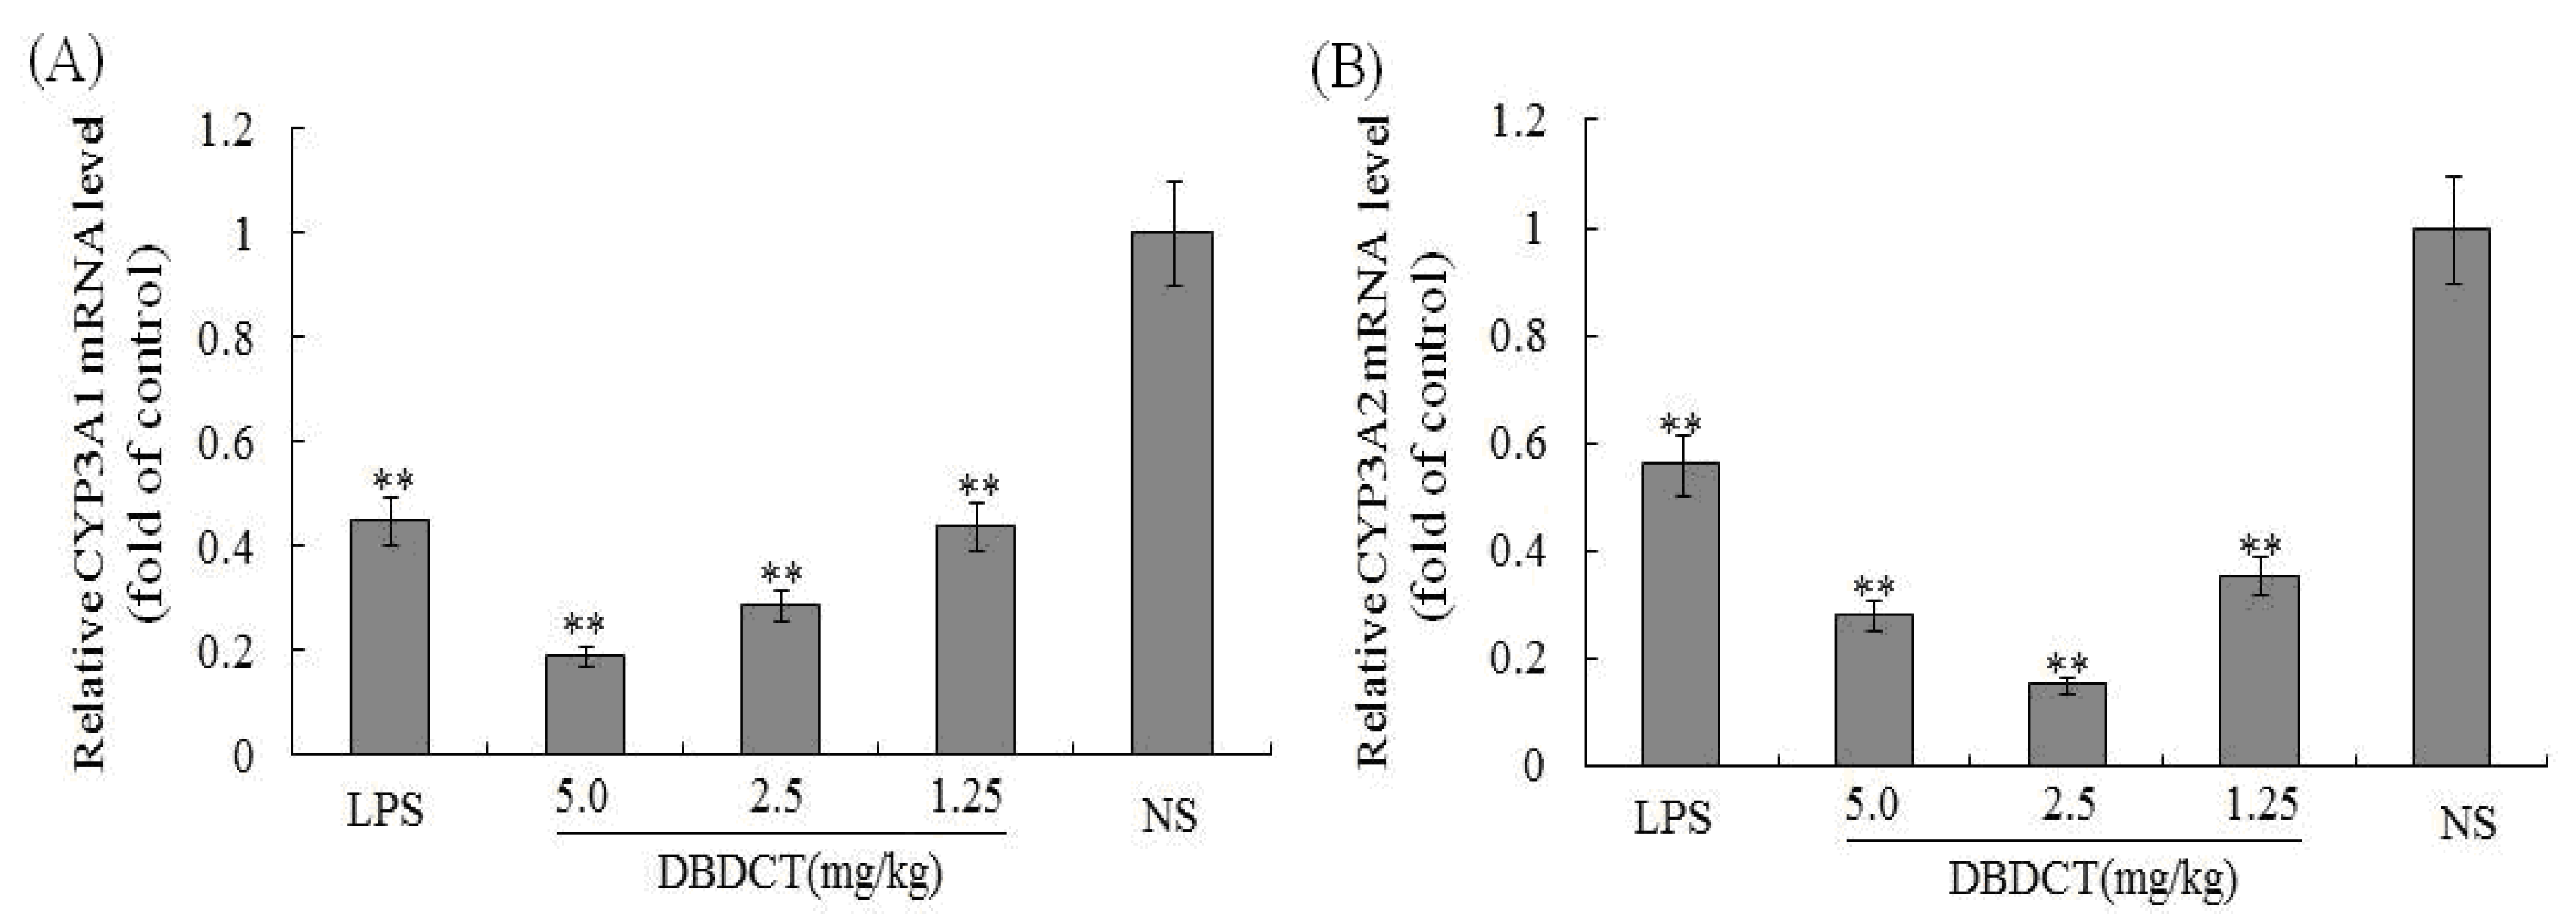
To determine whether the CYP3A1/2 mRNA levels in rat liver microsomes were decreased by DBDCT as the protein decreased, FQ-PCR was performed. As shown in
Figure 3, CYP3A1 in rats treated with LPS decreased by 45.1% (
p < 0.01) compared with that in the control group. CYP3A1 protein expression in rats treated with DBDCT was significantly reduced in a dose- and time-dependent manner. The expression of CYP3A2 in the LPS group was also significantly depressed by 56.3% (
p < 0.01). Although the CYP3A2 protein expression in rats treated with DBDCT in all three dose groups was low, this expression was not dose- or time-dependent. The 2.5 mg/kg group had a lower CYP3A2 expression level (decreased to 15.1%,
p < 0.01) than the 5.0 mg/kg DBDCT group (decreased to 28.3%,
p < 0.01) and the 1.25 mg/kg DBDCT group (decreased to 35.4%,
p< 0.01) compared to that in the control group. These results were in agreement with the protein concentration and CYP3A activity findings.
Figure 3.
Relative mRNA expression level of CYP3A1/2 in rat liver. (A) and (B), separately showed the relative mRNA expression level of CYP3A1/2 in rat liver. The results were expressed as a ratio to the mRNA levels of the reference gene GAPDH. Each value represents the mean ± SD for six animals; * p < 0.05; ** p < 0.01, compared with the control group.
2.4. Effects of DBDCT on Nuclear Proteins and mRNA Expression of PXR, CAR and RXR in Rat Liver
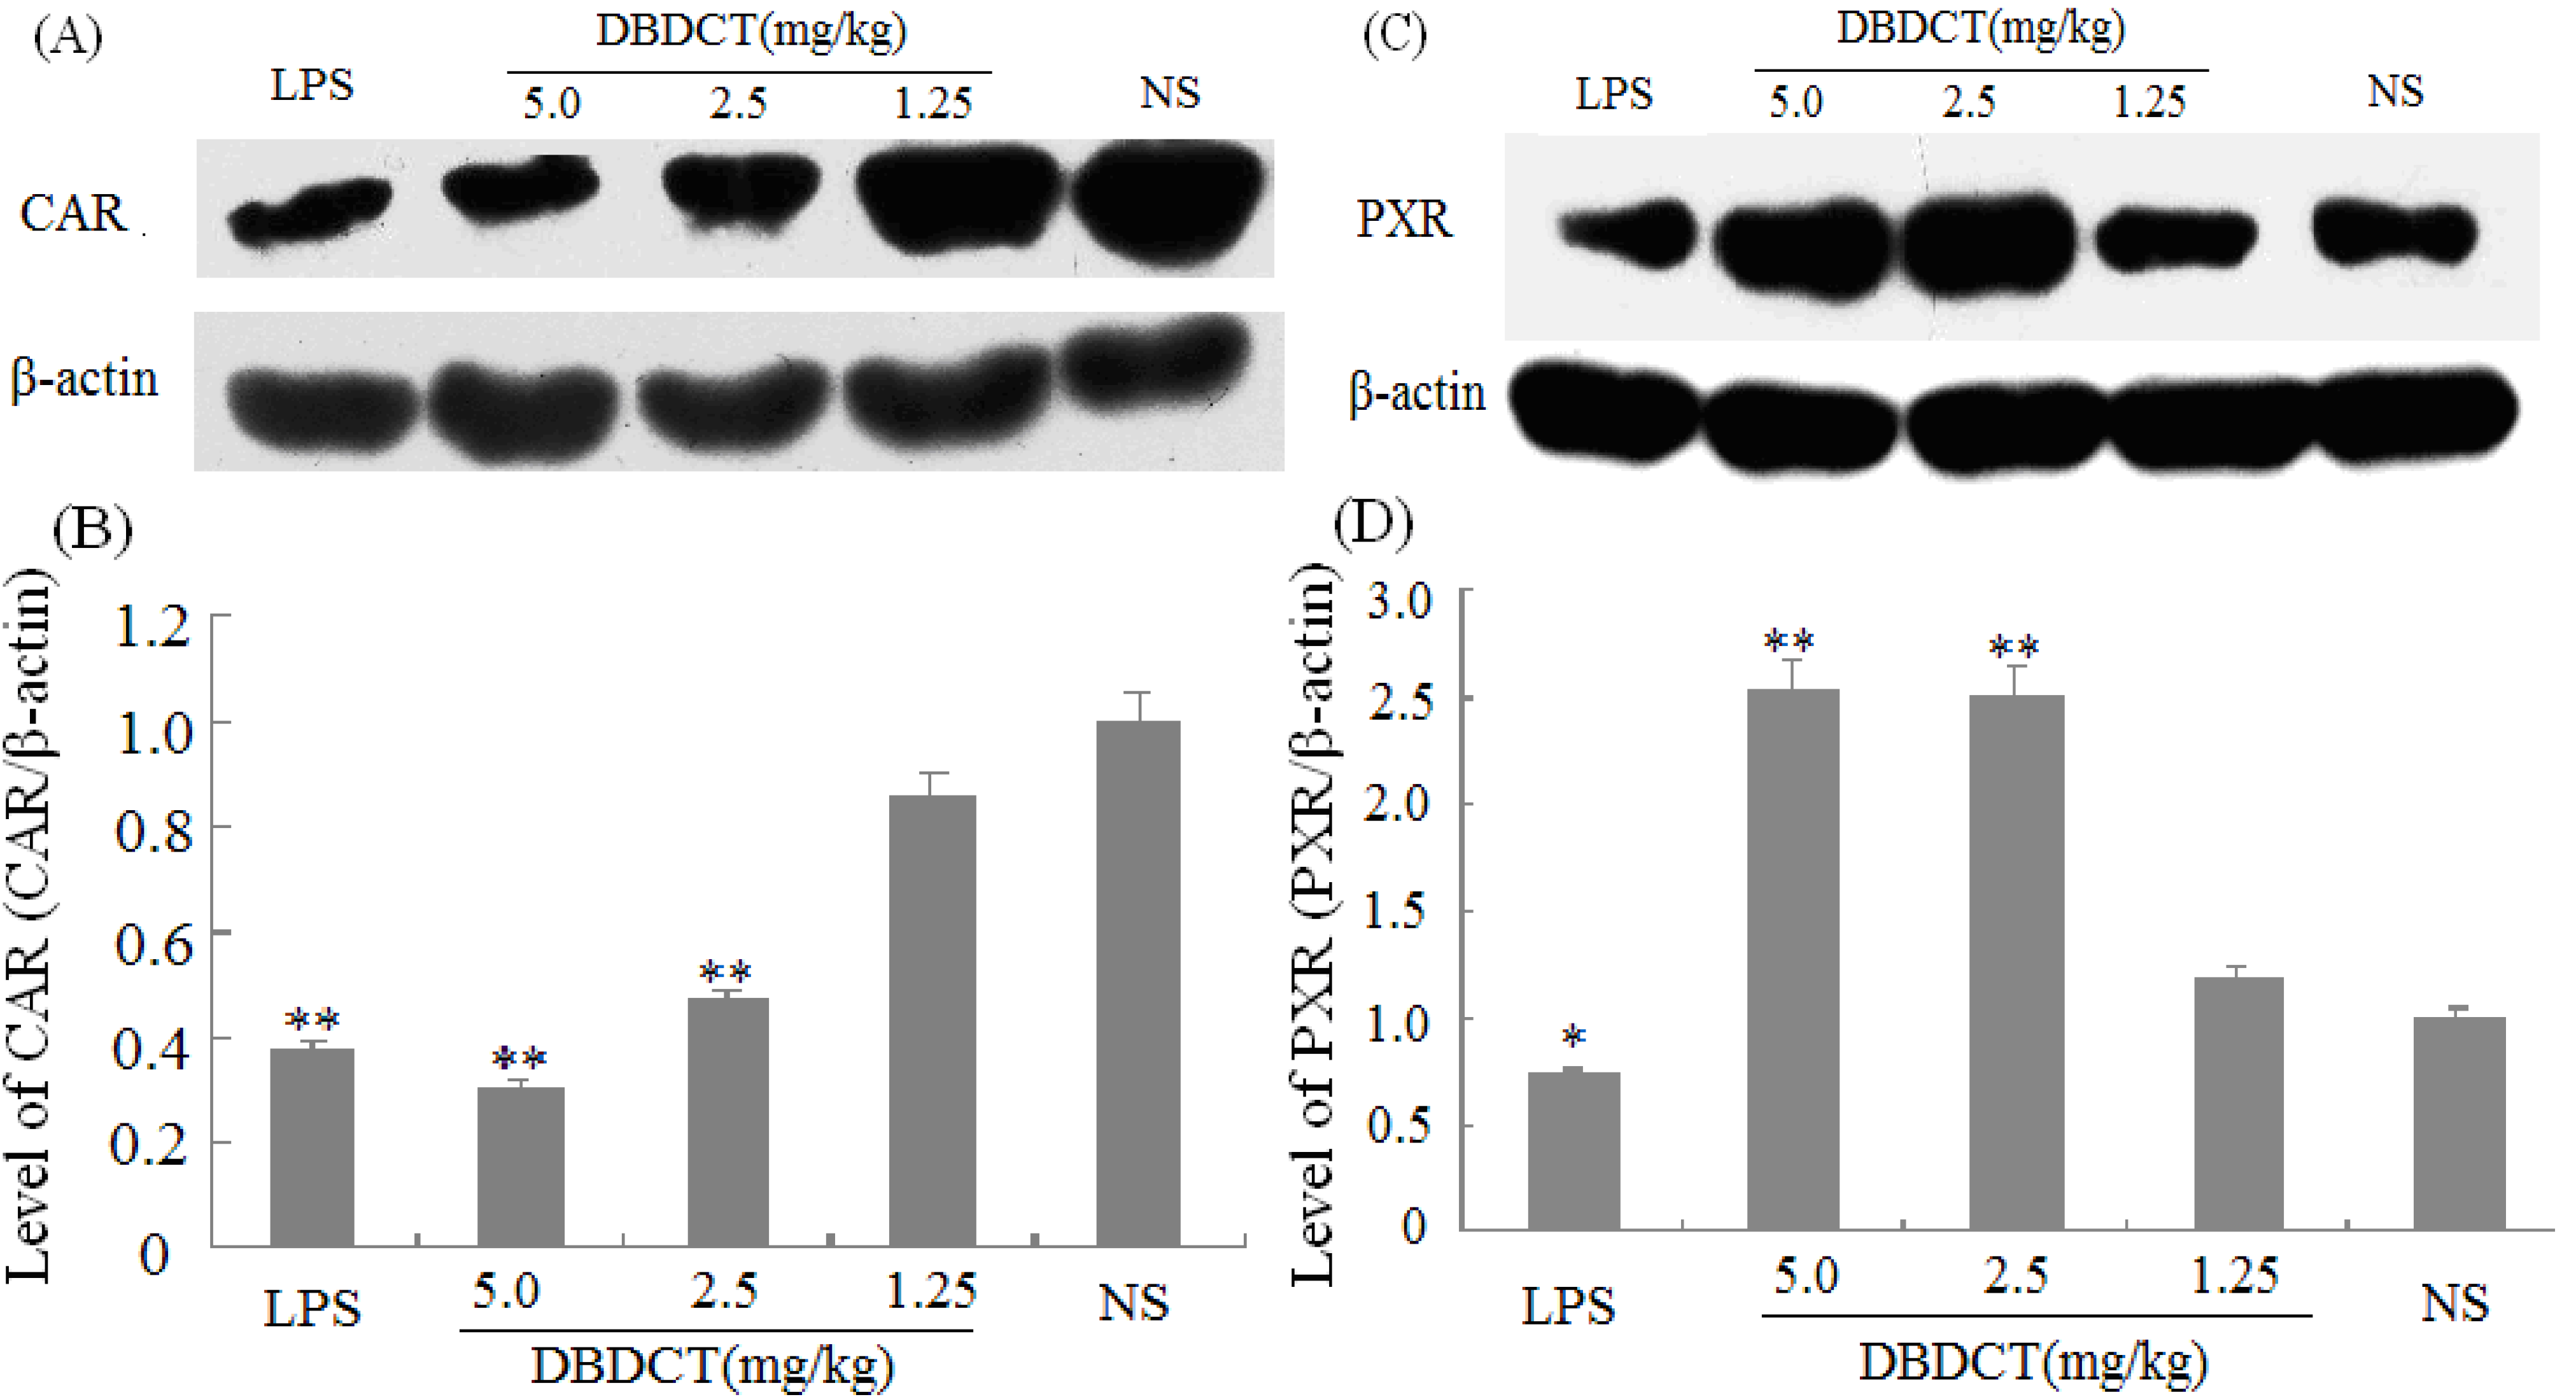
We evaluated the effects of DBDCT on the expression of nuclear receptors PXR, CAR, and RXR using immunoblot and FQ-PCR analysis. As shown in
Figure 4A,B, the nuclear protein expression level of CAR was markedly decreased (
p < 0.01) after treatment with DBDCT at the dose of 2.5 and 5.0 mg/kg. It can be seen from
Figure 4C,D that the PXR protein expression level was significantly increased (
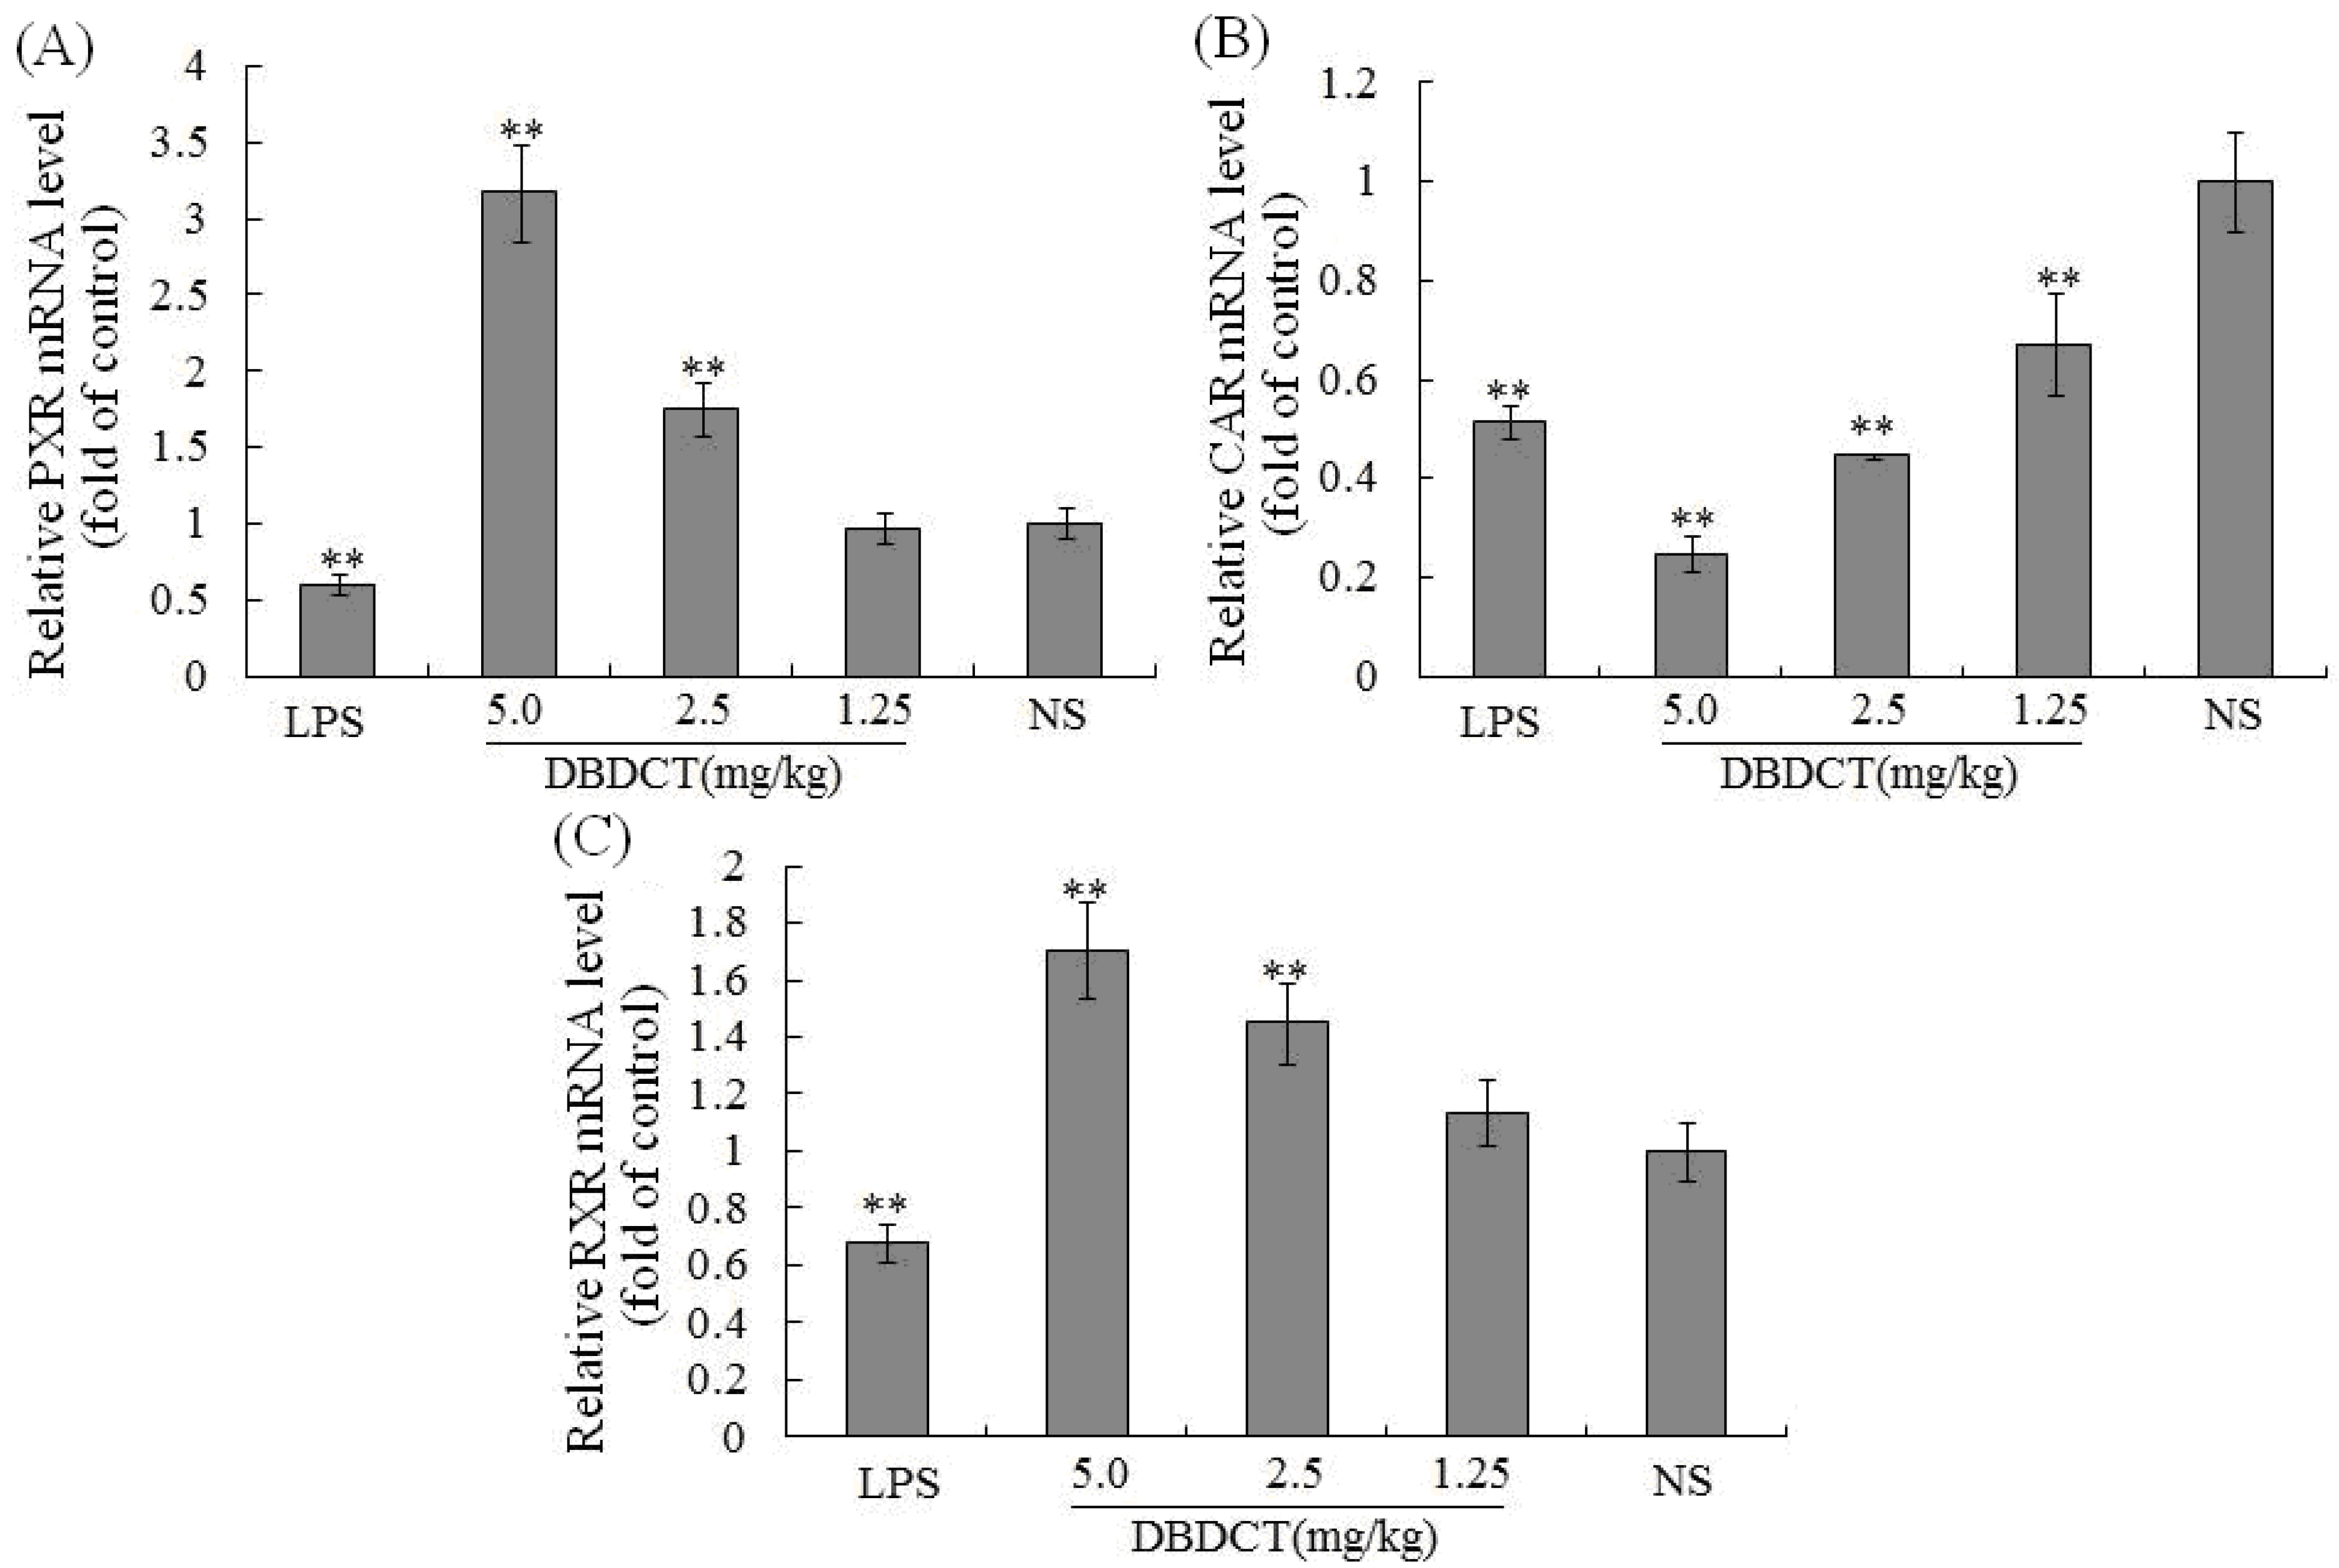
p < 0.05) in the DBDCT 2.5 mg/kg and 5.0 mg/kg groups compared with that in the control group, and significant up-regulation of PXR mRNA expression level was also detected (
Figure 5A) which increased to 175.0% (
p < 0.01) in the DBDCT 2.5 mg/kg group and to 317.7% in the 5.0 mg/kg group (
p < 0.01) compared with that in the control group. In addition, CAR mRNA level was reduced dose-dependently in the three groups (
Figure 5B). RXR mRNA level was also detected using FQ-PCR. These results (
Figure 5C) showed that the mRNA level of RXR decreased in rats treated with LPS (68.0%,
p < 0.01), and increased in DBDCT-treated rats at the dosage of 1.25 (113.7%,
p > 0.05), 2.5 (145.0%,
p < 0.01) and 5.0 (170.7%,
p < 0.01) mg/kg.
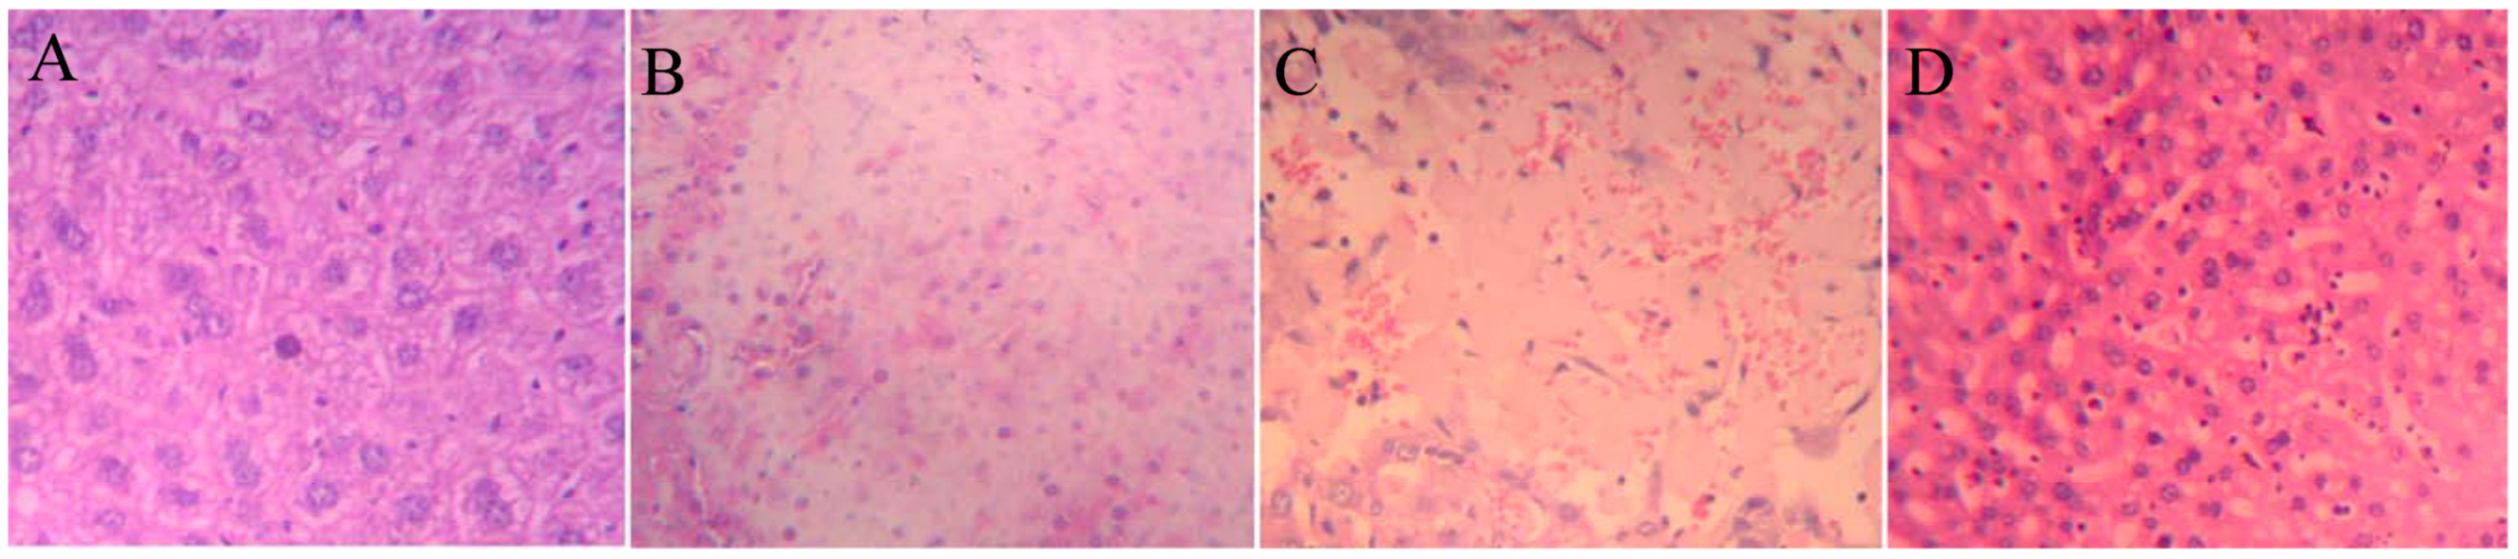
2.5. Histopathology
To verify the liver toxicity of DBDCT, histopathological examination of liver tissues was performed. Microscopic observations revealed a normal histology with regular morphology of the liver tissue and well-organized hepatic cells in the control group (
Figure 6Aacute necrosis (
Figure 6B, DBDCT 60 mg/kg), focal necrosis (
Figure 6C DBDCT 48 mg/kg D, DBDCT 48 mg/kg) of liver cells.
Figure 4.
Effect of DBDCT on nuclear receptor protein expression in rat liver. (A) Immunoblots of CAR from rat liver nuclear protein; (B) Relative protein expression level of CAR in rat liver; (C) Immunoblots of PXR from rat liver nuclear protein; (D) Relative protein expression level of PXR in rat liver. The relative protein expression levels were expressed as a ratio to the expression levels of the reference protein β-actin. Each value represents the mean ± SD for six animals; * p < 0.05; ** p < 0.01, compared with control group.
Figure 5.
Effect of DBDCT on nuclear receptor mRNA level in rat liver. (A), (B) and (C), separately showed the relative mRNA expression level of PXR, CAR and RXR in rat liver. The FQ-PCR data were calculated using the 2−ΔΔCt method normalized to the individual internal control (GAPDH) level. Each value represents the mean ± SD for six animals; * p < 0.05, ** p < 0.01, compared with control groups.
Figure 6.
Representative photomicrographs of the liver sections from DBDCT acute toxicity testing stained with hematoxylin and eosin (magnification 20×). (A) liver section of control group, a normal histology with regular morphology of the liver tissue and well-organized hepatic cells; (B) liver section of DBDCT 60 mg/kg group, acute necrosis of liver cells; (C) liver section of DBDCT 48 mg/kg group, focal necrosis of liver cells; (D) liver section of DBDCT 48 mg/kg group, Kupffer cells hyperplasia.
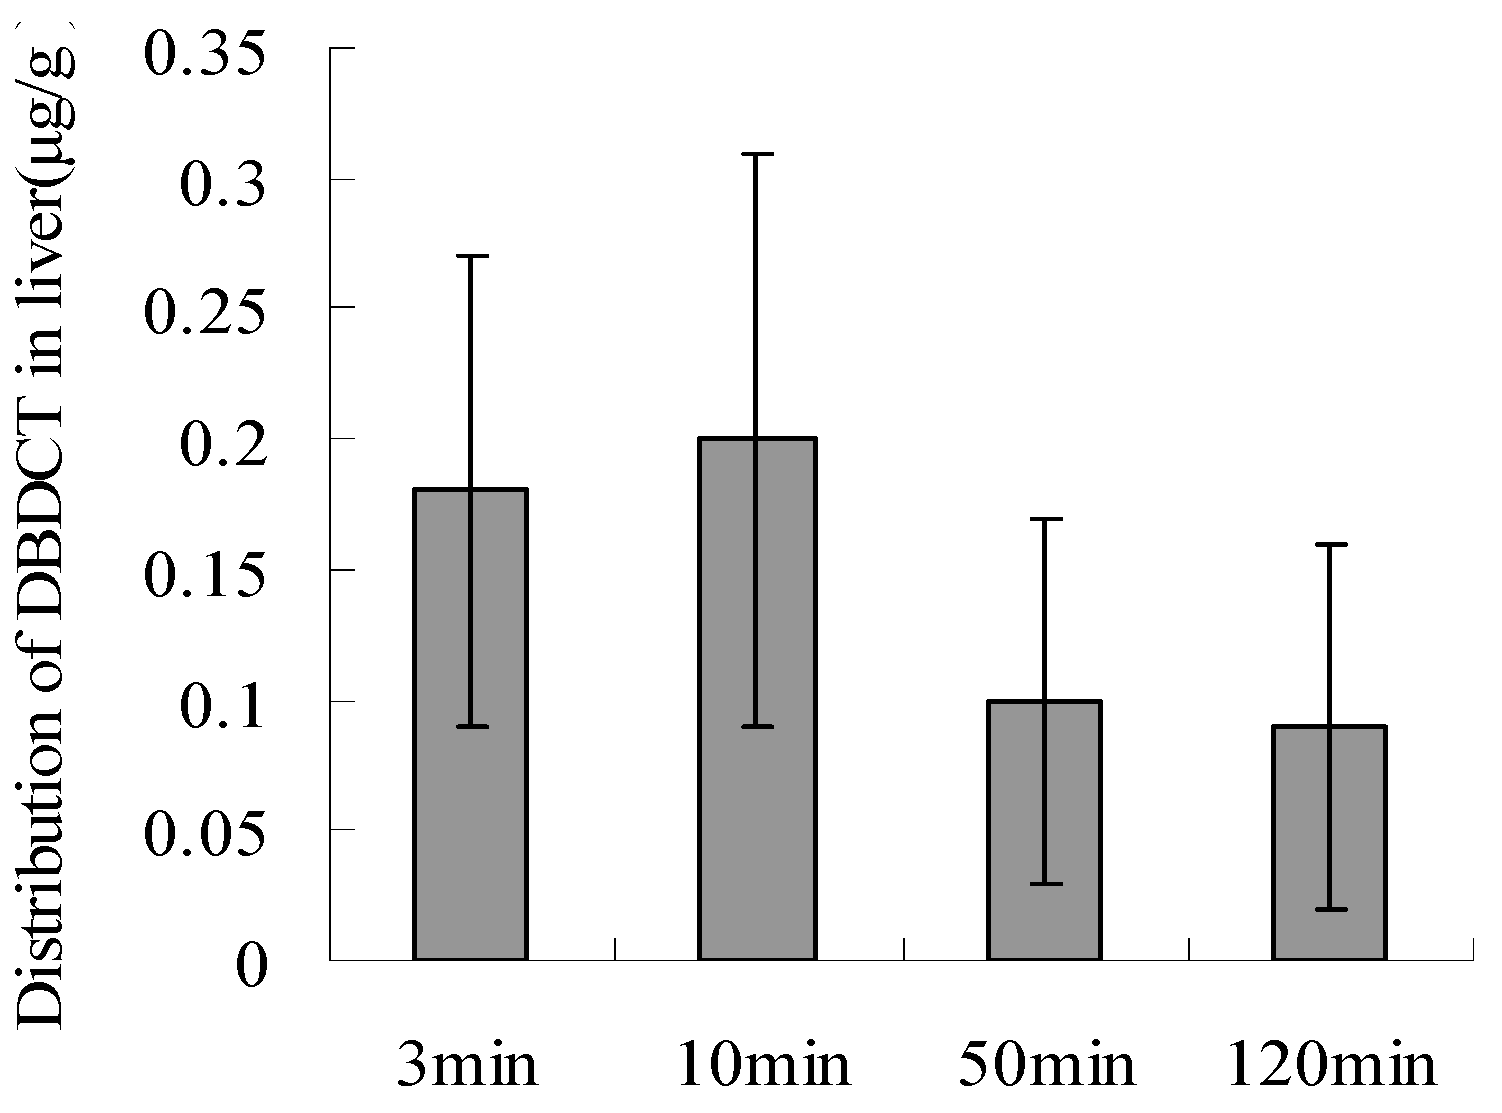
2.6. Biological Accumulation of DBDCT in Rat Liver
DBDCT (5 mg/kg) was administered by a single intravenous injection, and control rats received saline. Blood samples were collected at designated time intervals (3, 10, 50 and 120 min after injection of DBDCT), and rats were then sacrificed to collect organs. Plasma samples were obtained immediately from the blood samples by centrifugation at 4,000 × g for 10 min at 4 °C.
Approximately 50 min after injection, DBDCT was distributed in the main organs, and about 120 min later, DBDCT was detected in a few organs(data is not shown), especially in the liver. This demonstrated that DBDCT accumulated in rat liver (
Figure 7 and
Figure 8).
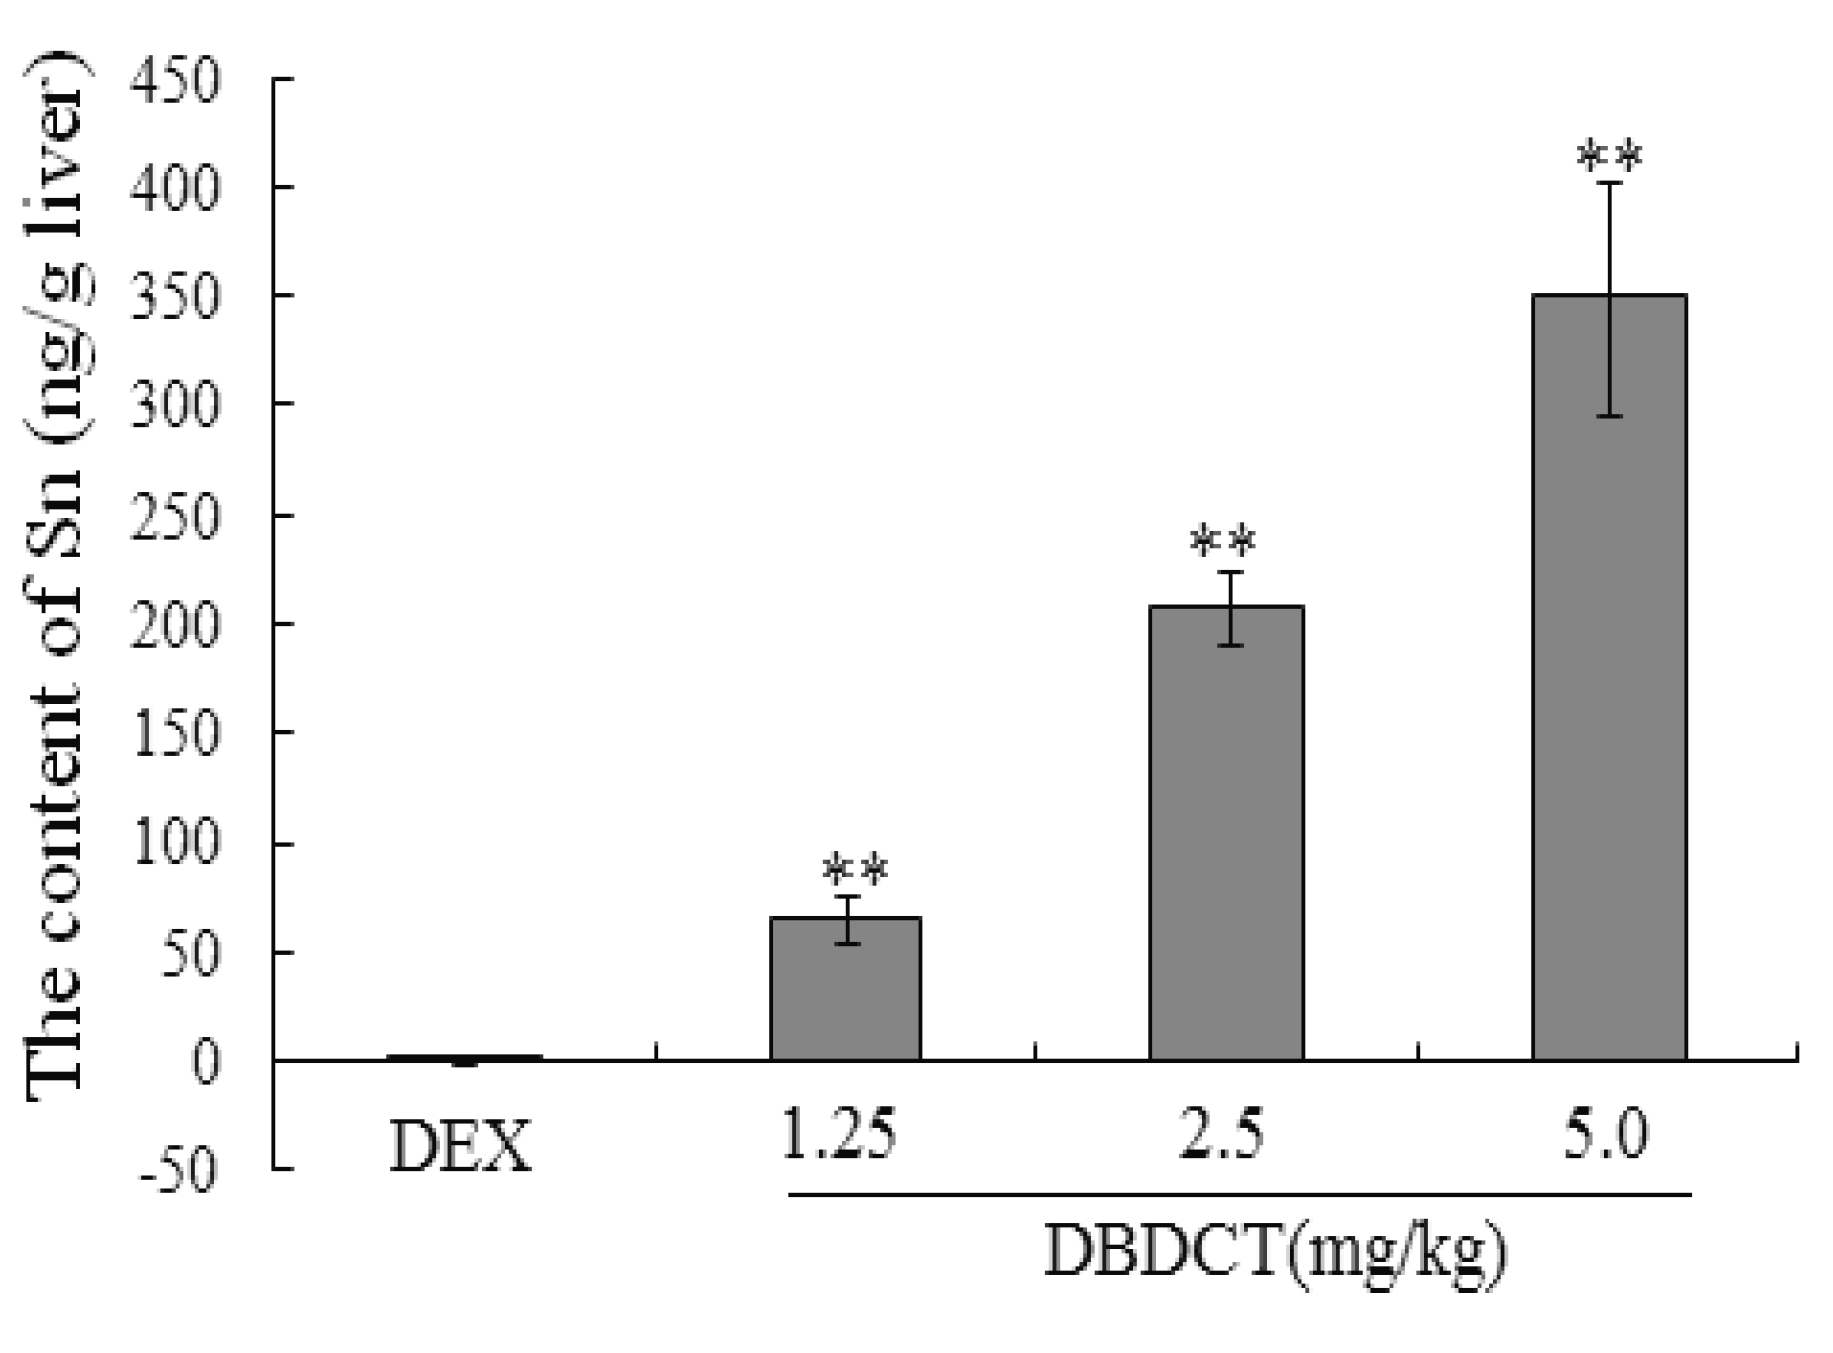
In order to determine whether biological accumulation of Sn occurred in rat liver to predict the probable mechanism of
in vivo DBDCT toxicity, atomic fluorescence spectrometry was used to detect Sn content in rat liver. As shown in
Figure 9, Sn in rat liver was accumulated in a dose-dependent manner.
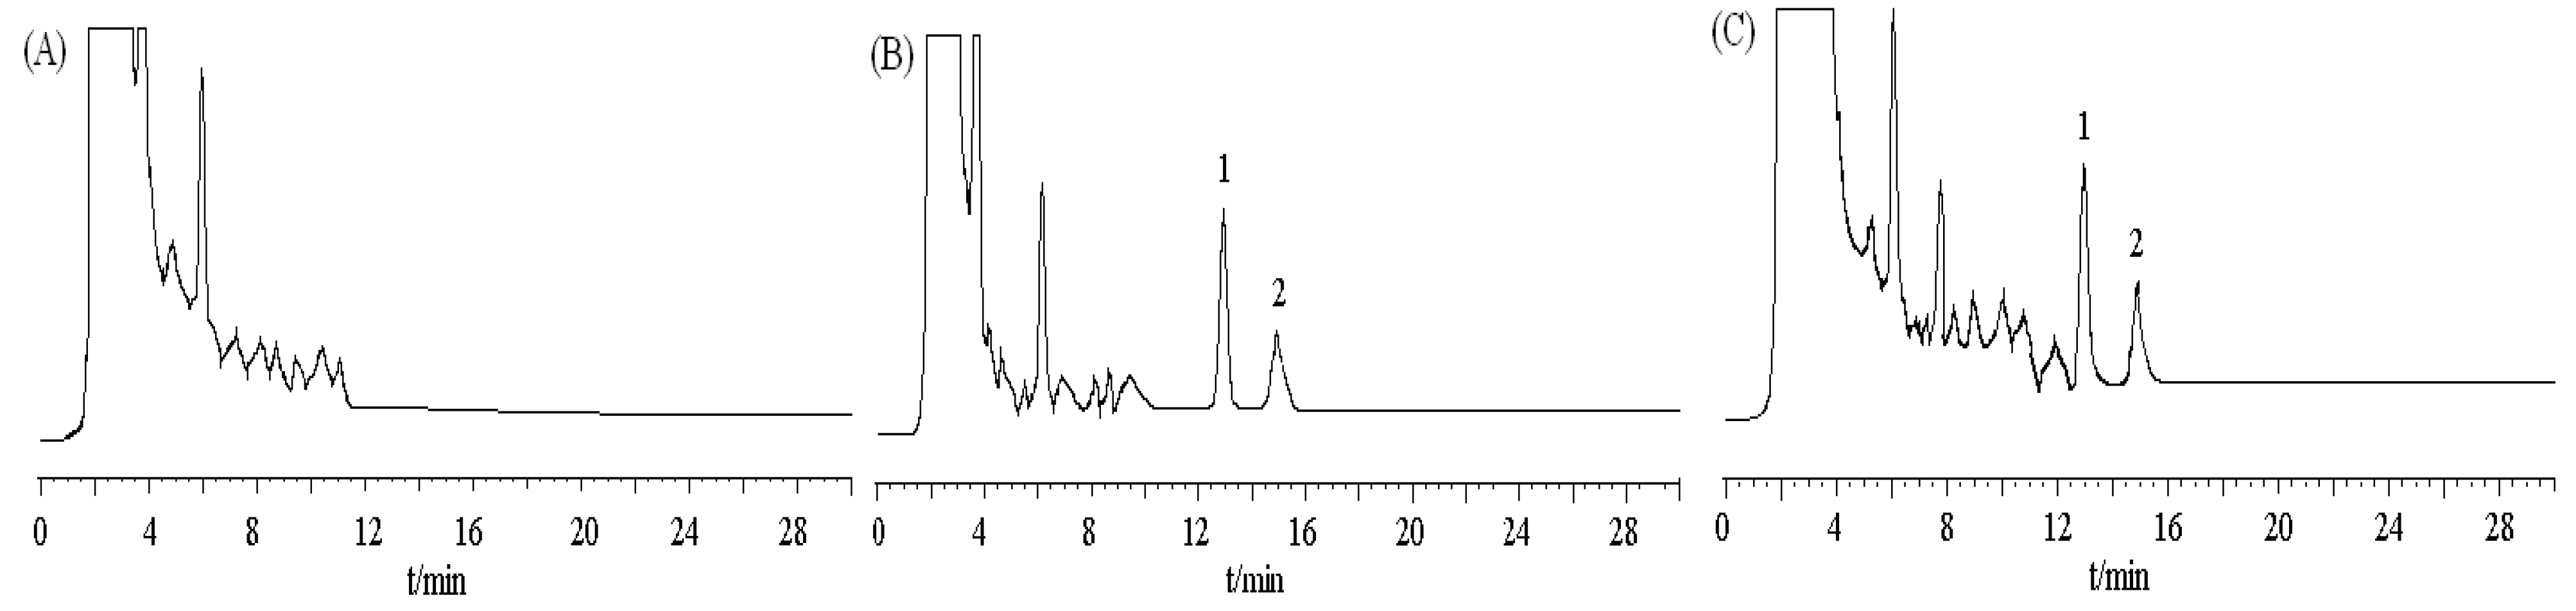
Figure 7.
Chromatograms of DBDCT and internal standard in rat liver. (A) blank tissue; (B) blank tissue spiked with DBDCT (0.6 μg/mL)and acetanilide (I.S., 2.5 μg/mL);
(C) 1iver tissue sample at 50 min after intravenous administration of DBDCT at a dose
5 mg/kg; peak 1 internal standard (acetanilide); peak 2 DBDCT.
Figure 8.
The biological accumulation of DBDCT in rat liver as detected by HPLC.
Figure 8.
The biological accumulation of DBDCT in rat liver as detected by HPLC.
Figure 9.
The biological accumulation of Sn in rat liver. Male SD rats were treated with 1.25, 2.5 and 5.0 mg/kg DBDCT once daily for 2 days after induction with 100 mg/kg DEX for 4 days. Blank control animals were treated with saline and the positive control animals with 5 mg/kg LPS after DEX induced. Each value presented the mean ± SD for six animals. About 0.5 mg rat liver was digested with 0.2 mL sulfuric acid and 2.0 mL nitric acid in glass tubes for one night at room temperature. On the second day, the tubes were heated to volatilize all the nitric acid until white smoke was generated. The solution left in the tubes was diluted to 10 mL for tested. Each value represents the mean ± SD for six animals; * p < 0.05; ** p < 0.01, compared with control group.
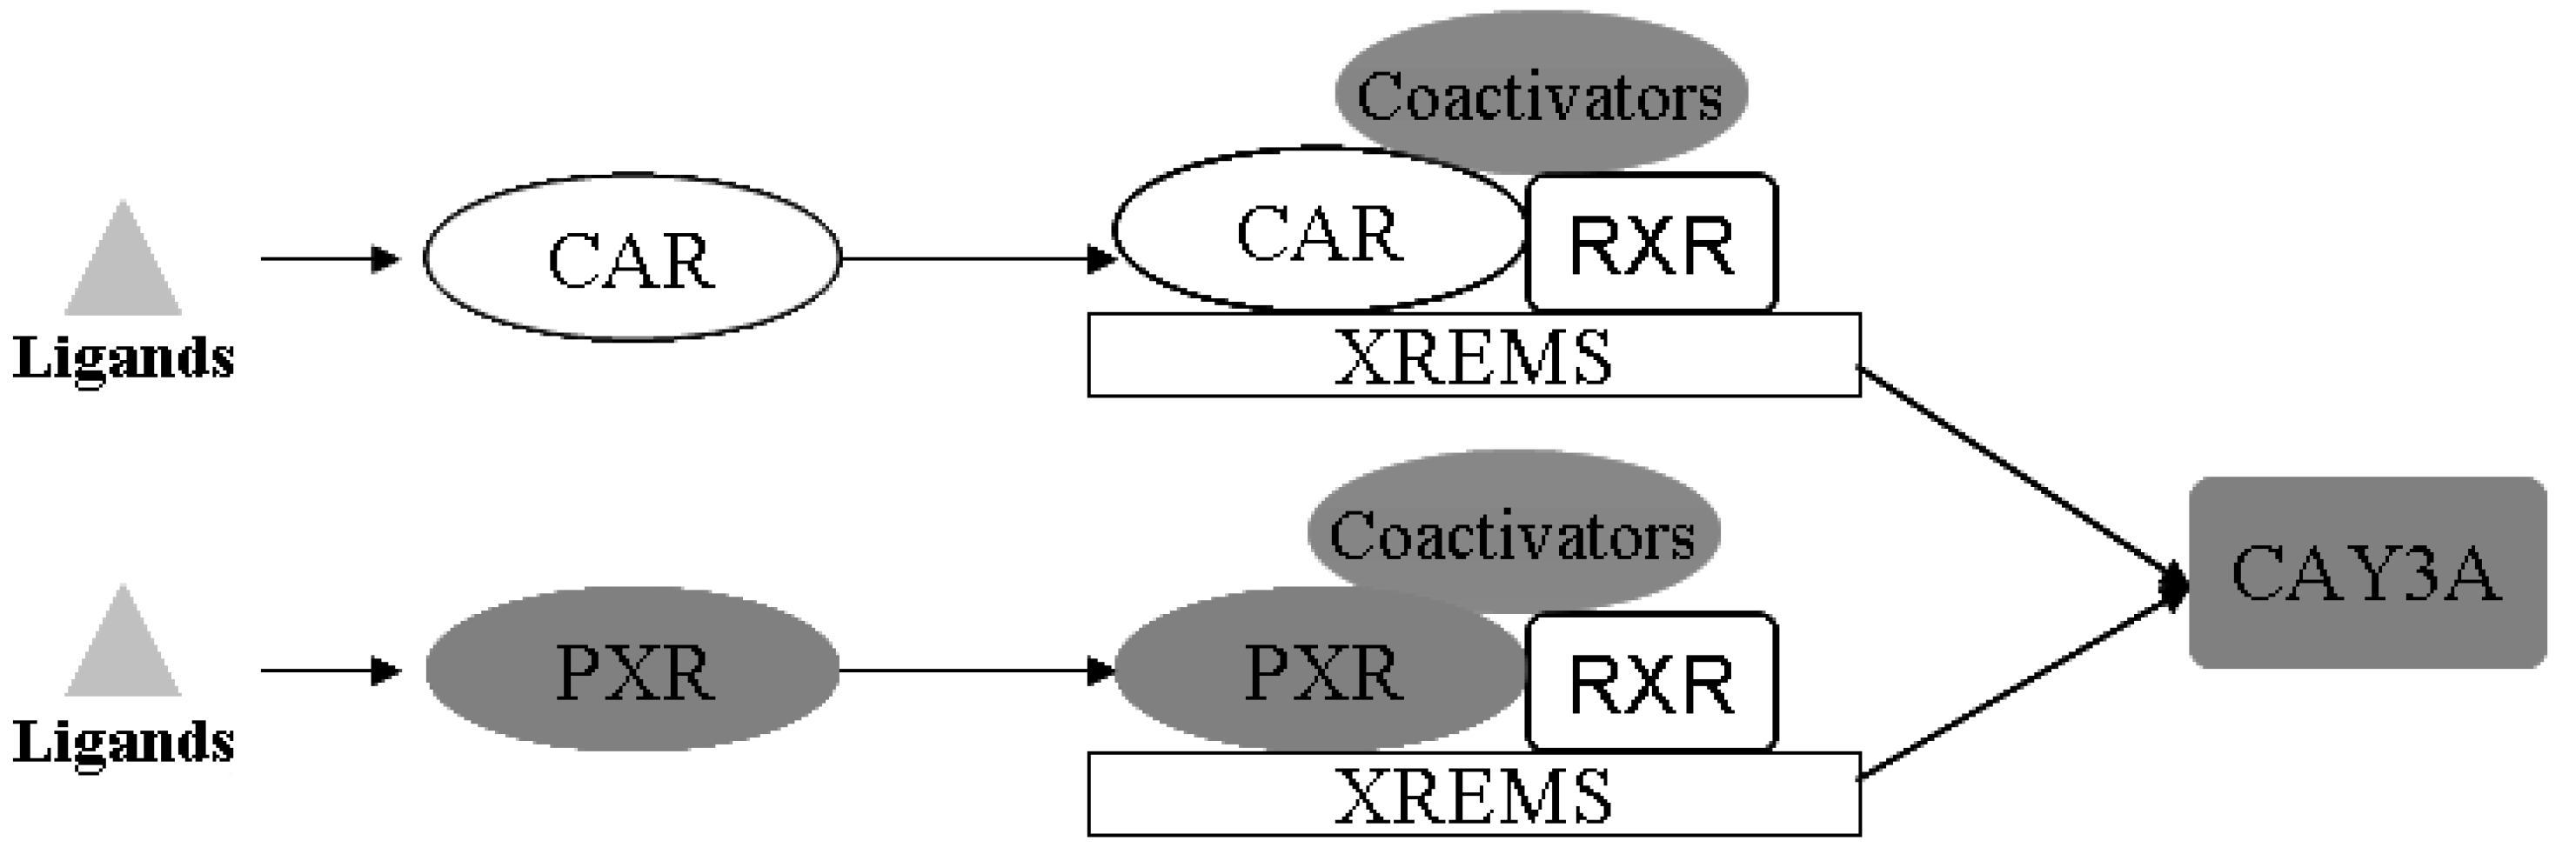
Drug-metabolizing enzymes (DMEs) play pivotal roles in the disposition and detoxification of numerous exogenous and endogenous chemicals. To accommodate chemical challenges, the expression of many DMEs is up-regulated by a group of ligand-activated transcription factors namely the nuclear receptors (NRs). The most important NRs in xenobiotic metabolism and clearance are the pregnane X receptor (PXR, NR1I2) and the constitutive androstane receptor (CAR, NR1I3) [
17]. These two receptors mediate the effects of xenobiotics and therapeutic drugs on the regulation of CYP3A [
18]. Sequence analysis showed that PXR and CAR are closely related to each other, and both require heterodimerization with RXR for high-affinity DNA binding [
19,
20], as shown in
Figure 10.
Figure 10.
Schematic illustration of the activation mechanisms and target genes of CAR and PXR. PXR and CAR can be activated by ligand binding. CAR and PXR shared target genes both through binding with RXR, and mediated the regulation of expression of CYP3A (modified from [
17]).
Figure 10.
Schematic illustration of the activation mechanisms and target genes of CAR and PXR. PXR and CAR can be activated by ligand binding. CAR and PXR shared target genes both through binding with RXR, and mediated the regulation of expression of CYP3A (modified from [
17]).
CYP3A is the most abundant CYP450 enzyme in the liver. It is a critical player in the metabolism of xenobiotics including the vast majority of clinically used drugs, environmental procarcinogens and toxins. Inhibition of CYP3A can decrease the metabolic rate of some prescribed drugs which are mainly metabolized by CYP3A, resulting in bioaccumulation and toxicity which are dangerous to human health.
In the acute toxicity tests, significant damage was observed in liver sections (
Figure 6). ROS generation, apoptosis and accumulation of DBDCT or Sn were probably the remote causes of this toxicity, and both ROS generation and apoptosis were confirmed (data not shown). The biological accumulation of DBDCT or Sn in the liver is usually caused by inhibition of DEMs, which is mainly mediated by PXR and CAR.
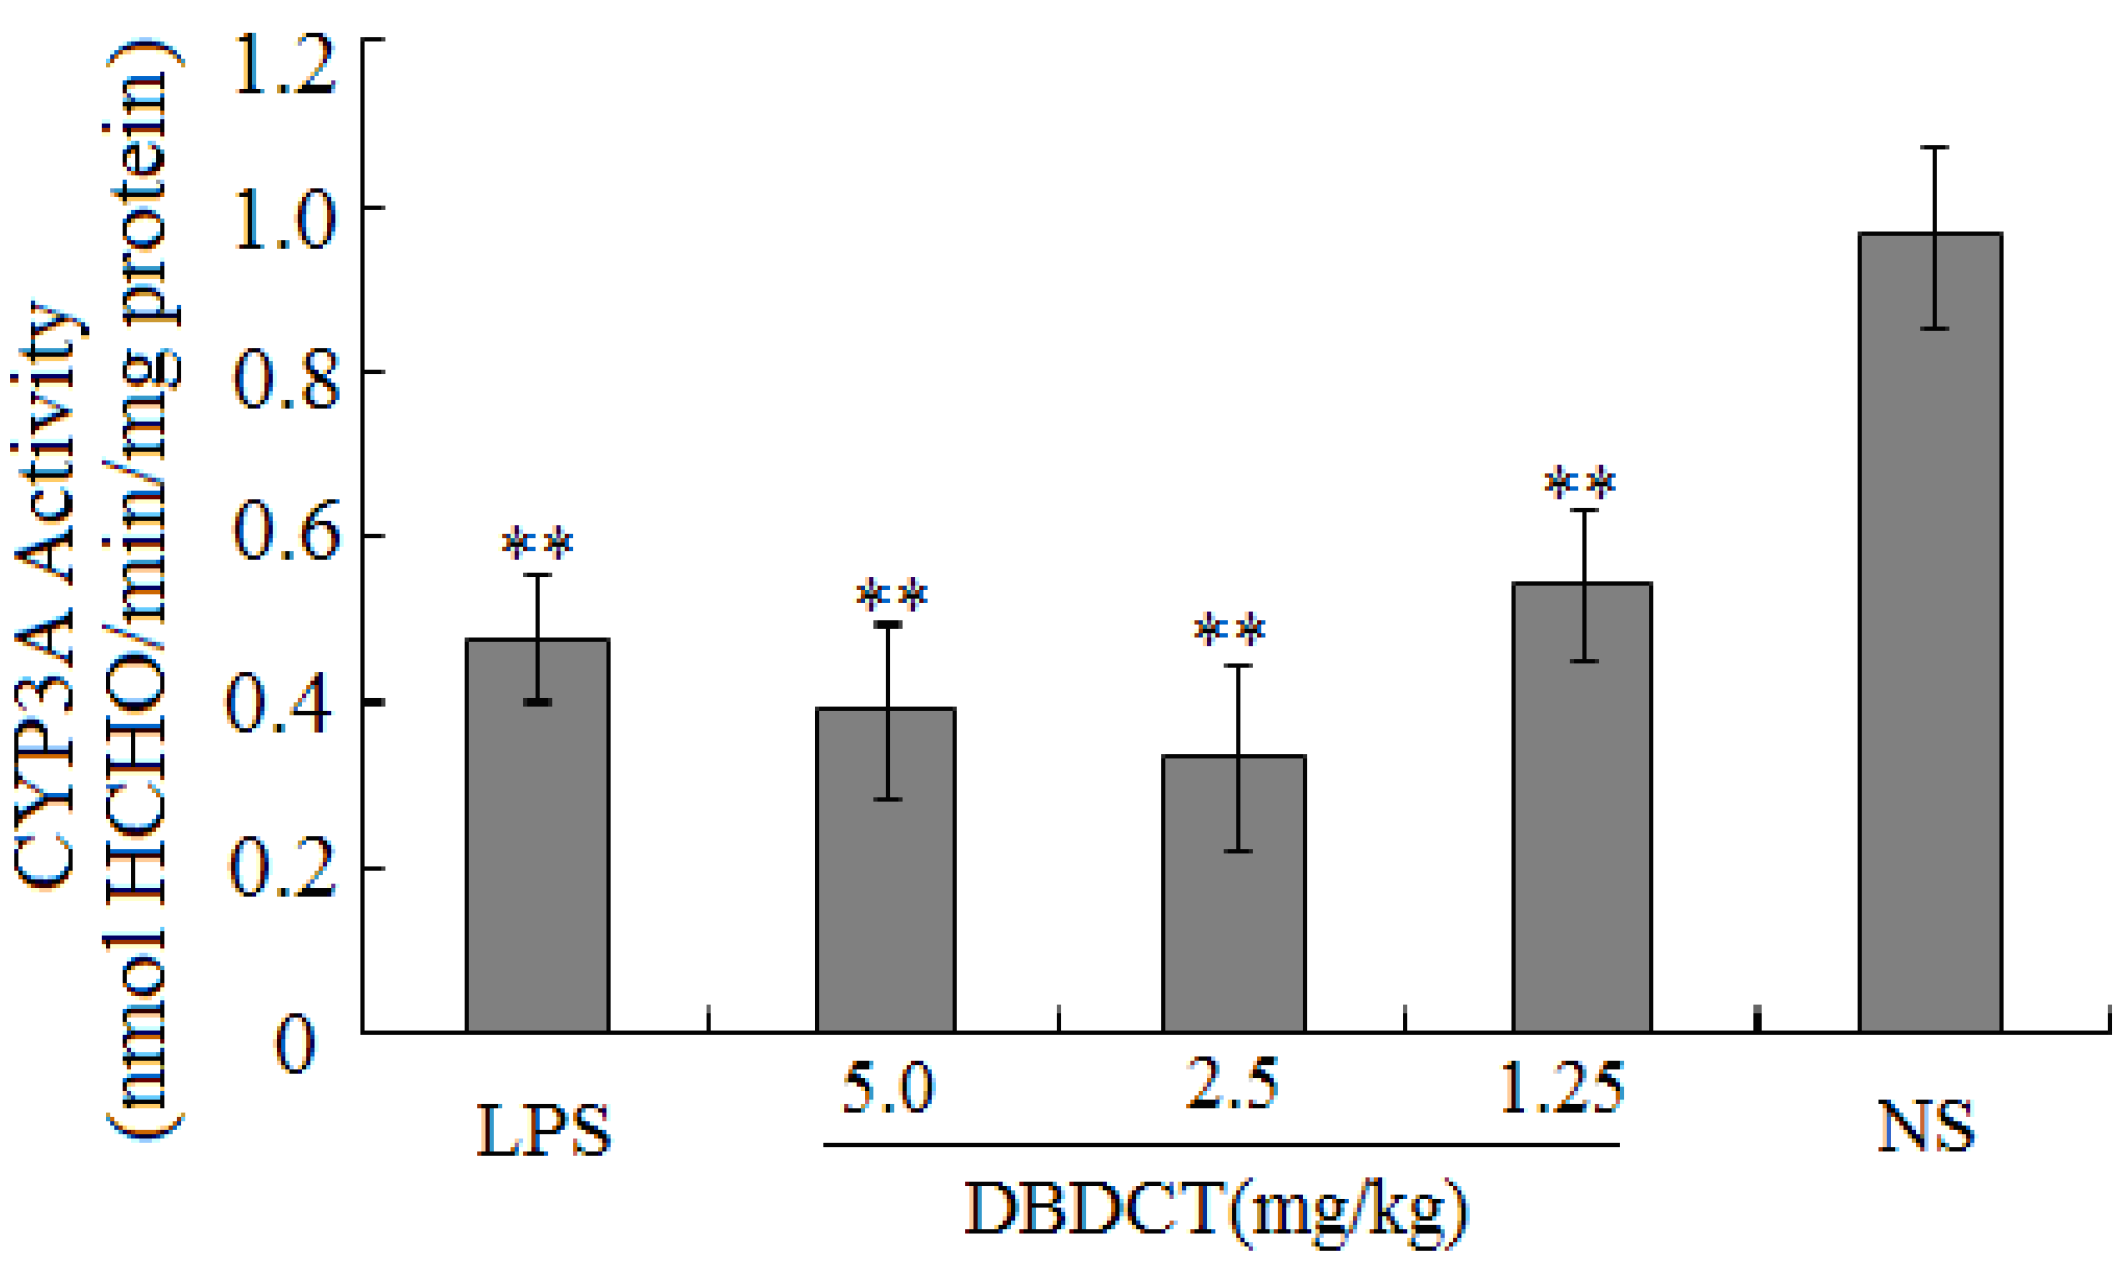
In this study, there were several important findings. First, the liver weight ratio, protein contents and CYP450 content in rat liver microsomes were assessed to determine whether CYP450 was decreased after treatment with DBDCT (
Table 1). CYP450 was found to be inhibited in rats treated with DBDCT. Second, the activity of CYP3A was determined and the results showed that the function of CYP3A was indeed inhibited (
Figure 1). Rats treated with 5.0 mg/kg DBDCT had higher CYP3A activity than those treated with 2.5 mg/kg DBDCT. This may have been due to the rat partially compensating for part of the function of CYP3A when CYP3A1/2 expression was significantly decreased. Third, protein and mRNA expression were assessed to evaluate their inhibition by DBDCT in rat liver (
Figure 2). The protein expression levels of CYP3A1/2 were reduced dose-dependently following exposure to DBDCT, and CYP3A1 mRNA level was also reduced (
Figure 3). Fourth, PXR and CAR protein and mRNA expression levels (
Figure 4 and
Figure 5) were tested to determine the variance in nuclear receptor expression. Some studies have suggested that the down-regulation of CYP450 by cytokines was due to the down-regulation of PXR and CAR [
21], while other studies argue that the down-regulation of P450 during inflammation does not require PXR based on the data from PXR knockout experiments in mice [
22]. In the present study, the results demonstrated that PXR increased (
p < 0.01), while CAR decreased (
p < 0.01) after DBDCT treatment. PXR and CAR both required heterodimerization with RXR. The increase (
p < 0.01) in RXR mRNA proved that PXR increased. It was predicted that CAR may be involved in the down-regulation of CYP3A1/2, however, it is unclear whether PXR participates in the down-regulation of PXR. Further work, such as reporter experiments, to explore the exact signaling pathway is underway. Furthermore, the accumulation of DBDCT and Sn in rat liver (
Figure 8 and
Figure 9) allowed us to identify possible toxic substances. The inhibition of DMEs always accompanies a broad range of drug-drug interactions, an alteration in therapeutic effect, biological accumulation and toxicity of many drugs [
23]. Sn accumulation in rat liver was significant, which may have been caused by the strong inhibitory effect of CYP3A following treatment with DBDCT. The expression of CYP3A1/2 at both protein and mRNA levels was inhibited by DBDCT, as well as CYP3A enzyme activity in rat liver. These results suggest that the down-regulation of CYP3A1/2 by DBCDCT in rat liver is probably mediated by CAR. The biological accumulation of Sn due to the inhibition of CYP3A1/2 mediated by CAR and PXR may be involved in the mechanism of toxicity of DBDCT in rat liver.

