Zinc Phthalocyanine Labelled Polyethylene Glycol: Preparation, Characterization, Interaction with Bovine Serum Albumin and Near Infrared Fluorescence Imaging in Vivo

Abstract
1. Introduction
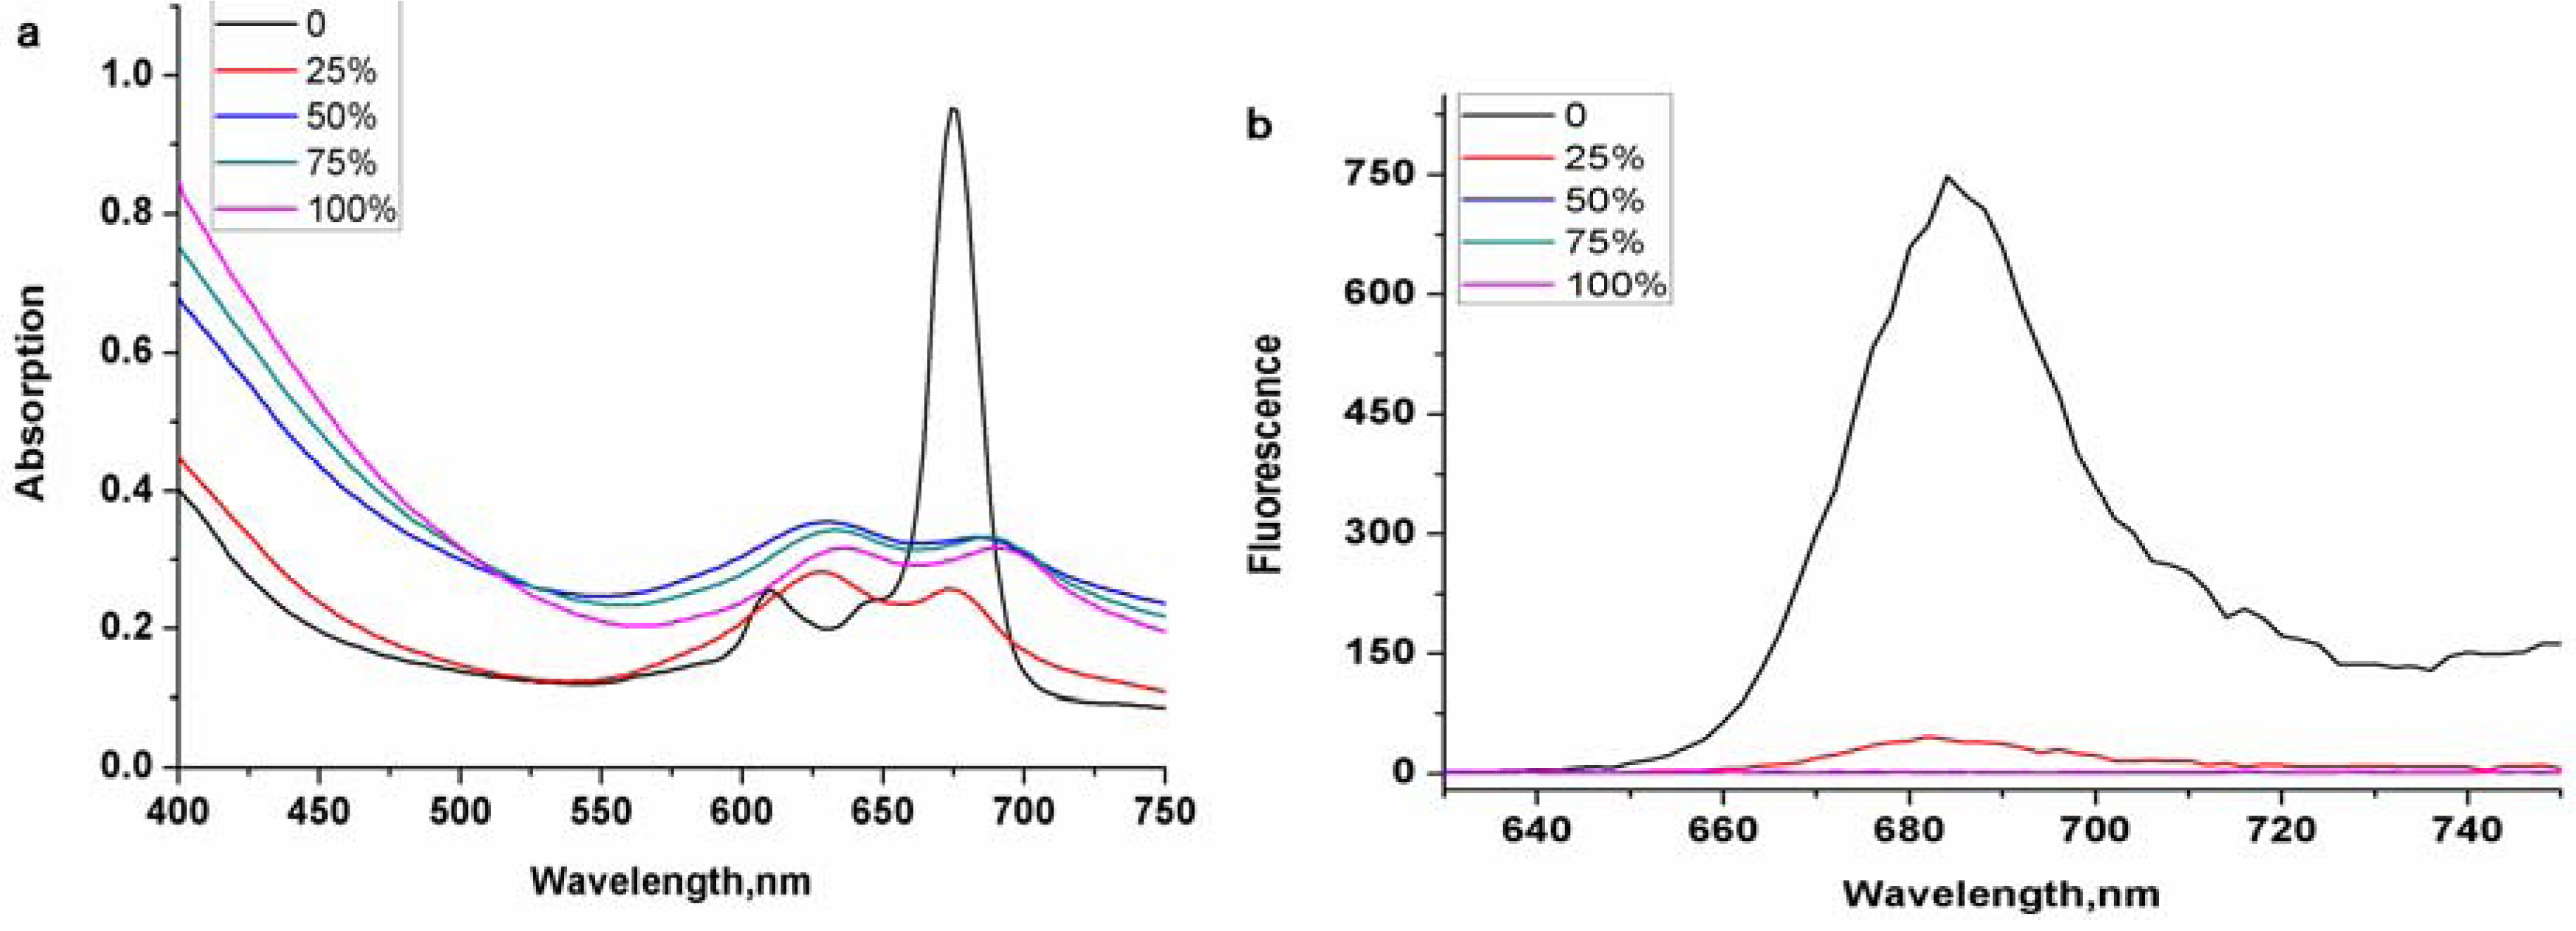
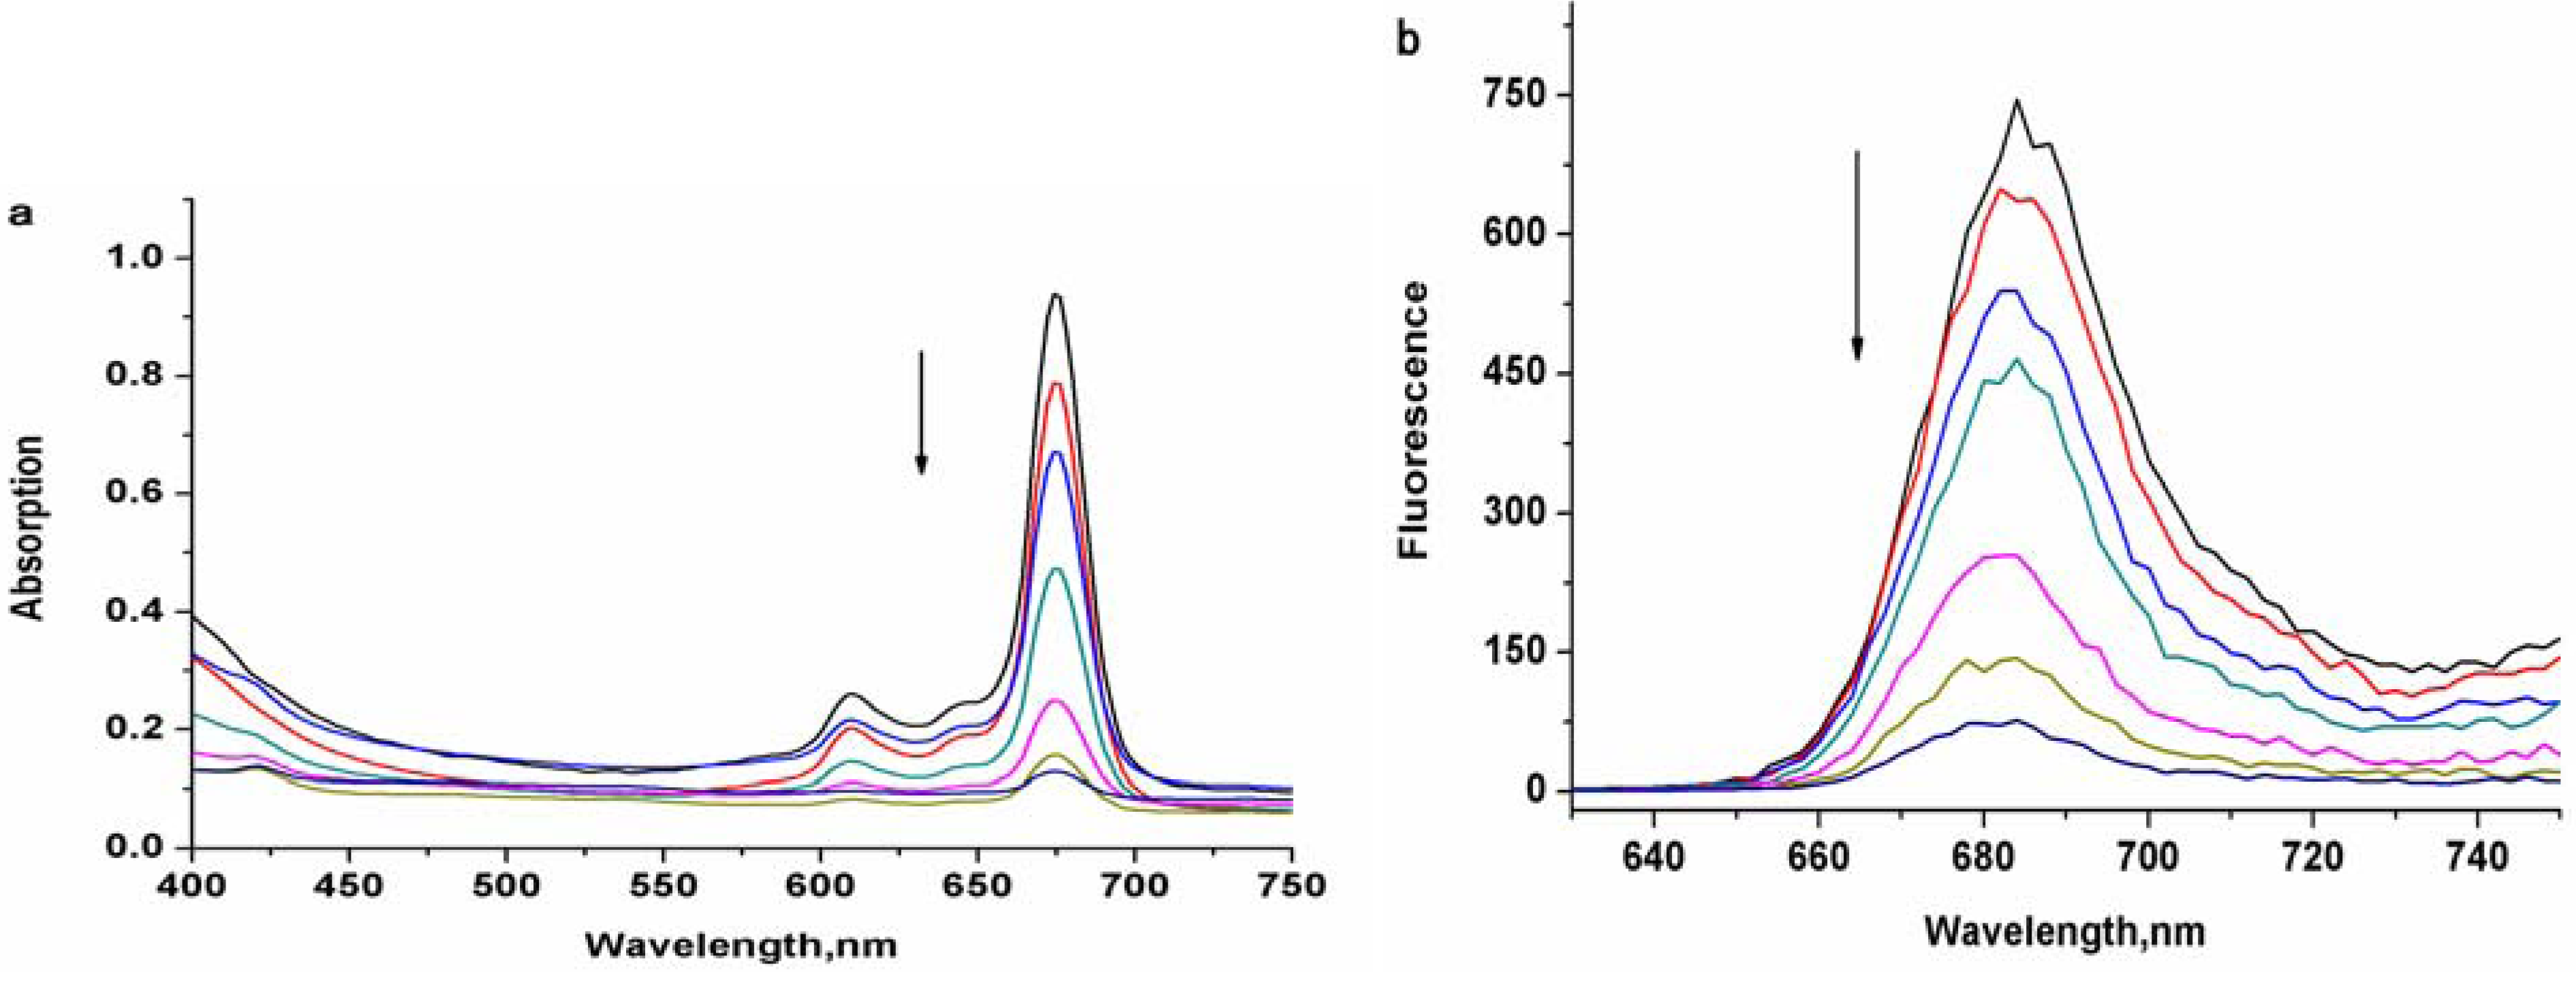
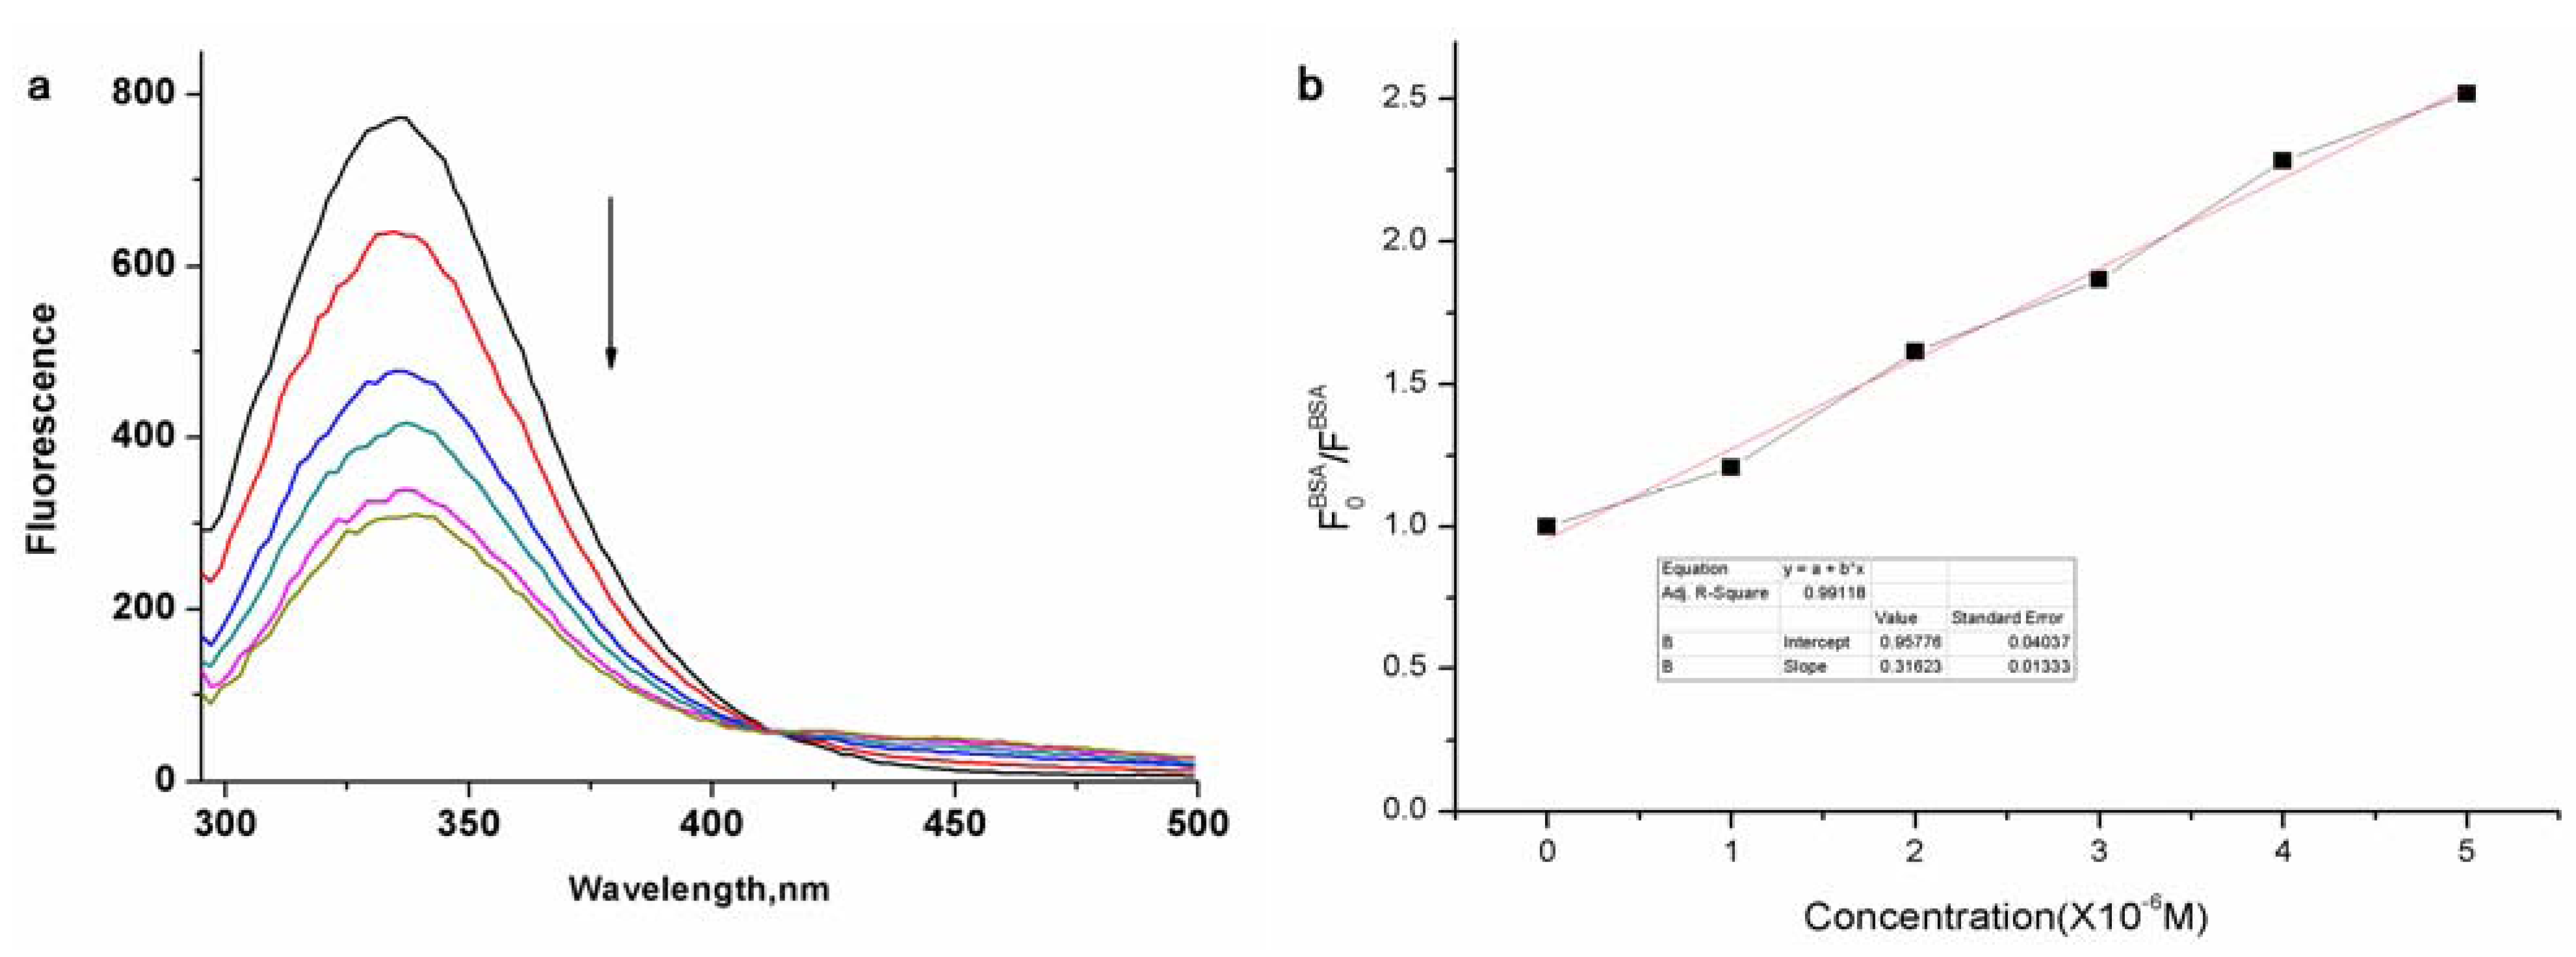
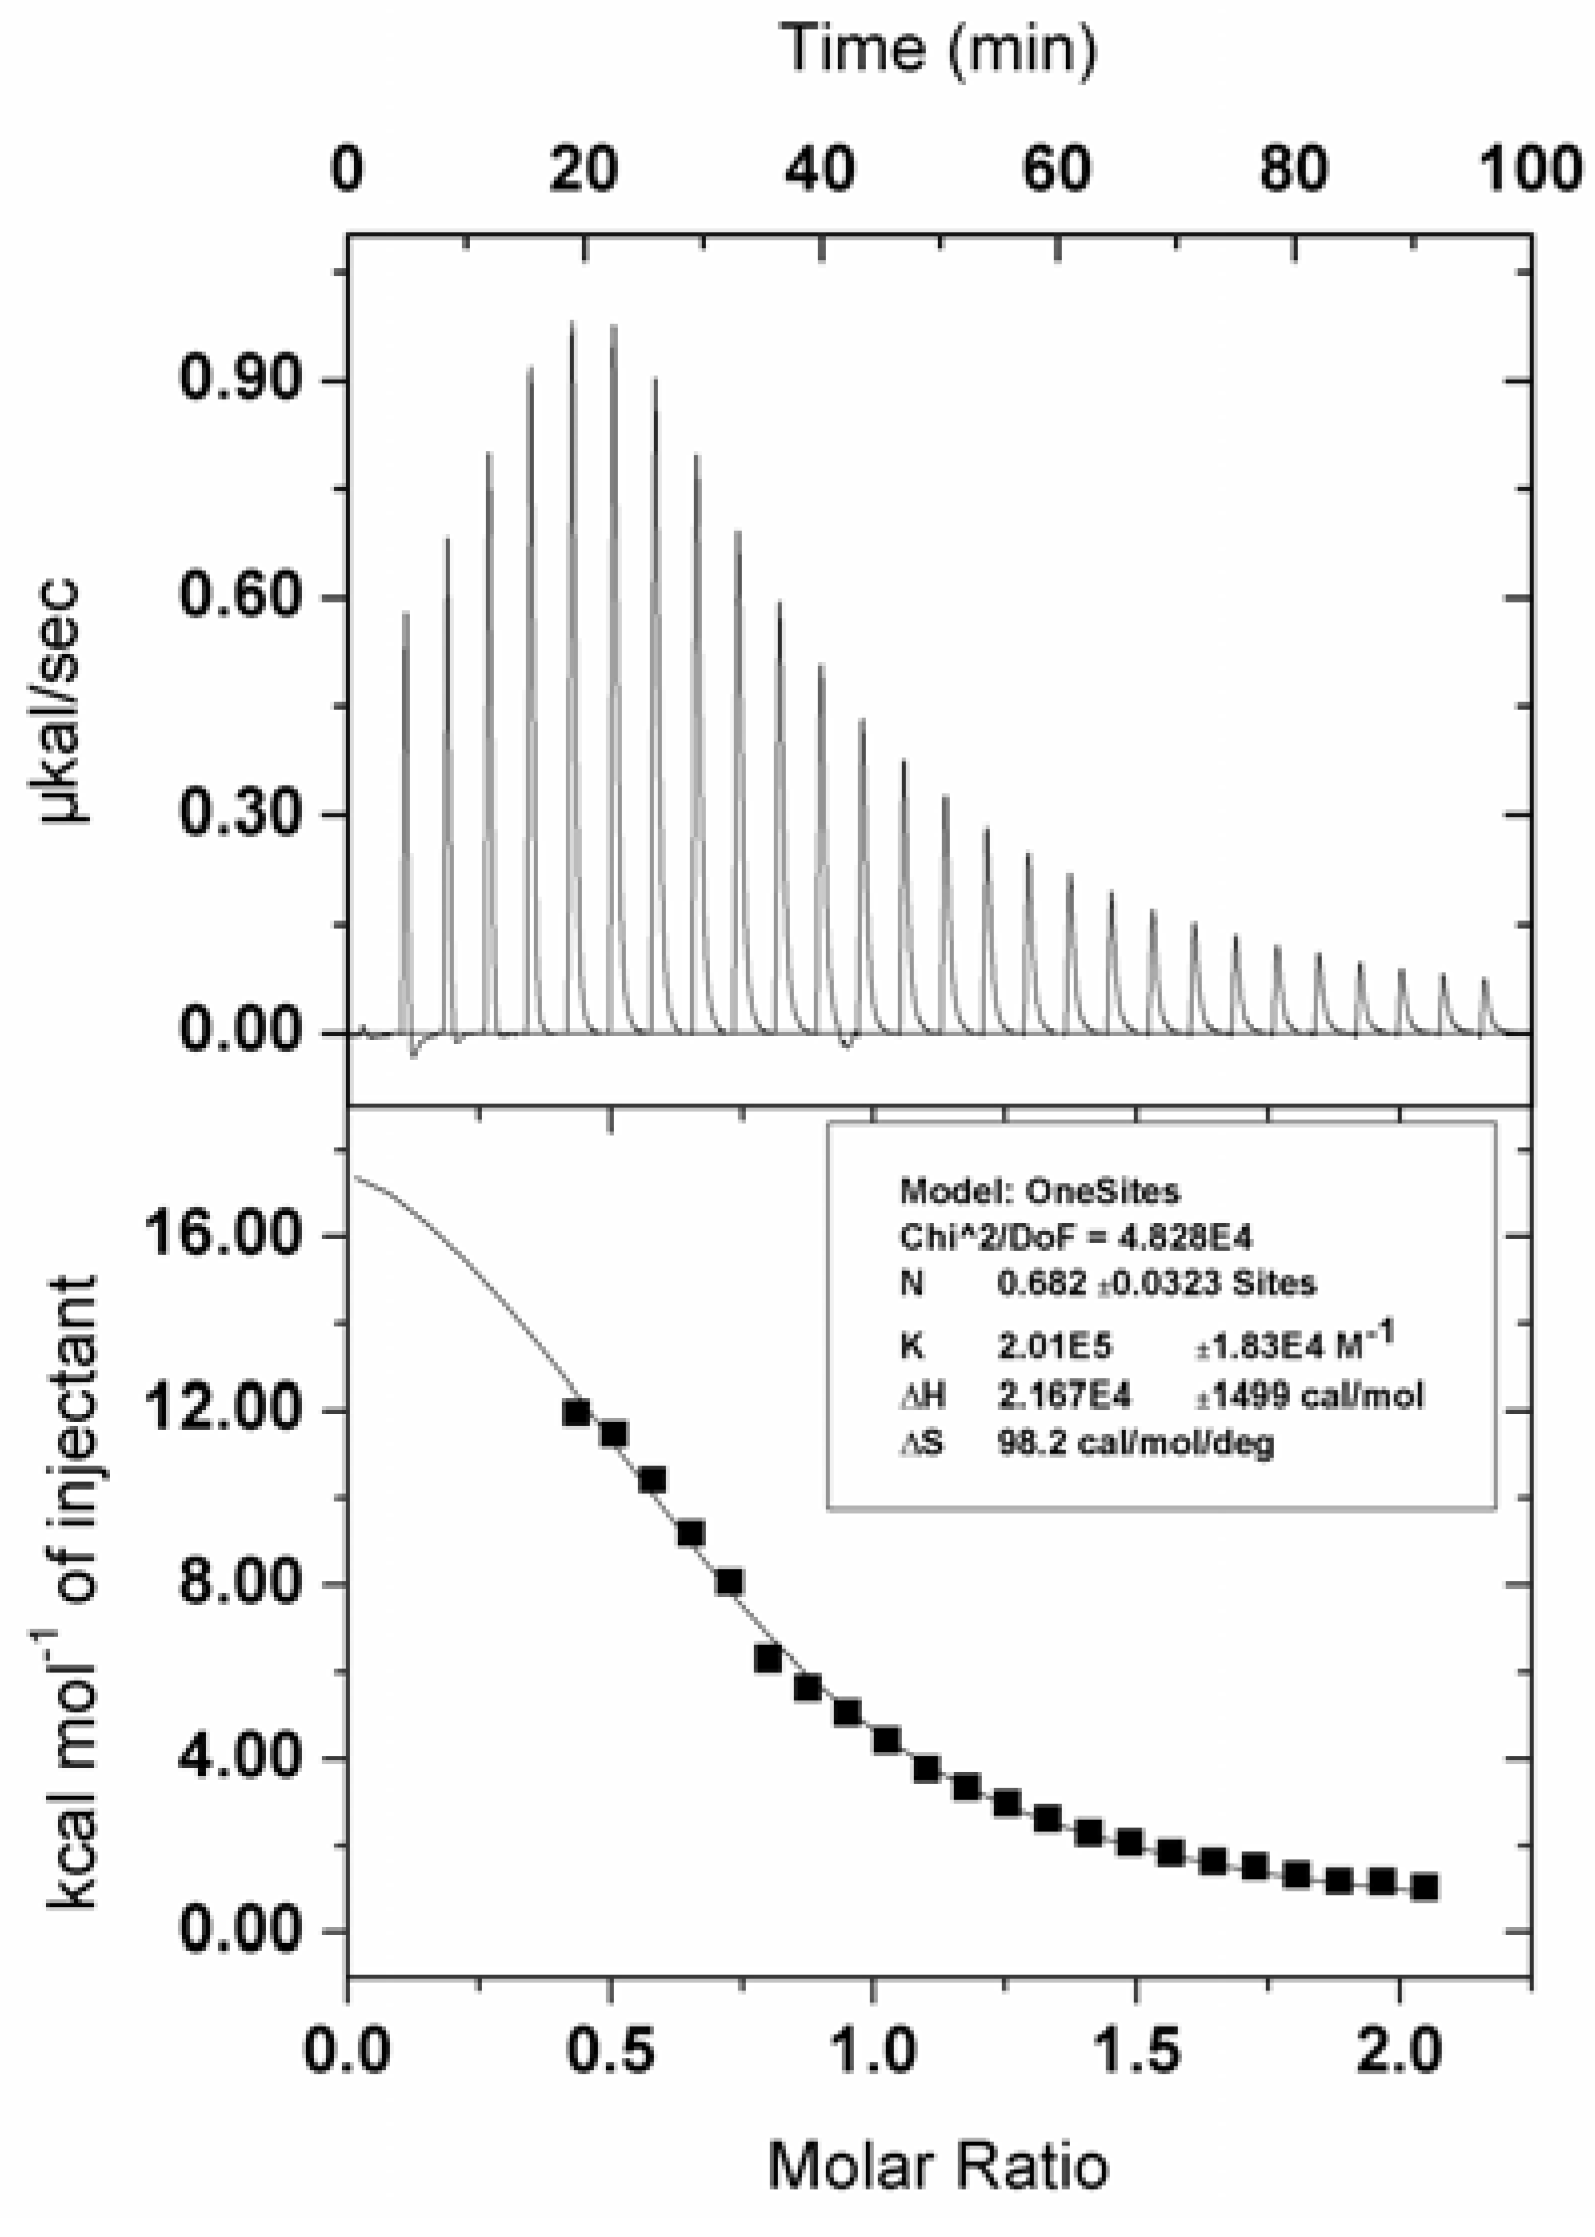
2. Results and Discussion
3. Experimental
3.1. General Methods and Materials
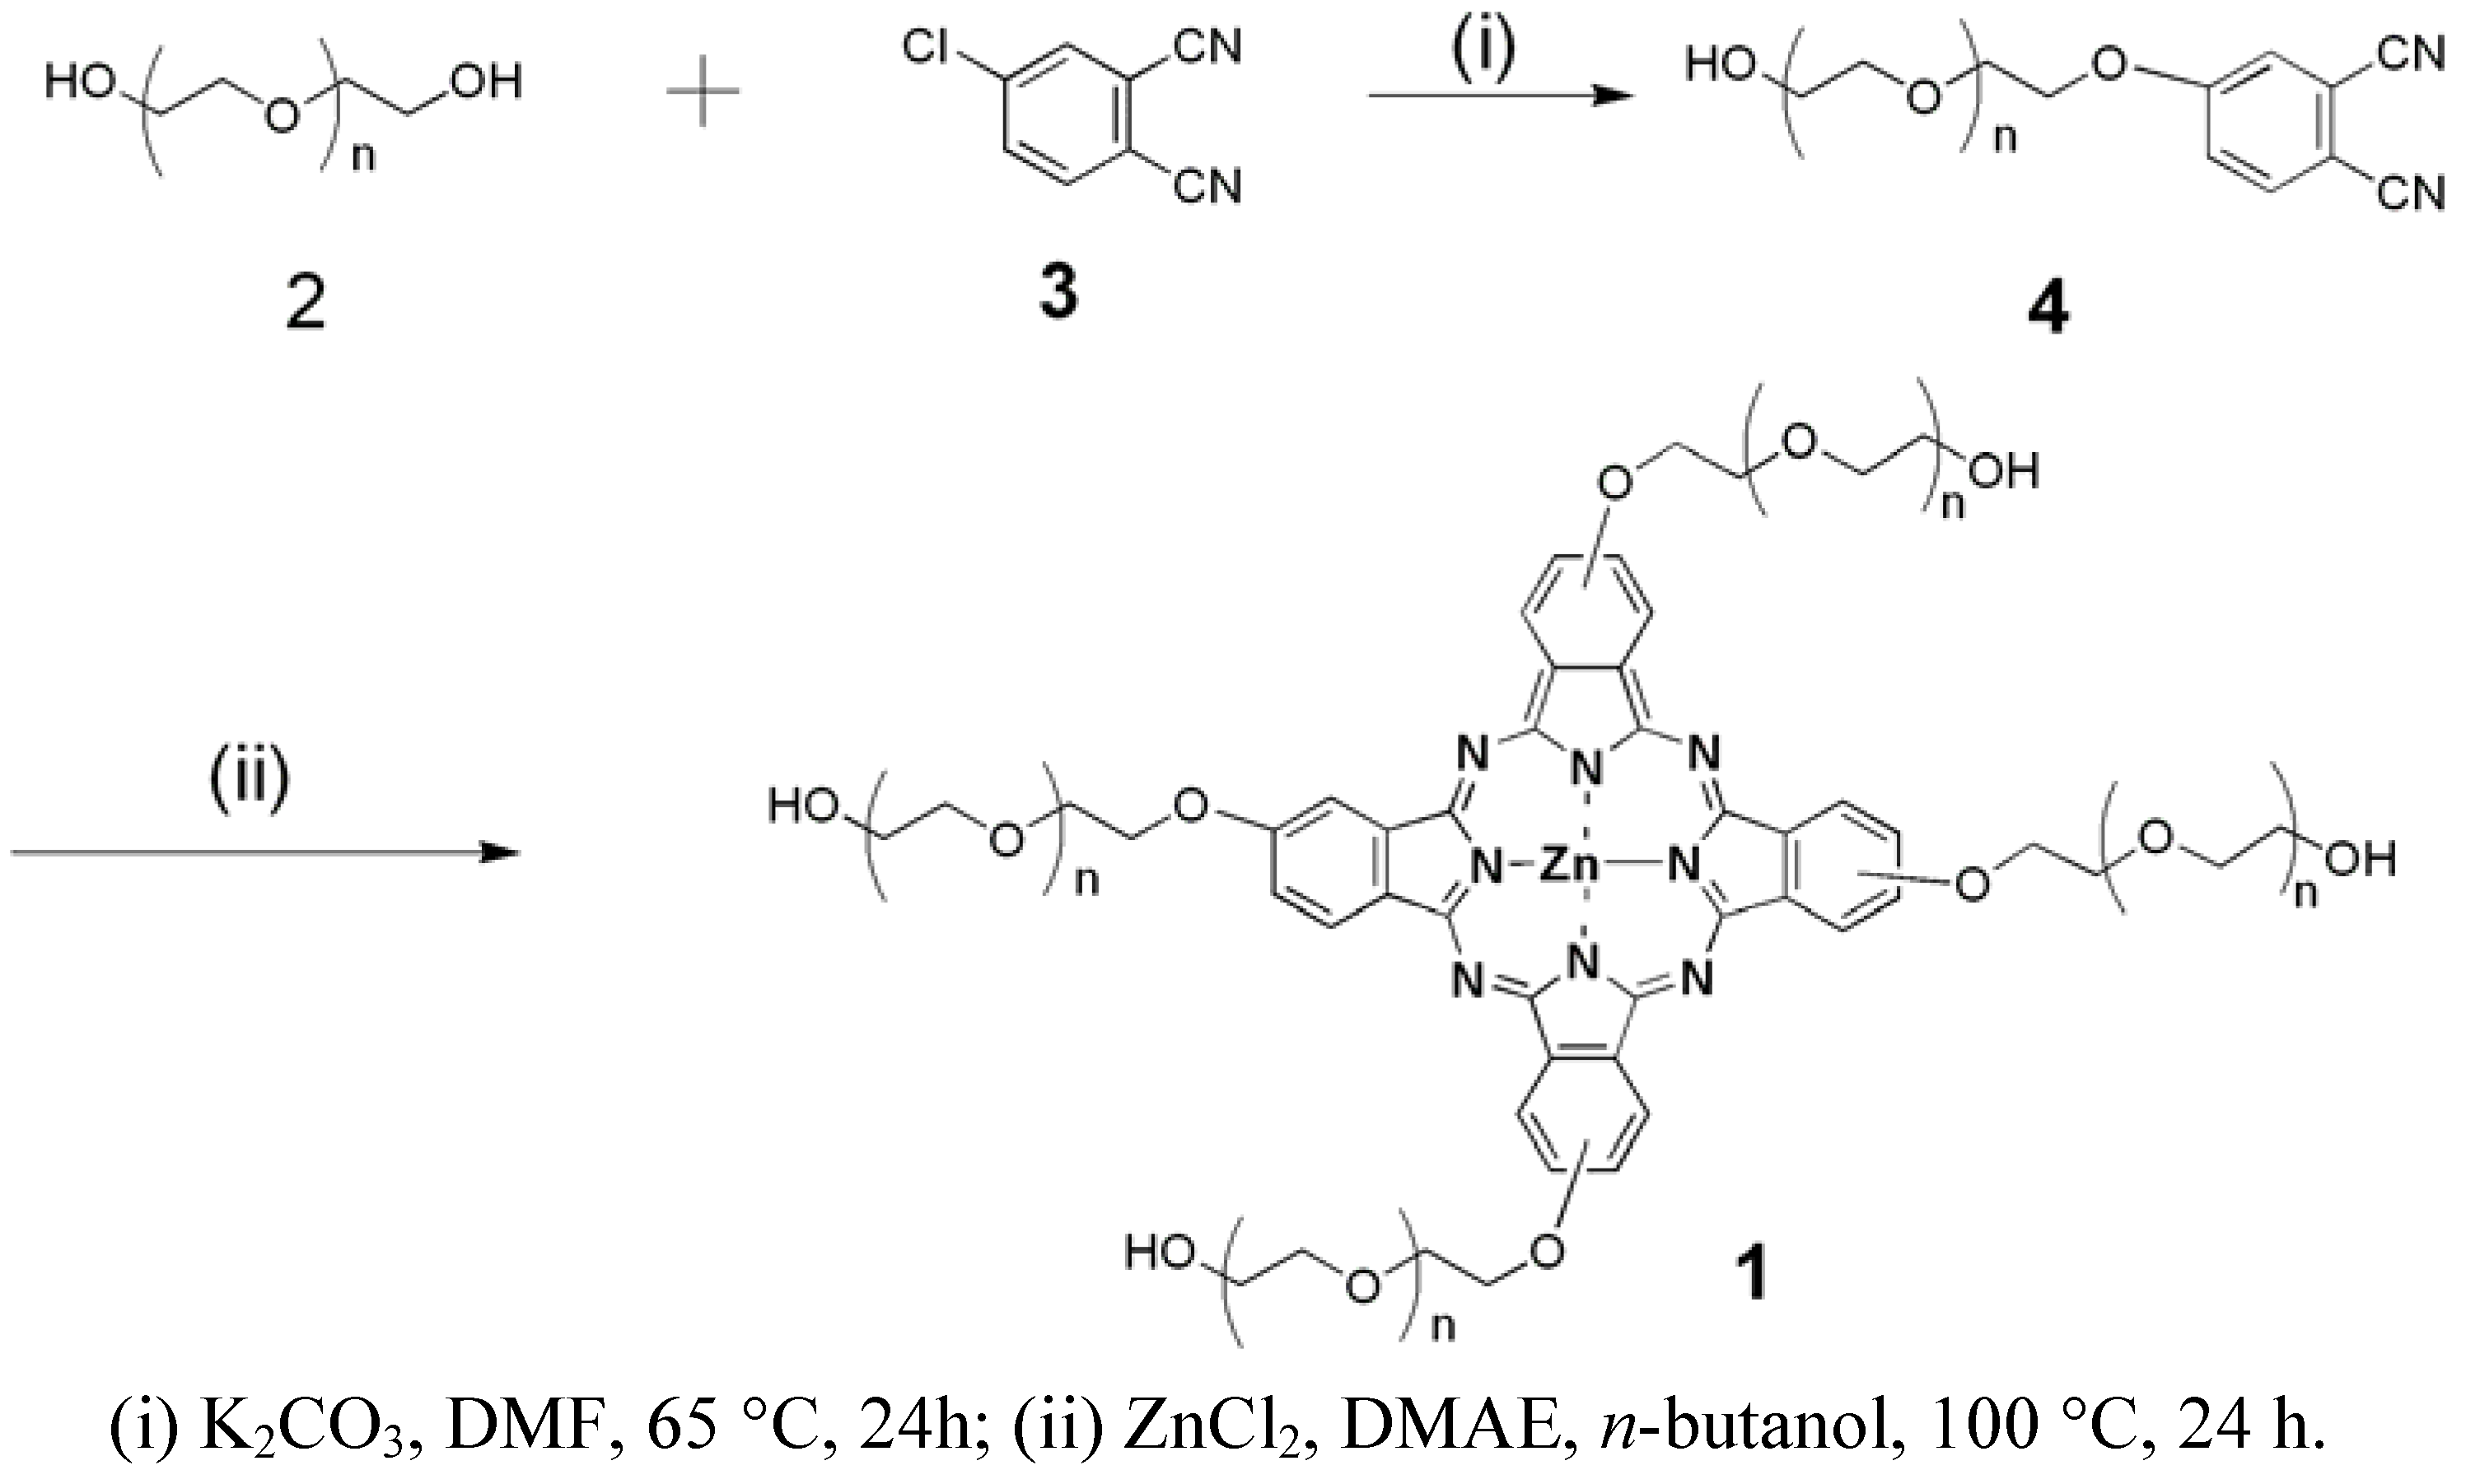
3.2. Synthesis of Zinc Phthalocyanine Labelled PEG
3.3. Optical Measurement
3.4. Interaction of Zinc Phthalocyanine Labelled PEG with BSA
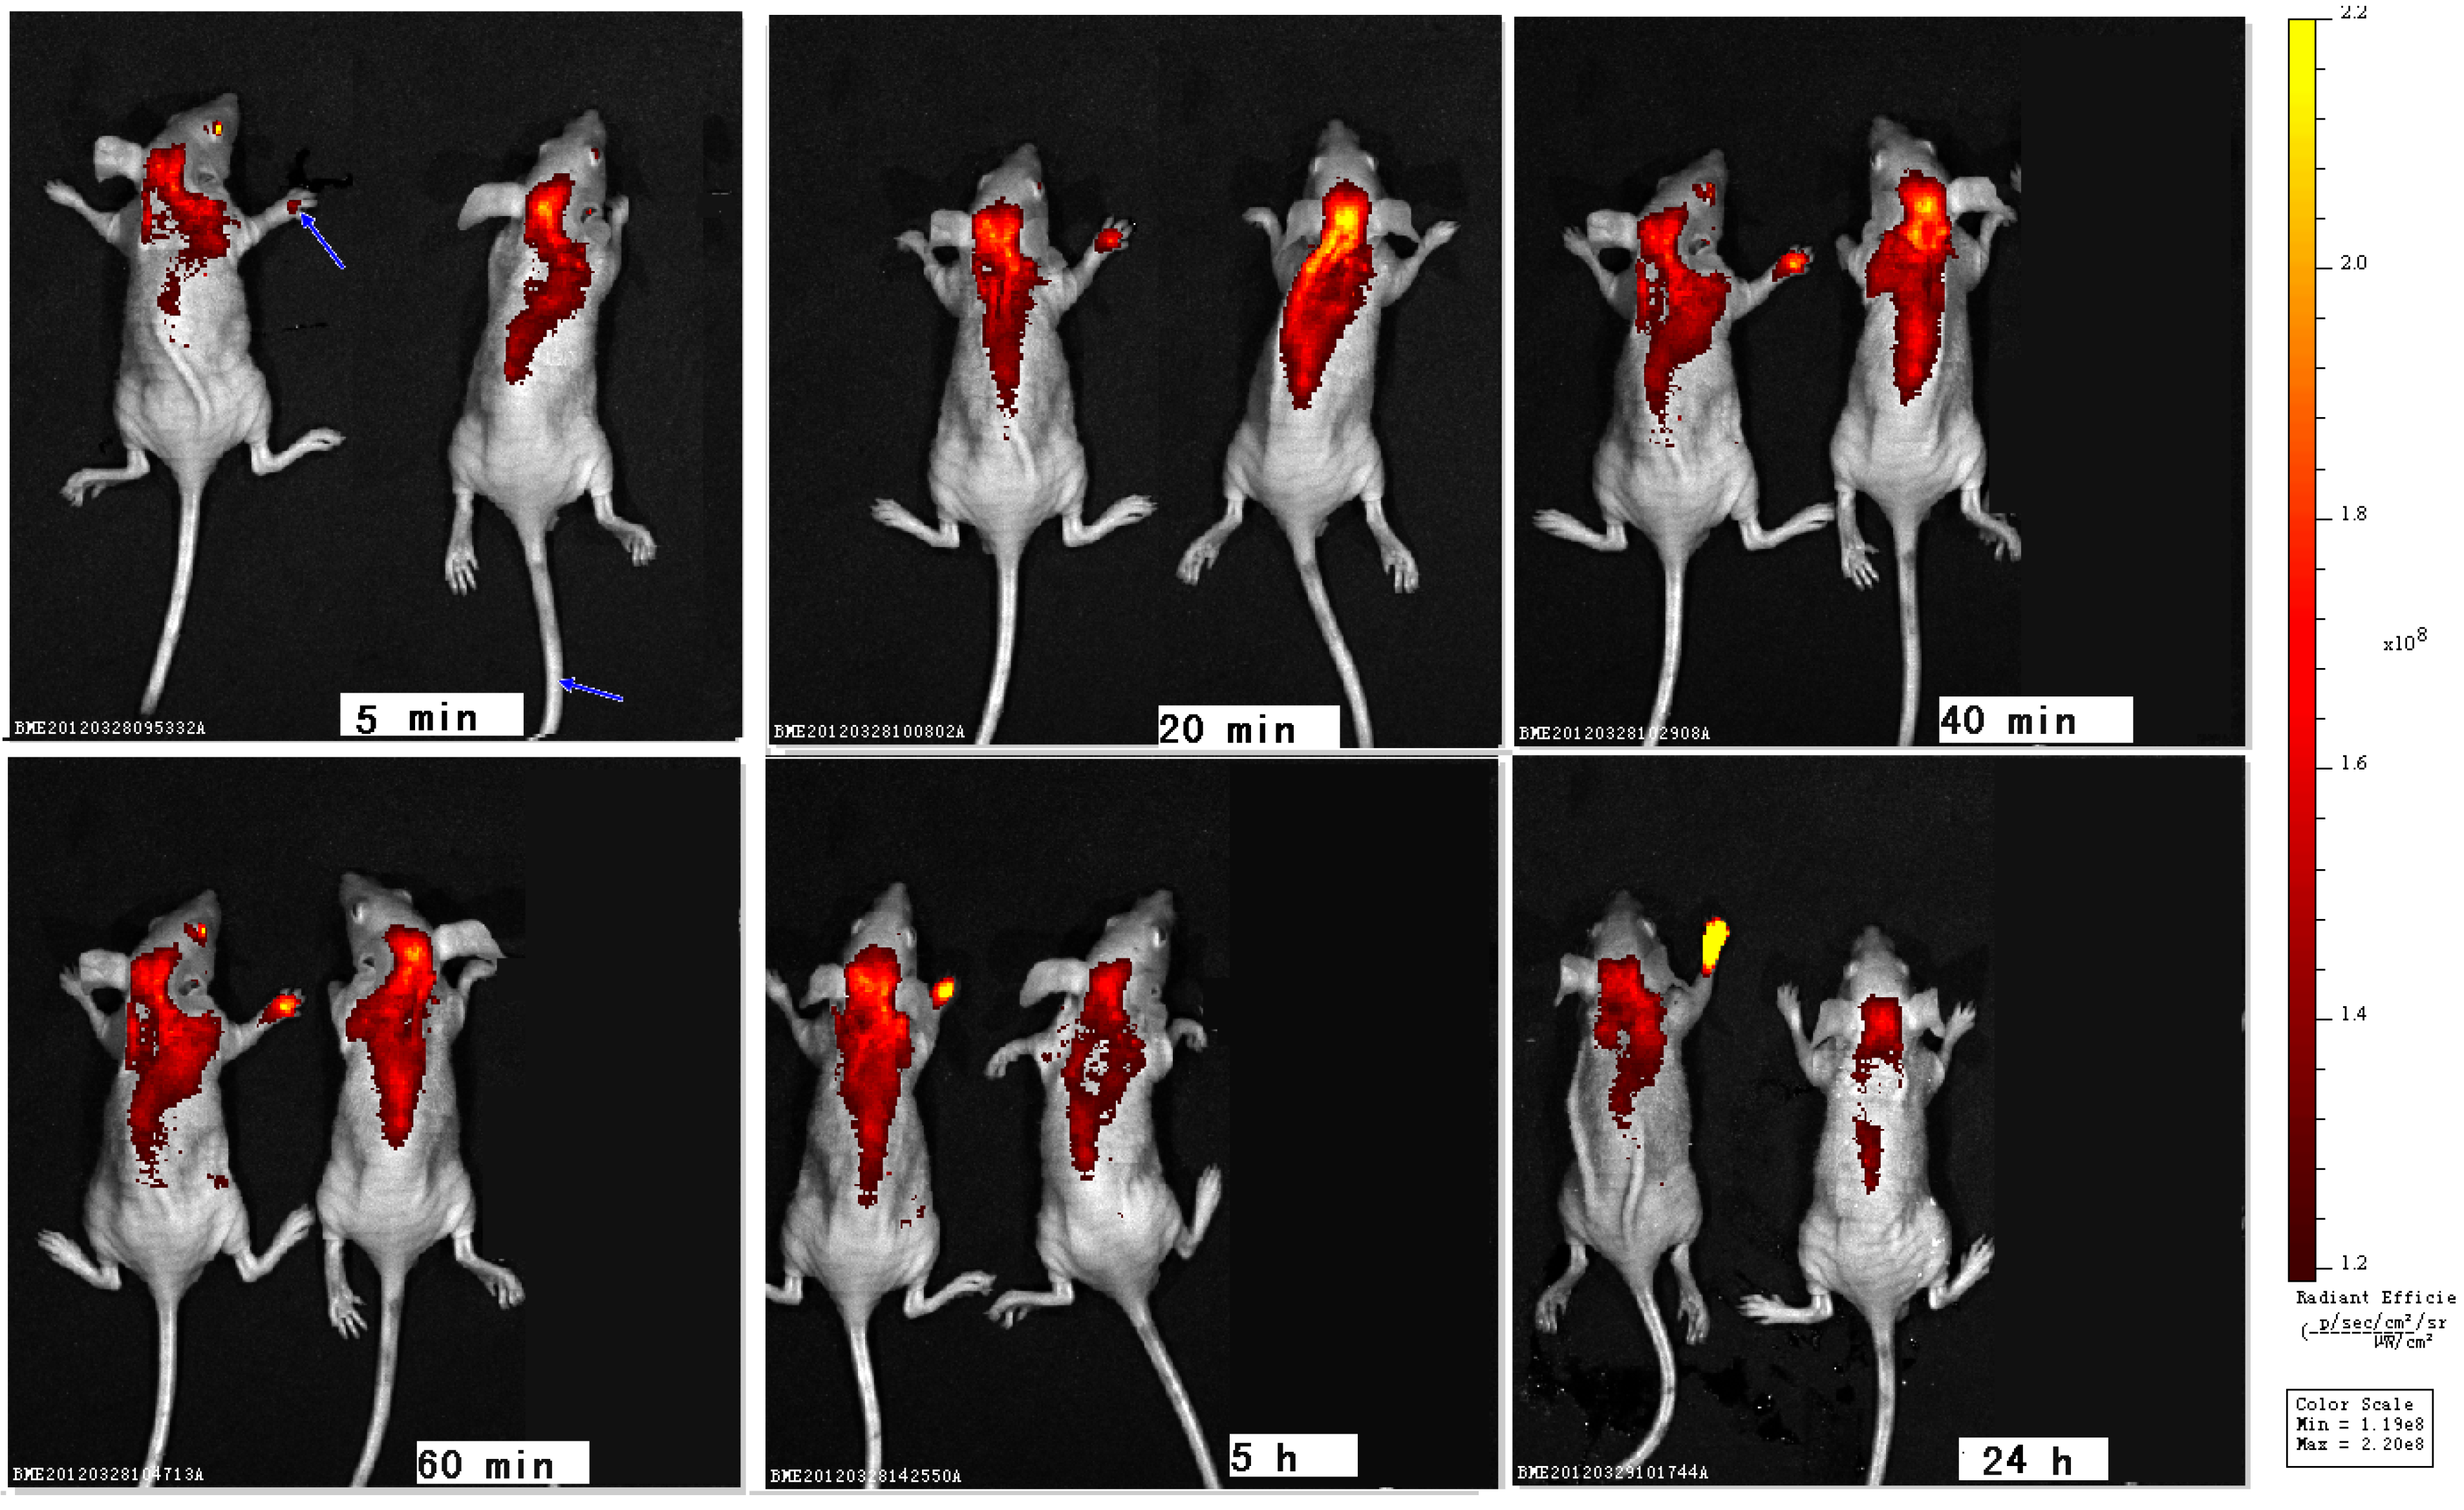
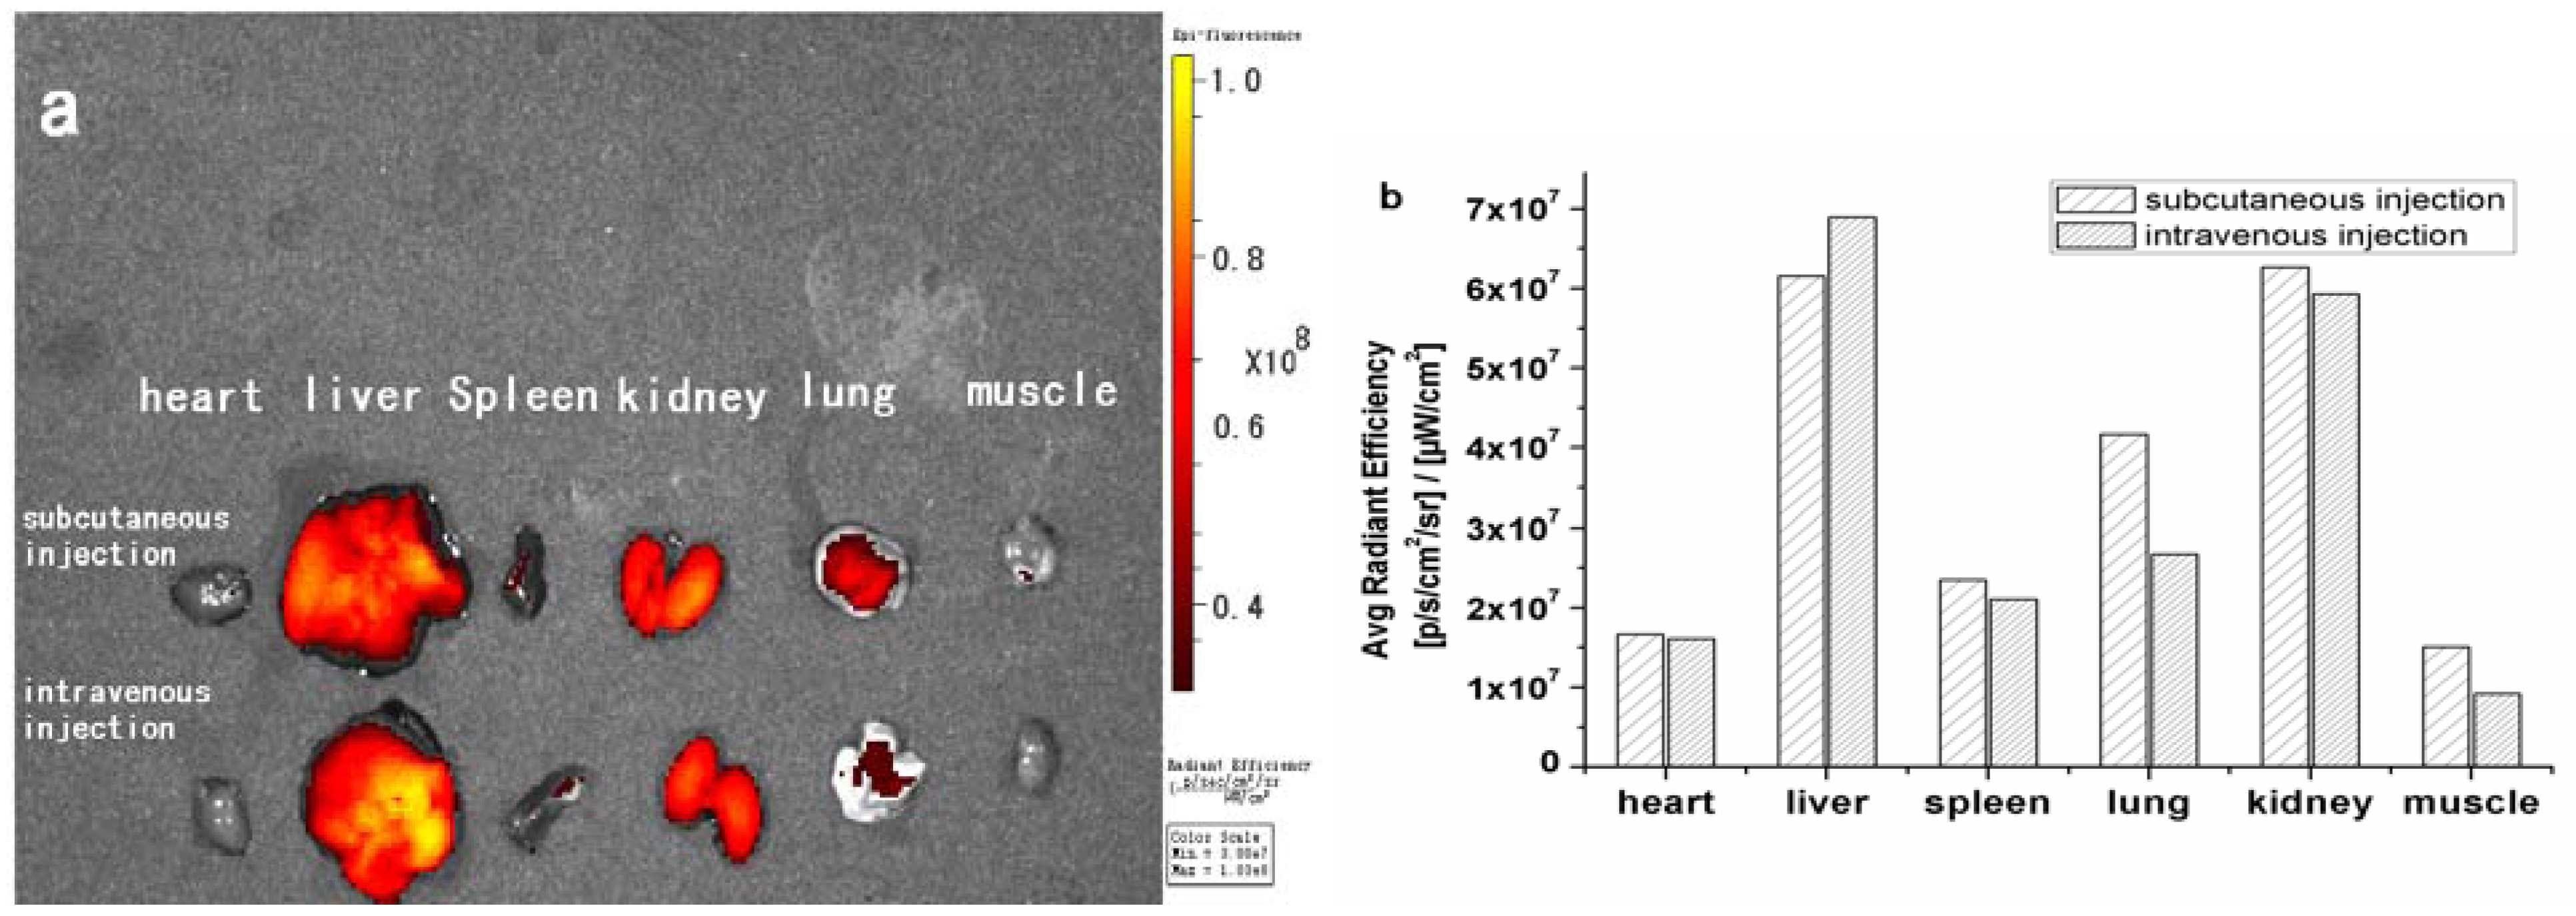
3.5. In Vivo Imaging and Distribution of Zinc Phthalocyanine Labelled PEG
4. Conclusions
Acknowledgments
References and Notes
- Xi, T.; Gao, R.; Xu, B.; Chen, L.; Luo, T.; Liu, J.; Wei, Y.; Zhong, S. In vitro and in vivo changes to PLGA/sirolimus coating on drug eluting stents. Biomaterials 2010, 31, 5151–5158. [Google Scholar] [CrossRef]
- Cook, J.L.; Fox, D.B.; Kuroki, K.; Jayo, M.; De Deyne, P.G. In vitro and in vivo comparison of five biomaterials used for orthopedic soft tissue augmentation. Am. J. Vet. Res. 2008, 69, 148–156. [Google Scholar] [CrossRef]
- Lindgren, C.; Sennerby, L.; Mordenfeld, A.; Hallman, M. Clinical histology of microimplants placed in two different biomaterials. Int. J. Oral. Maxillofac. Implants. 2009, 24, 1093–1100. [Google Scholar]
- Wang, B.; Liu, W.; Zhang, Y.; Jiang, Y.; Zhang, W.; Zhou, G.; Cui, L.; Cao, Y. Engineering of extensor tendon complex by an exvivo approach. Biomaterials 2008, 29, 2954–2961. [Google Scholar] [CrossRef]
- Constantinidis, I.; Simpson, N.E.; Grant, S.C.; Blackband, S.J.; Long, R.C.; Sambanis, A. Non-Invasive Monitoring of Tissue-Engineered Pancreatic Constructs by NMR Techniques. Adv. Exp. Med. Biol. 2007, 585, 261–276. [Google Scholar]
- Georgakoudi, I.; Rice, W.L.; Hronik-Tupaj, M.; Kaplan, D.L. Optical spectroscopy and imaging for the noninvasive evaluation of engineered tissues. Tissue Eng. Part. B Rev. 2008, 14, 321–340. [Google Scholar] [CrossRef]
- Solorio, L.; Babin, B.M.; Patel, R.B.; Mach, J.; Azar, N.; Exner, A.A. Noninvasive characterization of in situ forming implants using diagnostic ultrasound. J. Control Release 2010, 143, 183–190. [Google Scholar] [CrossRef]
- Maderx, K.; Bacic, G.; Domb, A.; Elmalak, O.; Langer, R.; Swartz, H.M. Noninvasive in vivo Monitoring of Drug Release and Polymer Erosion from Biodegradable Polymers by EPR Spectroscopy and NMR Imaging. J.Pharm. Sci. 1997, 86, 126–134. [Google Scholar] [CrossRef]
- Weissleder, R.; Pitte, M.J. Imaging in the era of molecular oncology. Nature 2008, 452, 580–589. [Google Scholar] [CrossRef]
- Luker, G.D.; Luker, K.E. Optical imaging: Current applications and future directions. J. Nucl. Med. 2008, 49, 1–4. [Google Scholar] [CrossRef]
- Hilderbrand, S.A.; Weissleder, R. Near-infrared fluorescence: Application to in vivo molecular imaging. Curr. Opin. Chem. Biol. 2010, 14, 71–79. [Google Scholar] [CrossRef]
- Kobayashi, H.; Ogawa, M.; Alford, R.; Choyke, P.L.; Urano, Y. New Strategies for Fluorescent Probe Design in Medical Diagnostic Imaging. Chem. Rev. 2010, 110, 2620–2640. [Google Scholar] [CrossRef]
- Sevick-Muraca, E.M. Translation of Near-Infrared Fluorescence Imaging Technologies: Emerging Clinical Applications. Annu. Rev. Med. 2012, 63, 217–231. [Google Scholar] [CrossRef]
- Filonov, G.S.; Piatkevich, K.D.; Ting, L.; Zhang, J.; Kim, K.; Verkhusha, V.V. Bright and stable near-infrared fluorescent protein for in vivo imaging. Nat. Biotechnol. 2011, 29, 757–761. [Google Scholar] [CrossRef]
- Rao, J.; Dragulescu-Andrasi, A.; Yao, H. Fluorescenceimaging in vivo: Recentadvances. Curr. Opin. Biotechnol. 2007, 18, 17–25. [Google Scholar] [CrossRef]
- Leblond, F.; Davis, S.C.; Valdés, P. Pre-clinical whole-body fluorescence imaging: Review of instruments, methods and applications. J. Photoch. Photobiol. B 2010, 98, 277–294. [Google Scholar]
- Artzi, N.; Oliva, N.; Puron, C.; Shitreet, S.; Artzi, S.; Ramos, A.; Groothuis, A.; Sahagian, G.; Edelman, E.R. In vivo and in vitro tracking of erosion in biodegradable materials using non-invasive fluorescence imaging. Nat. Mater. 2011. [Google Scholar] [CrossRef]
- Lovell, J.F.; Roxin, A.; Ng, K.K.; Qi, Q.; McMullen, J.D.; DaCosta, R.S.; Zheng, G. Porphyrin-Cross-Linked Hydrogel for Fluorescence-Guided Monitoring and Surgical Resection. Biomacromolecules 2011, 12, 3115–3118. [Google Scholar] [CrossRef]
- Cunha-Reis, C.; El Haj, A.J.; Yang, X.; Yang, Y. Fluorescent labeling of chitosan for use in non-invasive monitoring of degradation in tissue engineering. J Tissue Eng. Regen. Med. 2011. [Google Scholar] [CrossRef]
- Moller, L.; Krause, A.; Bartsch, I.; Kirschning, A.; Witte, F.; Drager, G. Preparation and In vivo Imaging of Lucifer Yellow Tagged Hydrogels. Macromol. Symp. 2011, 309/310, 222–228. [Google Scholar] [CrossRef]
- Sekkat, N.; Bergh, H.; Nyokong, T.; Lange, N. Like a Bolt from the Blue: Phthalocyanines in Biomedical Optics. Molecules 2012, 17, 98–144. [Google Scholar]
- amur, M.; Bulut, M.; Kandaz, M.; Güney, O. Synthesis, characterization and fluorescence behavior of new fluorescent probe phthalocyanines bearing coumarin substituents. Polyhedron 2009, 28, 233–238. [Google Scholar]
- Goslinski, T.; Osmalek, T.; Konopka, K.; Wierzchowski, M.; Fita, P.; Mielcarek, J. Photophysical properties and photocytotoxicity of novel phthalocyanines-potentially useful for their application in photodynamic therapy. Polyhedron 2011, 30, 1538–1546. [Google Scholar] [CrossRef]
- Josefsen, L.B.; Boyle, R.W. Photodynamic therapy and the development of metal-based photosensitisers. Met. Based Drugs 2008, 1–24. [Google Scholar] [CrossRef]
- Dumoulin, F.; Durmuş, M.; Ahsen, V.; Nyokong, T. Synthetic pathways to water-soluble phthalocyanines and close analogs. Coord. Chem. Rev. 2010, 254, 2792–2847. [Google Scholar] [CrossRef]
- Taquet, J.P.; Frochot, C.; Manneville, V.; Barberi-Heyob, M. Phthalocyanines covalently bound to biomolecules for a targeted photodynamic therapy. Curr. Med. Chem. 2007, 14, 1673–1687. [Google Scholar] [CrossRef]
- Allen, C.M.; Sharman, W.M.; Van Lier, J.E. Current status of phthalocyanines in the photodynamic therapy of cancer. J. Porphyr. Phthalocya. 2001, 5, 161–169. [Google Scholar] [CrossRef]
- Ogura, S.I.; Tabata, K.; Fukushima, K.; Kamachi, T.; Okura, I. Development of phthalocyanines for photodynamic therapy. J. Porphyr. Phthalocya. 2006, 10, 1116–1124. [Google Scholar] [CrossRef]
- Wang, A.; Long, L.; Zhang, C. Synthesis and properties of photo-activable phthalocyanines: A brief overview. J. Incl. Phenom. Macrocycl. Chem. 2011, 71, 1–24. [Google Scholar] [CrossRef]
- Nesterova, I.V.; SibelErdem, S.; Pakhomov, S.; Hammer, R.P.; Soper, S.A. Phthalocyanine Dimerization-Based Molecular Beacons Using Near-IR Fluorescence. J. Am. Chem. Soc. 2009, 131, 2432–2433. [Google Scholar]
- Mantareva, V.; Petrova, D.; Avramov, L.; Angelov, I.; Borisova, E.; Peeva, M.; Wöhrle, D. Longwavelength absorbingcationic Zn(II)-phthalocyanines as fluorescent contrast agents for B16 pigmented melanoma. J. Porphyr. Phthalocya. 2005, 9, 47–53. [Google Scholar] [CrossRef]
- Lv, F.; He, X.; Lu, L.; Wu, L.; Liu, T. Synthesis, properties and near-infrared imaging evaluation of glucose conjugated zinc phthalocyanine via Click reaction. J. Porphyr. Phthalocya. 2012, 16, 77–84. [Google Scholar] [CrossRef]
- Zhu, J. Bioactive modification of poly(ethylene glycol) hydrogels for tissue engineering. Biomaterials 2010, 31, 4639–4656. [Google Scholar] [CrossRef]
- Knop, K.; Hoogenboom, R.; Fischer, D.; Schubert, U.S. Poly(ethylene glycol) in Drug Delivery: Pros and Cons as Well as Potential Alternatives. Angew. Chem. Int. Ed. 2010, 49, 6288–6308. [Google Scholar] [CrossRef]
- Pasut, G.; Veronese, F.M. PEG conjugates in clinical development or use as anticancer agents: An overview. Adv. Drug Delivery Rev. 2009, 61, 1177–1188. [Google Scholar] [CrossRef]
- Bai, M.; Lo, P.C.; Ye, J.; Wu, C.; Fong, W.P.; Ng, D.K.P. Facile synthesis of pegylated zinc(II) phthalocyanines via transesterification and their in vitro photodynamic activities. Org. Biomol. Chem. 2011, 9, 7028–7032. [Google Scholar] [CrossRef]
- Tuncel, S.; Dumoulin, F.; Gailer, J.; Sooriyaarachchi, M.; Atilla, D.; Durmus, M.; Bouchu, D.; Savoie, H.; Boyled, R.W.; Ahsen, V. A set of highly water-soluble tetraethyleneglycol-substituted Zn(II) phthalocyanines: Synthesis, photochemical and photophysical properties, interaction with plasma proteins and in vitro phototoxicity. Dalton Trans. 2011, 40, 4067–4079. [Google Scholar]
- Liu, W.; Jensen, T.J.; Fronczek, F.R.; Hammer, R.P.; Smith, K.M.; Vicente, M.G. Synthesis and cellular studies of nonaggregated water-soluble phthalocyanines. J. Med. Chem. 2005, 48, 1033–1041. [Google Scholar]
- Alvarez-Mico, X.; Calvete, M.J.F.; Hanack, M.; Ziegler, T. The first example of anomericgly coconjugation to phthalocyanines. Tetrahedron Lett. 2006, 47, 3283–3286. [Google Scholar]
- Karabork, M.; Serin, S. Synthesis and characterization of phthalocyanines with non-ionic solubilizing groups. Synth. React. Inorg. Met.-Org. Chem 2002, 32, 1635–1647. [Google Scholar] [CrossRef]
- Sample Availability: Samples of the compound 1 is available from the authors.
© 2012 by the authors; licensee MDPI, Basel, Switzerland. This article is an open-access article distributed under the terms and conditions of the Creative Commons Attribution license (http://creativecommons.org/licenses/by/3.0/).
Share and Cite
Lv, F.; Cao, B.; Cui, Y.; Liu, T. Zinc Phthalocyanine Labelled Polyethylene Glycol: Preparation, Characterization, Interaction with Bovine Serum Albumin and Near Infrared Fluorescence Imaging in Vivo. Molecules 2012, 17, 6348-6361. https://doi.org/10.3390/molecules17066348
Lv F, Cao B, Cui Y, Liu T. Zinc Phthalocyanine Labelled Polyethylene Glycol: Preparation, Characterization, Interaction with Bovine Serum Albumin and Near Infrared Fluorescence Imaging in Vivo. Molecules. 2012; 17(6):6348-6361. https://doi.org/10.3390/molecules17066348
Chicago/Turabian StyleLv, Feng, Bo Cao, Yanli Cui, and Tianjun Liu. 2012. "Zinc Phthalocyanine Labelled Polyethylene Glycol: Preparation, Characterization, Interaction with Bovine Serum Albumin and Near Infrared Fluorescence Imaging in Vivo" Molecules 17, no. 6: 6348-6361. https://doi.org/10.3390/molecules17066348
APA StyleLv, F., Cao, B., Cui, Y., & Liu, T. (2012). Zinc Phthalocyanine Labelled Polyethylene Glycol: Preparation, Characterization, Interaction with Bovine Serum Albumin and Near Infrared Fluorescence Imaging in Vivo. Molecules, 17(6), 6348-6361. https://doi.org/10.3390/molecules17066348