The Use of Response Surface Methodology to Optimize the Ultrasound-Assisted Extraction of Five Anthraquinones from Rheum palmatum L.


 ,
,
Abstract
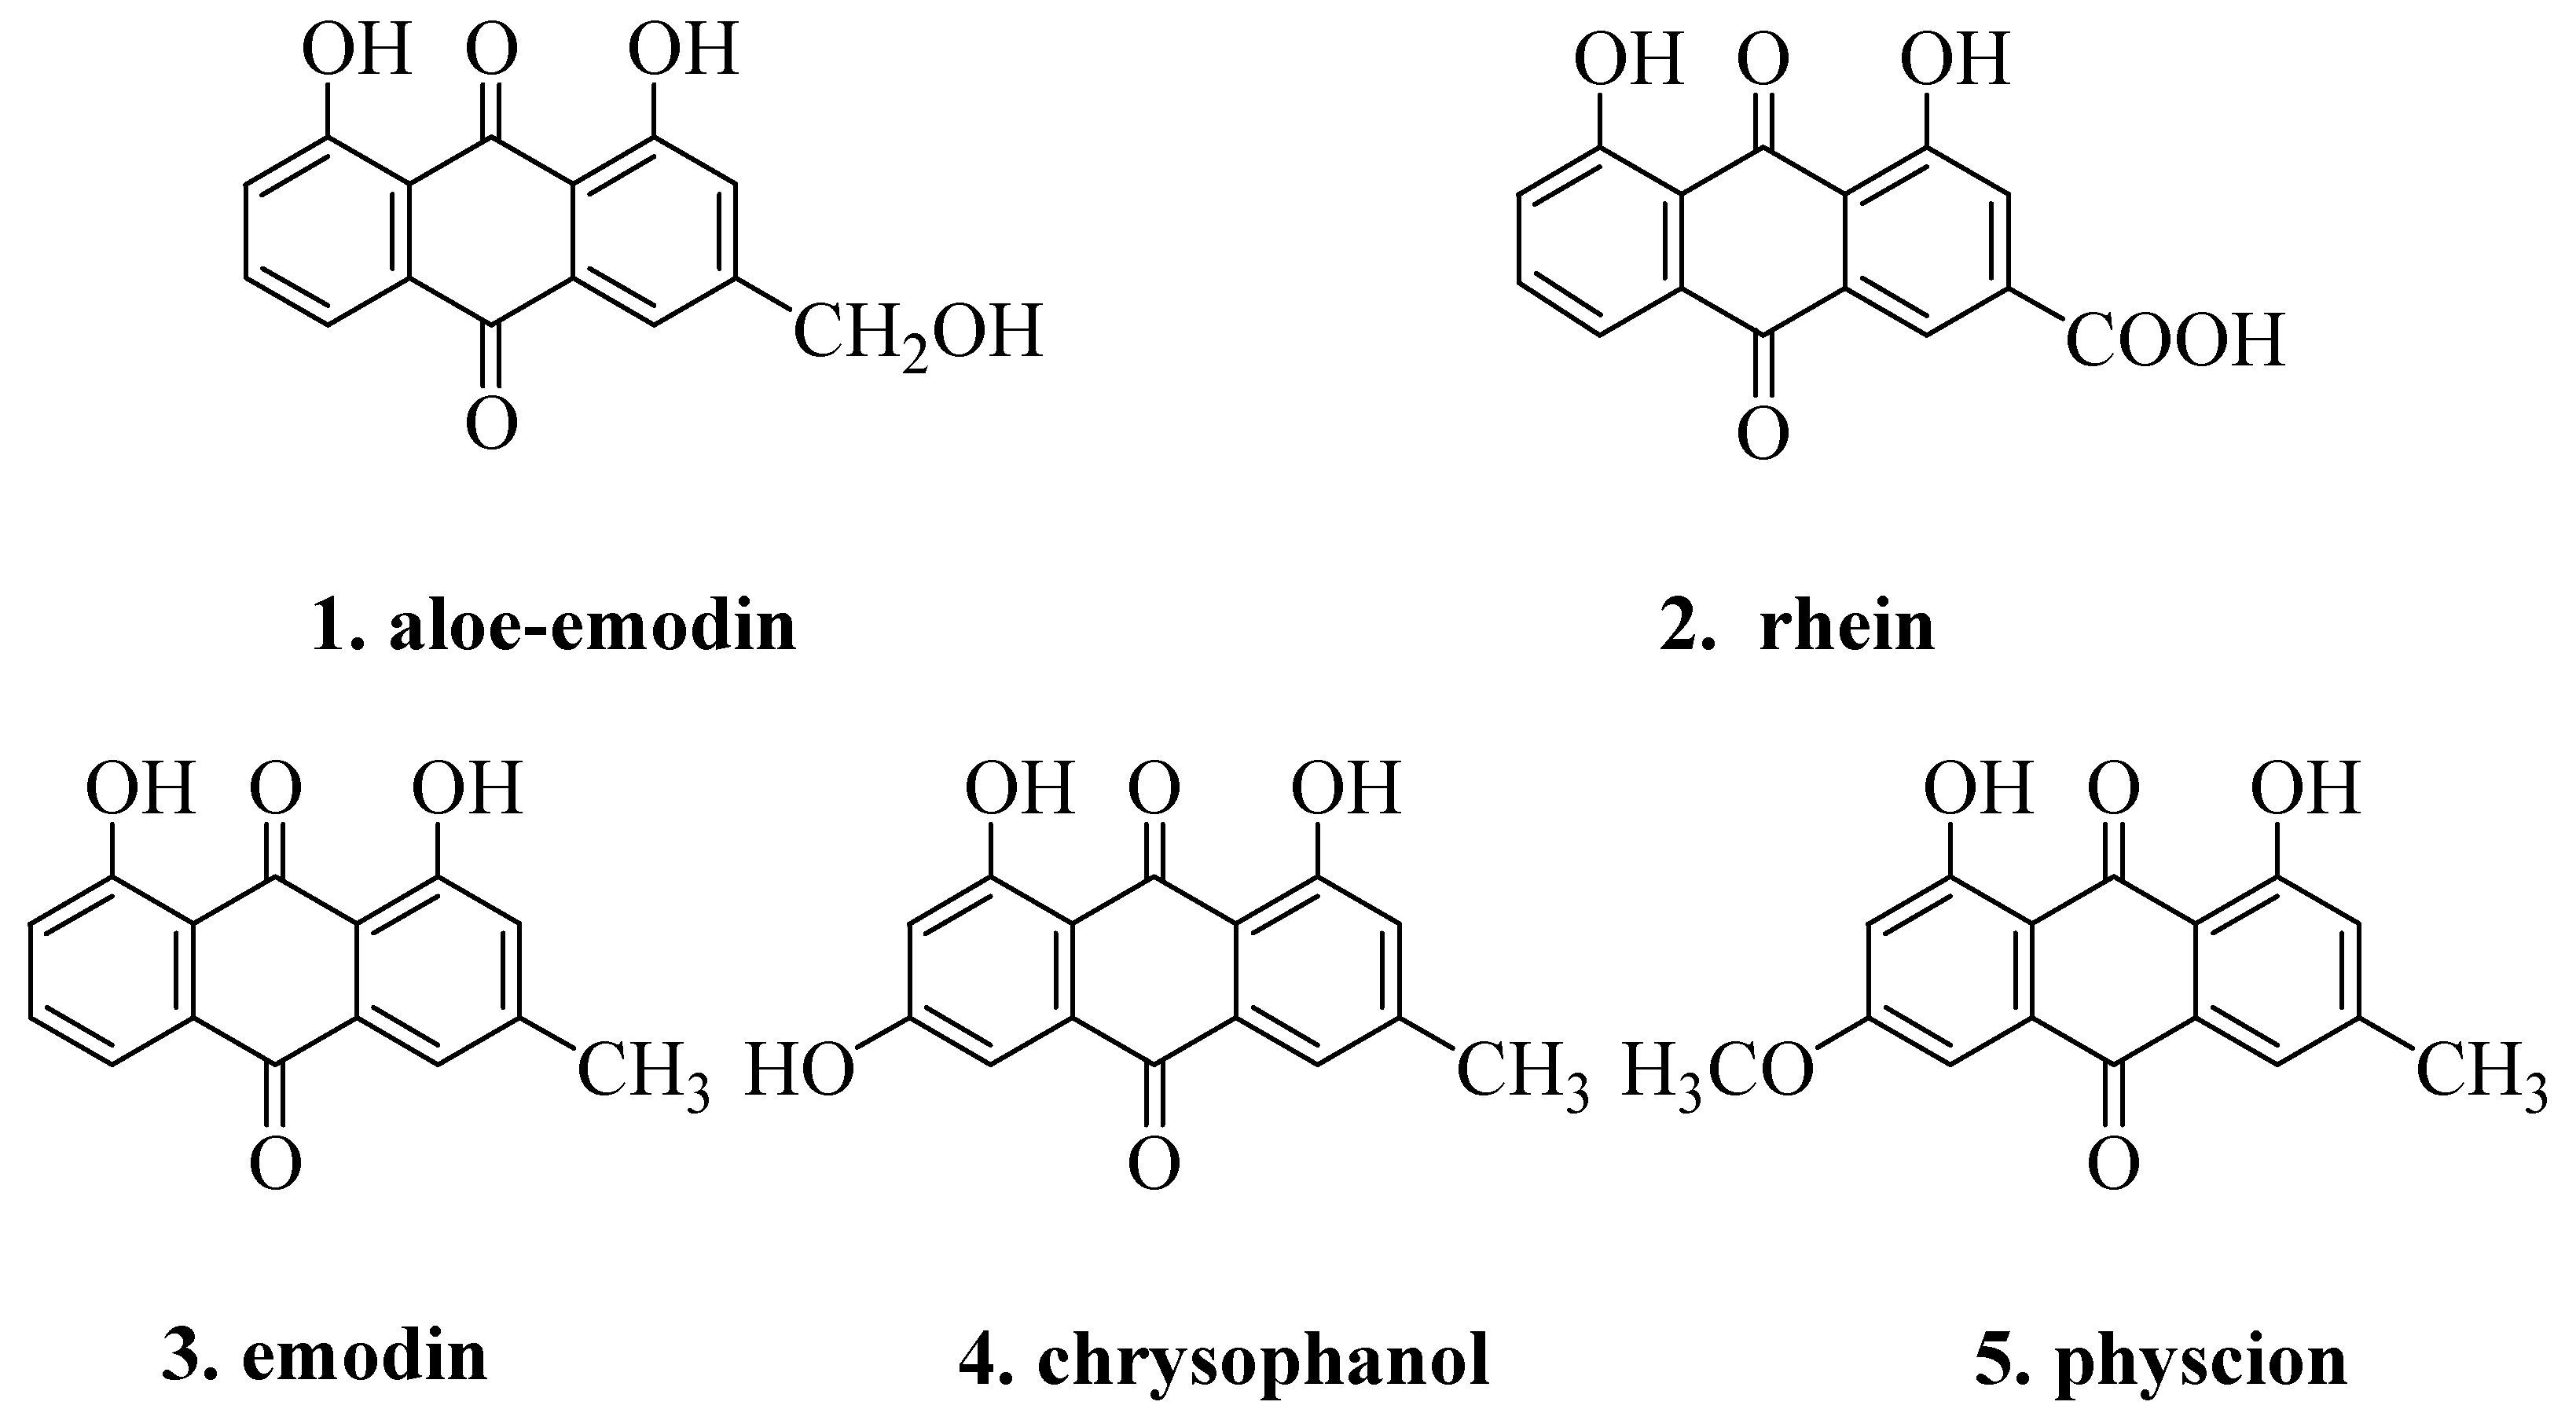
:1. Introduction

2. Results and Discussion
2.1. Model Fitting

| Run | Variables levels | Response (Y, mg/g) | ||
|---|---|---|---|---|
| X1, methanol (%) | X2, time (min) | X3, temperature (°C) | ||
| 1 | 30.00 | 10.00 | 60.00 | 13.78 |
| 2 | 100.00 | 10.00 | 60.00 | 16.33 |
| 3 | 30.00 | 50.00 | 60.00 | 16.01 |
| 4 | 100.00 | 50.00 | 60.00 | 16.45 |
| 5 | 30.00 | 30.00 | 30.00 | 14.32 |
| 6 | 100.00 | 30.00 | 30.00 | 15.75 |
| 7 | 30.00 | 30.00 | 90.00 | 15.13 |
| 8 | 100.00 | 30.00 | 90.00 | 16.89 |
| 9 | 65.00 | 10.00 | 30.00 | 13.79 |
| 10 | 65.00 | 50.00 | 30.00 | 15.51 |
| 11 | 65.00 | 10.00 | 90.00 | 15.22 |
| 12 | 65.00 | 50.00 | 90.00 | 16.25 |
| 13 | 65.00 | 30.00 | 60.00 | 17.28 |
| 14 | 65.00 | 30.00 | 60.00 | 17.21 |
| 15 | 65.00 | 30.00 | 60.00 | 17.42 |
| Source | Sum of squares | Degree of freedom | Mean square | F-value | Prob > F | |
|---|---|---|---|---|---|---|
| Model | 23.97 | 9 | 2.66 | 316.1 | < 0.0001 | significant |
| Residual | 0.059 | 7 | > 0.01 | |||
| Lack of fit | 0.031 | 3 | 0.01 | 1.48 | 0.3466 | not significant |
| Pure error | 0.028 | 4 | > 0.01 |
 ,
,  ,
,  ) and one interaction parameters (X1X2) were significant at the level of P < 0.0001, whereas the other interaction parameters (X1X3, X2X3) were insignificant (P > 0.1). The predicted second-order polynomial model was:
− 1.0 − 1.12
) and one interaction parameters (X1X2) were significant at the level of P < 0.0001, whereas the other interaction parameters (X1X3, X2X3) were insignificant (P > 0.1). The predicted second-order polynomial model was:
− 1.0 − 1.12
| Variables | Degree of freedom | Sum of squares | Mean square | F-values | p-value |
|---|---|---|---|---|---|
| X1 | 1 | 4.77 | 4.77 | 566.70 | < 0.0001 |
| X2 | 1 | 3.25 | 3.25 | 385.94 | < 0.0001 |
| X3 | 1 | 2.12 | 2.12 | 251.87 | < 0.0001 |
| X1X2 | 1 | 1.11 | 1.11 | 132.12 | < 0.0001 |
| X1X3 | 1 | 0.027 | 0.027 | 3.23 | 0.1153 |
| X2X3 | 1 | 0.12 | 0.12 | 14.13 | 0.0071 |
| | 1 | 1.87 | 1.87 | 222.19 | < 0.0001 |
| | 1 | 4.18 | 4.18 | 496.56 | < 0.0001 |
| | 1 | 5.25 | 5.25 | 623.33 | < 0.0001 |
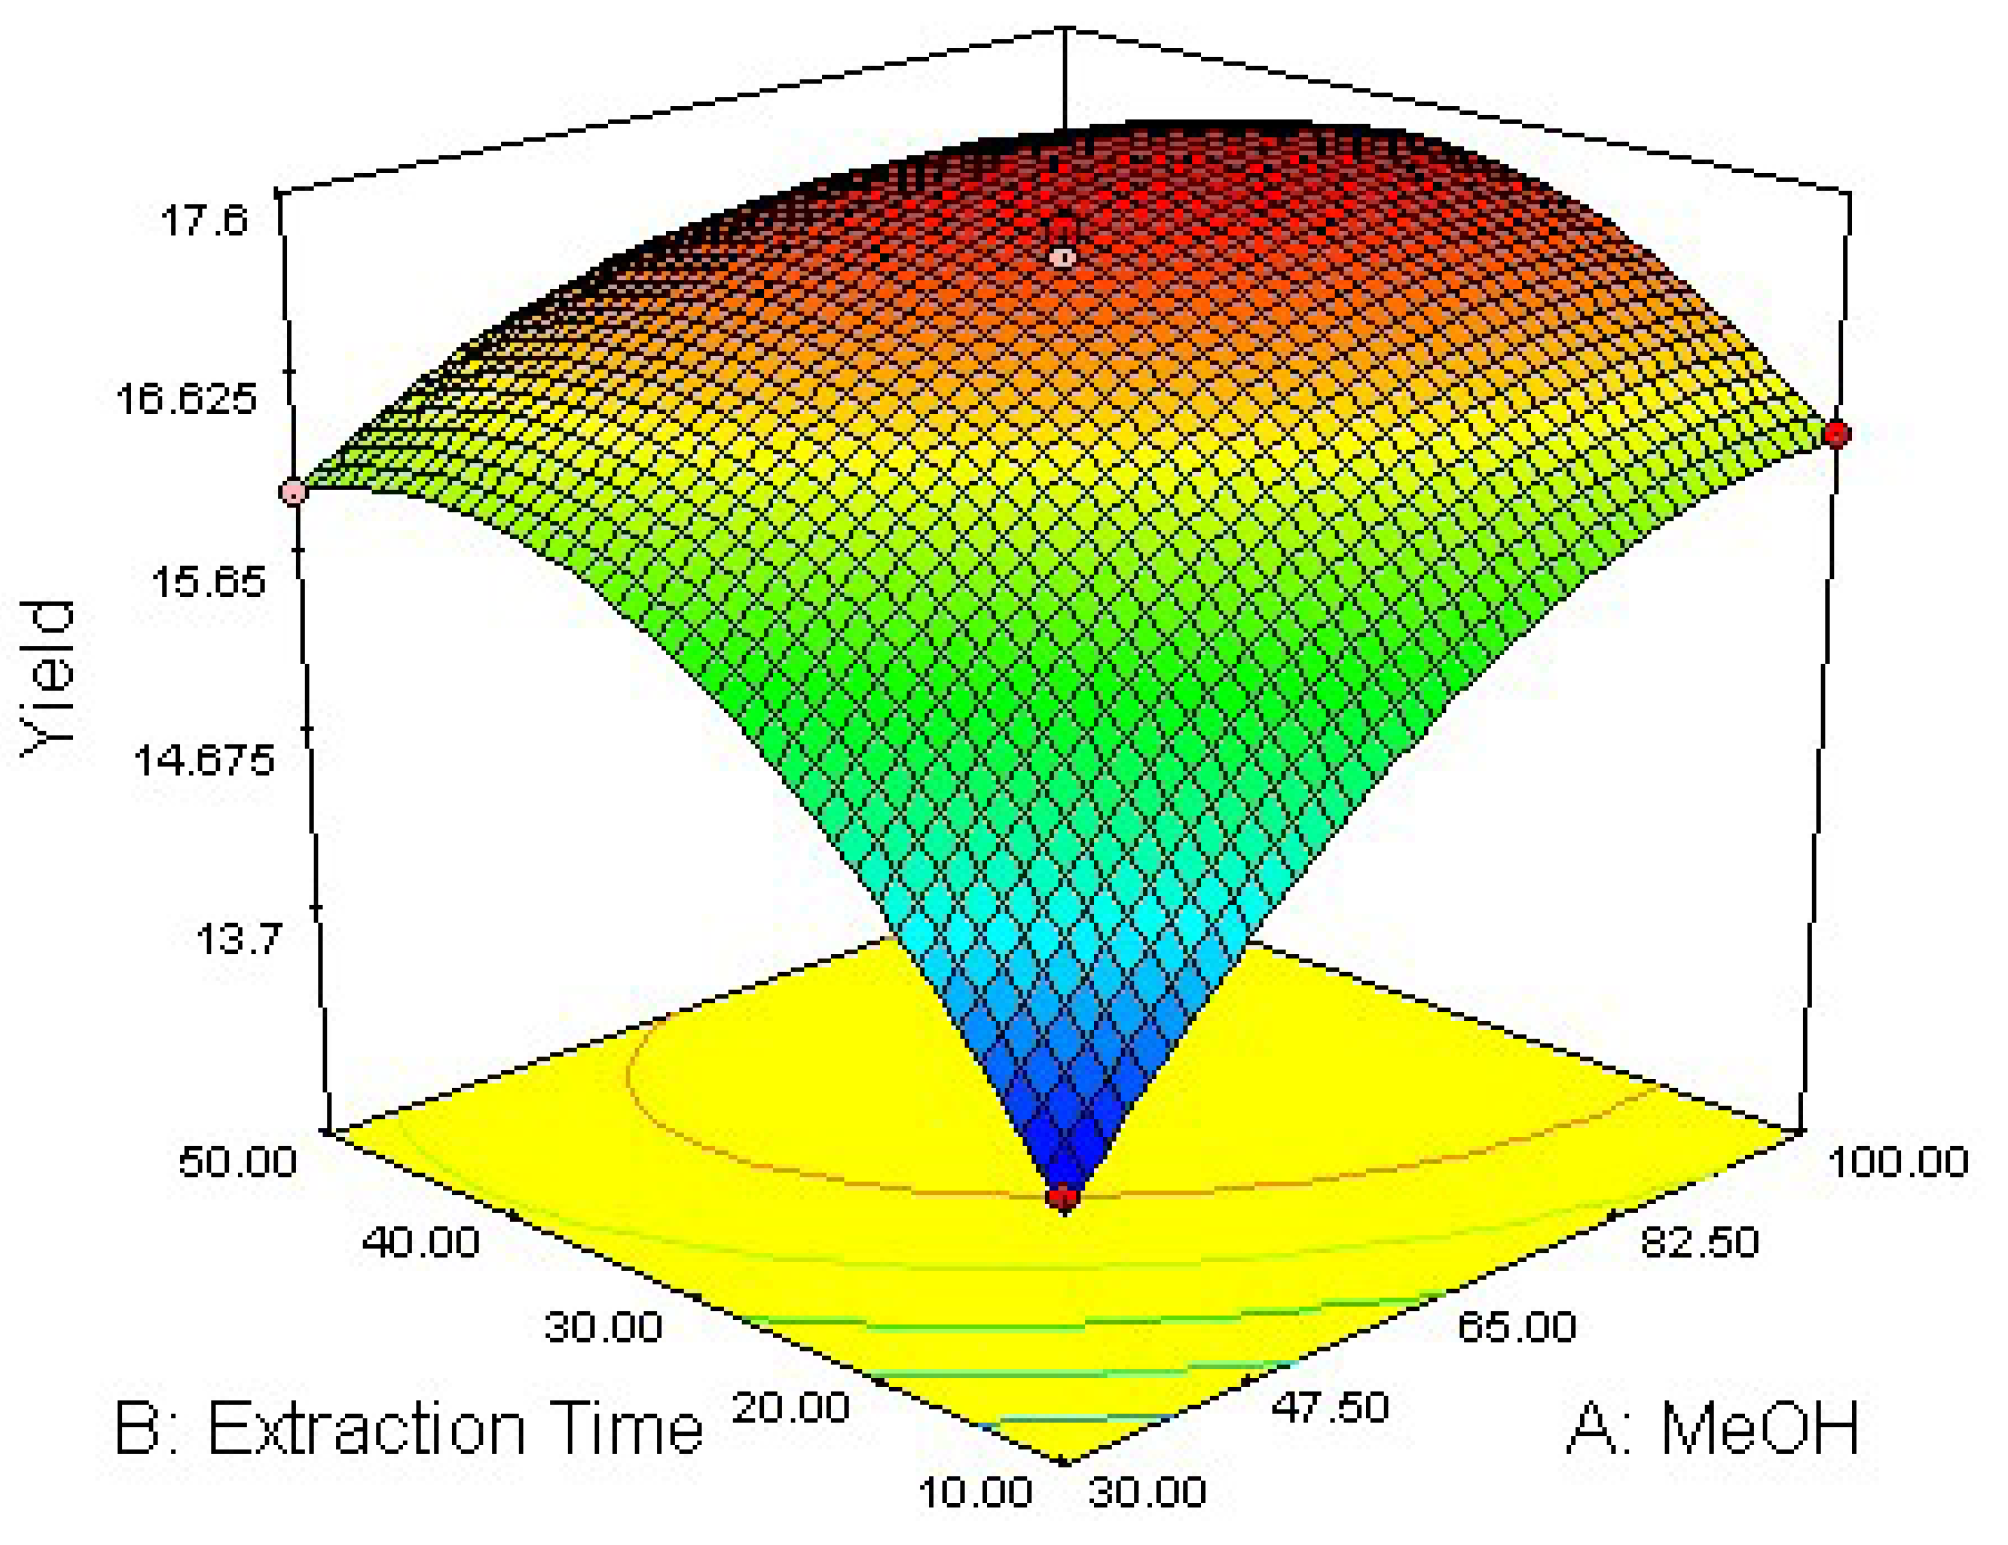
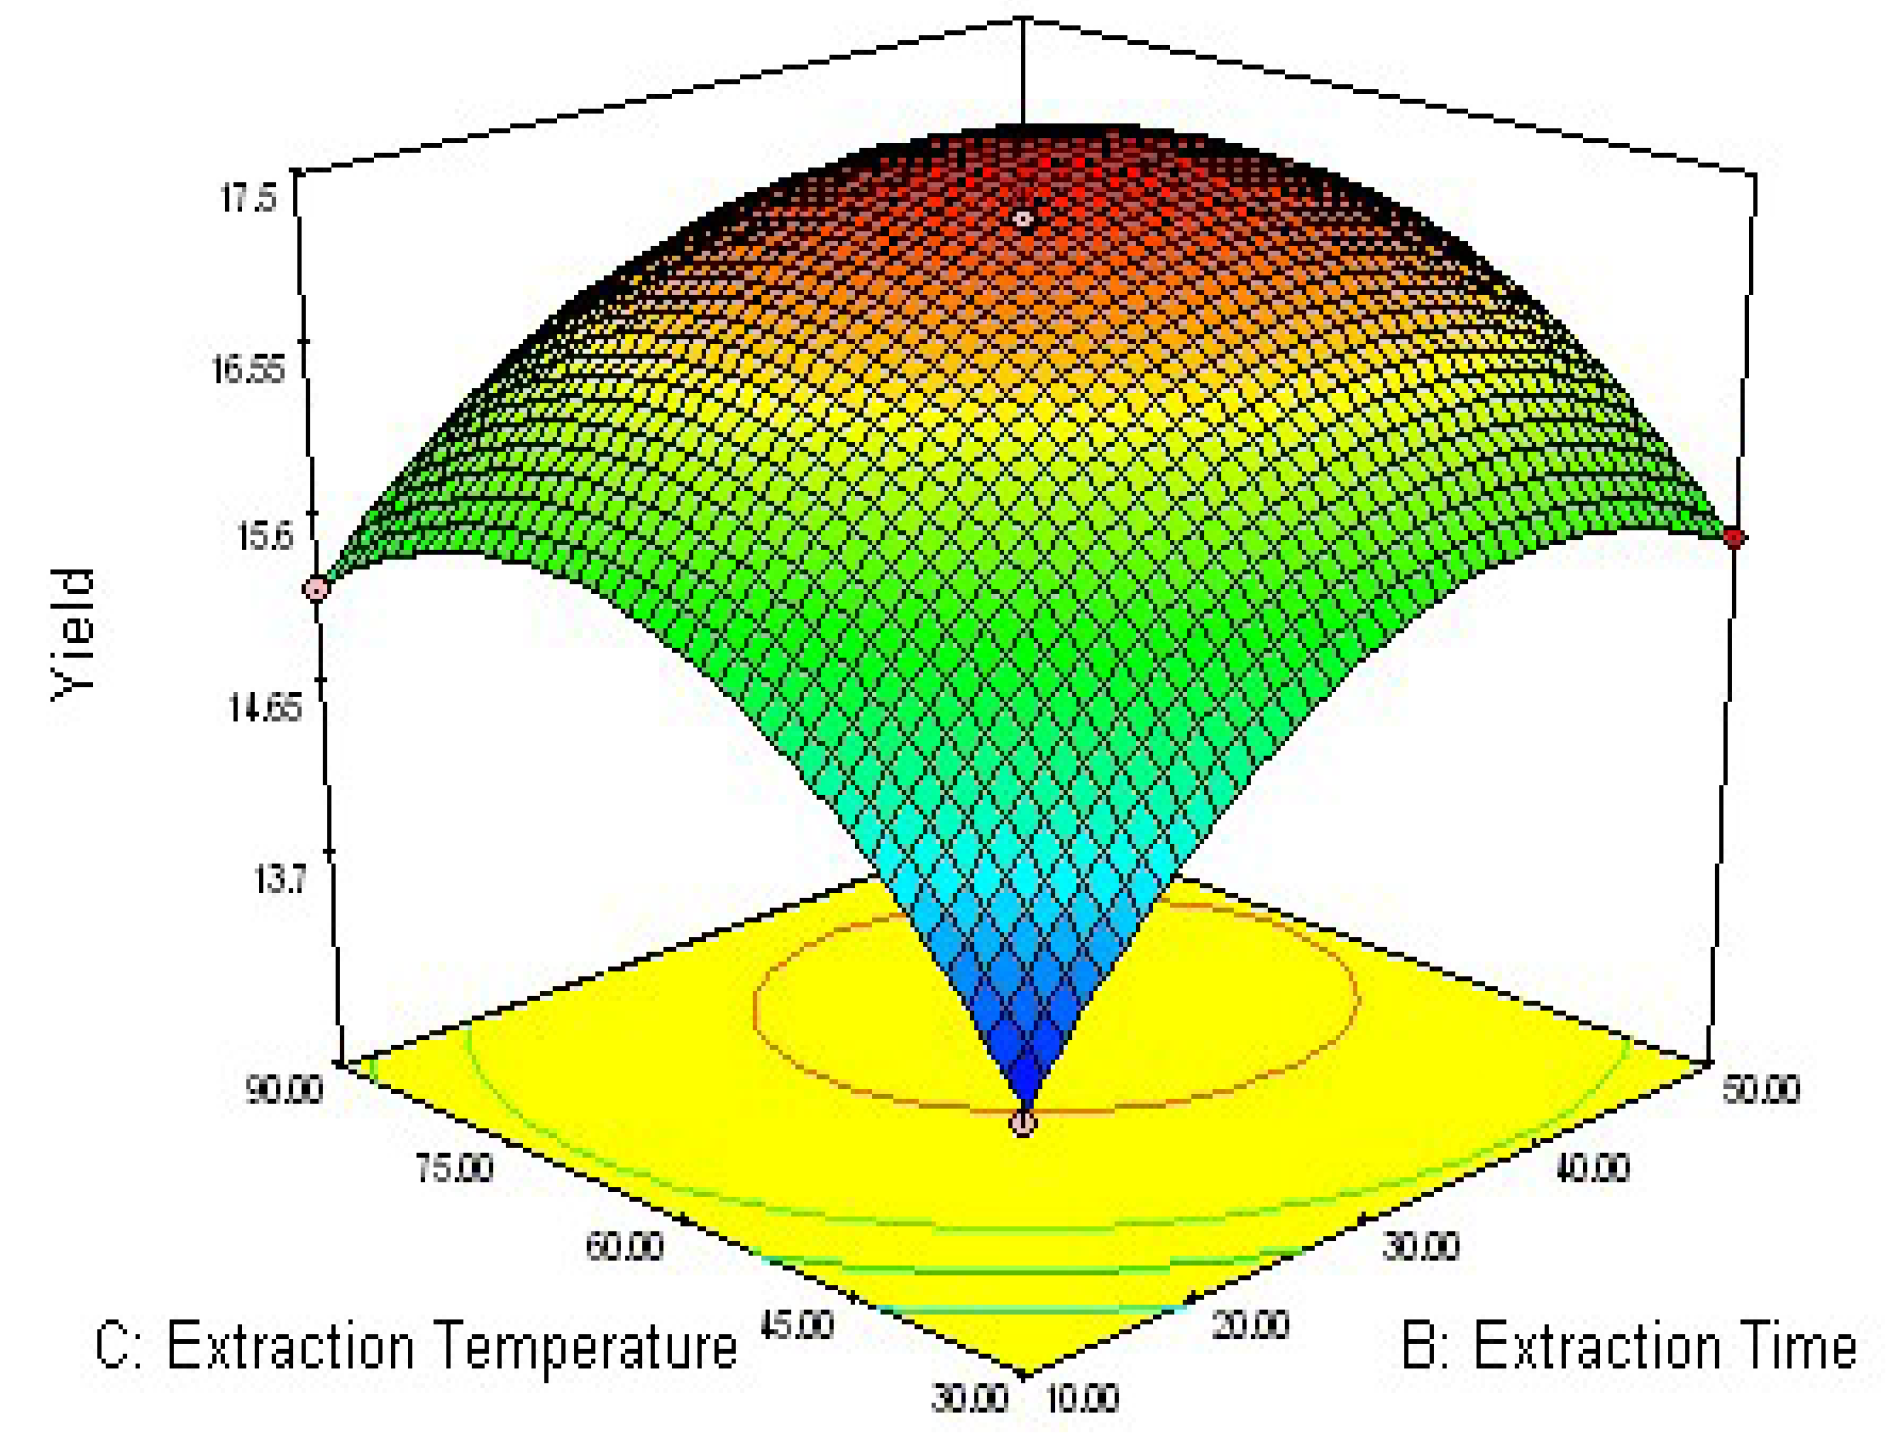
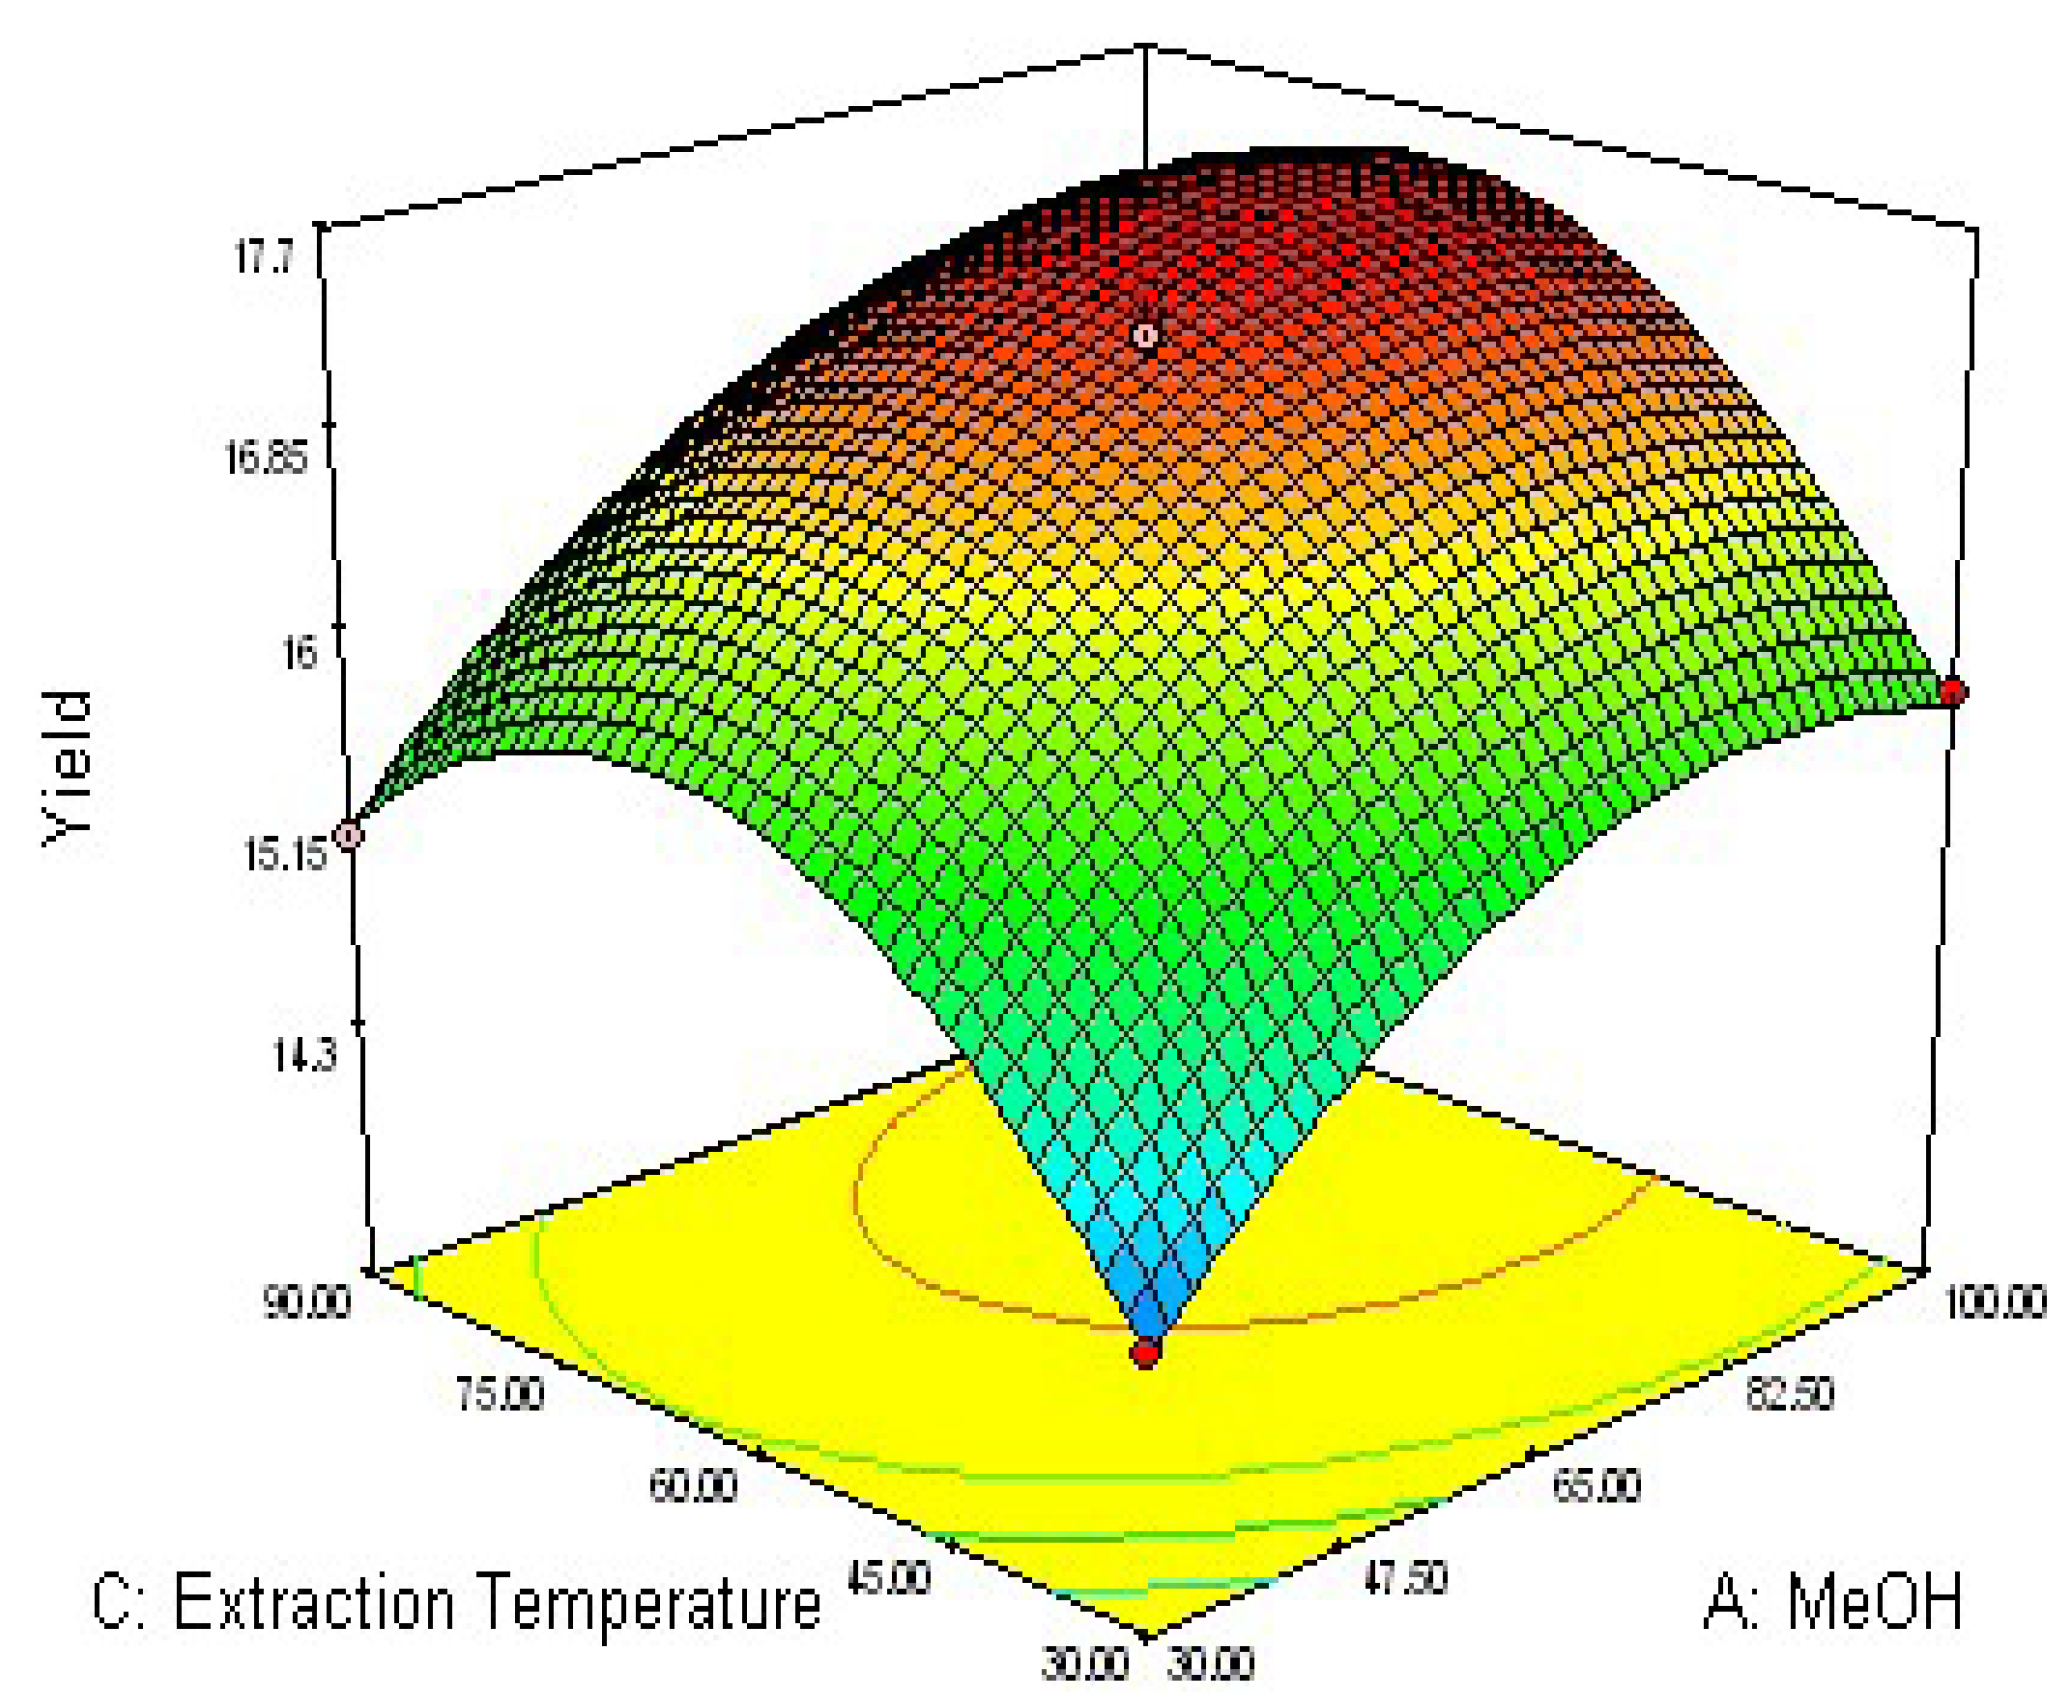
2.2. Response Surface Optimization of UAE Condition


2.3. Optimization of Extraction Parameters and Validation of the Model
| Methanol(%) | Extraction time (min) | Temperature (°C) | Yield of four anthraquinones | |
|---|---|---|---|---|
| Optimum conditions | 83.6 | 33.2 | 67.1 | 17.62 (predicted) |
| Modified conditions | 84.0 | 33.0 | 67.00 | 17.55 (actual) |
3. Experimental
3.1. Plant Material
3.2. Chemicals and Reagents
3.3. Ultrasound-Assisted Extraction
3.4. HPLC analysis of Anthraquinones
3.5. Experimental Design
3.6. Data Analysis
4. Conclusions
References and Notes
- Pharmacopoeia Commission of People’s Republic of China, Pharmacopoeia of the People's Republic of China; The Chemical Industry Press: Beijing, China, 2010.
- Chen, D.C.; Wang, L. Mechanisms of therapeutic effects of rhubarb on gut origin sepsis. Chin. J. Traumatol. 2009, 12, 365–369. [Google Scholar]
- Feng, S. Mechanism of Rhubarb in preventing the occurrence of gastrointestinal function failure. Zhongguo Zhong Xi Yi Jie He Za Zhi 2000, 20, 795–797. [Google Scholar]
- Barceloux, D.G. Rhubarb and oxalosis (Rheum species). Dis. Mon. 2009, 55, 403–411. [Google Scholar] [CrossRef]
- Chai, Y.F.; Ji, S.G.; Wu, Y.T.; Liang, D.S.; Xu, Z.M. The separation of anthraquinone derivatives of rhubarb by miceller electrokinetic capillary chromatography. Biomed. Chromatogr. 1998, 12, 193–195. [Google Scholar] [CrossRef]
- Zhou, X.; Song, B.; Jin, L.; Hu, D.; Diao, C.; Xu, G.; Zou, Z.; Yang, S. Isolation and inhibitory activity against ERK phosphorylation of hydroxyanthraquinones from rhubarb. Bioorg. Med. Chem. Lett. 2006, 16, 563–568. [Google Scholar]
- Ji, S.G.; Chai, Y.F.; Wu, Y.T.; Yin, X.P.; Xiang, Z.B.; Liang, D.S.; Xu, Z.M.; Li, X. Separation and determination of anthraquinone derivatives in rhubarb and its preparations by micellar electrokinetic capillary chromatography. Biomed. Chromatogr. 1998, 12, 335–337. [Google Scholar]
- Djozan, D.; Assadi, Y. Determination of anthraquinones in rhubarb roots; dock flowers and senna leaves by normal-phase high performance liquid chromatography. Talanta 1995, 42, 861–865. [Google Scholar] [CrossRef]
- Zhang, H.X.; Liu, M.C. Separation procedures for the pharmacologically active components of rhubarb. J. Chromatogr. B 2004, 812, 175–181. [Google Scholar]
- Shang, X.; Yuan, Z. Determination of active components in rhubarb and study of their hydrophobicity by micellar electrokinetic chromatography. Bioorg. Med. Chem. Lett. 2003, 13, 617–622. [Google Scholar] [CrossRef]
- Zhou, X.; Song, B.; Jin, L.; Hu, D.; Diao, C.; Xu, G.; Zou, Z.; Yang, S. Isolation and inhibitory activity against ERK phosphorylation of hydroxyanthraquinones from rhubarb. Bioorg. Med. Chem. Lett. 2006, 16, 563–568. [Google Scholar] [CrossRef]
- Wang, L.; Li, D.; Bao, C.; You, J.; Wang, Z.; Shi, Y.; Zhang, H. Ultrasonic extraction and separation of anthraquinones from Rheum palmatum L. Ultrason. Sonochem. 2008, 15, 738–746. [Google Scholar] [CrossRef]
- Fakhari, A.R.; Nojavan, S.; Ebrahimi, S.N.; Evenhuis, C.J. Optimized ultrasound-assisted extraction procedure for the analysis of opium alkaloids in papaver plants by cyclodextrin-modified capillary electrophoresis. J. Sep. Sci. 2010, 33, 2153–2159. [Google Scholar] [CrossRef]
- Tung, Y.T.; Chang, W.C.; Chen, P.S.; Chang, T.C.; Chang, S.T. Ultrasound-assisted extraction of phenolic antioxidants from Acacia confusa flowers and buds. J. Sep. Sci. 2011, 34, 844–851. [Google Scholar] [CrossRef]
- Garcia-Salas, P.; Morales-Soto, A.; Segura-Carretero, A.; Fernandez-Gutierrez, A. Phenolic-compound-extraction systems for fruit and vegetable samples. Molecules 2010, 15, 8813–8826. [Google Scholar] [CrossRef]
- Ma, Y.; Ye, X.; Hao, Y.; Xu, G.; Xu, G.; Liu, D. Ultrasound-assisted extraction of hesperidin from Penggan (Citrus reticulata) peel. Ultrason. Sonochem. 2008, 15, 227–232. [Google Scholar] [CrossRef]
- Wang, X.; Zhao, X.E.; Yang, B.; Dong, H.; Liu, D.; Huang, L. A combination of ultrasonic-assisted extraction with RRLC-QQQ method for the determination of artemisinin in the Chinese herb Artemisia annua L. Phytochem. Anal. 2011, 22, 280–284. [Google Scholar] [CrossRef]
- Liu, Q.; Zhang, X.; Zhou, Y.; Zhao, A.; Chen, S.; Qian, G.; Xu, Z.P. Optimization of fermentative biohydrogen production by response surface methodology using fresh leachate as nutrient supplement. Bioresour. Technol. 2011. [Google Scholar] [CrossRef]
- Zong, H.; He, Y.; Zhan, Y.; Du, J.; Feng, F.; Li, D. Optimization of medium constituents for varepsilon-poly-L-lysine fermentation with response surface methodology. J. Food Sci. 2010, 75, M552–M556. [Google Scholar] [CrossRef]
- Vaithanomsat, P.; Songpim, M.; Malapant, T.; Kosugi, A.; Thanapase, W.; Mori, Y. Production of β-glucosidase from a newly isolated aspergillus species using response surface methodology. Int. J. Microbiol. 2011. [Google Scholar] [CrossRef]
- Wu, J.; Wang, J.L.; Li, M.H.; Lin, J.P.; Wei, D.Z. Optimization of immobilization for selective oxidation of benzyl alcohol by Gluconobacter oxydans using response surface methodology. Bioresour. Technol. 2010, 101, 8936–8941. [Google Scholar] [CrossRef]
- Li, W.; Wang, Z.; Sun, Y.S.; Chen, L.; Han, L.K.; Zheng, Y.N. Application of response surface methodology to optimise ultrasonic-assisted extraction of four chromones in Radix Saposhnikoviae. Phytochem. Anal. 2011, 22, 313–321. [Google Scholar] [CrossRef]
- Borges, G.S.; Vieiraa, F.G.; Copettia, C.; Gonzagaa, L.V.; Fetta, R. Optimization of the extraction of flavanols and anthocyanins from the fruit pulp of Euterpe edulis using the response surface methodology. Food Res. Int. 2011, 44, 708–715. [Google Scholar] [CrossRef]
- Wu, J.; Lin, L.; Chau, F.T. Ultrasound-assisted extraction of ginseng saponins from ginseng roots and cultured ginseng cells. Ultrason. Sonochem. 2001, 8, 347–352. [Google Scholar] [CrossRef]
- Rostagno, M.A.; Palma, M.; Barroso, C.G. Ultrasound-assisted extraction of isoflavones from soy beverages blended with fruit juices. Anal. Chim. Acta 2007, 597, 265–272. [Google Scholar] [CrossRef]
- Sample Availability: Contact the authors.
© 2011 by the authors; licensee MDPI, Basel, Switzerland. This article is an open access article distributed under the terms and conditions of the Creative Commons Attribution license ( http://creativecommons.org/licenses/by/3.0/).
Share and Cite
Zhao, L.-C.; Liang, J.; Li, W.; Cheng, K.-M.; Xia, X.; Deng, X.; Yang, G.-L. The Use of Response Surface Methodology to Optimize the Ultrasound-Assisted Extraction of Five Anthraquinones from Rheum palmatum L. Molecules 2011, 16, 5928-5937. https://doi.org/10.3390/molecules16075928
Zhao L-C, Liang J, Li W, Cheng K-M, Xia X, Deng X, Yang G-L. The Use of Response Surface Methodology to Optimize the Ultrasound-Assisted Extraction of Five Anthraquinones from Rheum palmatum L. Molecules. 2011; 16(7):5928-5937. https://doi.org/10.3390/molecules16075928
Chicago/Turabian StyleZhao, Li-Chun, Jian Liang, Wei Li, Kun-Mu Cheng, Xianghua Xia, Xin Deng, and Geng-Liang Yang. 2011. "The Use of Response Surface Methodology to Optimize the Ultrasound-Assisted Extraction of Five Anthraquinones from Rheum palmatum L." Molecules 16, no. 7: 5928-5937. https://doi.org/10.3390/molecules16075928
APA StyleZhao, L.-C., Liang, J., Li, W., Cheng, K.-M., Xia, X., Deng, X., & Yang, G.-L. (2011). The Use of Response Surface Methodology to Optimize the Ultrasound-Assisted Extraction of Five Anthraquinones from Rheum palmatum L. Molecules, 16(7), 5928-5937. https://doi.org/10.3390/molecules16075928