Chemical Composition and In Vitro Activity of Plant Extracts from Ferula communis and Dittrichia viscosa against Postharvest Fungi


Abstract
:1. Introduction
2. Results and Discussion
2.1. Extracted Yield

| Plant species | Phenological phase | Plant extract abbreviation | Extracted yield (g/kg dw) |
|---|---|---|---|
| D. viscosa | Leaf-rosette | DvA | 76.4 |
| F. communis | Flowering | ||
| roots | FcR | 79.5 | |
| aerial part | FcA | 25.1** |
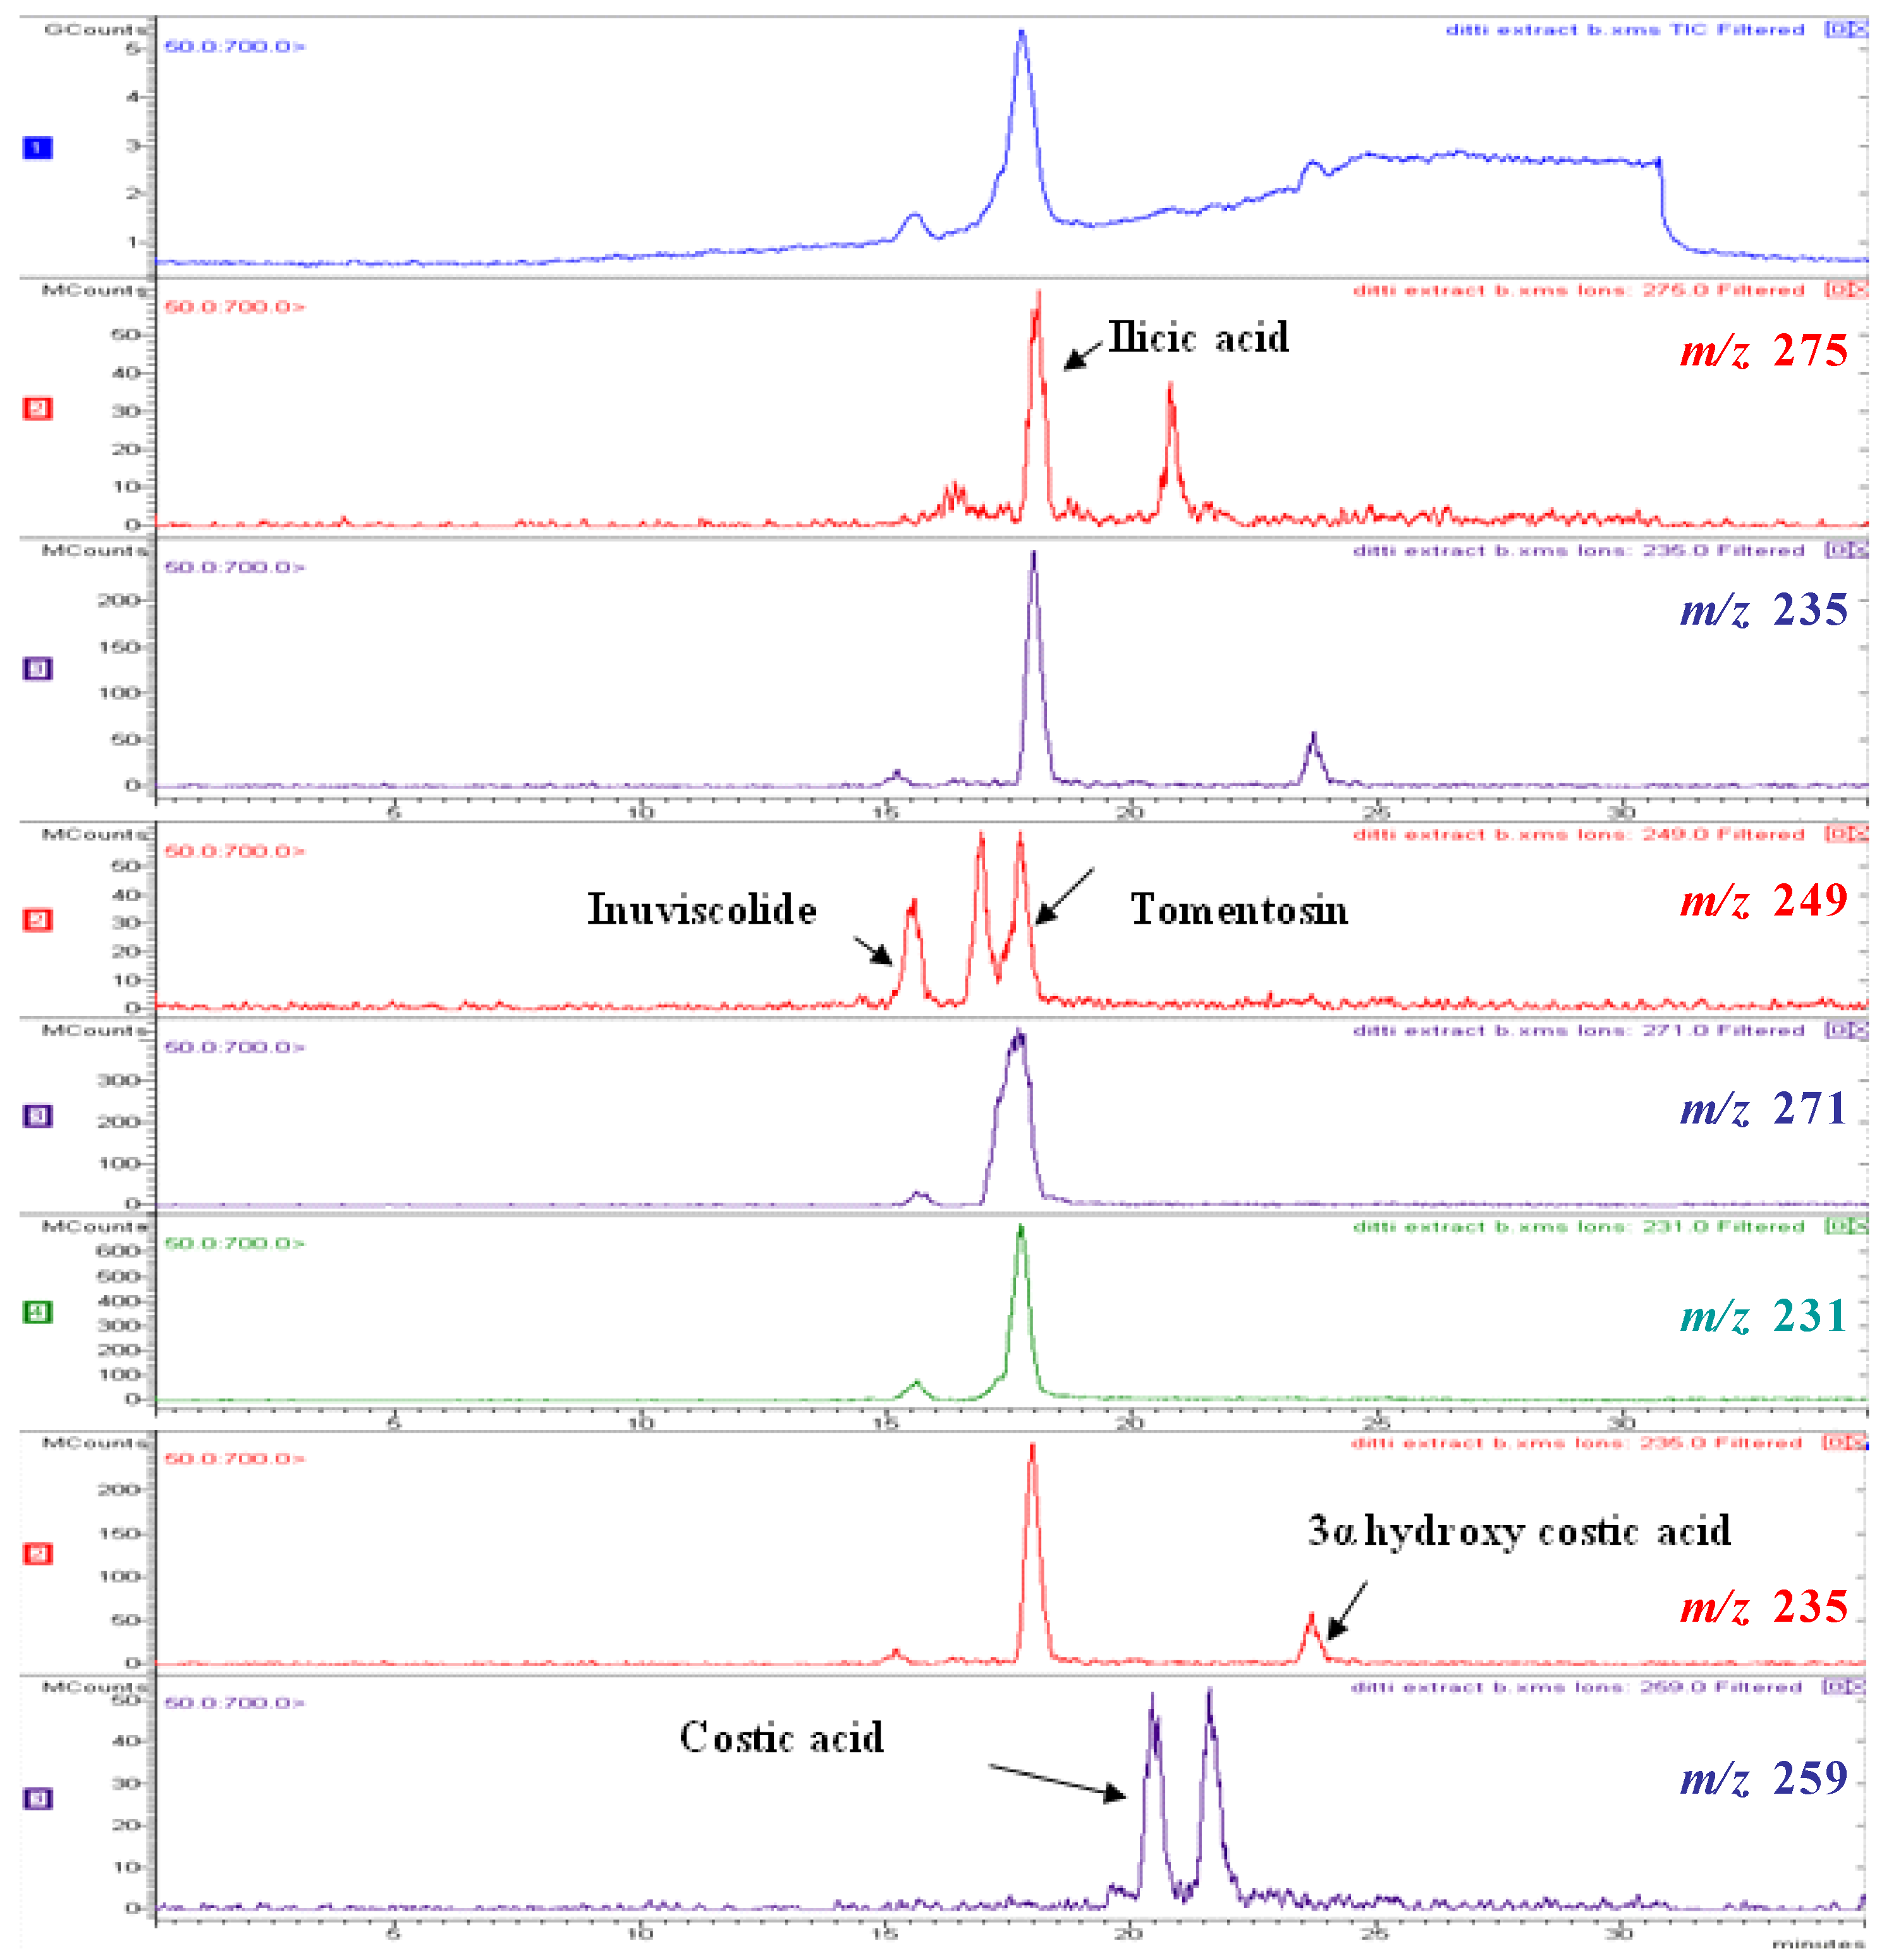
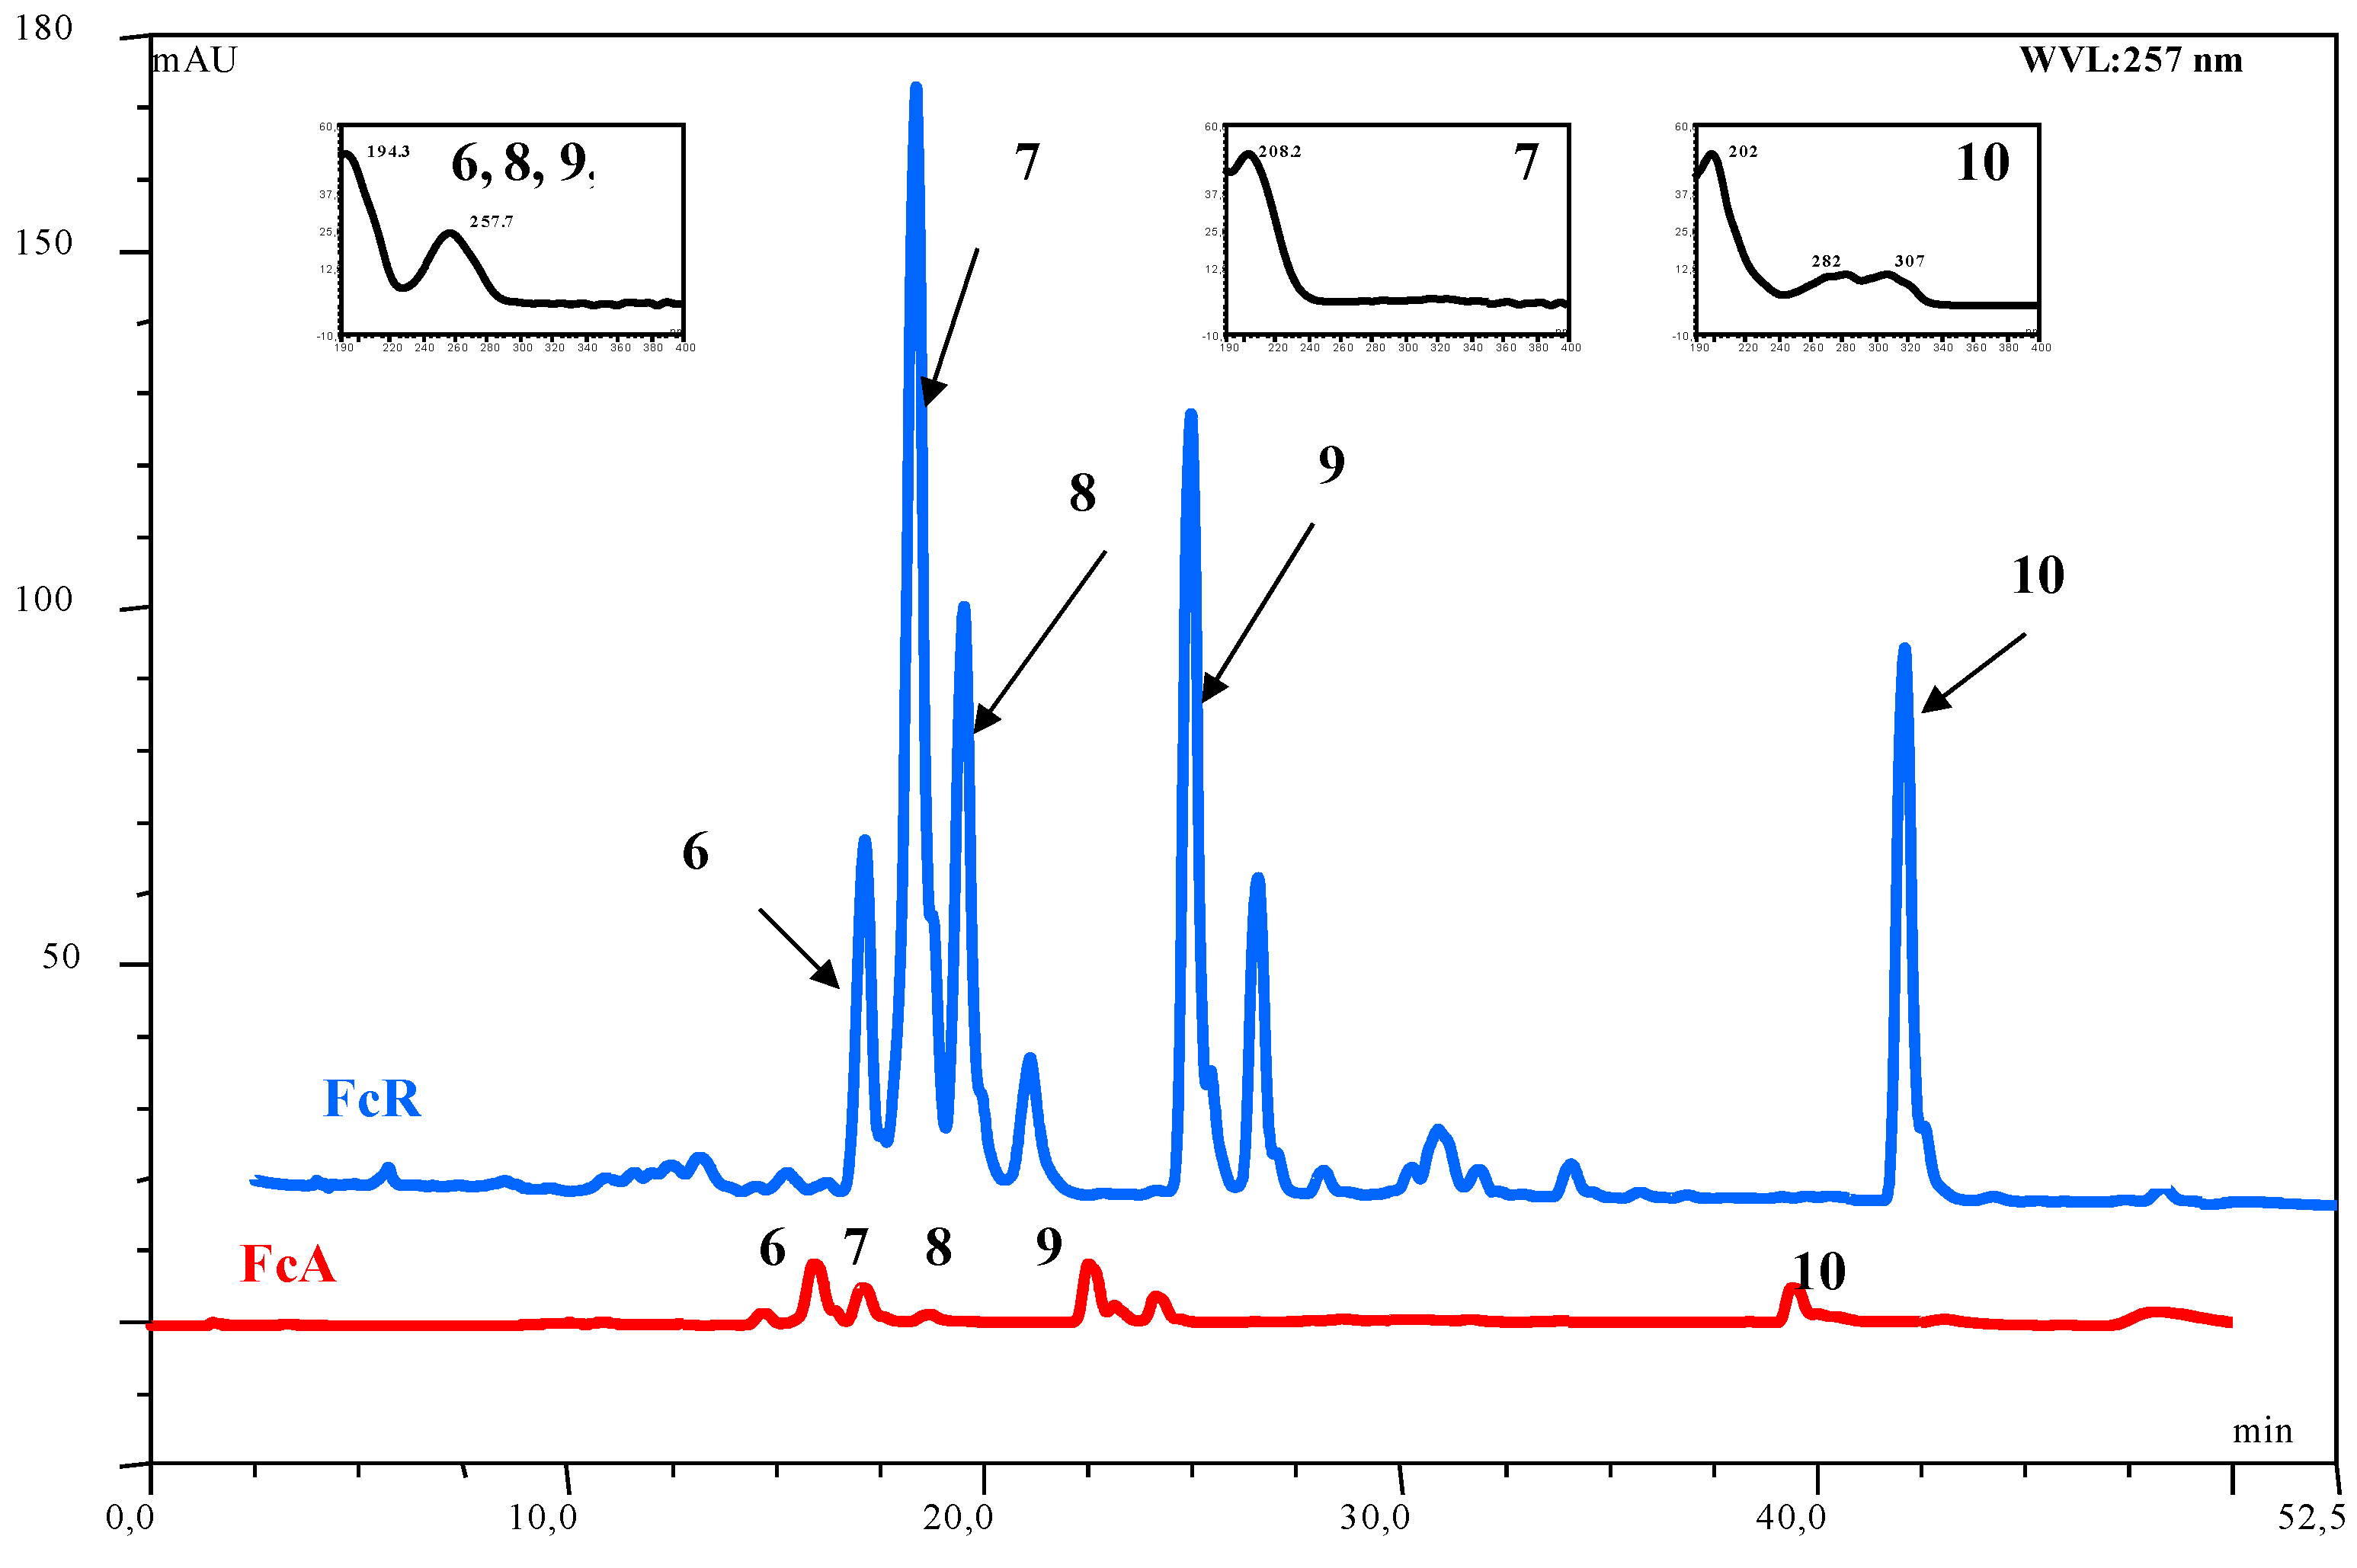
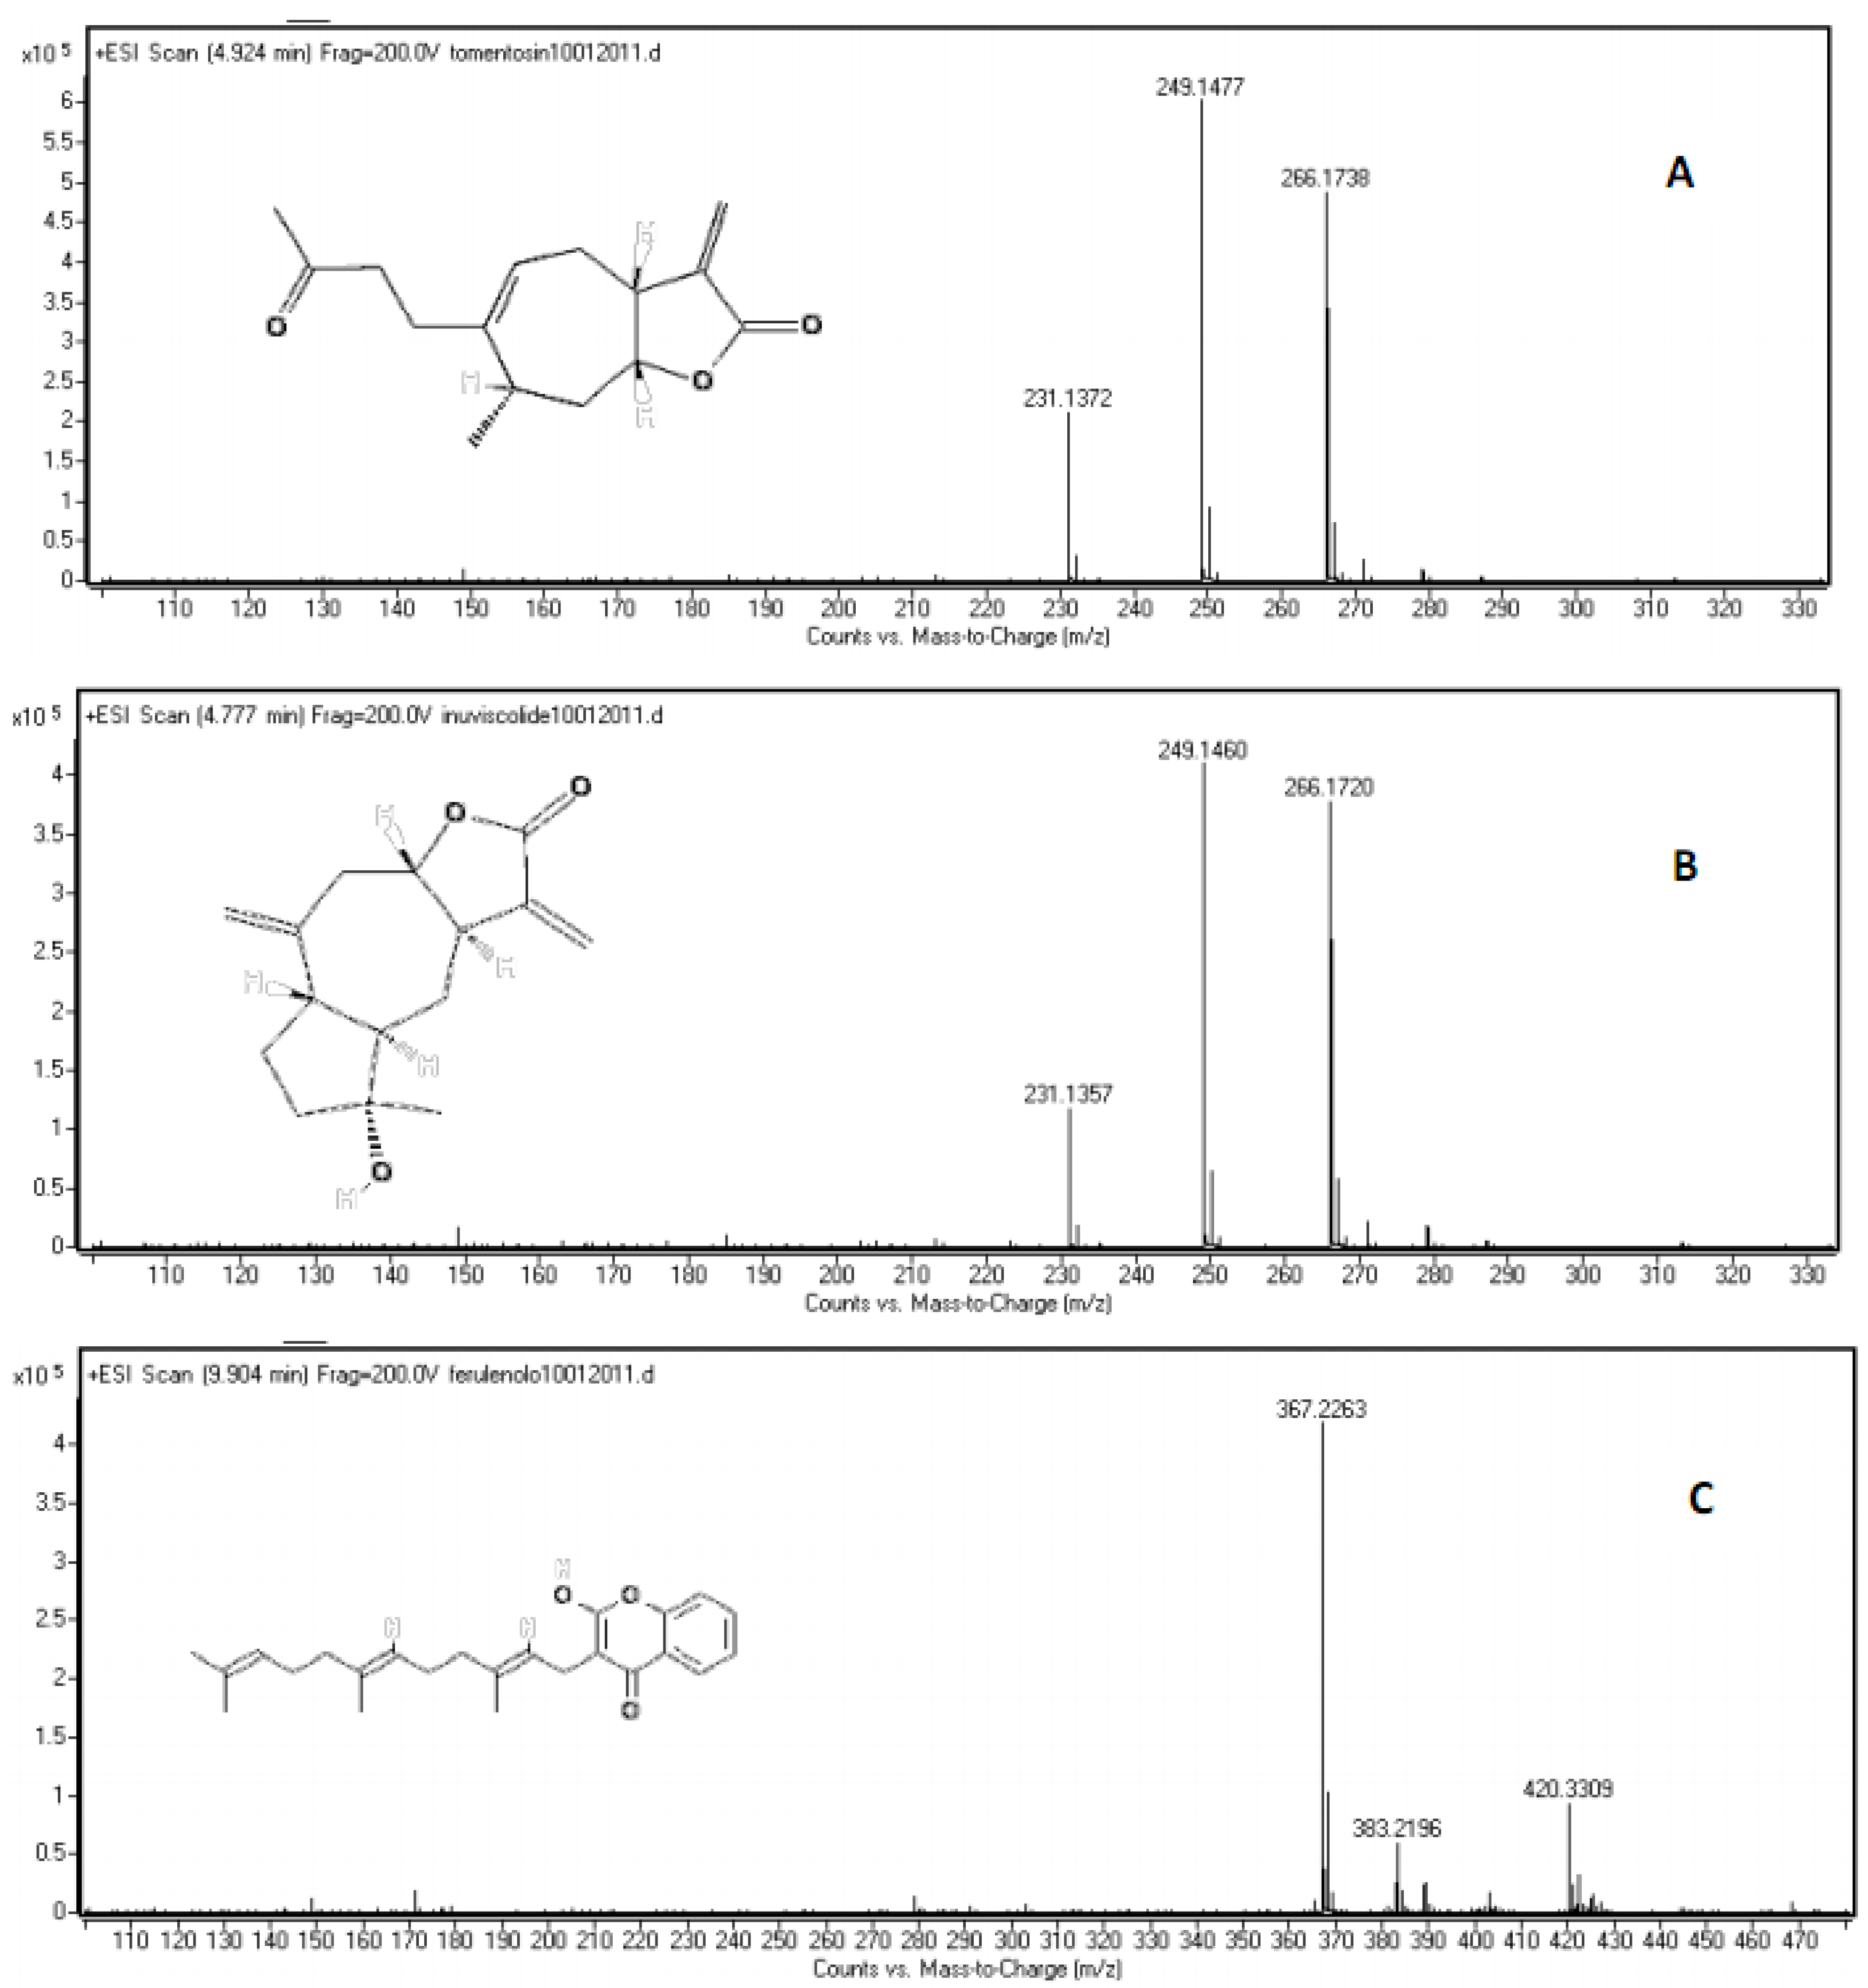
2.2. Chemical Composition
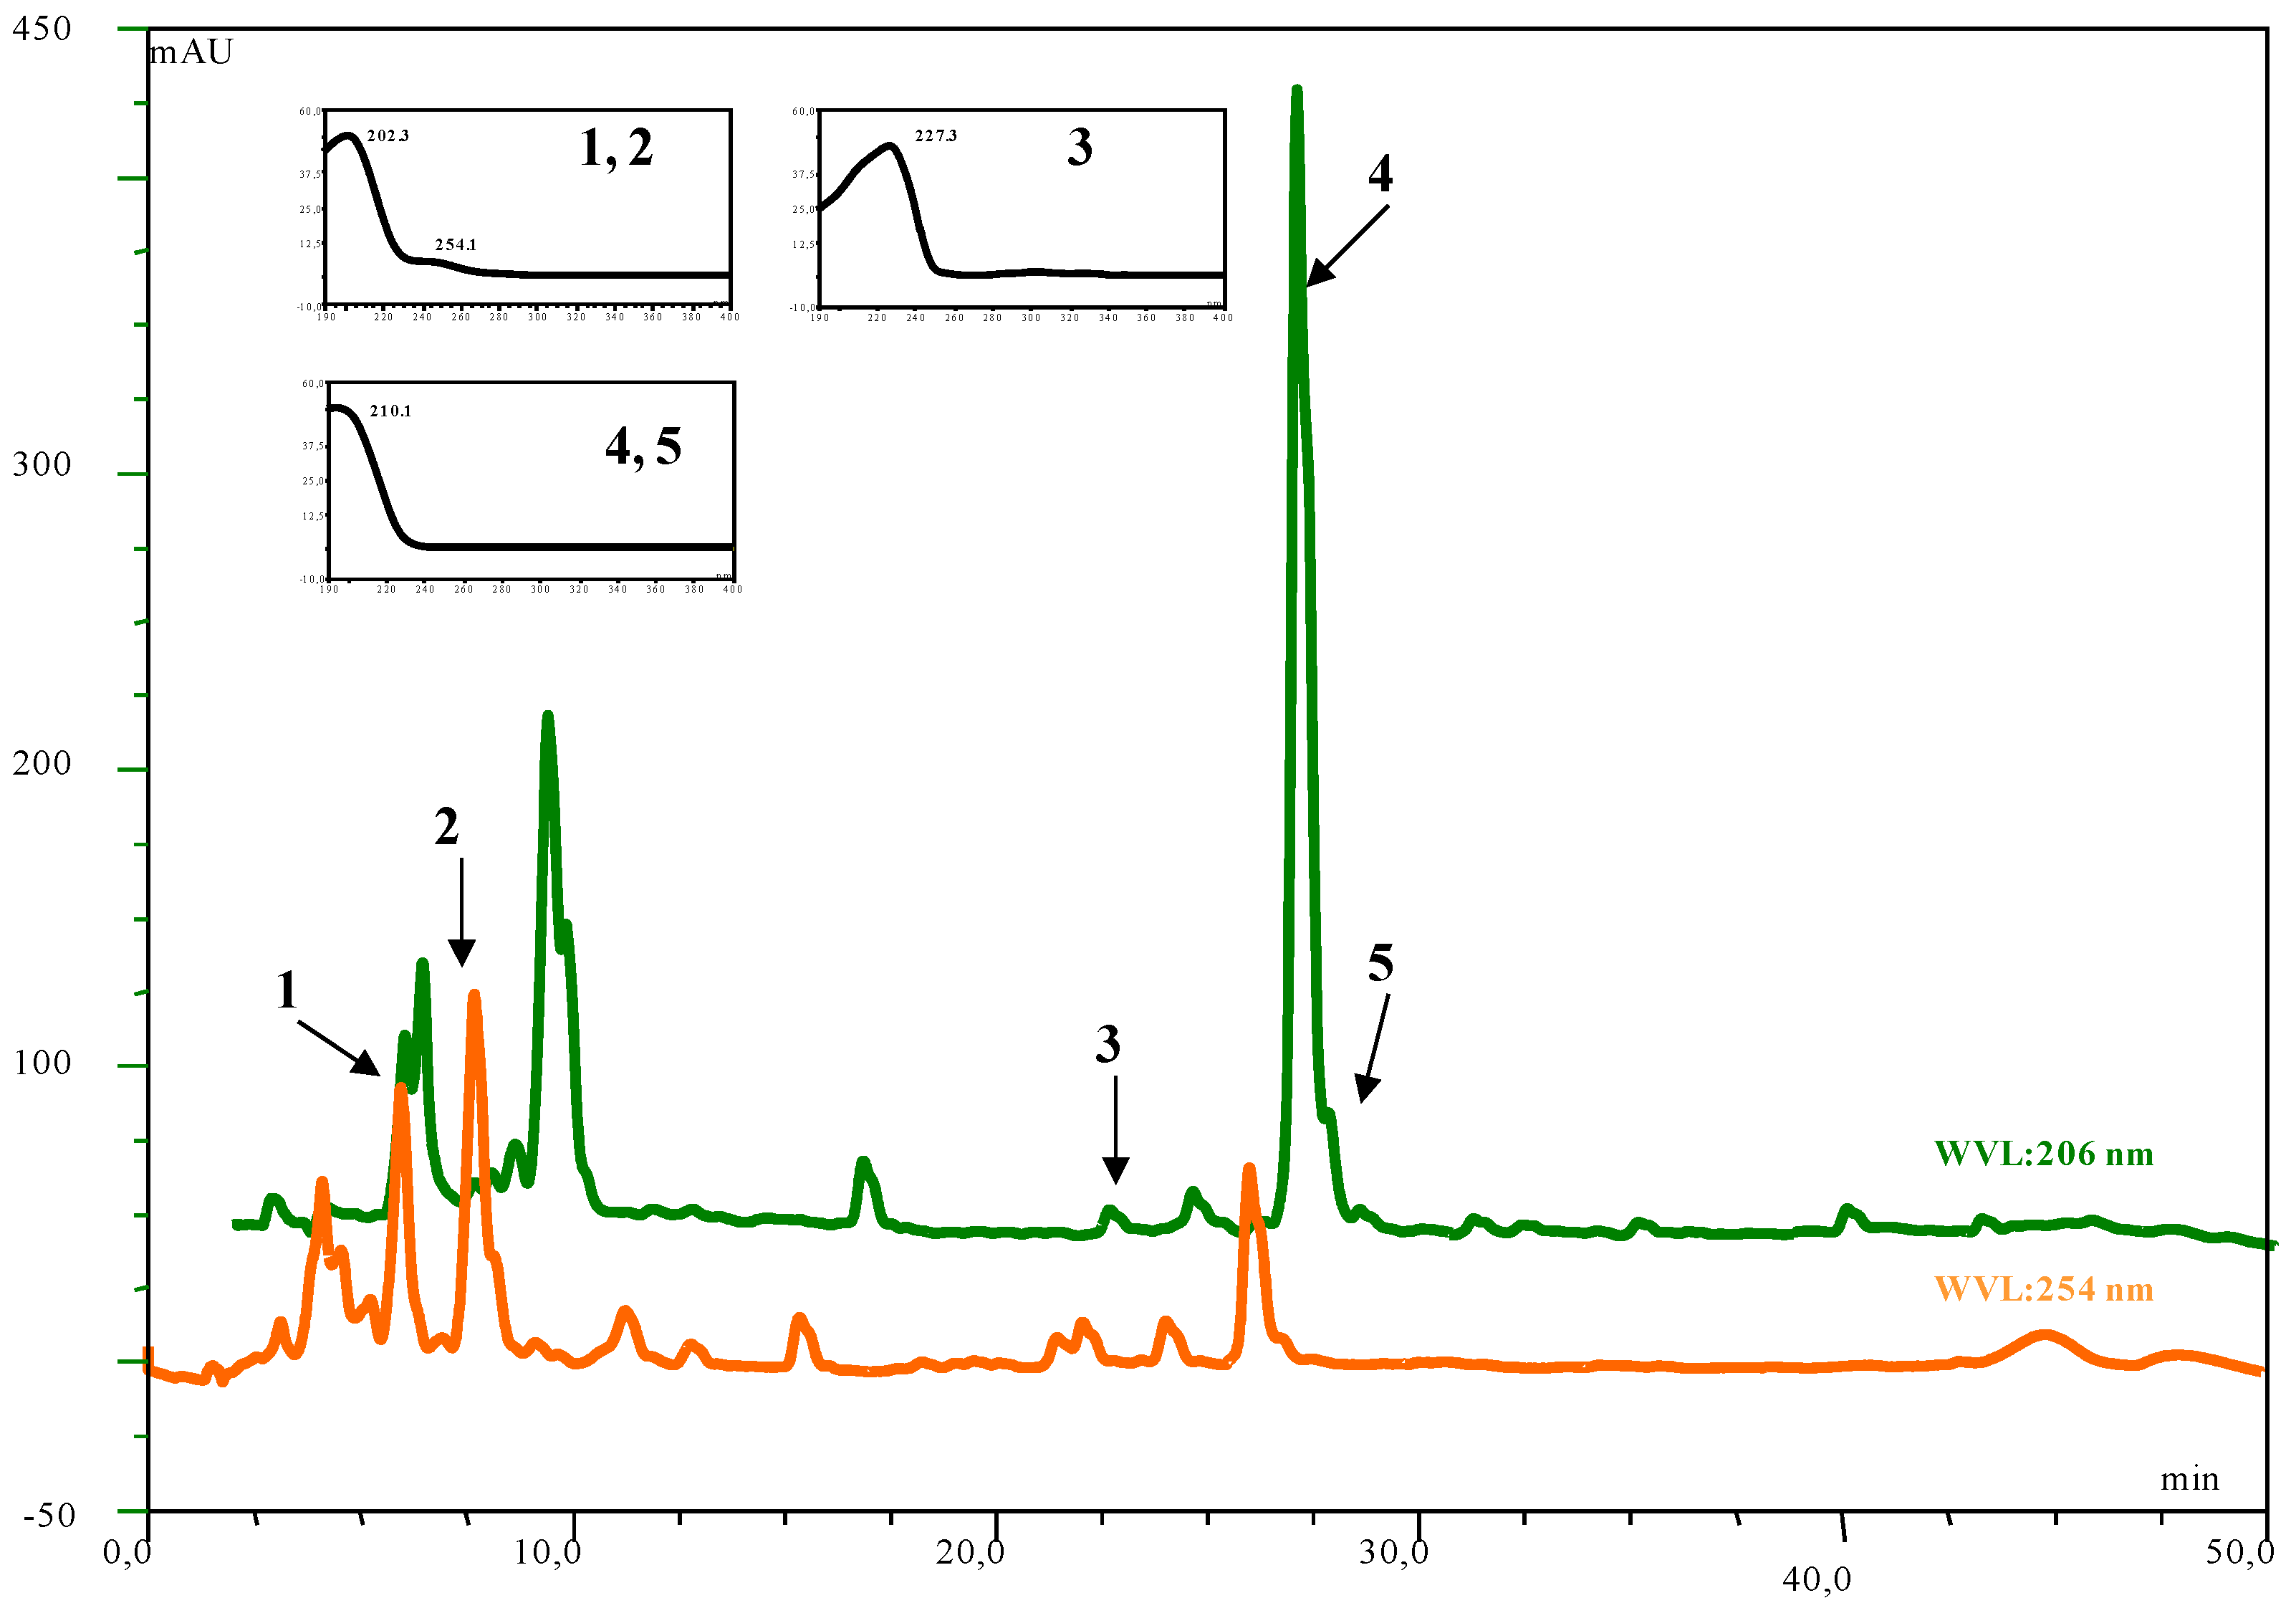

| Compound | Number | λ max | mol. wt. | LC-MS (ESI) m/z (amu) |
|---|---|---|---|---|
| inuviscolide | 1 | 225, 254 | 248 | 231 [M-H2O+H]+; 249 [M+H]+; 271 [M +Na]+ |
| tomentosin | 2 | 254 | 248 | 231 [M-H2O+H]+; 249 [M+H]+; 271 [M +Na]+; 247 [M-H]- |
| ilicic acid | 3 | 227 | 252 | 275 [M+Na]+; 235 [M-H2O+H]+ ; 251 [M-H]- |
| costic acid | 4 | 210 | 234 | 235 [M+H]+ |
| 3α-hydroxycostic acid | 5 | 210 | 251 | 274 [M+Na]+ |
| Compound | Molecular formula | r. t. (min.) | Log P* | Calculated mass (amu) [M+H]+ | Measured mass (amu) [M+H]+ | Error (ppm) |
|---|---|---|---|---|---|---|
| inuviscolide | C15H20O3 | 4.628 | 2.15 | 249.1485 | 249.1454 | 10.03418 |
| tomentosin | C15H20O3 | 4.775 | 1.56 | 249.1485 | 249.1477 | 3.210936 |
| ferulenol | C24H30O3 | 10.020 | 5.68 | 367.2268 | 367.2263 | 1.361556 |

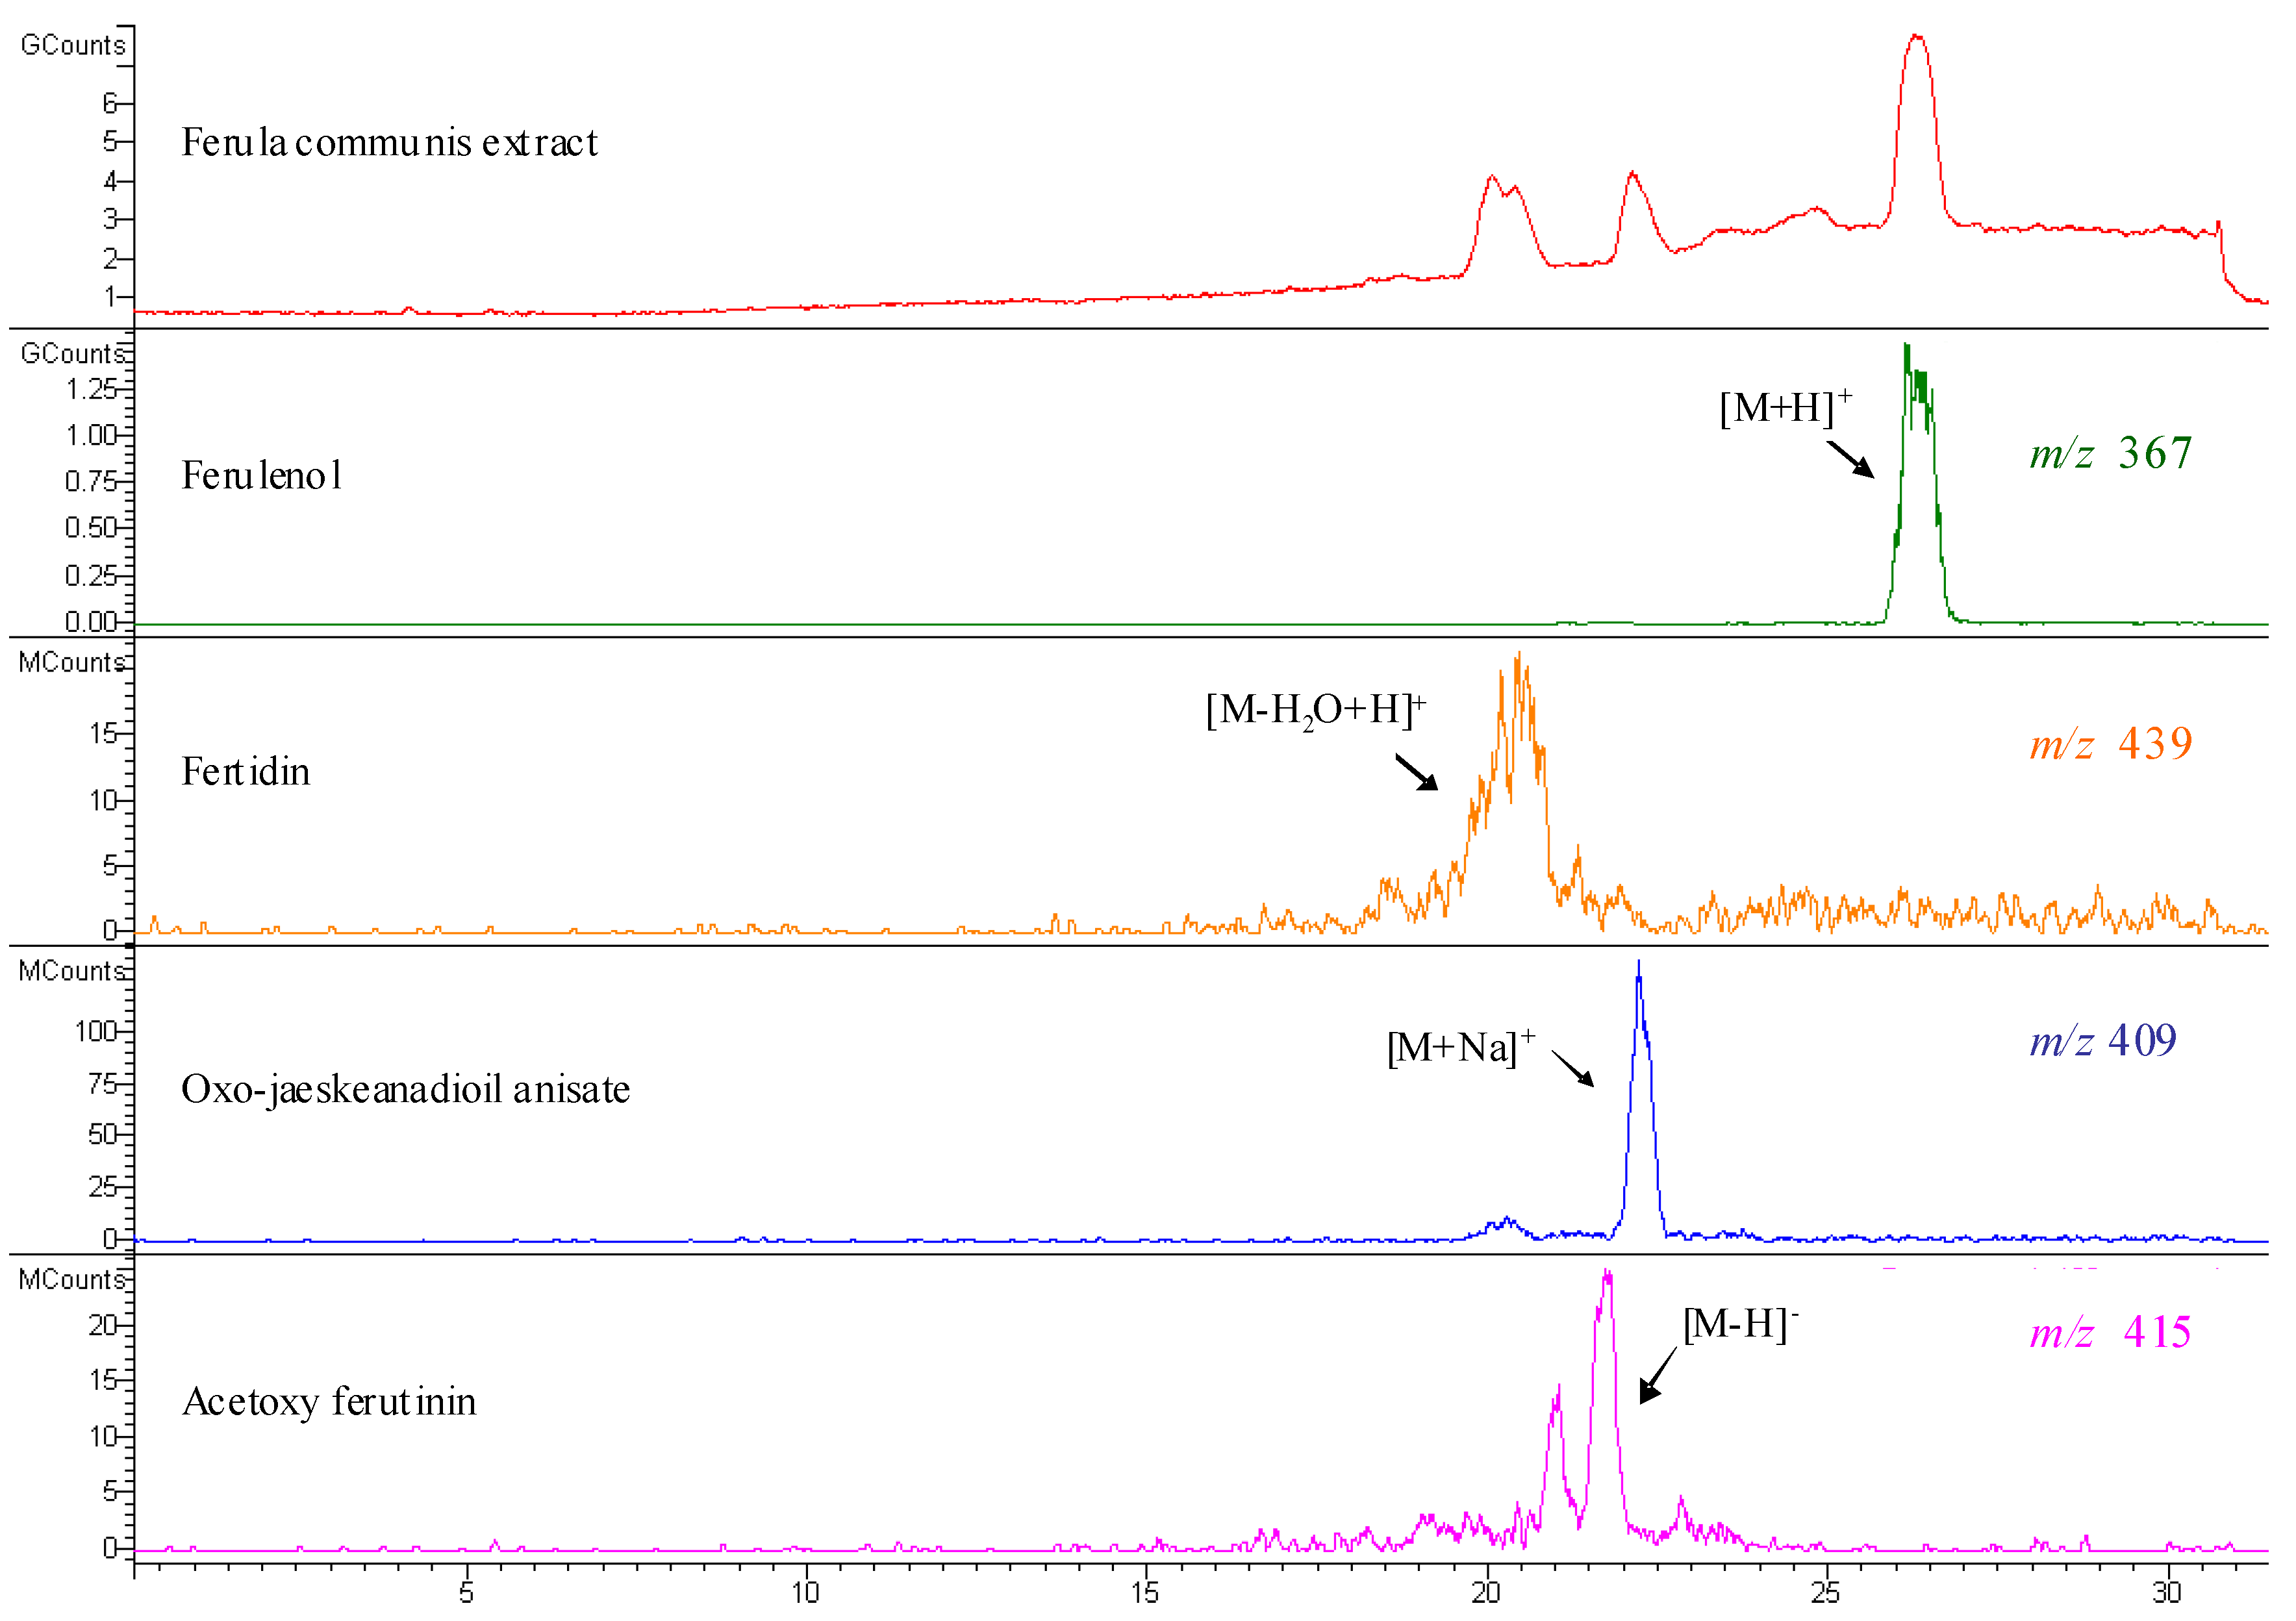
| Compound | Number | λ max | mol. wt. | LC-MS (ESI) m/z (amu) |
|---|---|---|---|---|
| acetoxy ferutinin | 6 | 257 | 416 | 415 [M-H]- |
| oxojaeskeanadioyl anisate | 8 | 257 | 386 | 409 [M+Na]+ |
| fertidin | 9 | 257 | 456 | 439 [M-H2O+H]+ |
| ferulenol | 10 | 202, 282, 307 | 366 | 367 [M+H]+; 365 [M-H]-; 389 [M+Na]+ |

| Extract | Compounds | |||
|---|---|---|---|---|
| inuviscolide | tomentosin | ferulenol | others | |
| (mg/g extract) | (%) | |||
| DvA | 42.68 | 205.80 | - | 75.15 |
| FcR | - | - | 88.40 | 91.16 |
| FcA | - | - | 28.20 | 97.18 |
2.3. Antifungal Activities
| Extracts | Aspergillius spp. | B. fuckeliana | P. expansum | P. digitatum | M. laxa | M. fructigena | ||||||
|---|---|---|---|---|---|---|---|---|---|---|---|---|
| M | C | M | C | M | C | M | C | M | C | M | C | |
| DvA | >400 | 371 | 153 | 192 | >400 | 201 | 154 | 83 | 25 | 106 | 29 | 94 |
| (nd) | (400) | (400) | (400) | (400) | (400) | (200) | (300) | (200) | (300) | |||
| FcR | >400 | nd | 136 | >400 | >400 | nd | >400 | >400 | 202 | nd | 75 | nd |
| (400) | (400) | (400) | ||||||||||
| FcA | >400 | ─ | >400 | ─ | >400 | ─ | >400 | ─ | >400 | ─ | >400 | ─ |

3. Experimental
3.1. Plant Material and Extraction
3.2. Materials
3.3. HPLC-DAD Analysis
3.4. HPLC/ESI-MS/MS Analysis
3.5. HPLC-MS Q-TOF Analysis
3.6. Isolates and Conidial Suspension Preparation
3.7. Colony Growth Inhibition Test
3.8. Conidial Germination Test
3.9. Statistical Analysis
4. Conclusions
Acknowledgments
Supplementary Materials
Supplementary File 1References and Notes
- Moss, M.O. Mycotoxins review-1. Aspergillus and penicillium. Mycologist 2002, 16, 116–119. [Google Scholar]
- Phillips, D.J. Mycotoxins as a postharvest problem. In Postharvest Pathology of Fruits and Vegetables: Postharvest Losses in Perishable Crops; Moline H., E., Ed.; Agricultural Experimental Station, University of California Berkeley Publications: Berkeley, CA, USA, 1984; pp. 50–54. [Google Scholar]
- Ippolito, A.; Nigro, F. Impact of preharvest application of biological control agents on postharvest diseases of fresh fruits and vegetables. Crop Prot. 2000, 19, 715–723. [Google Scholar] [CrossRef]
- Schirra, M.; D'Aquino, S.; Palma, A.; Marceddu, S.; Angioni, A.; Cabras, P.; Scherm, B.; Migheli, Q. Residue level, persistence, and storage performance of citrus fruit treated with fludioxonil. J. Agric. Food Chem. 2005, 53, 6718–6724. [Google Scholar]
- Rosenberger, D.A.; Wicklow, D.T.; Korjagin, V.A.; Rondinaro, S.M. Pathogenicity and benzimidazole resistance in Penicillium species recovered from flotation tanks in apple packinghouses. Plant Dis. 1991, 75, 712–715. [Google Scholar] [CrossRef]
- Baraldi, E.; Mari, M.; Chierici, E.; Pondrelli, M.; Bertolini, P.; Pratella, G.C. Studies on thiabendazole resistance of Penicillium expansum of pears: pathogenic fitness and genetic characterization. Plant Pathol. 2003, 52, 362–370. [Google Scholar] [CrossRef]
- Mishra, A.K.; Dubey, N.K. Evaluation of some essential oils for their toxicity against fungi causing deterioration of stored food commodities. Appl. Environ. Microbiol. 1994, 60, 1101–1105. [Google Scholar]
- Gonzalez, A.G.; Barrera, J.B. Chemistry and source of mono- and bicyclic sesquiterpenes from Ferula species. Nat. Prod. Rep. 1995, 64, 1–92. [Google Scholar]
- Ali-Shtayeh, M.S.; Yaghmour, R.M.R.; Faidi, Y.R.; Salem, K.; Al Nuri, M.A. Antimicrobial activity of 20 plants used in folkloric medicine in the Palestinian area. J. Ethnopharmacol. 1998, 60, 265–271. [Google Scholar] [CrossRef]
- Lev, E.; Amar, Z. Ethnopharmacological survey of traditional drugs sold in Israel at the end of the 20th century. J. Ethnopharmacol. 2000, 72, 191–205. [Google Scholar] [CrossRef]
- Appendino, G.; Tagliapietra, S.; Gariboldi, P.; Nano, G.M.; Picci, V. Oxygenated prenylated coumarins from F. communis. Phytochemistry 1988, 27, 3619–3624. [Google Scholar] [CrossRef]
- Valle, M.G.; Appendino, G.; Nano, G.M.; Picci, V. Prenylated coumarins and sesquiterpenoids from F. communis. Phytochemistry 1987, 26, 253–256. [Google Scholar]
- Miski, M.; Jakupovic, J. Cyclic farnesyl-coumarin and fernesyl-chromone derivatives from F. communis subsp. communis. Phytochemistry 1990, 29, 1995–1998. [Google Scholar] [CrossRef]
- Arnoldi, L.; Ballero, M.; Fuzzati, N.; Maxia, A.; Mercalli, E.; Pagni, L. HPLC-DAD-MS identification of bioactive secondary metabolites from Ferula communis roots. Fitoterapia 2004, 75, 342–354. [Google Scholar] [CrossRef]
- Rubiolo, P.; Matteodo, M.; Riccio, G.; Ballero, M.; Christen, P.; Fleury-Souverain, S.; Veuthey, J. L.; Bicchi, C. Analytical discrimination of poisonous and nonpoisonous chemotypes of giant fennel (Ferula communis L.) through their biologically active and volatile fractions. J. Agric. Food Chem. 2006, 54, 7556–7563. [Google Scholar]
- Al-Yahya, M.A.; Muhammad, I.; Mirza, H.H.; El-Feraly, S.F. Antibacterial constituents from the rhizomes of Ferula communis. Phytother. Res. 1998, 12, 335–339. [Google Scholar] [CrossRef]
- Miski, M.; Mabry, T.J. Daucane esters from F. communis subsp. communis. Phytochemistry 1985, 24, 1735–1741. [Google Scholar] [CrossRef]
- Appendino, G.; Tagliapietra, S.; Crarotto, G.; Nano, G.M. Structure and synthesis of a prenylated acetophene from F. communis. Gazz. Chim. Ital. 1989, 119, 385–388. [Google Scholar]
- Mossa, J.S.; El-Feraly, F.S.; Muhammad, I. Antimycobacterial constituents from Juniperus procera, Ferula communis and Plumbago zeylanica and their in vitro synergistic activity with isonicotinic acid hydrazide. Phytother. Res. 2004, 18, 934–937. [Google Scholar] [CrossRef]
- Appendino, G.; Mercalli, E.; Fuzzati, N.; Arnoldi, L.; Stavri, M.; Gibbons, S.; Ballero, M.; Maxia, A. Antimycobacterial coumarins from the Sardinian giant fennel (Ferula communis). J. Nat. Prod. 2004, 67, 2108–2110. [Google Scholar] [CrossRef]
- Grande, M.; Piera, F.; Cuenca, A.; Torres, P.; Bellido, I.S. Flavonoids from Inula viscosa. Planta Med. 1985, 39, 414–419. [Google Scholar]
- Simões, F.; Nascimento, J. Constituents of Dittrichia viscosa subsp. viscosa. Fitoterapia 1990, 61, 553–554. [Google Scholar]
- Grande, M.; Torres, P.; Piera, F.; Bellido, I.S. Triterpenoids from Dittrichia viscosa. Phytochemistry 1992, 31, 1826–1828. [Google Scholar] [CrossRef]
- Grande, M.; Bellido, I.S. 9-Hydroxynerolidol and bicyclic sesquiterpenoids from Dittrichia viscosa. J. Nat. Prod. 1992, 55, 1074–1079. [Google Scholar] [CrossRef]
- Pérez-Alonso, M.J.; Velasco-Negueruela, A.; Duru, M.E.; Harmandar, M.; García Vallejo, M.C. Composition of the volatile oil from the aerial parts of Inula viscosa (L.) Aiton. Flavour Fragr. J. 1996, 11, 349–351. [Google Scholar]
- Camacho, A.; Fernández, A.; Fernández, C.; Altarejos, J.; Laurent, R. Composition of the essential oil of Dittrichia viscosa (L.) W. Greuter. Riv. Ital. EPPOS. 2000, 29, 3–8. [Google Scholar]
- Oka, Y.; Ben-Daniel, B.H.; Cohen, Y. Control of Meloidogyne javanica by formulations of Inula viscosa leaf extracts. J. Nematol. 2006, 38, 46–51. [Google Scholar]
- Alexenizer, M.; Dorn, A. Screening of medicinal and ornamental plants for insecticidal and growth regulating activity. J. Pest. Sci. 2007, 80, 205–215. [Google Scholar] [CrossRef]
- Mansour, F.; Azaizeh, H.; Saad, B.; Tadmor, Y.; Abo-Moch, F.; Said, O. The potential of Middle Eastern flora as a source of new safe bio-acaricides to control Tetranychus cinnabarinus, the carmine spider mite. Phytoparasitica 2004, 32, 66–72. [Google Scholar] [CrossRef]
- Cafarchia, C.; De Laurentis, N.; Milillo, M.A.; Losacco, V.; Puccini, V. Fungistatic activity of a sesquiterpene lactone (tomentosin) isolated from fresh Inula viscosa (Asteraceae) flowers from the Puglia region. Parassitologia 2001, 43, 117–121. [Google Scholar]
- Cafarchia, C.; De Laurentis, N.; Milillo, M.A.; Losacco, V.; Puccini, V. Antifungal activity of essential oils from leaves and flowers of Inula viscosa (Asteraceae) by Apulian region. Parassitologia 2002, 44, 153–156. [Google Scholar]
- Berdicevsky, I.; Duek, L.; Neeman, I.; Maoz, M. Antimycotic activity of tayunin-Inula viscosa extract-SEM observations. 41st Interscience Conference on Antimicrobial Agents and Chemotherapy: Chicago, IL, USA, 16-19 December 2001. Abstract Number J-98.. [Google Scholar]
- Maoz, M.; Neeman, I. Effect of Inula viscosa extract on chitin synthesis in dermatophytes and Candida albicans. J. Ethnopharmacol. 2000, 71, 479–482. [Google Scholar] [CrossRef]
- Qasem, J.R.; Al-Abed, A.S.; Abu-Blan, H.A. Antifungal activity of clammy inula (Inula viscosa) on Helminthosporium sativum and Fusarium oxysporum f. sp. lyccopersici. Phytopathol. Mediterr. 1995, 34, 7–14. [Google Scholar]
- Abou-Jawdah, Y.; Wardan, R.; Sobh, H.; Salameh, A. Antifungal activities of extracts from selected Lebanese wild plants against plant pathogenic fungi. Phytopathol. Mediterr. 2004, 43, 377–386. [Google Scholar]
- Cohen, Y.; Baider, A.; Ben-Daniel, B.H.; Ben-Daniel, Y. Fungicidal preparations from Inula viscosa. Plant Prot. Sci. 2002, 38, 629–630. [Google Scholar]
- Wang, W.Q.; Ben-Daniel, B.H.; Cohen, Y. Control of plant diseases by extracts of Inula viscosa. Phytopathology 2004, 94, 1042–1047. [Google Scholar] [CrossRef]
- Cohen, Y.; Wang, W.Q.; Ben-Daniel, B.H.; Ben-Daniel, Y. Extracts of Inula viscosa control downy mildew of grapes caused by Plasmopara viticola. Phytopatology 2006, 96, 417–423. [Google Scholar] [CrossRef]
- Oka, Y.; Ben-Daniel, B.H.; Cohen, Y. Nematicidal activity of powder and extracts of Inula viscosa. Nematology 2001, 3, 735–742. [Google Scholar] [CrossRef]
- Özcan, M.M.; Chalchat, J.C.; Arslan, D.; Ates, A.; Ünver, A. Comparative essential oil composition and antifungal effect of bitter fennel (Foeniculum vulgare ssp. piperitum) fruit oils obtained during different vegetation. J. Med. Food. 2006, 9, 552–561. [Google Scholar]
- Németh, É. Changes in Essential oil quantity and quality influenced by ontogenetic factors. Acta Hort. 2005, 675, 159–165. [Google Scholar]
- Topçu, G.; Öksüz, S.; Shieh, H.L.; Cordell, G.A.; Pezzuto, J.M.; Bozok-Johansson, C. Cytotoxic and antibacterial sesquiterpenes from Inula graveolens. Phytochemistry 1993, 33, 407–410. [Google Scholar]
- Máñez, S.; Recio, M.C.; Gil, I.; Gómez, C.; Giner, R.M.; Waterman, P.G.; Ríos, J.L. A glycosyl analogue of diacylglycerol and other antiinflammatory constituents from Inula viscosa. J. Nat. Prod. 1999, 62, 601–604. [Google Scholar] [CrossRef]
- Hernandez, V.; Del-Carmen-Recio, M.; Máñez, S.; Prieto, J.M.; Giner, R.M.; Rios, J.L. A mechanistic approach to the in vivo anti-inflammatory activity of sesquiterpenoid compounds isolated from Inula viscosa. Planta Med. 2001, 67, 726–731. [Google Scholar] [CrossRef]
- Yegen, O.; Berger, B.; Heitefuss, R. Investigations on the fungitoxicity of extracts of six selected plants from Turkey against phytopathogenic fungi. J. Plant Dis. Prot. 1992, 99, 349–359. [Google Scholar]
- Abou-Jawdah, Y.; Sobh, H.; Salameh, A. Antimycotic activities of selected plant flora, growing wild in Lebanon, against phytopathogenic fungi. J. Agric. Food Chem. 2002, 50, 3208–3213. [Google Scholar] [CrossRef]
- Sample Availability: Samples of the compounds are available from the authors.
© 2011 by the authors; licensee MDPI, Basel, Switzerland. This article is an open access article distributed under the terms and conditions of the Creative Commons Attribution license ( http://creativecommons.org/licenses/by/3.0/).
Share and Cite
Mamoci, E.; Cavoski, I.; Simeone, V.; Mondelli, D.; Al-Bitar, L.; Caboni, P. Chemical Composition and In Vitro Activity of Plant Extracts from Ferula communis and Dittrichia viscosa against Postharvest Fungi. Molecules 2011, 16, 2609-2625. https://doi.org/10.3390/molecules16032609
Mamoci E, Cavoski I, Simeone V, Mondelli D, Al-Bitar L, Caboni P. Chemical Composition and In Vitro Activity of Plant Extracts from Ferula communis and Dittrichia viscosa against Postharvest Fungi. Molecules. 2011; 16(3):2609-2625. https://doi.org/10.3390/molecules16032609
Chicago/Turabian StyleMamoci, Erjon, Ivana Cavoski, Vito Simeone, Donato Mondelli, Lina Al-Bitar, and Pierluigi Caboni. 2011. "Chemical Composition and In Vitro Activity of Plant Extracts from Ferula communis and Dittrichia viscosa against Postharvest Fungi" Molecules 16, no. 3: 2609-2625. https://doi.org/10.3390/molecules16032609
APA StyleMamoci, E., Cavoski, I., Simeone, V., Mondelli, D., Al-Bitar, L., & Caboni, P. (2011). Chemical Composition and In Vitro Activity of Plant Extracts from Ferula communis and Dittrichia viscosa against Postharvest Fungi. Molecules, 16(3), 2609-2625. https://doi.org/10.3390/molecules16032609