Effects of Time Point Measurement on the Reconstruction of Gene Regulatory Networks

Abstract
:
1. Introduction
2. Experimental
2.1. Data and software
2.2. Method
2.2.1. Dynamic Bayesian network method

 is the vector composed by variables at time i and
  is the vector composed by jth variable at all times.
 denotes the random variables that correspond to the parents of node i.
2.2.2. Network structure analysis

| Statistics | Definition | Descriptions |
| Average degree K [29] |  | de(v): the degree of node v |
| N: the number of nodes in network S | ||
| Average path length l[30,32] |  | dij: the shortest path between vi and vj |
| Betweenness Bv[33] |  | givj: the number of shortest paths from i to j that pass through a node v |
| gij : the number of shortest geodesic paths from i to j. | ||
| Clustering coefficient CC [34] |  | Nt: number of closed triplets |
| Ntn: number of connected triples of nodes | ||
| Centralization Ce( S ) [35] |  | C(v): the degree centrality for node v and  |
| Global efficiency of the network E[36] |  | dij : shortest path length |
| Maximum vulnerability of the networks Vu [37] |  | E: the efficiency of the network |
| Ei : the efficiency of the network without the node i and all edges connecting it with other vertices |
2.2.3. Arabidopsis gene regulatory networks reconstruction based on different time point deletion

3. Results and Discussion
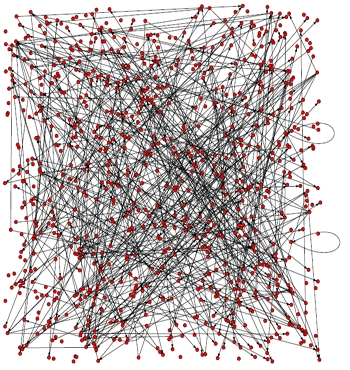
3.1. The analysis of constructed Arabidopsis gene regulatory networks
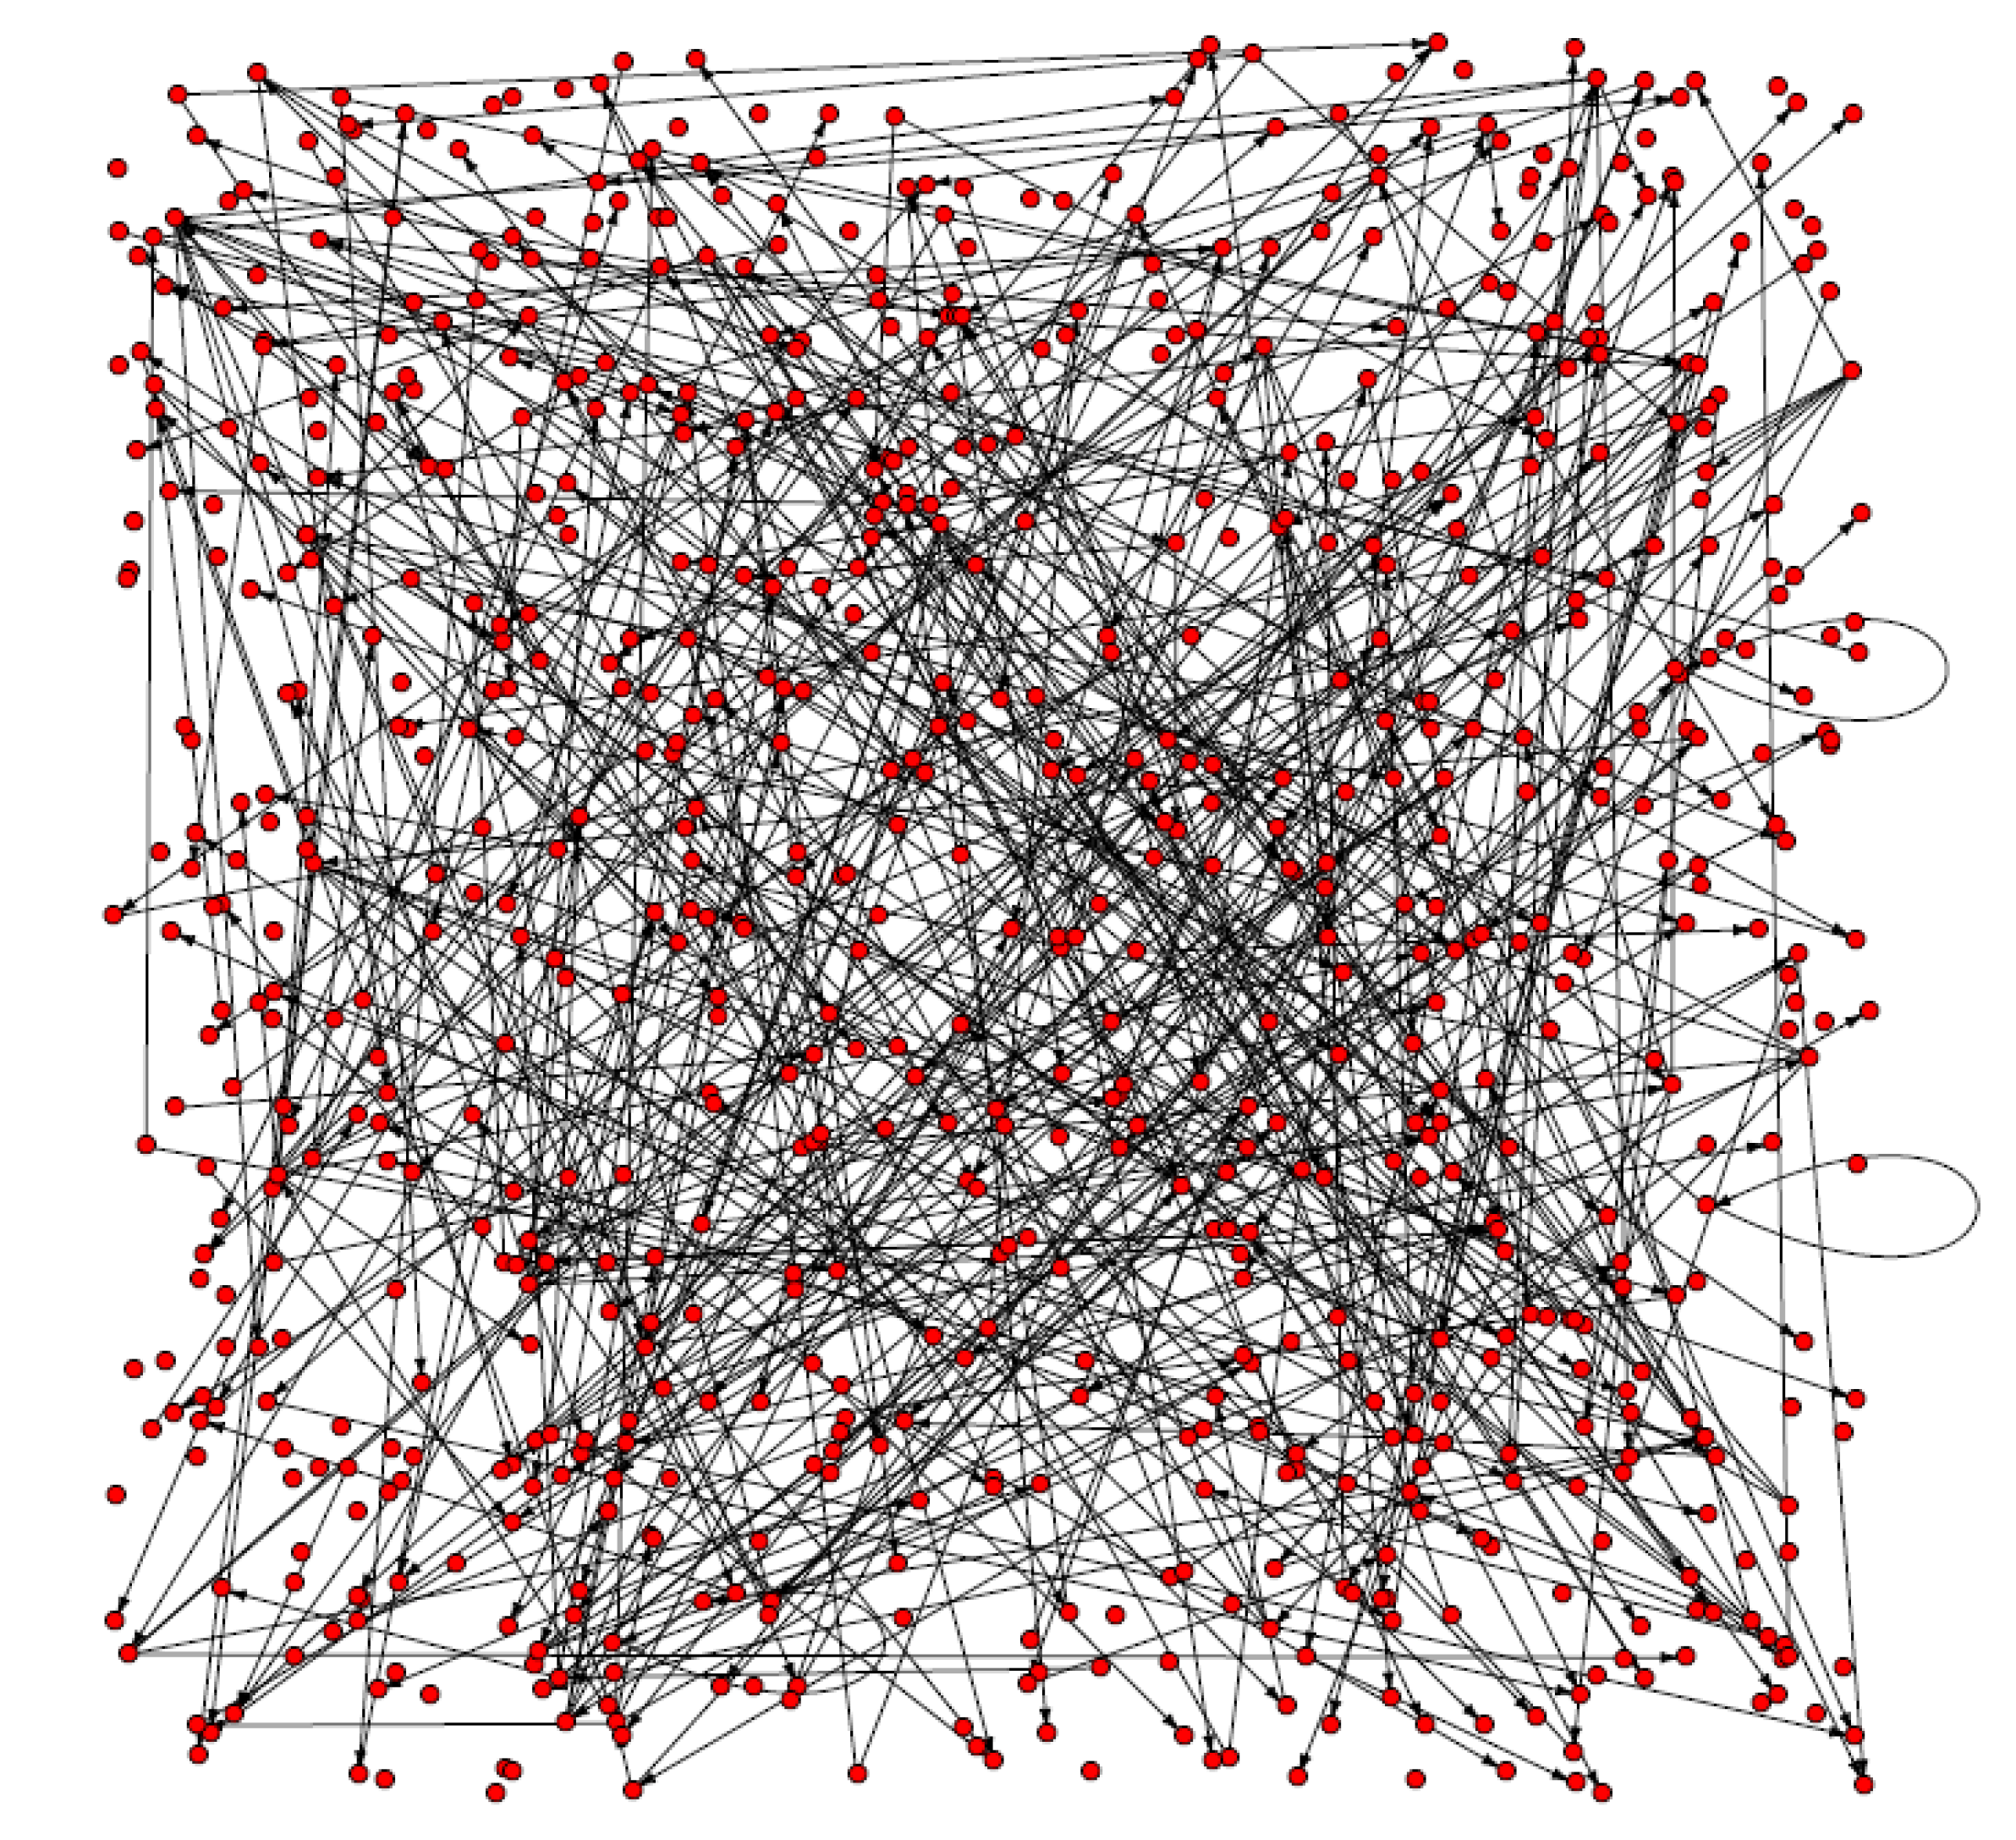
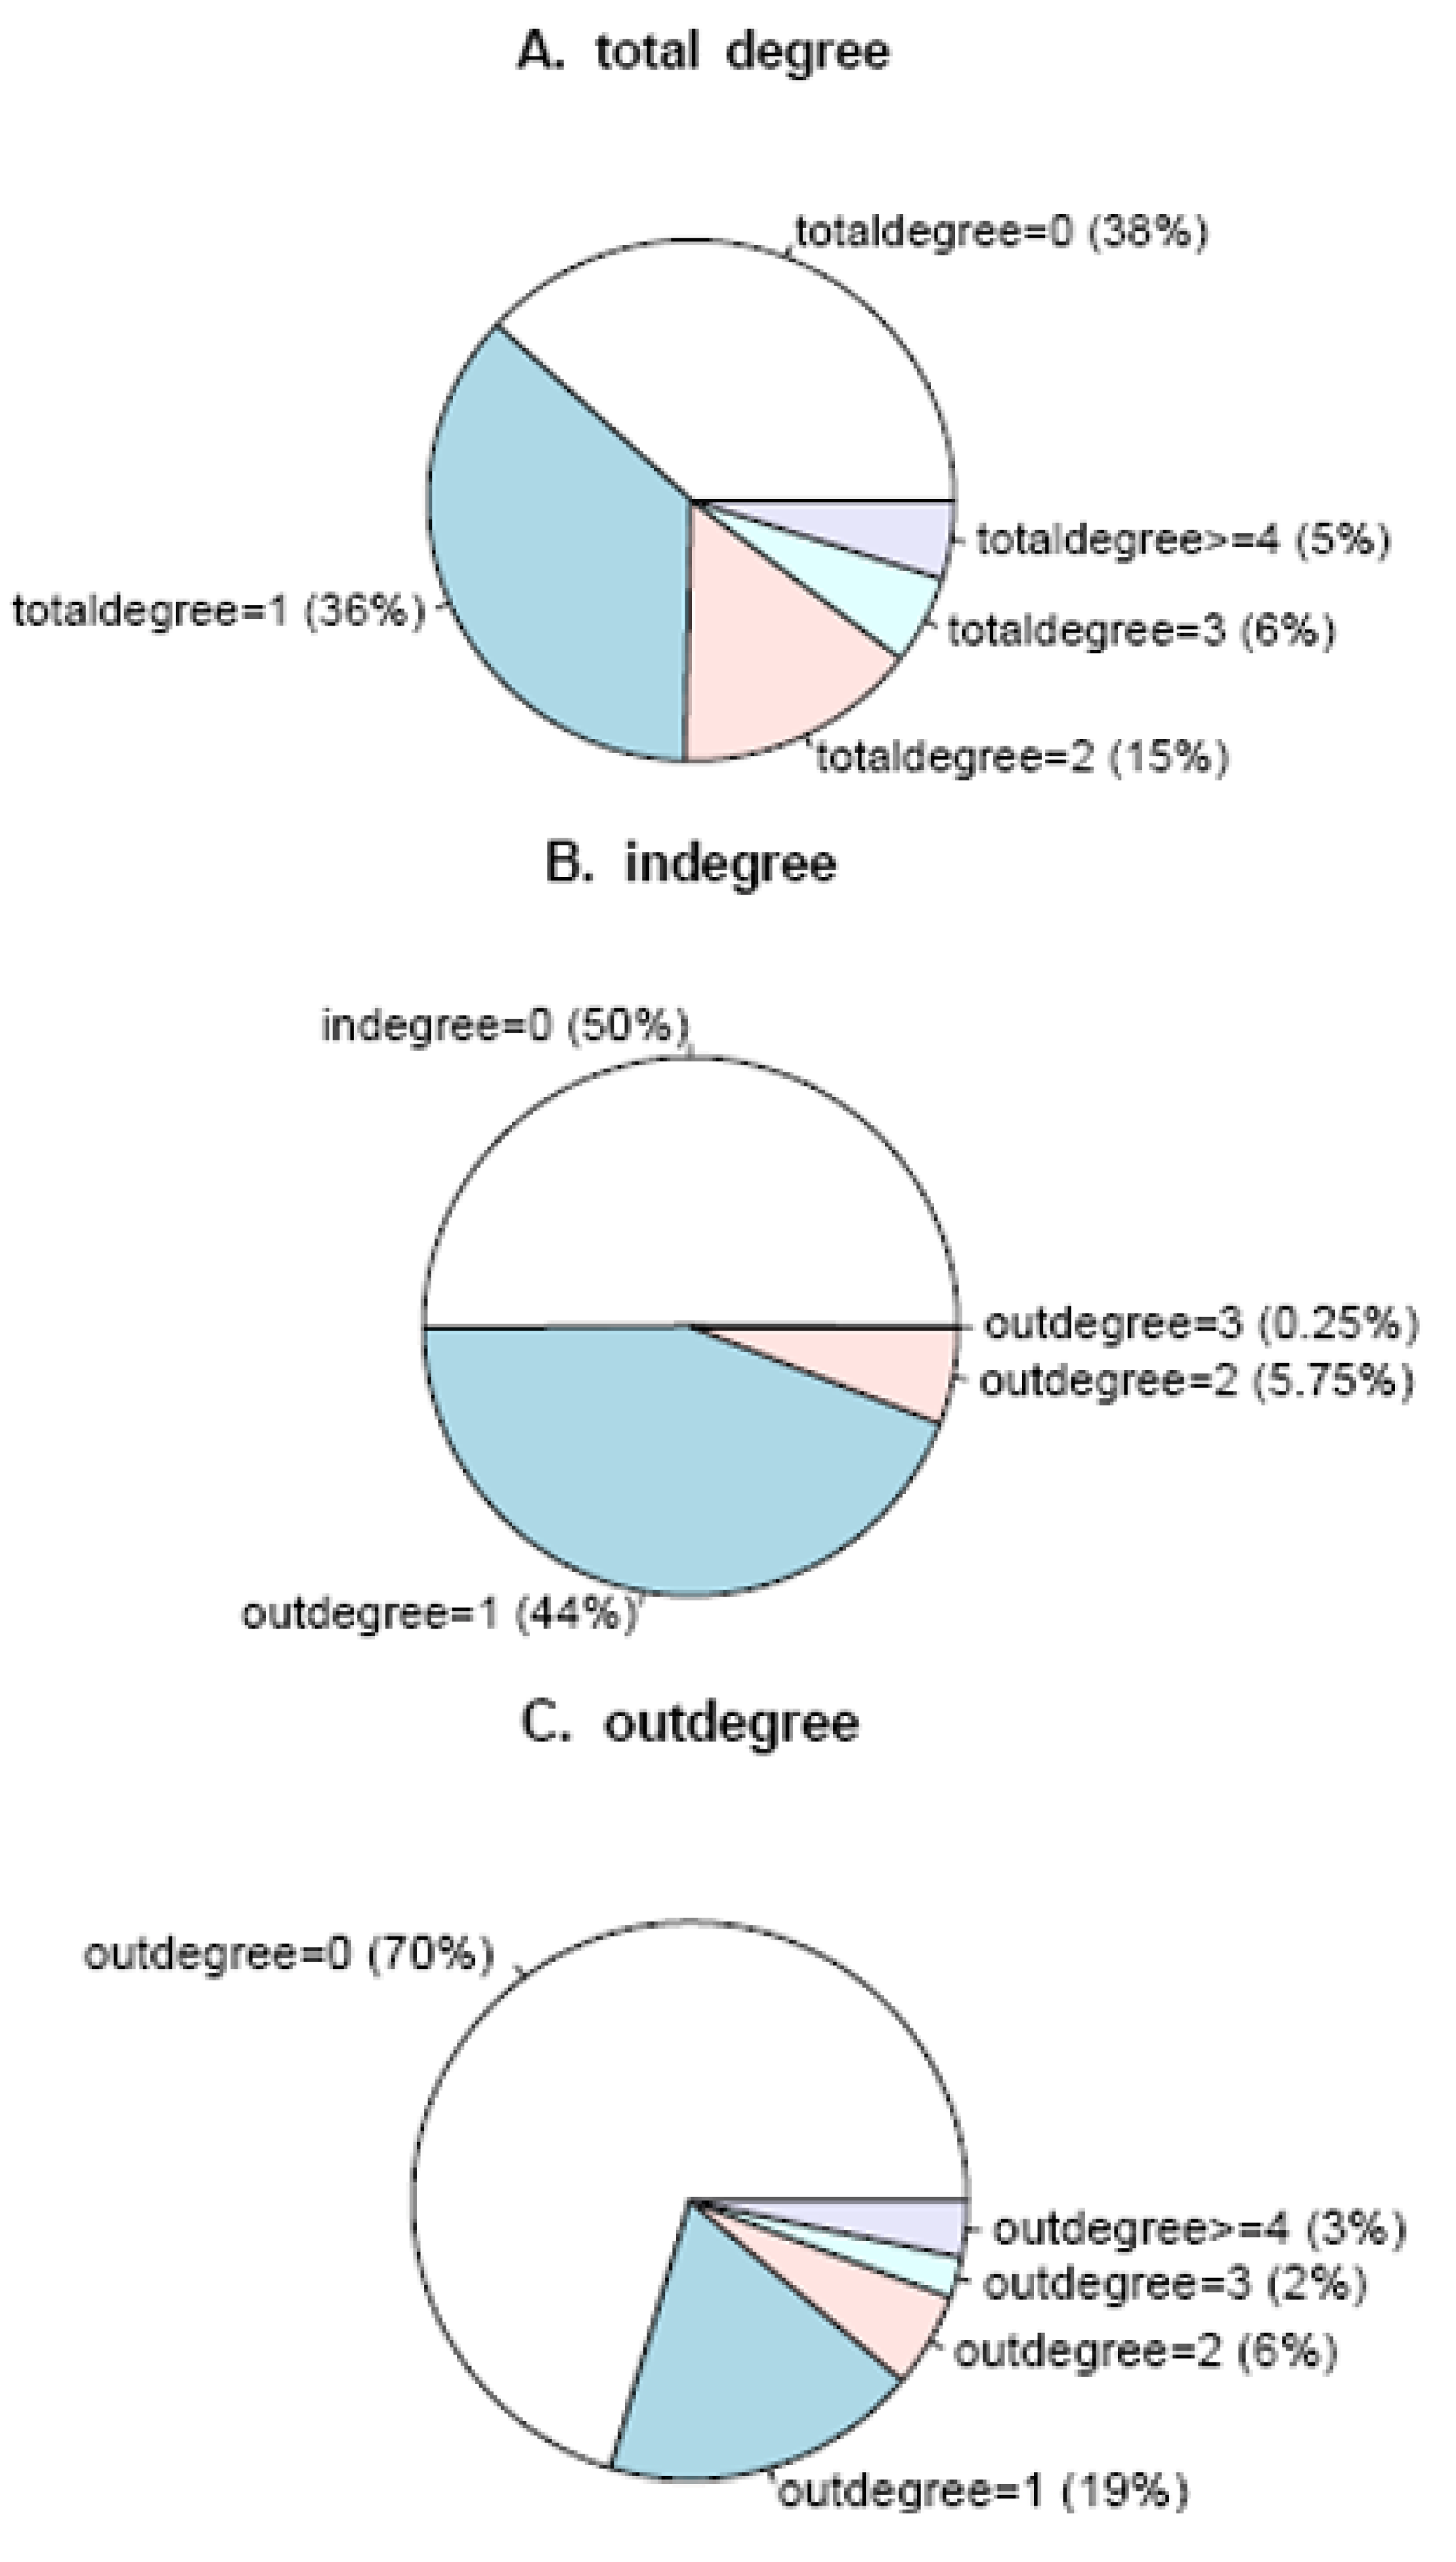
| K | Dia | l | N0 | Rn | E | Vu | CC | Ce |
|---|---|---|---|---|---|---|---|---|
| 1.1175 | 12 | 3.0467 | 306 | 447 | 0.0013 | 0.0302 | 0.0019 | 0.0093 |
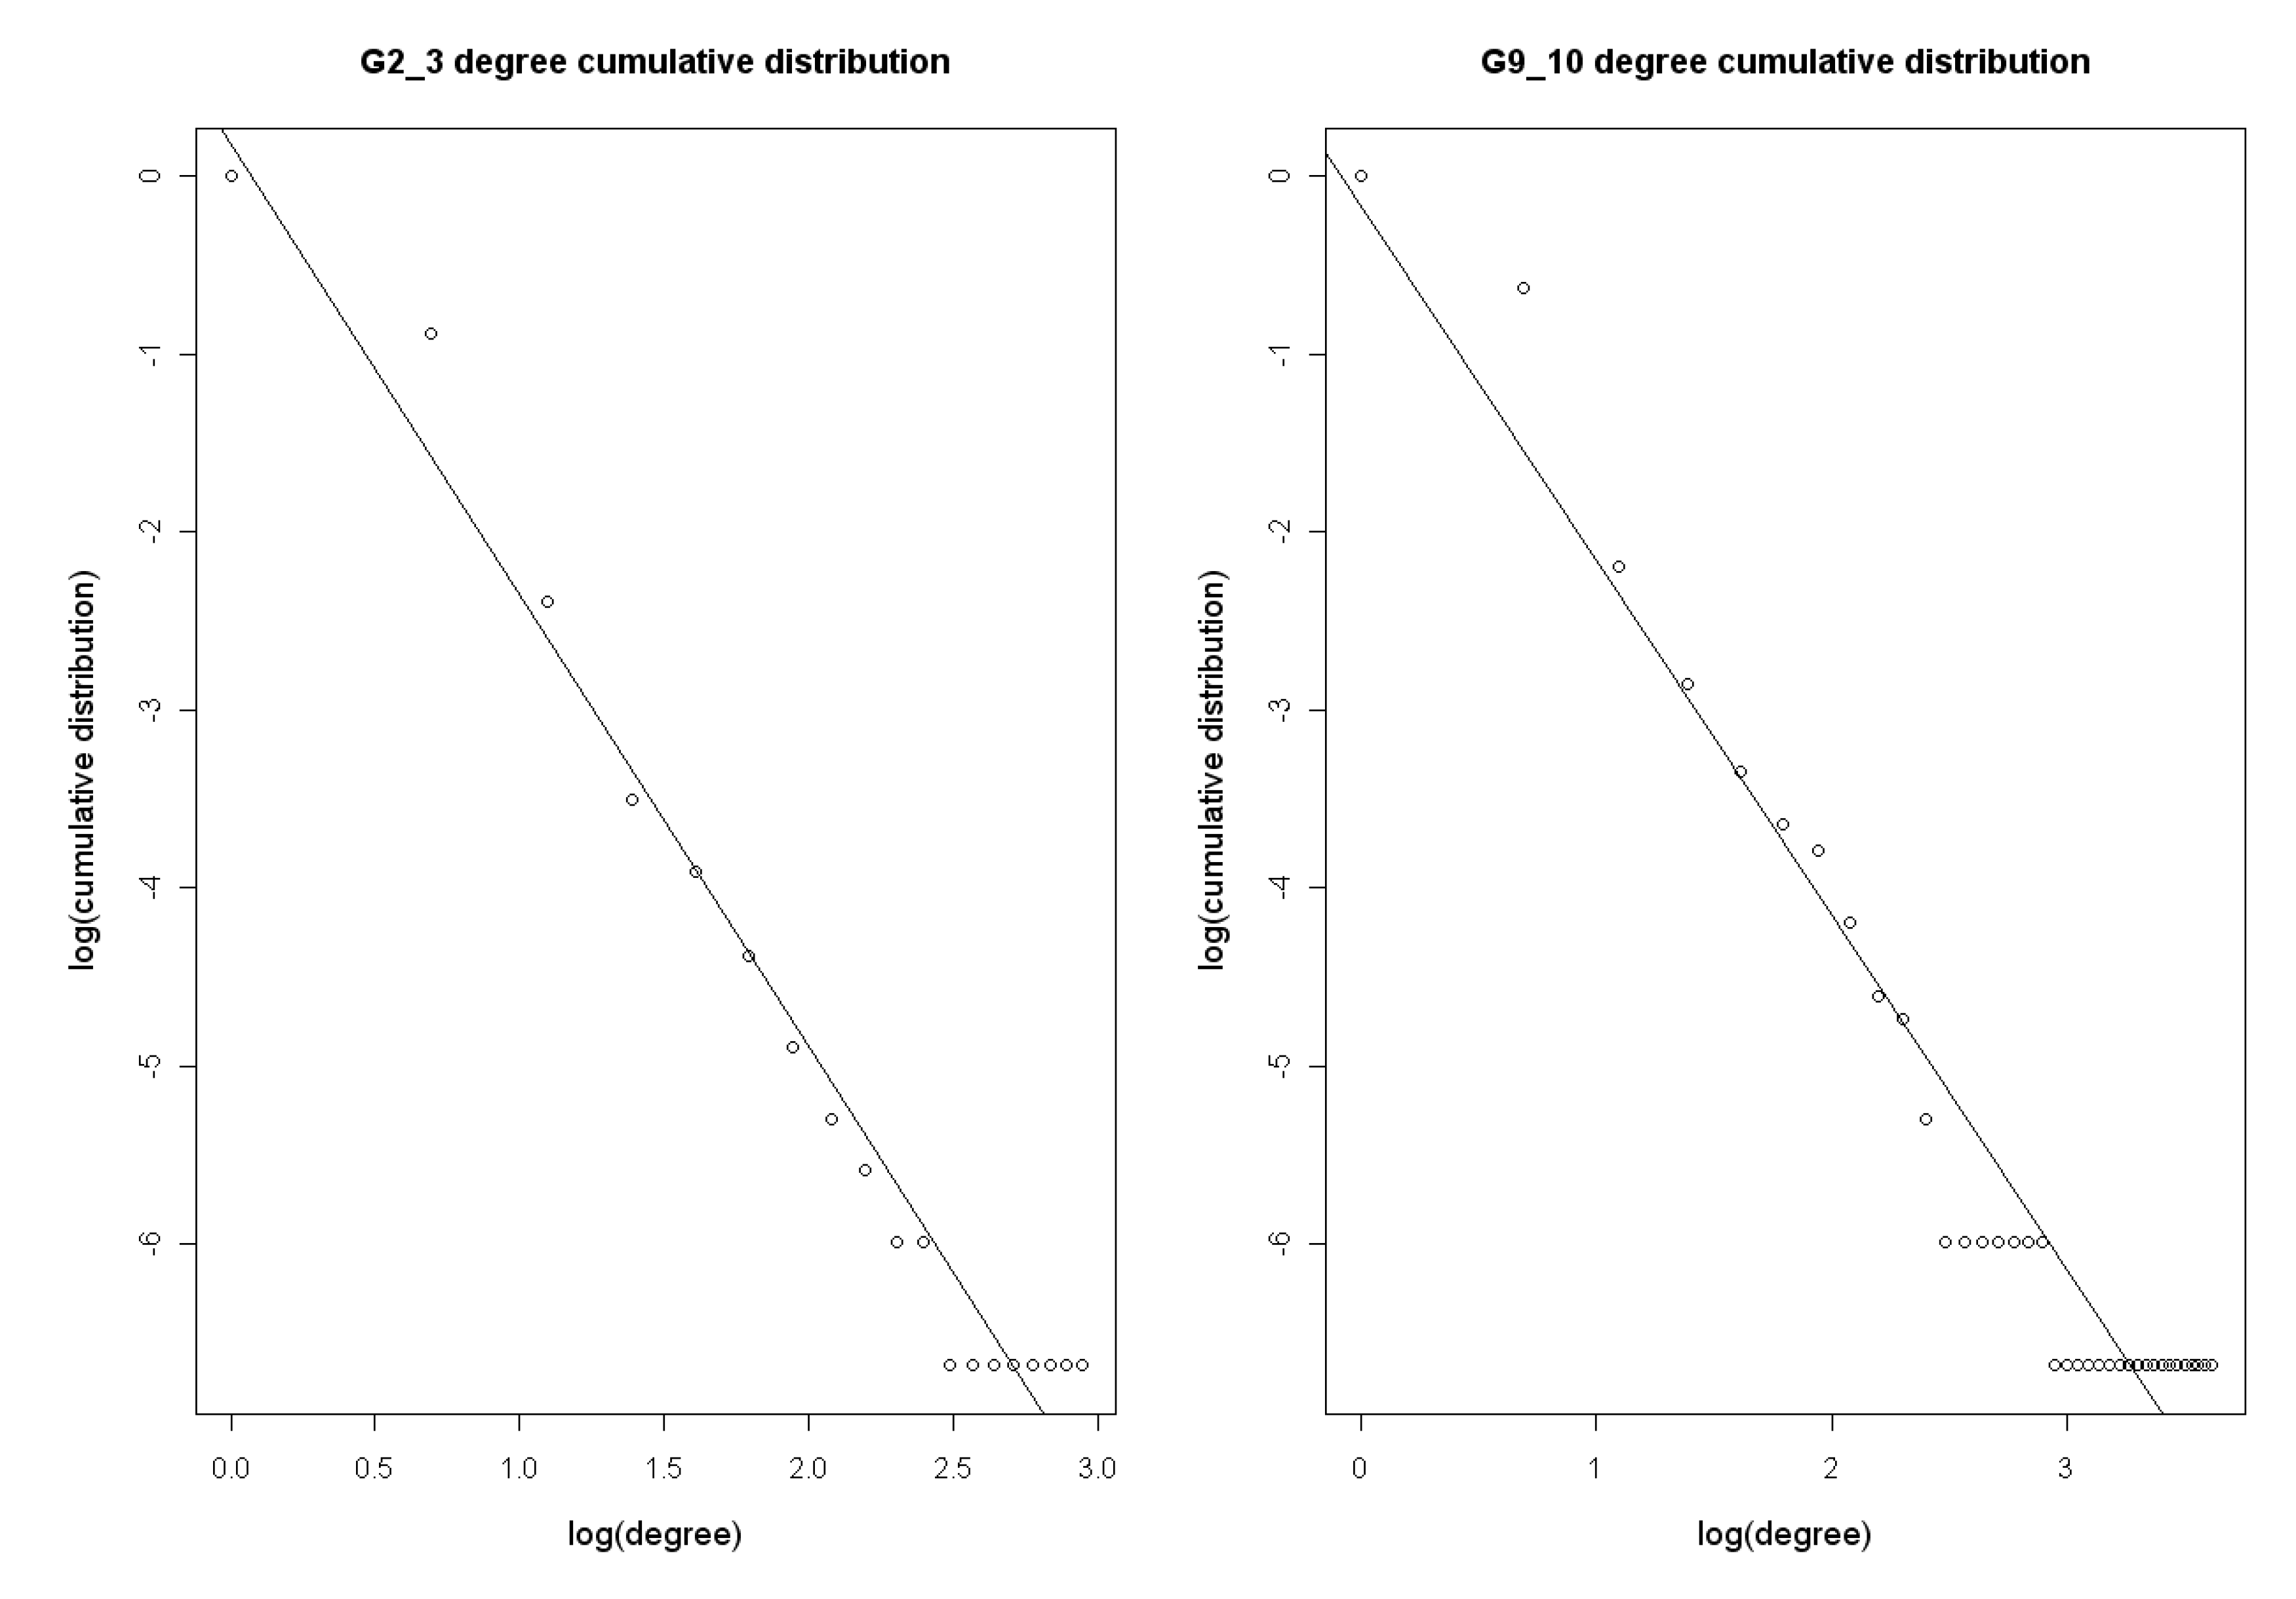
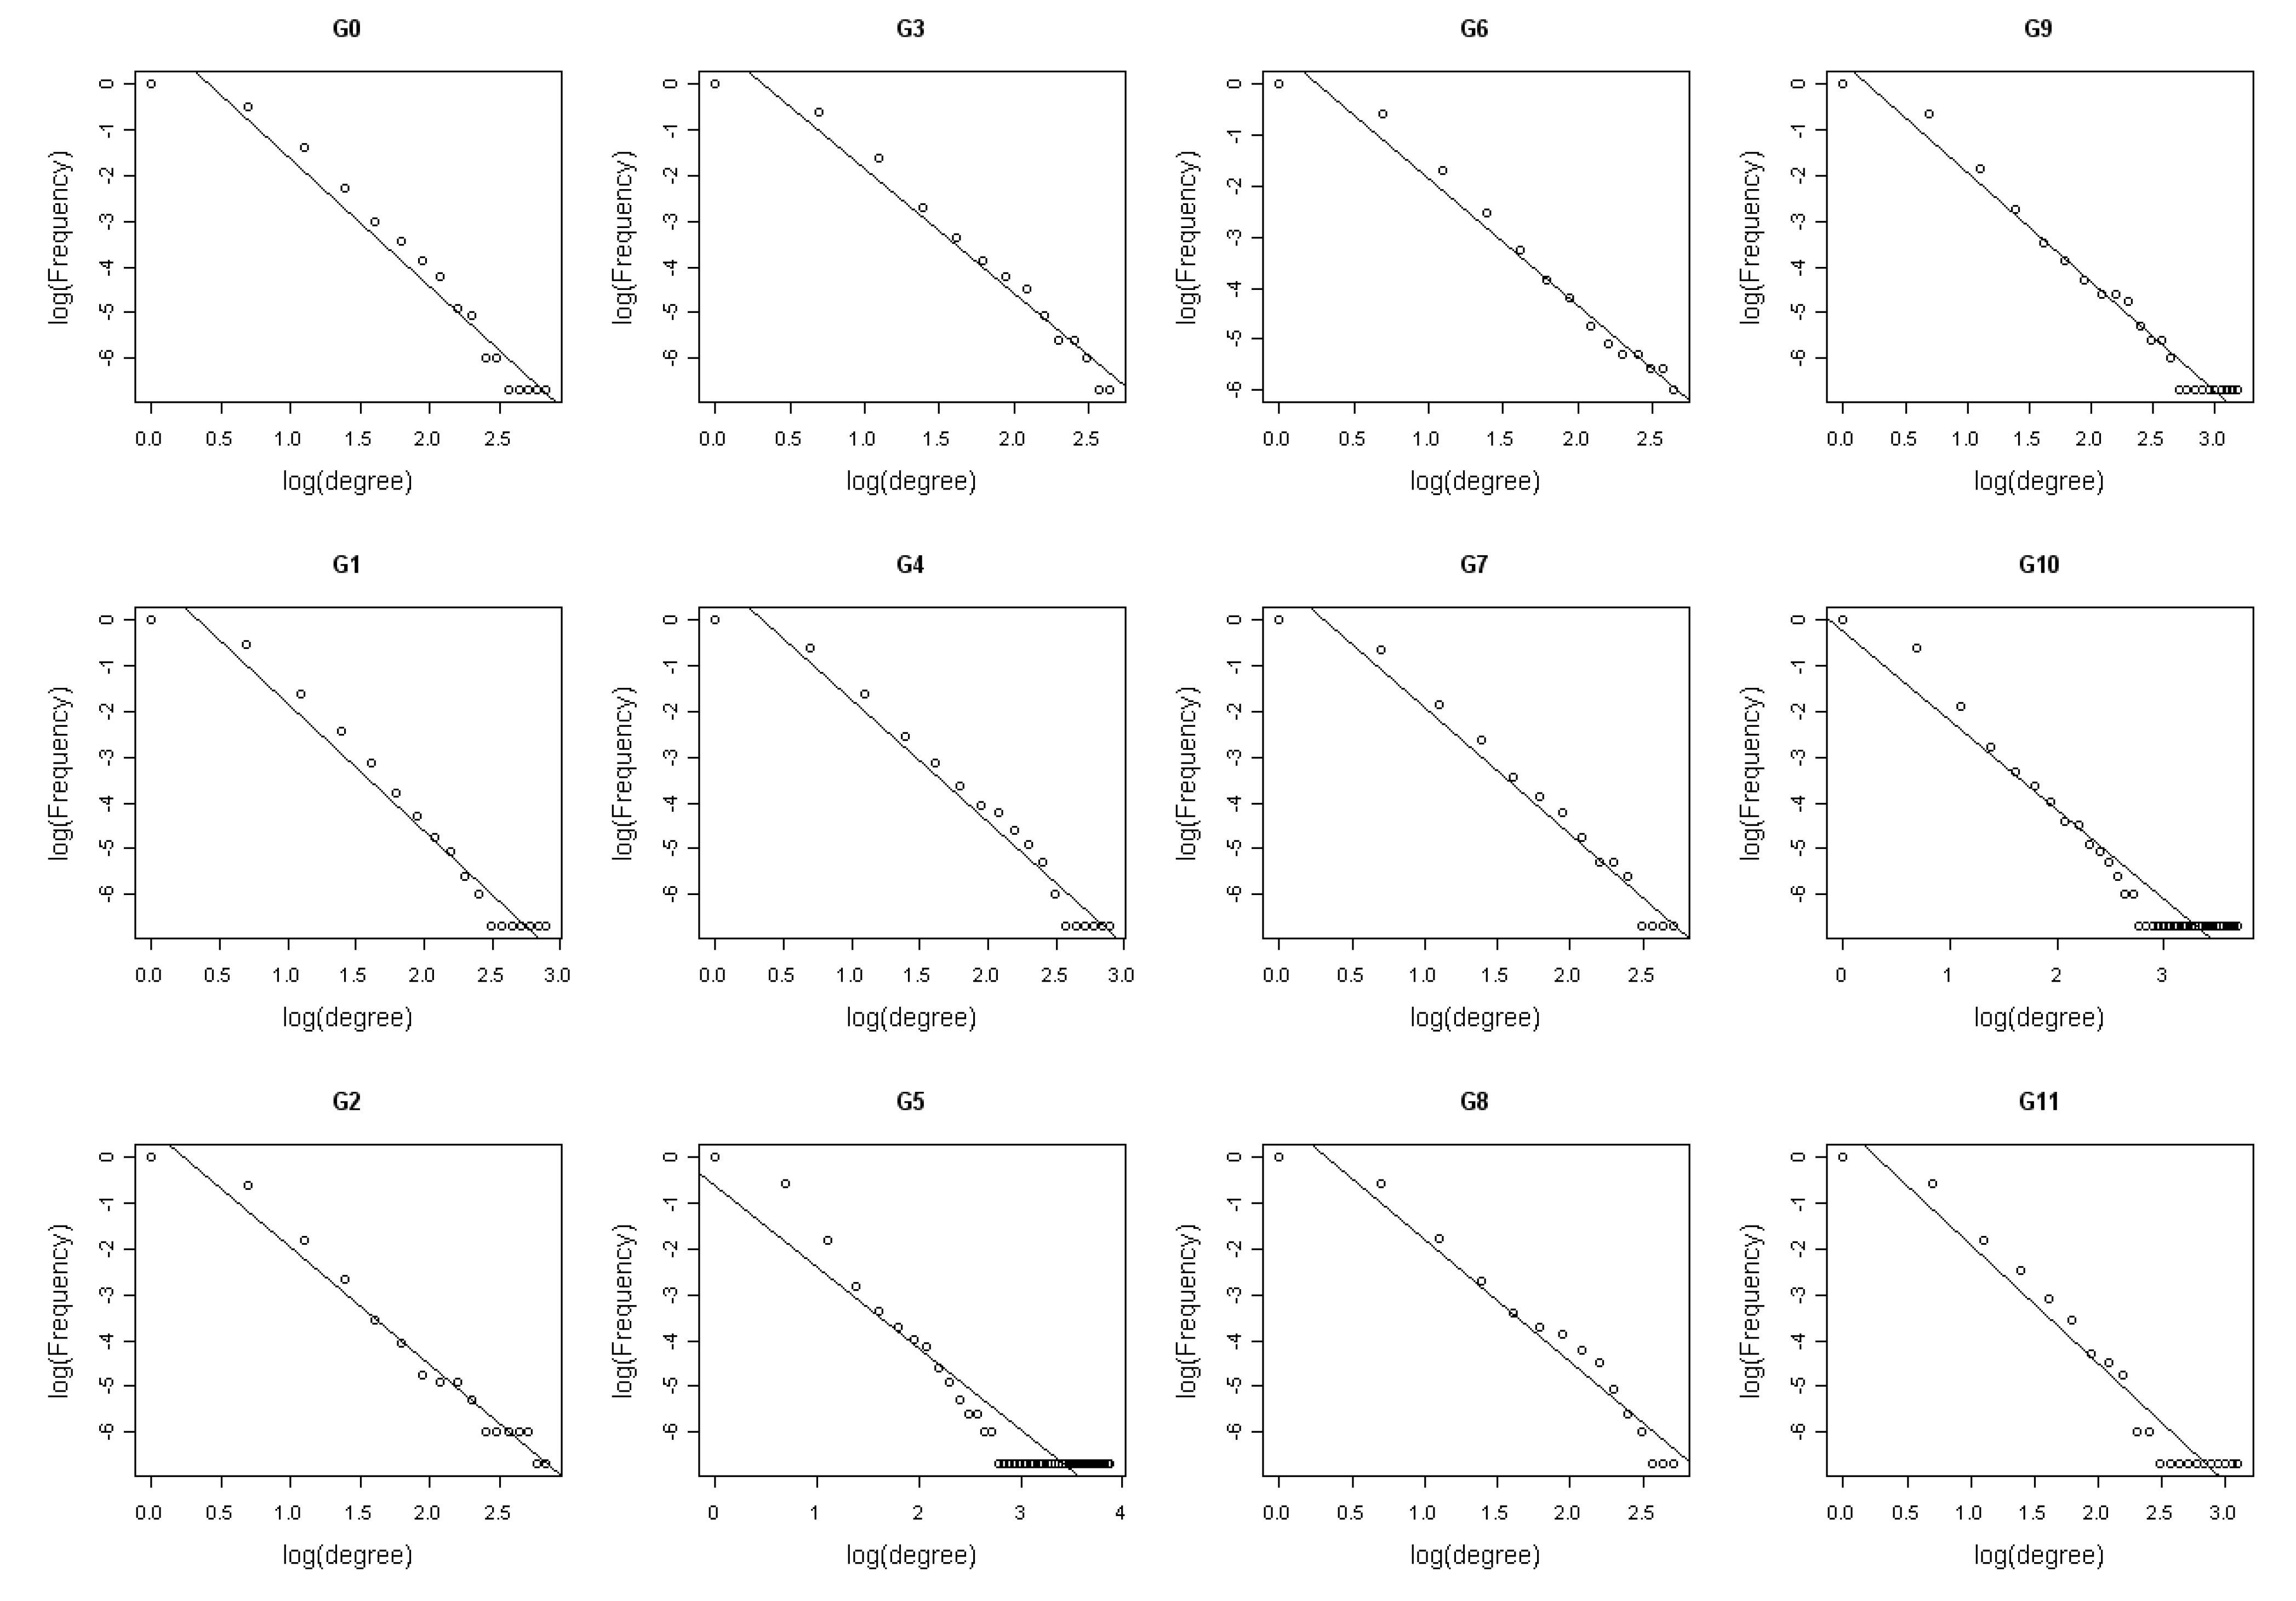
3.2. Identification of network statistics insensitive to time points measurement
| Network | K | Dia | l | Ce | Rn | E | Vu |
| G0 | 1.1175 | 12 | 3.0467 | 0.0093 | 447 | 0.001258 | 0.0302 |
| G1 | 0.9750 | 10 | 2.4462 | 0.0101 | 390 | 0.000944 | 0.0397 |
| G2 | 0.8725 | 6 | 1.6998 | 0.0095 | 349 | 0.000726 | 0.0499 |
| G3 | 0.9175 | 6 | 1.9530 | 0.0076 | 367 | 0.000849 | 0.0366 |
| G4 | 0.9525 | 11 | 2.3965 | 0.0101 | 381 | 0.000859 | 0.0602 |
| G5 | 0.9625 | 5 | 1.8720 | 0.0289 | 385 | 0.000919 | 0.0809 |
| fG6 | 0.9425 | 7 | 2.0107 | 0.0076 | 377 | 0.000811 | 0.0344 |
| G7 | 0.8475 | 10 | 2.5515 | 0.0083 | 339 | 0.000804 | 0.0396 |
| G8 | 0.9250 | 7 | 2.4457 | 0.0082 | 370 | 0.000892 | 0.0472 |
| G9 | 0.8625 | 7 | 2.2134 | 0.0139 | 345 | 0.000784 | 0.0590 |
| G10 | 0.9200 | 7 | 2.0985 | 0.0239 | 368 | 0.000863 | 0.0728 |
| G11 | 0.9500 | 5 | 1.7365 | 0.0126 | 380 | 0.000806 | 0.0466 |
| ave | 0.9371 | 7.7500 | 2.2059 | 0.0125 | 374.8300 | 0.000876 | 0.0497 |
| d_score | 0.5785 | 2.7400 | 1.4780 | 4.6882 | 0.5800 | 1.07808 | 2.5885 |
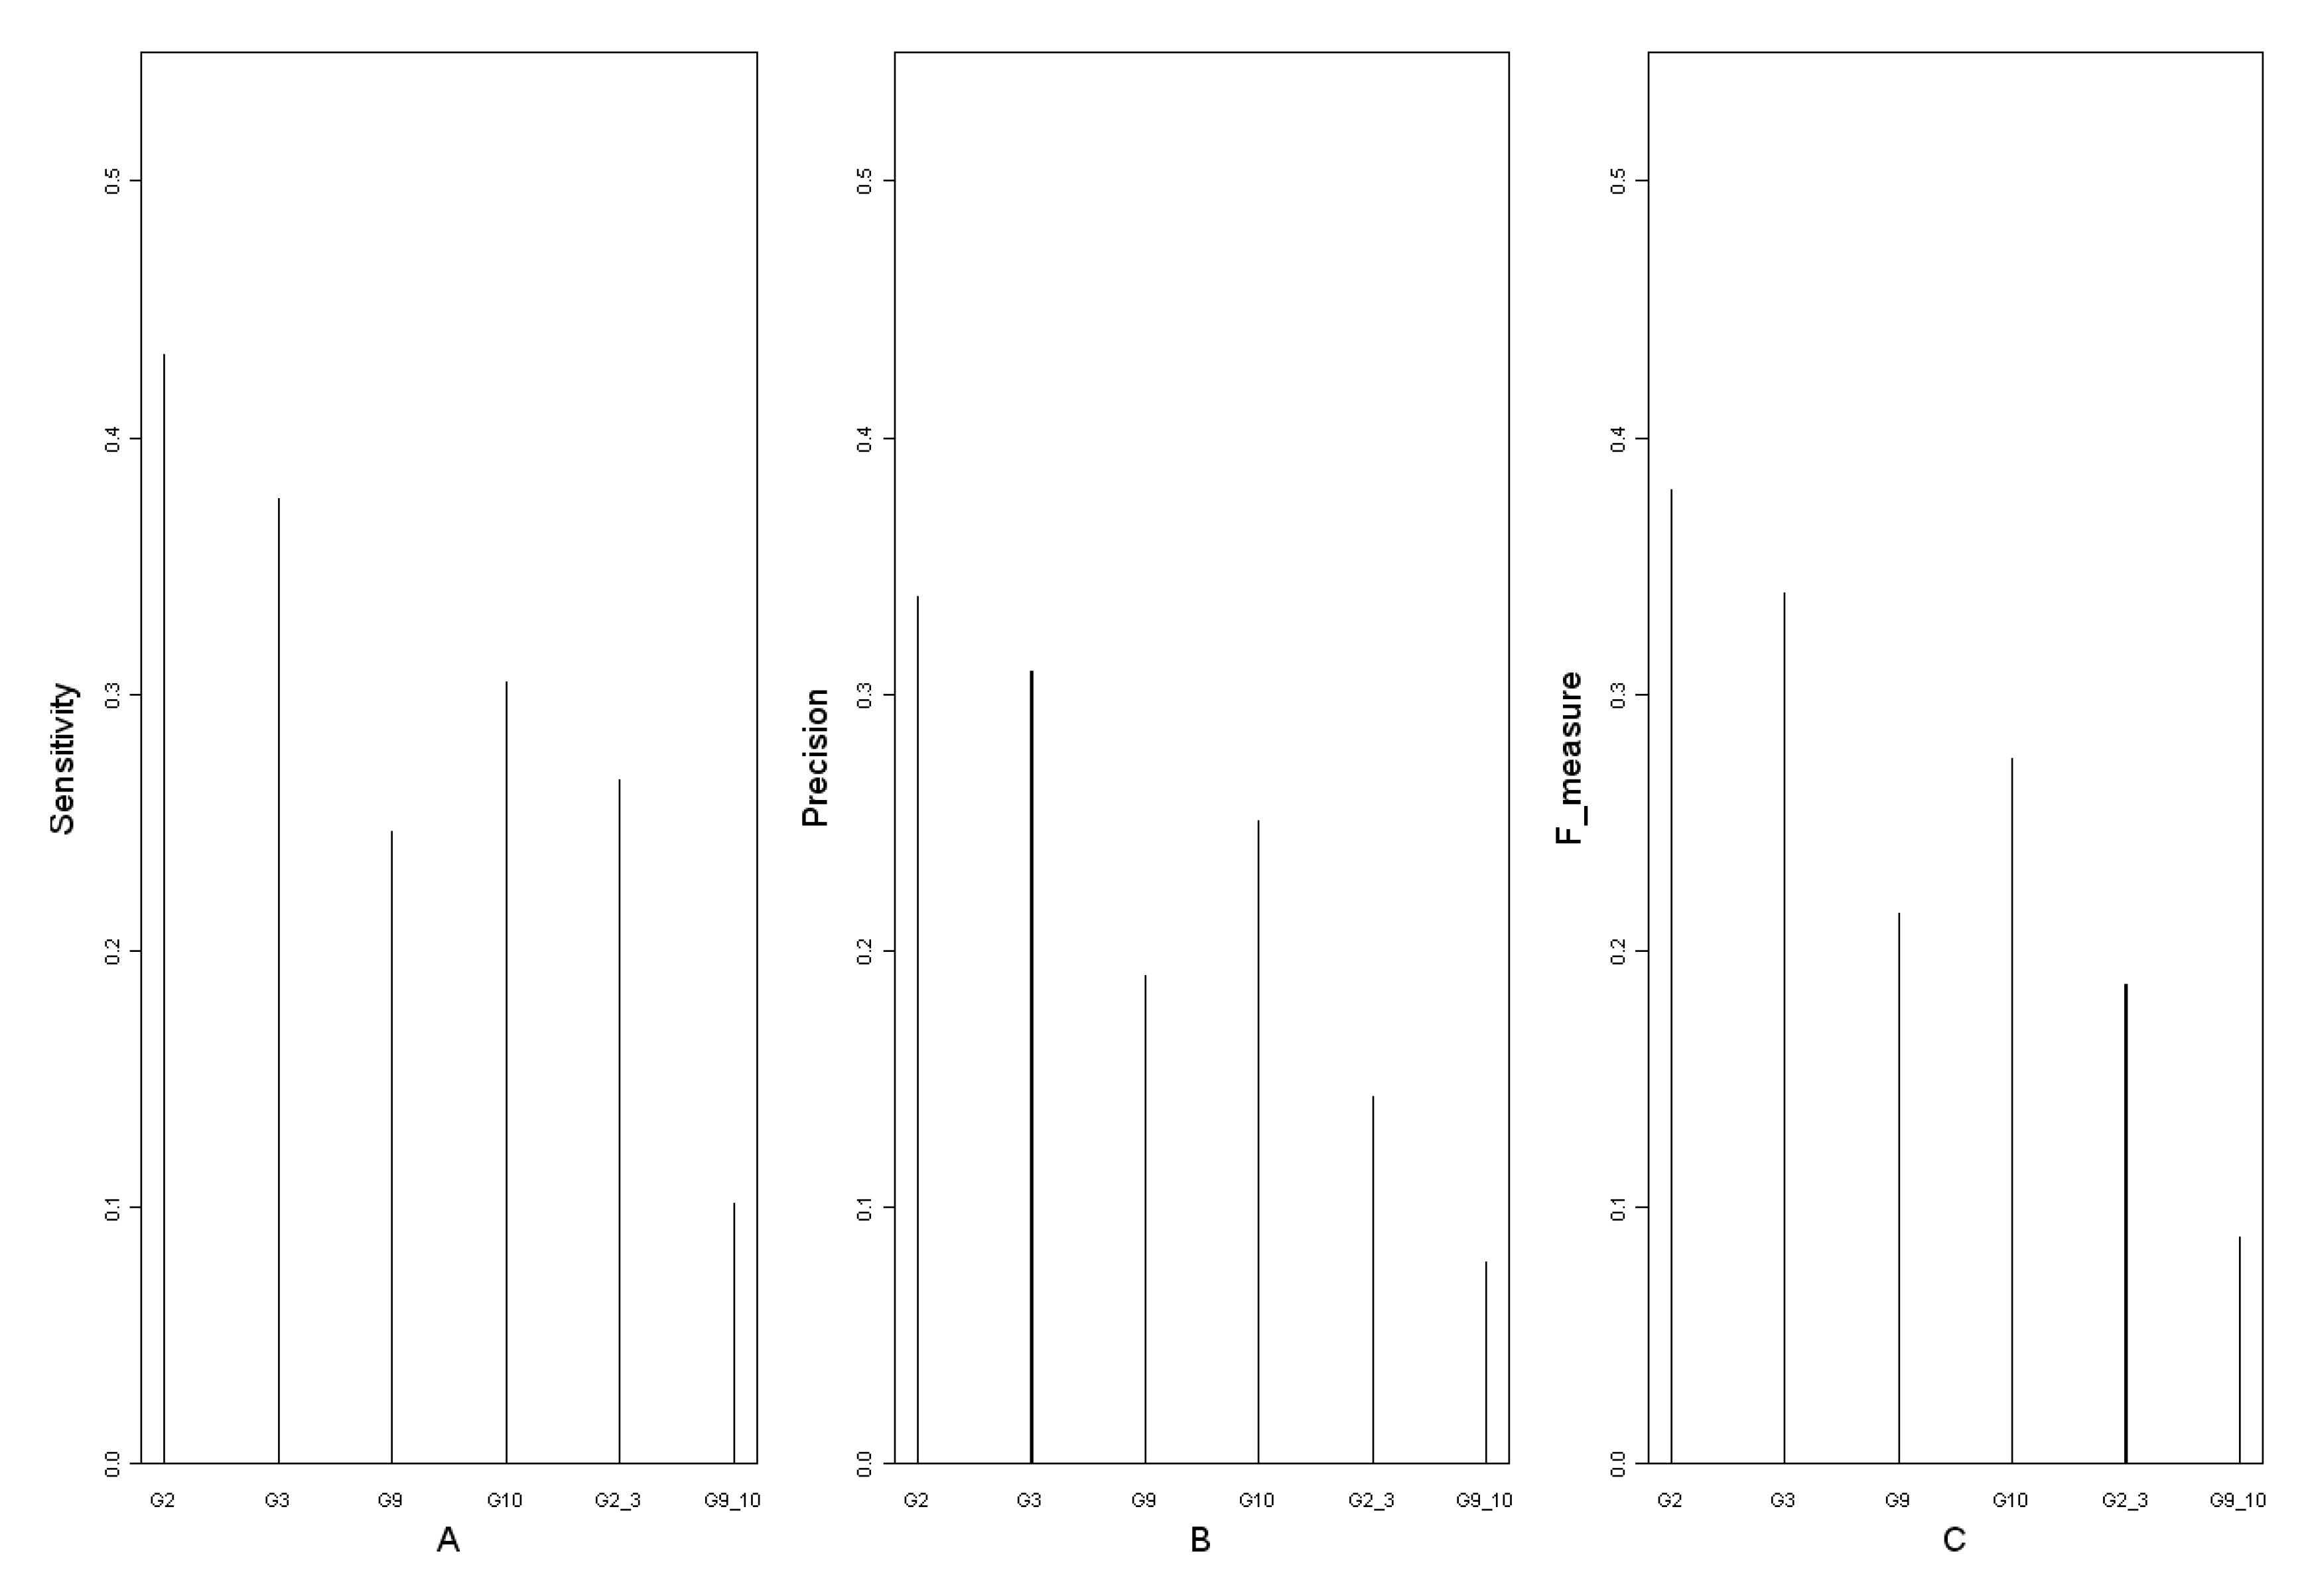
3.3. Comparison of the influence of different time points on the networks reconstruction
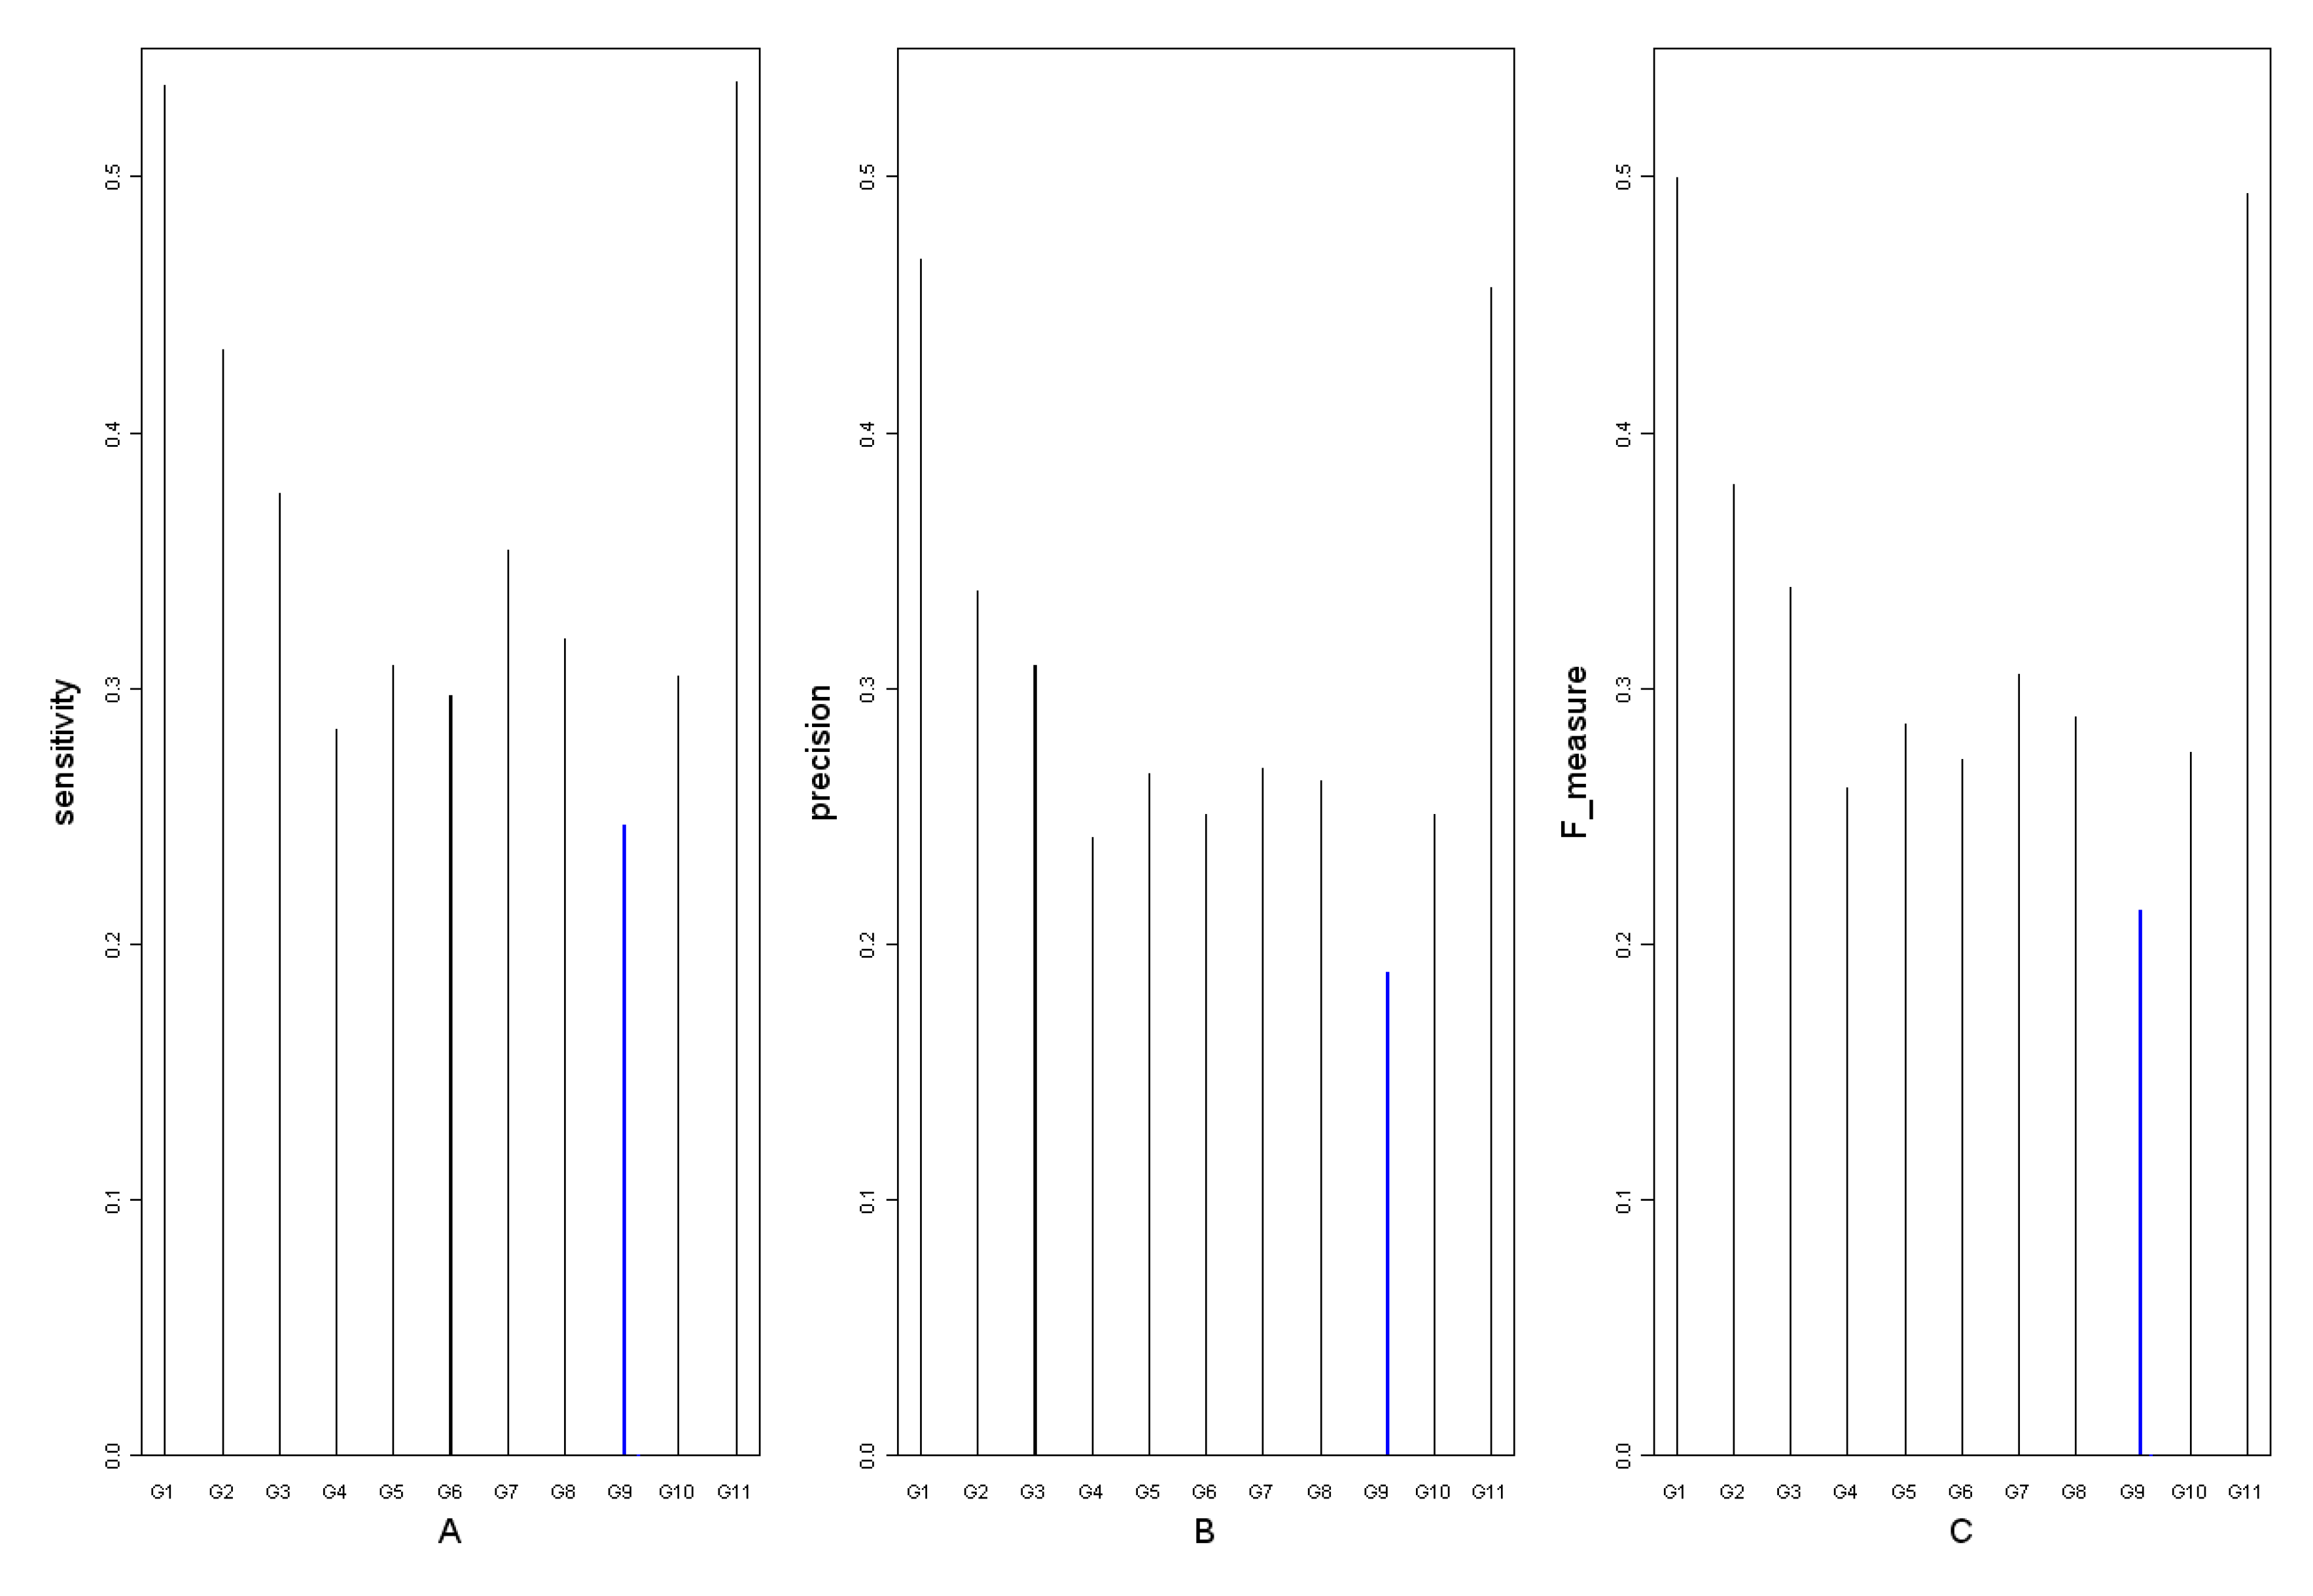
| Measurement | Definition | Descriptions | |
|---|---|---|---|
| sensitivity |  | Ntp: number of true positives Nfn: number of false negatives Nfp: number of false positives | |
| precision |  | ||
| F-measure |  | ||


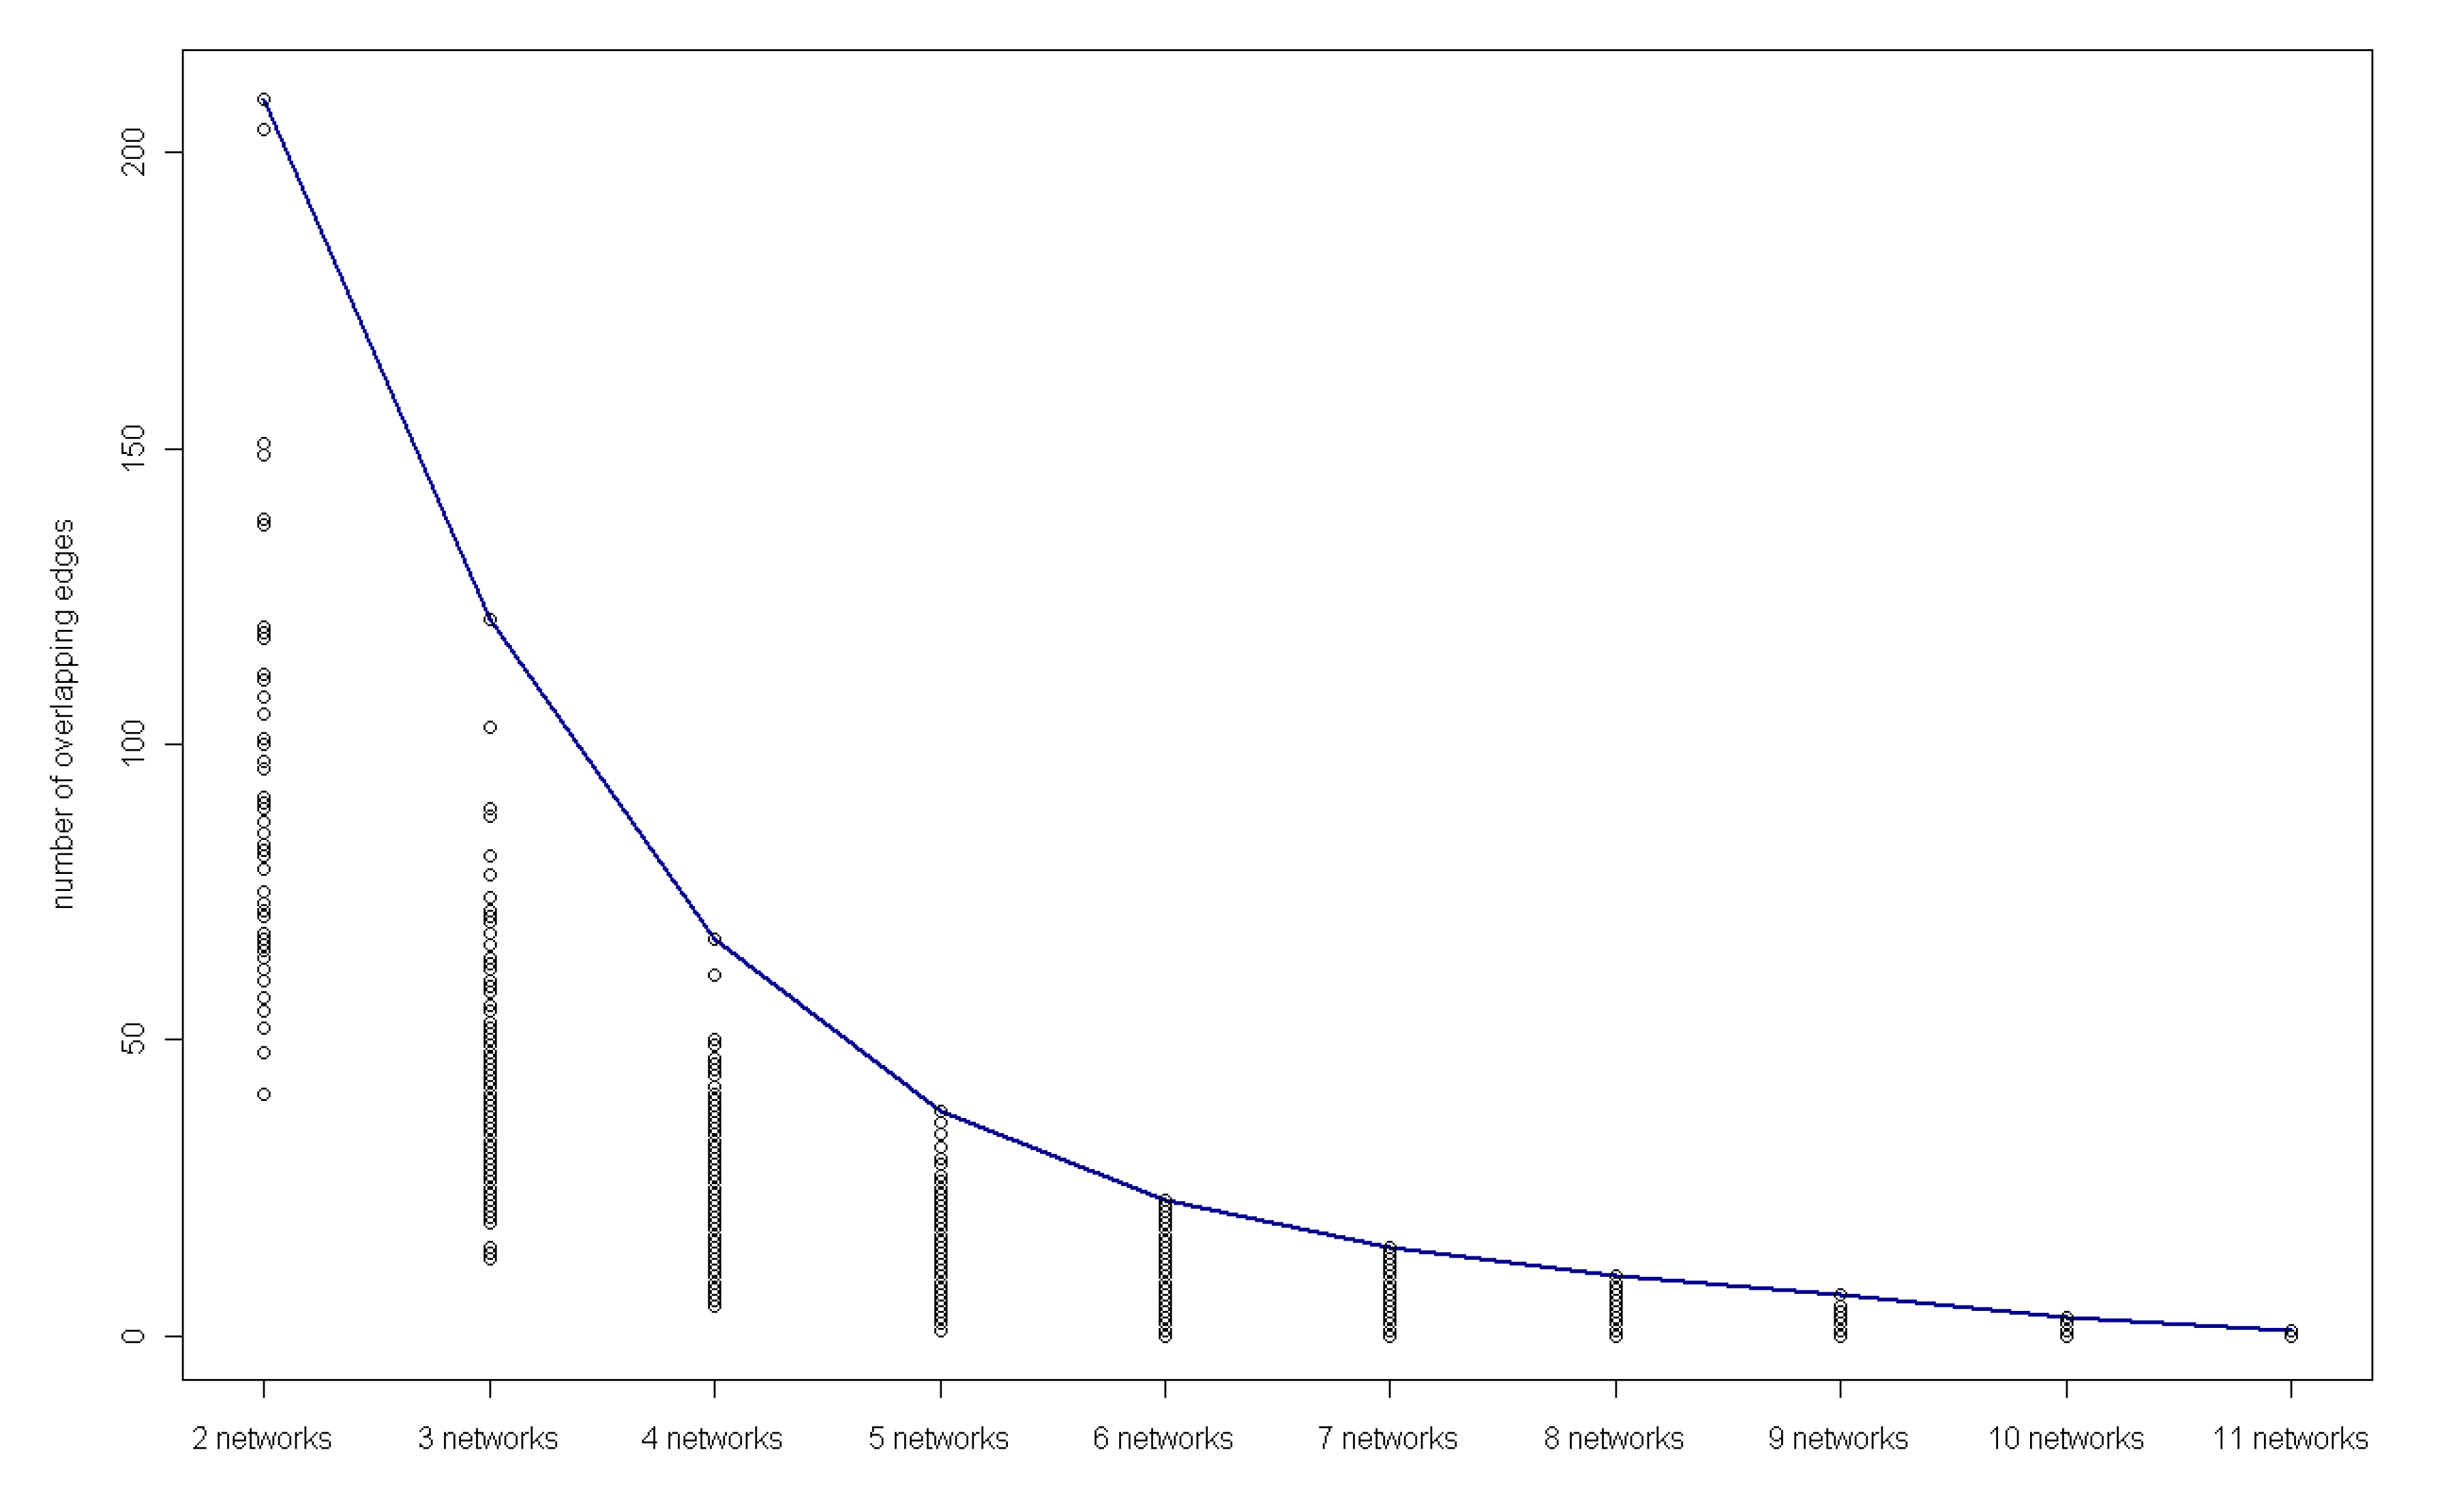
3.4. Detection of key regulatory modules
| Predictor | Target | Networks with the regulation | Network without the regulation |
|---|---|---|---|
| At1g77510 | At1g17430 | G0, G1, G2, G3, G5, G6, G7, G8, G9, G10, G11 | G4 |
| At3g02720 | At2g30010 | G0, G1, G2, G3, G4, G5, G6, G7, G8, G9, G10 | G11 |
| At5g06280 | At1g77510 | G0, G1, G2, G3, G4, G5, G6, G7, G9, G10, G11 | G8 |
| At5g58870 | At5g38510 | G0, G1, G2, G3, G4, G5, G6, G7, G8, G10, G11 | G9 |
| Predictor | Target | Networks with the regulation | Network without the regulation |
|---|---|---|---|
| At1g01250 | At4g16780 | G0, G2, G3, G4, G5, G7, G8, G9, G10, G11 | G1, G6 |
| At1g36390 | At4g09570 | G0, G1, G4, G5, G6, G7, G8, G9, G10, G11 | G2, G3 |
| At1g07180 | At3g01060 | G0, G1, G2, G3, G5, G6, G7, G8, G9, G11 | G4, G10 |
| At1g07180 | At5g35970 | G0, G1, G2, G3, G5, G6, G7, G8, G9, G11 | G4, G10 |
| At3g5490 | At3g10720 | G0, G1, G2, G4, G5, G7, G8, G9, G10, G11 | G3, G6 |
| At5g40890" | At3g11710 | G0, G1, G2, G3, G4, G6, G7, G8, G10, G11 | G5, G9 |
| At5g56900 | At4g02380 | G0, G2, G3, G4, G5, G6, G7, G8, G9, G10 | G1, G11 |
| At5g56900 | At5g66920 | G0, G1, G2, G3, G4, G6, G7, G8, G10, G11 | G5, G9 |
| At1g51110 | At3g12760 | G0, G1, G2, G3, G4, G5, G6, G7, G8, G10 | G9, G11 |
| At2g40890 | At4g35090 | G0, G1, G2, G3, G5, G6, G7, G8, G10, G11 | G4, G9 |
4. Discussion and Conclusions
Acknowledgements
References
- Kato, M.; Tsunoda, T.; Takagi, T. Inferring genetic networks from DNA microarray data by multiple regression analysis. Genome Inform. Ser. Workshop Genome Inform. 2000, 11, 118–128. [Google Scholar]
- Chen, T.; He, H.L.; Church, G.M. Modeling gene expression with differential equations. Pac. Symp. Biocomput. 1999, 29–40. [Google Scholar]
- de Hoon, M.J.; Imoto, S.; Kobayashi, K.; Ogasawara, N.; Miyano, S. Inferring gene regulatory networks from time-ordered gene expression data of Bacillus subtilis using differential equations. Pac. Symp. Biocomput. 2003, 17–28. [Google Scholar]
- Basso, K.; Margolin, A.A.; Stolovitzky, G.; Klein, U.; Dalla-Favera, R.; Califano, A. Reverse engineering of regulatory networks in human B cells. Nat. Genet. 2005, 37, 382–390. [Google Scholar]
- Liang, S.; Fuhrman, S.; Somogyi, R. Reveal, a general reverse engineering algorithm for inference of genetic network architectures. Pac. Symp. Biocomput. 1998, 18–29. [Google Scholar]
- Friedman, N.; Linial, M.; Nachman, I.; Pe'er, D. Using Bayesian networks to analyze expression data. J. Comput. Biol. 2000, 7, 601–620. [Google Scholar] [CrossRef]
- Ong, I.M.; Glasner, J.D.; Page, D. Modelling regulatory pathways in E. coli from time series expression profiles. Bioinformatics 2002, 18 Suppl. 1, S241–S248. [Google Scholar]
- Zou, M.; Conzen, S.D. A new dynamic Bayesian network (DBN) approach for identifying gene regulatory networks from time course microarray data. Bioinformatics 2005, 21, 71–79. [Google Scholar]
- Opgen-Rhein, R.; Strimmer, K. Learning causal networks from systems biology time course data: an effective model selection procedure for the vector autoregressive process. BMC Bioinformatics 2007, 8 Suppl 2, S3. [Google Scholar] [CrossRef]
- Beal, M.J.; Falciani, F.; Ghahramani, Z.; Rangel, C.; Wild, D.L. A Bayesian approach to reconstructing genetic regulatory networks with hidden factors. Bioinformatics 2005, 21, 349–356. [Google Scholar] [CrossRef]
- Perrin, B.E.; Ralaivola, L.; Mazurie, A.; Bottani, S.; Mallet, J.; d'Alche-Buc, F. Gene networks inference using dynamic Bayesian networks. Bioinformatics 2003, 19 Suppl. 2, ii138–ii148. [Google Scholar] [CrossRef]
- Rangel, C.; Angus, J.; Ghahramani, Z.; Lioumi, M.; Sotheran, E.; Gaiba, A.; Wild, D.L.; Falciani, F. Modeling T-cell activation using gene expression profiling and state-space models. Bioinformatics 2004, 20, 1361–1372. [Google Scholar] [CrossRef]
- Wu, F.X.; Zhang, W.J.; Kusalik, A.J. Modeling gene expression from microarray expression data with state-space equations. Pac. Symp. Biocomput. 2004, 581–592. [Google Scholar]
- Smith, S.M.; Fulton, D.C.; Chia, T.; Thorneycroft, D.; Chapple, A.; Dunstan, H.; Hylton, C.; Zeeman, S.C.; Smith, A.M. Diurnal changes in the transcriptome encoding enzymes of starch metabolism provide evidence for both transcriptional and posttranscriptional regulation of starch metabolism in Arabidopsis leaves. Plant Physiol. 2004, 136, 2687–2699. [Google Scholar] [CrossRef]
- Boyes, D.C.; Zayed, A.M.; Ascenzi, R.; McCaskill, A.J.; Hoffman, N.E.; Davis, K.R.; Gorlach, J. Growth stage-based phenotypic analysis of Arabidopsis: A model for high throughput functional genomics in plants. Plant Cell 2001, 13, 1499–1510. [Google Scholar]
- May, S. NASC's International Affymetrix Service. Available online: http://affymetrix.arabidopsis.info/ (accessed on 13 October 2009).
- The Comprehensive R Archive Network. Available online: http://mirrors.geoexpat.com/cran/ (accessed on 10 May 2010).
- Lèbre, S. Inferring Dynamic Genetic Networks with Low Order Independencies. Stat. Appl. Genet. Mol. Biol. 2009, 8, 9. [Google Scholar]
- Murphy, K.; Mian, S. Modelling Gene Expression Data using Dynamic Bayesian Networks; University of California, Computer Science Division: Berkeley, CA, USA, 1999. [Google Scholar]
- Carlson, J.M.; Chakravarty, A.; Khetani, R.S.; Gross, R.H. Bounded search for de novo identification of degenerate cis-regulatory elements. BMC Bioinformatics 2006, 7, 254. [Google Scholar] [CrossRef] [Green Version]
- Todeschini, R.; Consonni, V.; Mannhold, R.; Kubinyi, H.; Timmerman, H. Handbook of Molecular Descriptors; Wiley-VCH: Weinheim, Germany, 2000. [Google Scholar]
- Gonzalez-Diaz, H.; Gonzalez-Diaz, Y.; Santana, L.; Ubeira, F.M.; Uriarte, E. Proteomics, networks and connectivity indices. Proteomics 2008, 8, 750–778. [Google Scholar] [CrossRef]
- González-Díaz, H.; Munteanu, C.R. Topological Indices for Medicinal Chemistry, Biology, Parasitology, Neurological and Social Networks; Transworld Research Network: Kerala, India, 2010; p. 212. [Google Scholar]
- Stefan, B.; Heinz Georg, S. Handbook of Graphs and Networks: From the Genome to the Internet; John Wiley & Sons, Inc.: New York, NY, USA, 2003; p. 401. [Google Scholar]
- Mrabet, Y.; Semmar, N. Mathematical methods to analysis of topology, functional variability and evolution of metabolic systems based on different decomposition concepts. Curr. Drug Metab. 2010, 11, 315–341. [Google Scholar] [CrossRef]
- Chou, K.C. Graphic rule for drug metabolism systems. Curr. Drug Metab. 2010, 11, 369–378. [Google Scholar]
- Gonzalez-Diaz, H. Network topological indices, drug metabolism, and distribution. Curr. Drug Metab. 2010, 11, 283–284. [Google Scholar] [CrossRef]
- Gonzalez-Diaz, H.; Duardo-Sanchez, A.; Ubeira, F.M.; Prado-Prado, F.; Perez-Montoto, L.G.; Concu, R.; Podda, G.; Shen, B. Review of MARCH-INSIDE & complex networks prediction of drugs: ADMET, anti-parasite activity, metabolizing enzymes and cardiotoxicity proteome biomarkers. Curr. Drug Metab. 2010, 11, 379–406. [Google Scholar] [CrossRef]
- Diestel, R. Graph theory. In Graduate Texts in Mathematics; 1997; Volume 173, p. 410. [Google Scholar]
- West, D. Introduction to Graph Theory, 2nd ed; Prentice Hall: Englewood Cliffs, NJ, 1996. [Google Scholar]
- Chia, T.; Thorneycroft, D.; Chapple, A.; Messerli, G.; Chen, J.; Zeeman, S.C.; Smith, S.M.; Smith, A.M. A cytosolic glucosyltransferase is required for conversion of starch to sucrose in Arabidopsis leaves at night. Plant J. 2004, 37, 853–863. [Google Scholar] [CrossRef]
- Albert, R.; Barabasi, A.-L. Statistical mechanics of complex networks. Rev. Mod. Phys. 2002, 74, 47–97. [Google Scholar]
- Freeman, L.C. A set of measures of centrality based on betweenness. Sociometry 1977, 40, 35–41. [Google Scholar] [CrossRef]
- Wasserman, S.; Faust, K. Social Network Analysis: Methods and Applications (Structural Analysis in the Social Sciences), 1st ed; Cambridge University Press: New York, NY, USA, 1994; p. 857. [Google Scholar]
- Freeman, L. Centrality in social networks: Conceptual clarification. Soc. Networks 1979, 1, 215–239. [Google Scholar] [CrossRef]
- Latora, V.; Marchiori, M. Efficient behavior of small-world networks. Phys. Rev. Lett. 2001, 87, 198701. [Google Scholar] [CrossRef]
- Gol'dshtein, V.; Koganov, G.A.; Surdutovich, G.I. Vulnerability and Hierarchy of Complex Networks. arXiv: preprint cond-mat/0409298 2004. [Google Scholar]
- Riechmann, J.L.; Meyerowitz, E.M. The AP2/EREBP family of plant transcription factors. Biol. Chem. 1998, 379, 633–646. [Google Scholar]
- Barabasi, A.L.; Bonabeau, E. Scale-free networks. Sci. Am. 2003, 288, 60–69. [Google Scholar] [CrossRef]
- Altman, D.G.; Bland, J.M. Diagnostic tests. 1: Sensitivity and specificity. BMJ 1994, 308, 1552. [Google Scholar] [CrossRef]
- Dzeroski, S.; Todorovski, L. Equation discovery for systems biology: finding the structure and dynamics of biological networks from time course data. Curr. Opin. Biotechnol. 2008, 19, 360–368. [Google Scholar] [CrossRef]
- Wang, Y.; Joshi, T.; Zhang, X.S.; Xu, D.; Chen, L. Inferring gene regulatory networks from multiple microarray datasets. Bioinformatics 2006, 22, 2413–2420. [Google Scholar] [CrossRef]
- Sample Availability: Samples of the compounds are available from the authors.
© 2010 by the authors; licensee MDPI, Basel, Switzerland. This article is an Open Access article distributed under the terms and conditions of the Creative Commons Attribution license (http://creativecommons.org/licenses/by/3.0/).
Share and Cite
Yan, W.; Zhu, H.; Yang, Y.; Chen, J.; Zhang, Y.; Shen, B. Effects of Time Point Measurement on the Reconstruction of Gene Regulatory Networks. Molecules 2010, 15, 5354-5368. https://doi.org/10.3390/molecules15085354
Yan W, Zhu H, Yang Y, Chen J, Zhang Y, Shen B. Effects of Time Point Measurement on the Reconstruction of Gene Regulatory Networks. Molecules. 2010; 15(8):5354-5368. https://doi.org/10.3390/molecules15085354
Chicago/Turabian StyleYan, Wenying, Huangqiong Zhu, Yang Yang, Jiajia Chen, Yuanyuan Zhang, and Bairong Shen. 2010. "Effects of Time Point Measurement on the Reconstruction of Gene Regulatory Networks" Molecules 15, no. 8: 5354-5368. https://doi.org/10.3390/molecules15085354
APA StyleYan, W., Zhu, H., Yang, Y., Chen, J., Zhang, Y., & Shen, B. (2010). Effects of Time Point Measurement on the Reconstruction of Gene Regulatory Networks. Molecules, 15(8), 5354-5368. https://doi.org/10.3390/molecules15085354