Review

Stereodynamic Investigation of Labile Stereogenic Centres in Dihydroartemisinin

by
Ilaria D’Acquarica
1,*,
Francesco Gasparrini
1,*,
Dorina Kotoni
1,
Marco Pierini
1,
Claudio Villani
1,
Walter Cabri
2,
Michela Di Mattia
2 and
Fabrizio Giorgi
2
1
Dipartimento di Chimica e Tecnologie del Farmaco, Sapienza Università di Roma, P. le Aldo Moro 5, 00185 Roma, Italy
2
Analytical Development, R&D Department, sigma-tau S.p.A., Via Pontina km 30,400, 00040 Pomezia, Italy
*
Authors to whom correspondence should be addressed.
Molecules 2010, 15(3), 1309-1323; https://doi.org/10.3390/molecules15031309
Submission received: 1 January 2010 / Revised: 25 January 2010 / Accepted: 4 March 2010 / Published: 5 March 2010

Abstract

:
Since its identification in the early 1970s, artemisinin, as well as semi-synthetic derivatives and synthetic trioxanes, have been used in malaria therapy. Reduction of artemisinin by NaBH4 produced dihydroartemisinin (DHA), and yielded a new stereochemically labile centre at C-10, which, in turn, provided two interconverting lactol hemiacetal epimers (namely α and β), whose rate of interconversion depends on buffer, pH, and solvent polarity. Since interconversion of the two epimers occurred on a chromatographic time-scale, this prompted a thorough investigation of the phenomenon as a crucial requisite of any analytical method aimed at quantitating this family of drugs. In this critical review we discuss the current importance of the on-column epimerization of DHA in the development of analytical methods aimed at quantifying the drug, with the purpose of identifying the optimal conditions to minimize on-column epimerization while achieving the best selectivity and efficiency of the overall separation.

Graphical Abstract

1. Introduction

Artemisinin (Qinghaosu, 1, Figure 1) is a sesquiterpene lactone endoperoxide isolated from Artemisia annua L. that Chinese herbalists have traditionally used to treat malaria [1,2], a dramatic cause of death and illness in children and adults in tropical countries. The combination of artemisinin derivatives with other effective antimalarial medicines (artemisinin-based combination therapies or ACTs) is currently the most effective treatment for Plasmodium falciparum malaria – the most lethal form of the disease [3]. Since its identification in the early 1970s, artemisinin as well as semi-synthetic derivatives [4] and synthetic trioxanes [5] have been utilized in therapy. Reduction of artemisinin by sodium borohydride in methanol [6] produces dihydroartemisinin (DHA, 2, Figure 1), which is also its main metabolite and provides improved antimalarial potency [5]. The synthesis of 2 opened pathways for further derivatization at C-10 to give ether (3-5 in Figure 1) and ester (6 in Figure 1) derivatives, largely exploited by the China Cooperative Research Group [7] with the aim of tuning water and/or oil solubility and improving bioavailability.
Figure 1. Chemical structures of artemisinin (1), dihydroartemisinin (DHA, 2), artemether (3), arteether (4), artelinic acid (5), artesunic acid (6), and a ubiquitous thermal decomposition product of 2 designated as diketoaldehyde (DKA, 7).
Molecules 15 01309 g001
Conversion of the lactone carbonyl group at C-10 of artemisinin into the hydroxyl (hemiacetal) group in 2 yielded a new stereochemically labile centre in the molecule, which, in turn, provided two interconverting lactol hemiacetal epimers, namely 2α and 2β (Figure 2). The 2α-epimer bears the hydroxyl group in the equatorial position (absolute stereochemistry at C-10: R), whereas the 2β-epimer possesses an axial hydroxyl group [8], as shown by polytube models in Figure 3.
Figure 2. Chemical structures of the two interconverting epimers of DHA (2): the 2α-epimer bears the hydroxyl group in the equatorial position (absolute stereochemistry at C-10: R), whereas the 2β-epimer possesses an axial hydroxyl group.
Molecules 15 01309 g002
Notably, although 2 has a chair-like pyranose ring, such nomenclature is the reverse of that normally used for designating the stereochemistry of sugars and glycosides, in which, for example, the α-D-glucopyranose possesses an axial hydroxyl group [9].
Bulk solid 2 consists exclusively of the β-epimer, as illustrated by an X-ray crystallographic study on crystalline 2 [10], however, upon dissolution in various solvents, the initial solutions consisting of 2β slowly equilibrate to mixtures of 2α and 2β epimers with different solvent-dependent compositions [9,10,11,12]. The 2α epimer has not been isolated in the solid state. Computational studies, performed with AM1 and PM3 semiempirical methods, showed that the DHA epimers have very close heats of formation, i.e., have similar thermodynamic stabilities [11]. It has also been found that acylations where the hydroxyl group of 2 acts as the nucleophile exclusively yield the α-acyl derivatives for kinetic reasons. The biological implication of such a process is the observation that phase II glucuronidation of 2 exclusively provides the α-DHA-β-glucuronide [13,14]. Thus, a deeper understanding of the kinetic, thermodynamic and mechanistic features of the 2α/2β equilibration (i.e., epimerization) may have a great importance in the investigation of the mechanism of action and/or toxicity of the drug at molecular level. Moreover, since a previous study [15] on the equilibrium between 2α and 2β showed that interconversion of the two epimers occurred on a chromatographic time-scale, this prompted a thorough investigation of the phenomenon as a crucial requisite of any analytical method aimed at quantifying this family of drugs.
Figure 3. Polytube models of the two interconverting epimers of DHA (2): the 2β-epimer (right) was obtained by computer editing of the X-Ray data of crystalline 2β [10]; the model for the 2α-epimer (left) was derived by molecular mechanics optimization (MMFF force field as implemented in SPARTAN 04) by inverting the configuration at C-10.
Molecules 15 01309 g003

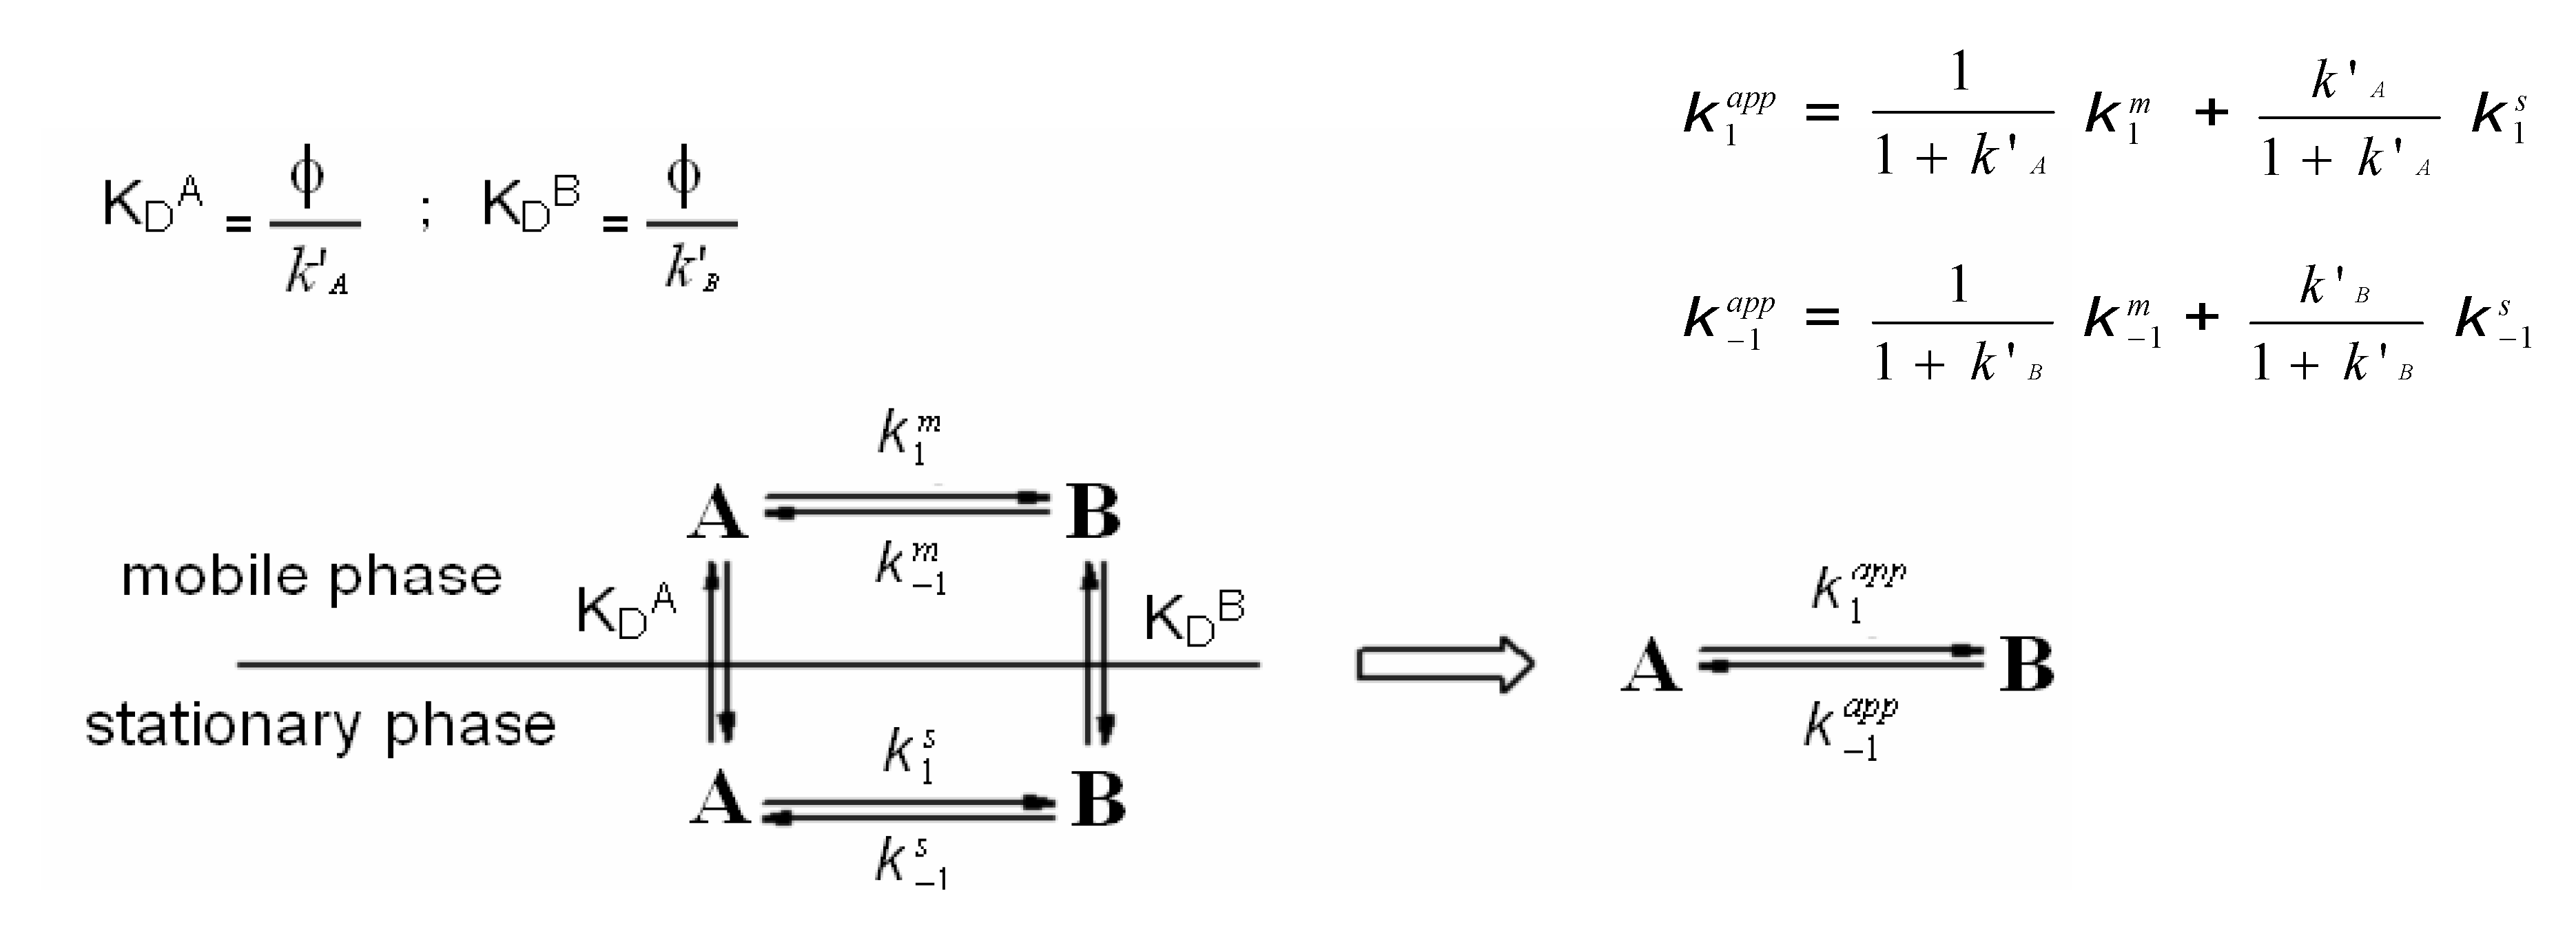
2. On-Column Interconversions

Investigations of dynamic molecular processes and determination of their kinetic parameters are commonly performed by dynamic nuclear magnetic resonance (DNMR) spectroscopy [16,17,18,19], which yields quite reliable values for the corresponding free energies of activation (ΔG#). Pertinent kinetic parameters might also be determined by chromatography, specifically for two species that interconvert during their passage through the column itself (i.e., on-column interconverting species).
Chromatographic retention of a species, in its simplest form, is related to the equilibrium constant for its distribution between the mobile and stationary phases (Scheme 1). Chromatography of two interconverting species, however, leads to the establishment of a secondary equilibrium. When an analyte is subjected to a secondary equilibrium, its retention is a weighted average of the retention of the two species [20].
Scheme 1. Primary (vertical arrows) and secondary (horizontal arrows) equilibria taking place during chromatography of two interconvertible species A and B on a stationary phase. Left: actual interconversions occurring in the mobile and stationary phases; right: the apparent equilibria. kA and kB are the retention factors of the first (A) and second (B) eluting species, k1m and k−1m are the rate constants for the forward and backward interconversion in mobile phase, respectively, and k1s and k−1s are the rate constants for the forward and backward interconversion in stationary phase, respectively.
Molecules 15 01309 g009
If the interconversion rate is slow compared to the chromatographic process, two resolved peaks are observed due to the occurrence of little or no interconversion. If the rate of interconversion is fast compared to the chromatographic process, only one peak is observed due to the extensive interconversion. However, if the interconversion is on a time-scale similar to that of the chromatographic process, band spreading and peak distortion may be observed (Figure 4). The two peaks may be joined by an elevated baseline (plateau). This elevated baseline represents species which have undergone at least one interconversion cycle during elution through the column.
Stereolabile species can therefore be conveniently investigated by Dynamic High Performance Liquid Chromatography (DHPLC), either in the form of variable temperature or variable flow chromatography. A quite comprehensive view of milestone works on dynamic chromatography and its applications is given in refs [21,22,23,24,25,26,27,28,29,30,31,32,33,34,35], including gas and liquid chromatography. DHPLC has been recently used for the study of internal molecular dynamics of a range of chiral stereolabile compounds, and for the determination of kinetic parameters for the pertinent equilibrium (i.e., the reversible isomerization of one enantiomer into the other, or enantiomerization).
In a general DHPLC experiment, the chromatographic column acts at once as chemical reactor and separation device: first-order, reversible processes where the interconversion rates are on the same time-scale as the column separation rate typically yield temperature- and flow-dependent chromatographic profiles, with an interference regime between the two resolved peaks (Figure 5). Computer simulation of the experimental deformed profiles can be used to obtain overall rate constants for the interconversion process occurring during HPLC (Figure 5).
Figure 4. DHPLC traces of a tertiary amide in the form of variable temperature HPLC.
Molecules 15 01309 g004
These rate constants are averaged values that bring contributions from the process occurring in the mobile phase (k1m and k−1m, for the forward and backward interconversion, respectively) and in the stationary phase (k1s and k−1s, for the forward and backward interconversion, respectively). If one of the two constants (usually km) is available from independent measurements, the missing rate constant can be obtained by simulation [27].
Figure 5. Computer-simulation of experimental deformed profiles of two interconverting species. Red line: experimental profile. Blue line: computer-simulated profile. Green lines: computer-simulated profiles of the individual interconverting species.
Molecules 15 01309 g005
Several methods have been used to extract kinetic data from experimental elution profiles (the theoretical plate model [27], the stochastic model [26,33], the continuous flow model [25], peak deconvolution methods [32,33], approximation functions [31], and the unified equation [35]), and each method exploits a different theoretical framework to describe the dynamic system in which primary and secondary equilibria take place inside the column (Scheme 1). The theoretical plate model portrays the chromatographic separation as a discontinuous process, by assuming that all the steps continually proceed in separate uniform sections of a column consisting of N plates. Each theoretical plate is then considered as a distinct chemical reactor in which three events take place: distribution of the species between the mobile and stationary phases, interconversion in both phases, and shifting of the mobile phase onto the next plate [27]. The stochastic model describes the chromatographic separation using time-dependent distribution functions [26,33]. The elution profile of two interconverting species is given by the sum of the distribution functions of the non-interconverted species and the probability of density functions of the interconverted species. In the continuous flow model, general analytical expressions based on the dimensionless Damköhler (Da) number describe the chromatographic mass distribution at the column outlet for a solute subjected to secondary equilibria [25]. In contrast to these ab initio-type simulations, semiempirical peak deconvolution methods have also been developed to estimate rate constants of enantiomerization and isomerization [32,33]. A direct calculation of enantiomerization barriers from chromatographic parameters based on an approximation function was also attempted [31], limited to equilibrated and degenerated first-order reactions, i.e., enantiomerizations. Later on, a unified equation has been derived [35] to calculate rate constants of reversible as well as irreversible (pseudo-) first-order reactions by a few iterative steps, without the need of performing a computationally extensive simulation of elution profiles. This calculation method is a valuable tool for the investigation of first-order reactions, in particular the stereochemical integrity of enantiomeric, epimeric, and isomeric compounds. In this context, it is worthy of noting that we have developed a lab-made computer program, Auto DHPLC y2k, which implements both stochastic [26,33] and theoretical plate [27] models, and may take into account all types of first-order interconversions, i.e. , enantiomerizations as well as diastereomerizations or constitutional isomerizations (e.g. pseudo first-order tautomerizations), as well as tailing effects [36,37,38,39,40,41]. Within non-enantiomeric isomerizations, forward and backward processes occur at different rates in the achiral mobile phase, where the two isomerizing species are usually present in differing amounts. According to the thermodynamic cycle involved inside a virtual chromatographic theoretical plate for a generic first-order isomerization process concomitant with the chromatographic distribution equilibria (see Scheme 1), we applied in the algorithm the following general equation:
Molecules 15 01309 i001
where kA and kB are the retention factors of the first (A) and second (B) eluting species, k−1m and k1m are the rate constants for the backward and forward interconversion in mobile phase, respectively, and k1s and k−1s are the rate constants for the forward and backward interconversion in stationary phase, respectively. Program functionality was validated on several first-order isomerizations (both enantiomerization and non-enantiomerization) by comparing DHPLC results with those obtained by DNMR technique [36,37,38,39] or by classical method [40]. The algorithm also implements the chance of taking tailing effects into account. Both chromatographic and kinetic parameters can be automatically optimized by simplex algorithm until obtaining the best agreement between experimental and simulated dynamic chromatograms.

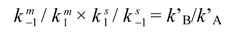
3. HPLC Analytical Methods for DHA

Numerous HPLC methods [42,43,44,45,46,47,48,49,50,51,52,53,54,55,56,57] have been developed for the analysis and monitoring of plasma levels of 2, typically based on two main detection strategies due to the lack of strong ultraviolet absorption or fluorescent chromophores: reductive electrochemical (EC) [42,45,46,47,56] and UV detection [43,44,53], with pre- or post-column derivatization. The latter approach lacks specificity in that metabolites of the drug are also converted, in many instances, to products having overlapping UV spectra. On the other hand, HPLC-EC provides excellent specificity and sensitivity, although it suffers from some inherent difficulties, i.e., rigorous deoxygenation of samples and mobile phases, and special laboratory facilities are needed. To overcome these shortcomings, evaporative light scattering detection (ELSD) was also coupled to the HPLC analysis of artemisinin and related analogues [48]. The high sensitivity and selectivity of mass spectrometry (MS) opened the way to a proliferation of analytical methods based on HPLC-MS coupling [49,50,51,52,55,57] for the plasma monitoring of 2, either based on atmospheric pressure chemical ionization (APCI) [50,55] or electrospray ionization (ESI) mode [49,51,52,57]. Radiochromatographic detection [54] was exploited as well in a recent HPLC study aimed at determining the 2α/2β ratios in vivo and evaluating the protein binding of 2.
Notwithstanding such a wide availability of literature on robust HPLC methods suitable for the analysis of 2, none of them considers the effects of epimer equilibration on the analytical response. Actually, the very first study showing that interconversion of the two DHA epimers (Figure 2) occurred on a chromatographic time-scale (i.e., on-column epimerization could be detected) was performed in 1986 by investigating the multiple-peaks of the drug by reversed-phase HPLC [15], but no other related papers appeared in literature afterwards. Moreover, the author of that study reported a greatly overestimated activation energy barrier of 280 kJ mol1 for the interconversion of the two DHA epimers, which cannot be related to dynamic events occurring on the chromatographic time-scale at room temperature [58]. Only recently [41], was this issue considered with the aim of providing improved and reliable HPLC procedures suited for either separation of 2α and 2β or their quantification in solution and in complex mixtures, under conditions of suppressed interconversion. In such study, we developed an effective analytical approach to overcome the intrinsic shortcomings of the International Pharmacopoeia guidelines on antimalarial drugs.

4. Pharmacopoeia Guidelines on Antimalarial drugs

In the International Pharmacopoeia monograph on Artenimolum or Artenimol (i.e., dihydroartemisinin) [59], the method currently recommended is an HPLC assay based on the use of a stainless steel column (100 mm × 4.6 mm I.D.) packed with a reversed-phase (RP) C18 stationary phase (3.0 μm particle size). The mobile phase is acetonitrile-water 60:40 (v/v), delivered at a flow-rate of 0.6 mL min1 and the detection system used is an ultraviolet spectrophotometer set at a wavelength of about 216 nm. The aim of the pharmacopoeial method is to quantitate DHA (2) in the presence of artemisinin (1) as related substance. The monograph does not provide for any other related substance. The final requirement is that “the test is not valid unless the relative retention of α-artenimol compared with artemisinin is about 0.6, and the resolution between the peaks is not less than 2.0. […] Measure the areas of the peak (twin-peak) responses and calculate the percentage content of C15H22O5 (i.e., artemisinin) with reference to the dried substance”. Four main items are raised when considering the above method: (i) the column temperature is not specified; (ii) no mention is made of the interconversion between the two epimers of 2, which indeed occurs on the chromatographic time-scale; (iii) the conditions are not very selective towards DKA (7, Figure 1), which is a ubiquitous contaminant of 2, and (iv), since signal-to-noise ratios in the presence of plateau zones are always smaller than in normal elution profiles, quantitation of species eventually eluting in the plateau area would be negatively affected. The main drawback of the method, however, is that the presence of a visible plateau between the two DHA epimers (they called it twin-peak) is completely neglected. In addition, stationary phases may have a retarding or activating effect on the kinetics of the dynamic process involving stereolabile species [20], and this feature should be taken into account as well.
Figure 6. Typical room temperature chromatograms obtained for a standard mixture of 1 and 2 (containing 7 as impurity). Peak 1 corresponds to 7, peak 2 to the 2α-epimer, peak 3 to the 2β-epimer, and peak 4 to 1. Reproduced from Figure 3 in Reference [41] with permission from Elsevier. Copyright 2008.
Molecules 15 01309 g006

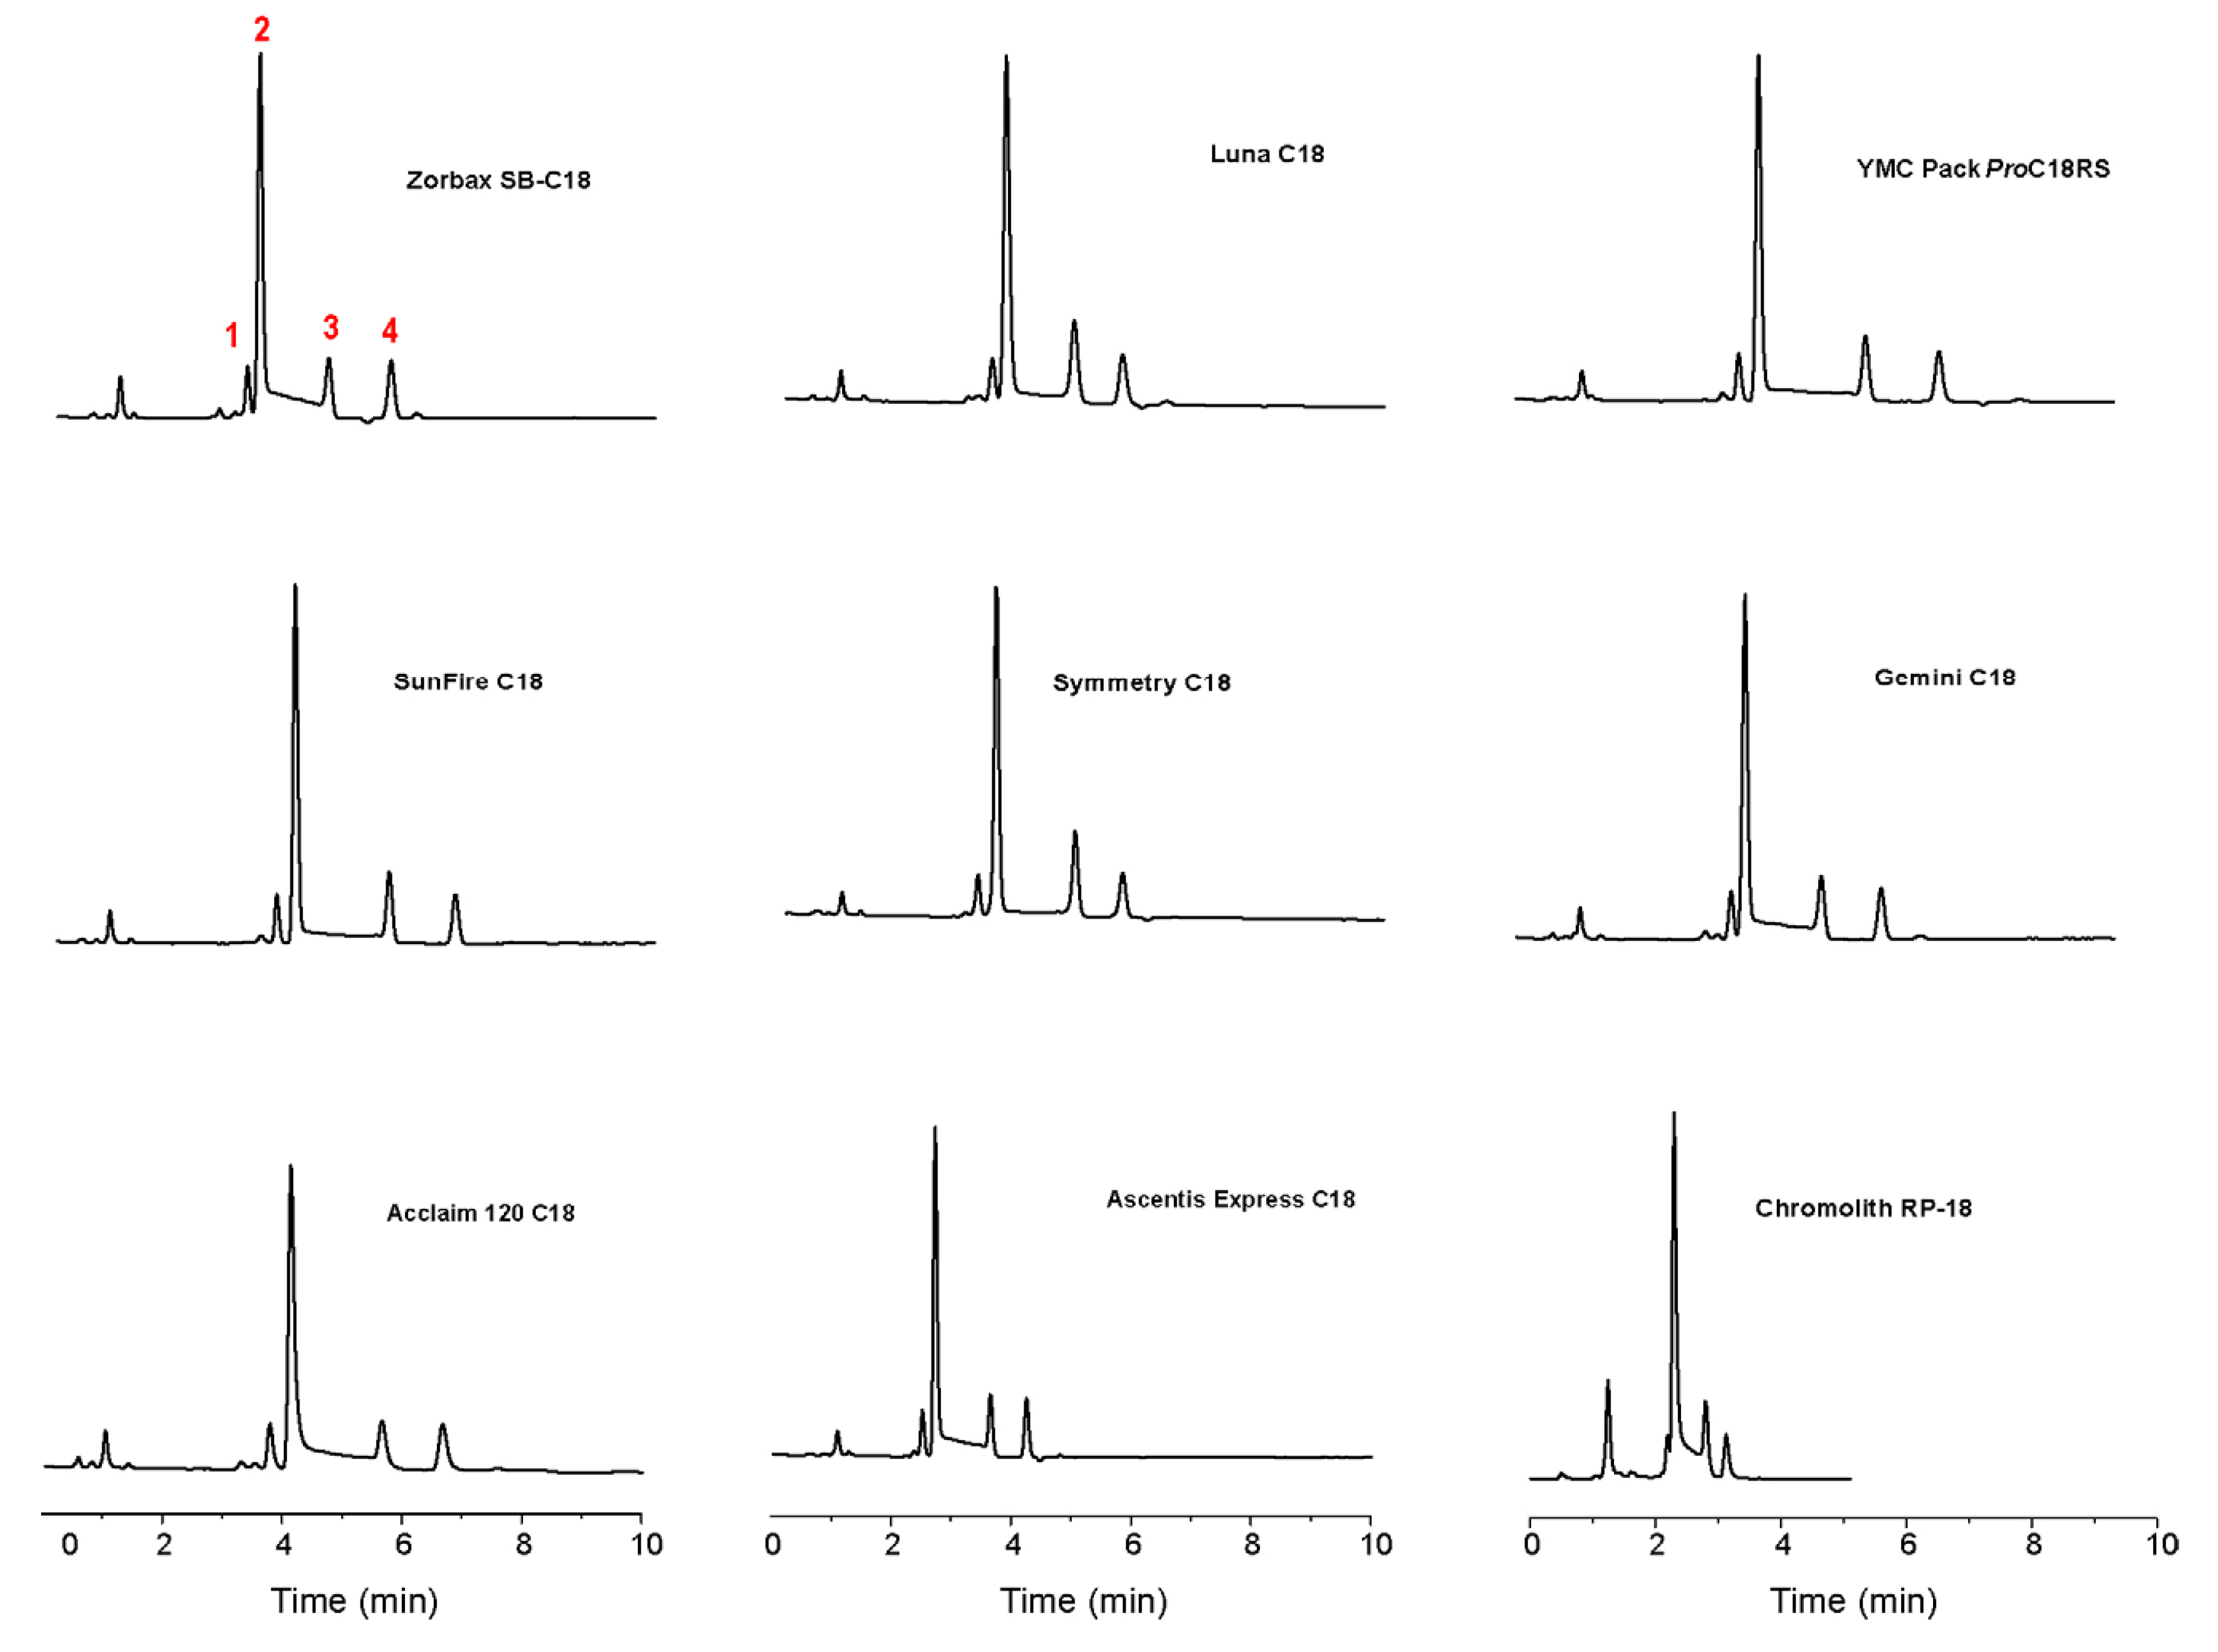
5. On-Column Epimerization of DHA

To overcome the intrinsic shortcomings of the International Pharmacopoeia and try to address the four points raised when considering such method, we have performed a systematic investigation of the influence of chromatographic conditions (stationary phase and column temperature) on the simultaneous reversed-phase HPLC determination of artemisinin (1), α-DHA (2α), β-DHA (2β), and a thermal decomposition product of 2 (DKA, 7), taking into consideration for the first time the on-column epimerization of 2 [41]. Nine commercial RP-C18 columns with different pore size, surface area, carbon load and permeability were evaluated according to the International Pharmacopoeia monograph on DHA (see Figure 6), and compared on the basis of their stationary phase effect towards the interconversion between 2α and 2β. In particular, we defined the Catalytic Effect of Stationary Phases (CESP) as the percentage increasing (positive) or decreasing (negative) of the epimerization rate constant, with respect to the analogous value measured in mobile phase.
Activation free energies of the process, obtained by computer simulation of the experimentally obtained elution profiles (see Figure 7), showed that the Symmetry C18 column among the nine analyzed has an inhibiting effect on epimerization (ΔG# = 22.1 for 2α2β and 21.6 kcal mol−1 for the backward process, compared to ΔG# = 21.7 and 21.0 kcal mol1 for the same processes in free solution).
Figure 7. (A) Schematic representation of the integration mode used for the calculation of 2α- and 2β-epimers areas. (B) Computer simulated profiles of 2α (dotted line), 2β (dashed line), and of the mixture 2α+ 2β (solid line). Reproduced from Figure 5 in Reference [41] with permission from Elsevier. Copyright 2008.
Molecules 15 01309 g007
This column was therefore selected for the development of a cryo-HPLC method aimed at minimizing on-column interconversion. Variable temperature (from 40 to 0 °C) separations performed on the Symmetry C18 column allowed to detect plateau zones only at T > 20 ° C. For this reason, only simulations of the chromatograms registered from 40 to 25 °C were made, by using the classical stochastic model, as implemented within the Auto DHPLC y2k program [36,37,38,39,40]. Since the 2α/2β ratio was shown to be temperature-independent within the explored range, a constant value of the relative abundances of the two epimers was set in all the performed relevant simulations.
On the basis of the epimerization rate constants extrapolated at T < 25 °C, we calculated a marginal plateau area (< 2%) only close to T = 0 °C for the Symmetry C18 column, clearly showing that low column temperatures are necessary to suppress interconversion. Figure 8 shows the superimposed experimental and simulated chromatographic profiles with the measured activation free energies. Van’t Hoff analyses of the obtained data were also carried out to evaluate the enthalpic and entropic contributions to the epimerization barrier. We found that just a quite small contribution to ΔG#αβ and ΔG#βα is due to entropy (ΔS# values < 10 u.e.). This suggested that a monomolecular process may be involved in the rate-determining step, reasonably, the ring opening of either the protonated or deprotonated α- or β-hemiacetalic form of 2, generated in a previous reversible step by reaction with an acid or a base, respectively. Such kinetic pathway would be in agreement to what already reported [12].
In conclusion, a full thermodynamic and kinetic investigation of the DHA interconversion [58] will shed light on the effective ratio of the two epimers in vivo, irrespective of the isomeric purity at which the drug would have been administered, as well as on their preferential protein binding. Moreover, since artemisinin and its synthetic derivatives are discovered to be additionally endowed with anticancer, antiangiogenesis, antiviral, immunosuppressive, and antifungal activity, they also represent a very promising field in drug discovery [60,61].
Figure 8. Variable temperature chromatographic profiles obtained on the Symmetry C18 column. Solid line: experimental chromatograms. Dotted line: computer simulated profiles obtained with the measured free energy activation barriers for the on-column epimerization process. Reproduced from Figure 7 in Reference [41] with permission from Elsevier. Copyright 2008.
Molecules 15 01309 g008

6. Conclusions

Artemisinin derivatives such as DHA, artesunate, and artemether are nowadays playing an increasing role in the treatment of drug-resistant malaria. They are the most potent antimalarials available, rapidly lethal to all asexual stages of the parasite Plasmodium falciparum. DHA is the main metabolite of artemisinin, and contains a stereochemically labile centre at C-10, which, in turn, provides two interconverting lactol hemiacetal epimers, namely α and β. DHA at the solid state consists exclusively of the β-epimer, however, upon dissolution in various solvents, the initial solutions slowly equilibrate to mixtures of α- and β-epimers with different solvent-dependent composition. Thus, a deeper understanding of the kinetic, thermodynamic and mechanistic features of the DHA equilibration (i.e., epimerization) may prove of great importance in the investigation of the mechanism of action and/or toxicity of the drug at molecular level. Moreover, since the equilibrium between the two DHA epimers occurs in a chromatographic time-scale, a crucial requisite of any chromatographic method aimed at quantitating this family of drugs is the identification of some optimal conditions (such as stationary phase and column temperature) able to suppress or at least minimize on-column epimerization, while achieving the best selectivity and efficiency of separation. Actually, in the International Pharmacopoeia monograph on DHA, the drug is quantitated in the presence of artemisinin as related substance. No other related substance is contemplated. The main drawback of the method, however, is that the presence of a visible plateau between the two interconverting epimers is completely neglected. Despite the large availability in literature of robust HPLC methods suitable for the analysis of DHA, none of them considers the effects of epimers equilibration on the analytical response. Only recently, this issue was considered with the aim of providing improved and reliable HPLC procedures suited for either separation of 2α and 2β or their quantification in solution and in complex mixtures. Dynamic High Performance Liquid Chromatography (DHPLC) and computer simulation of the experimental deformed profiles clearly showed that low column temperatures are necessary to suppress interconversion between DHA epimers.

Acknowledgements

Financial support from FIRB, Research program: Ricerca e Sviluppo del Farmaco (CHEM-PROFARMA-NET), grant no. RBPR05NWWC_003 is acknowledged.
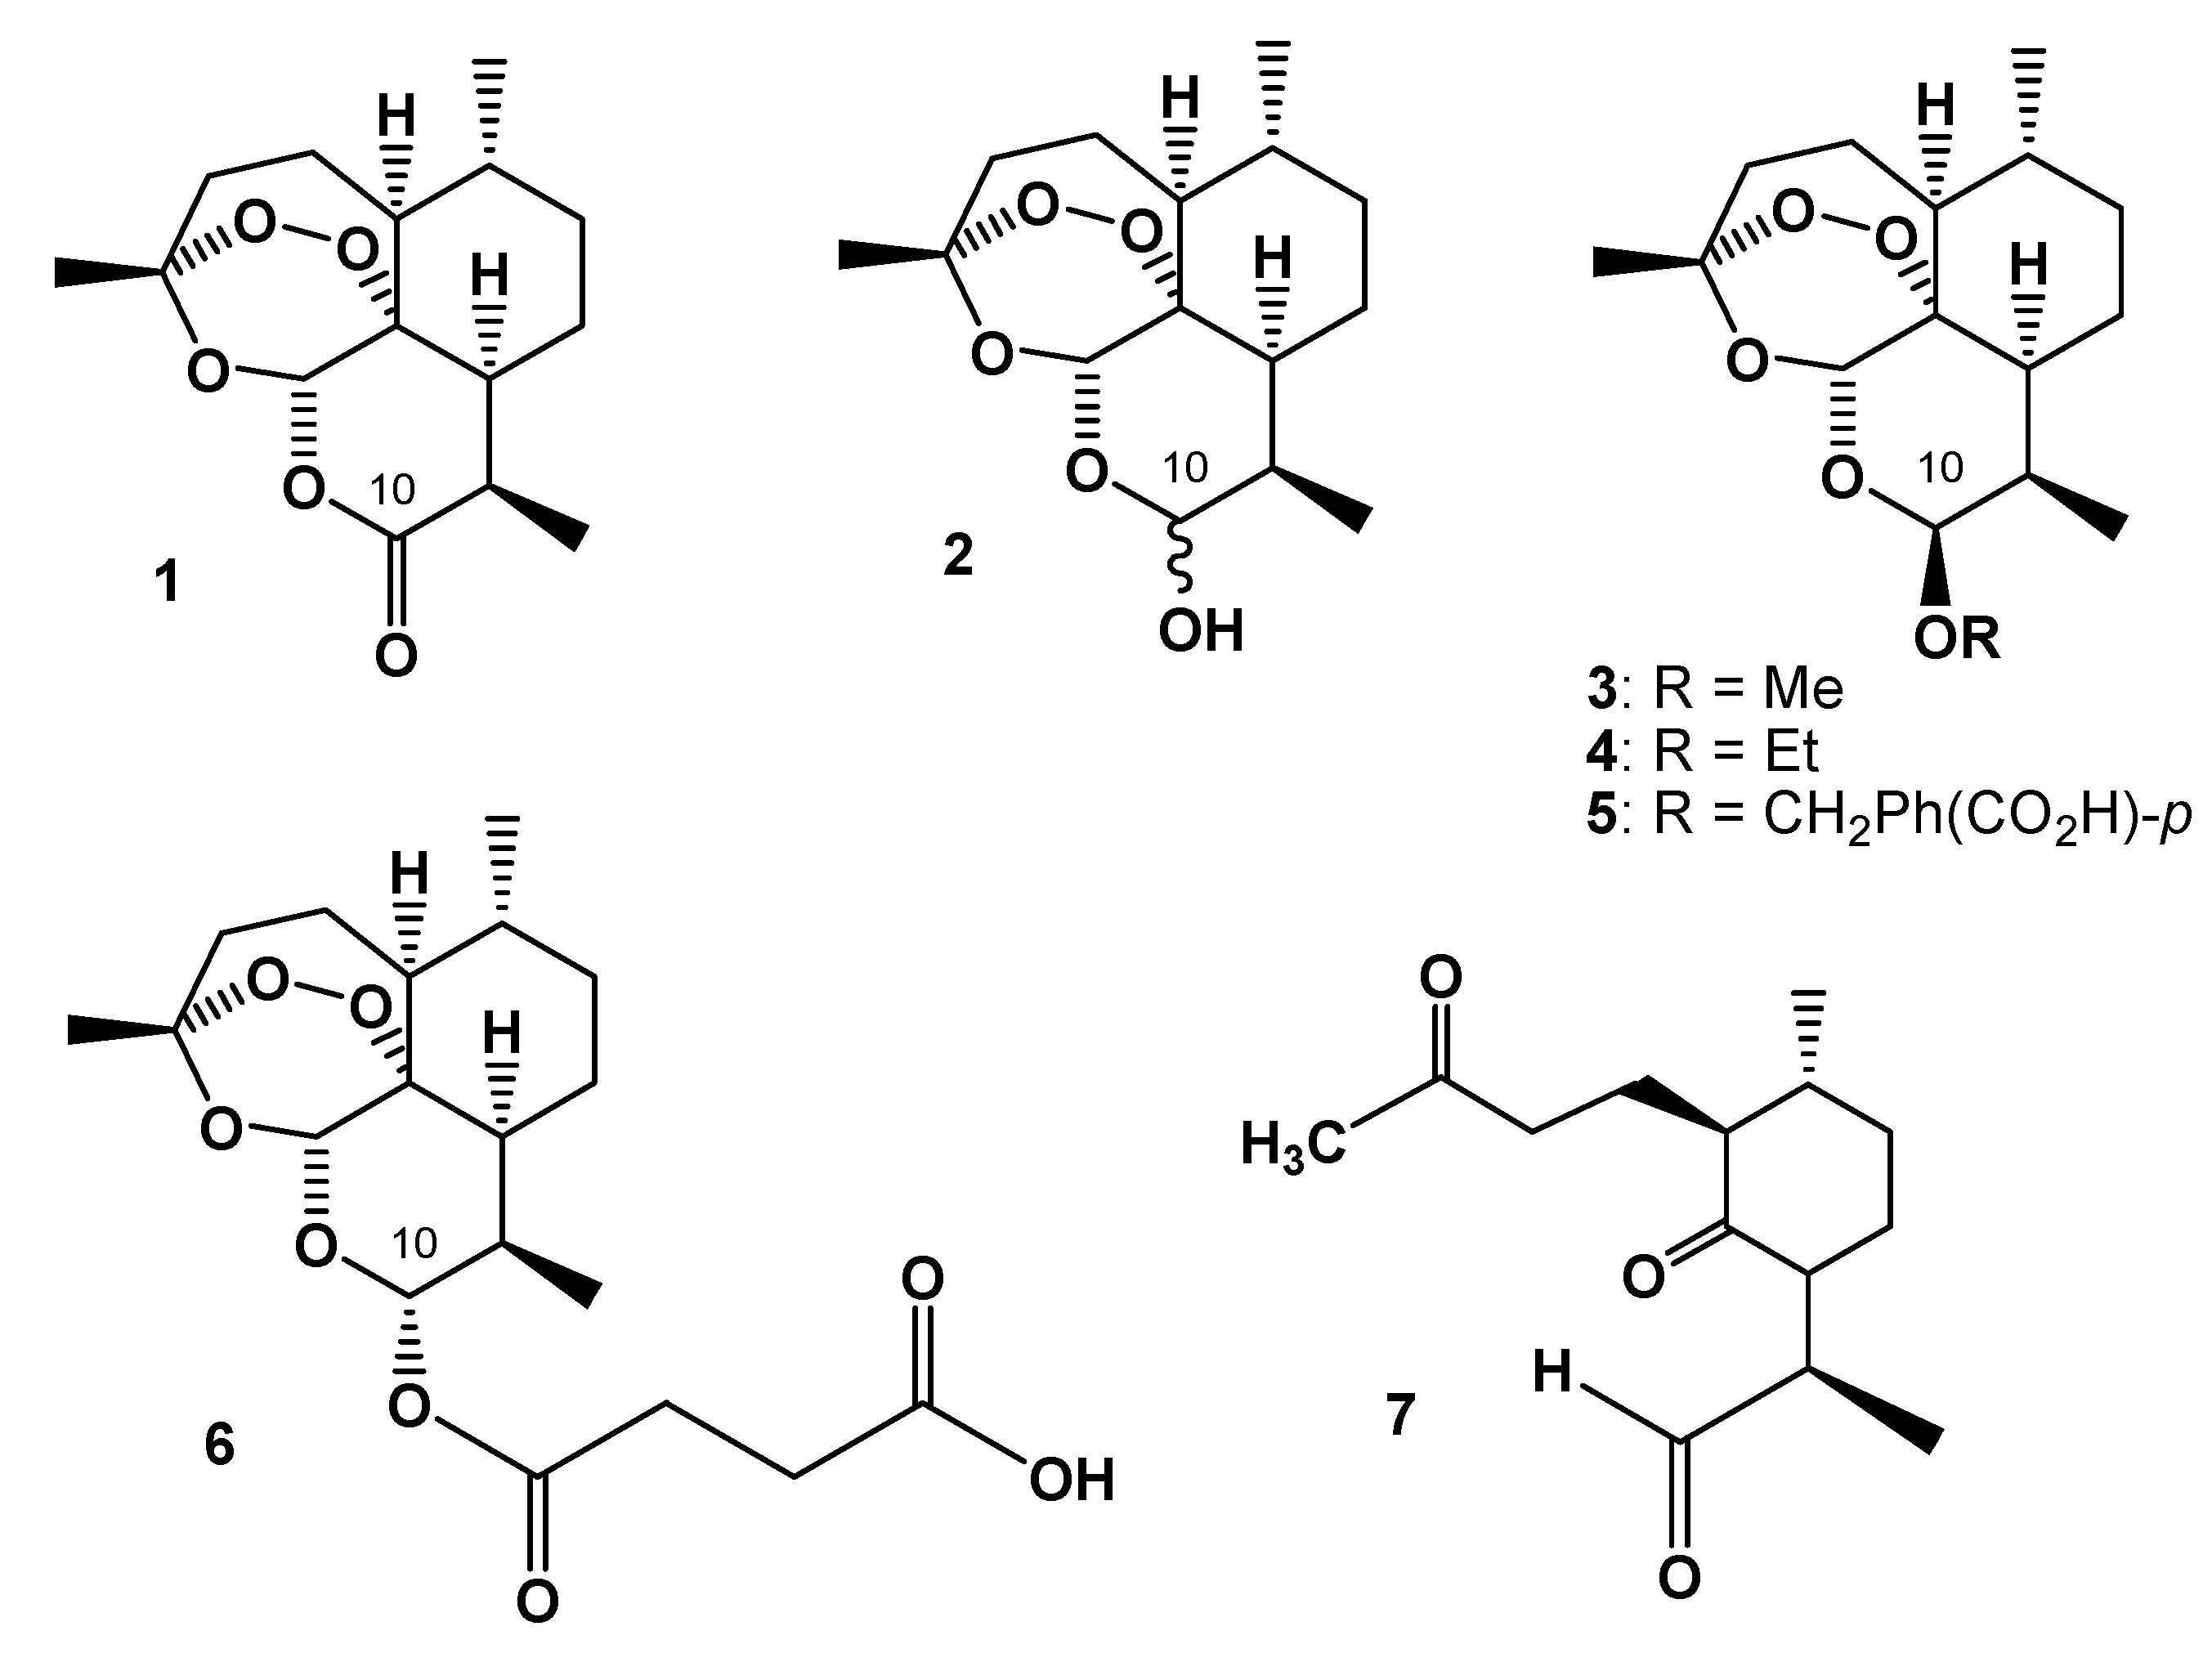
  • Samples Availability: Samples of compounds 1, 2, and 7 are available from authors.

References and Notes

  1. Guidelines for the Treatment of Malaria; World Health Organization: Geneva, Switzerland, 2006.
  2. Klayman, D.L. Qinghaosu (artemisinin): An Anti-malarial Drug from China. Science 1985, 228, 1049–1055. [Google Scholar]
  3. Ashley, E.A.; White, N.J. Artemisinin-based Combinations. Curr. Opin. Infect. Dis. 2005, 18, 531–536. [Google Scholar] [CrossRef]
  4. O'Neill, P.M. The Therapeutic Potential of Semi-Synthetic Artemisinin and Synthetic Endoperoxide Antimalarial Agents. Expert Opin. Invest. Drugs 2005, 14, 1117–1128. [Google Scholar] [CrossRef]
  5. O’Neill, P.M.; Posner, G.H. A Medicinal Chemistry Perspective on Artemisinin and Related Endoperoxides. J. Med. Chem. 2004, 47, 2945–2964. [Google Scholar] [CrossRef]
  6. Li, Y.; Yu, P.-L.; Chen, Y.-X.; Li, L.-Q.; Gai, Y.-Z.; Wang, D.-S.; Zheng, Y.-P. Synthesis of some artemisinin derivatives. Chin. Sci. Bull. 1979, 24, 667–669. [Google Scholar]
  7. China Cooperative Research Group on Qinghaosu and its Derivatives as Antimalarials. The Chemistry and Synthesis of Qinghaosu Derivatives. J. Tradit. Chin. Med. 1982, 2, 9–16.
  8. Pathak, A.K.; Jain, D.C.; Sharma, R.P. 13C NMR Assignments of α- and β-dihydroartemisinin. Indian J. Chem., B: Org. Chem. Incl. Med. Chem. 1995, 34, 992–993. [Google Scholar]
  9. Haynes, R.K.; Chan, H.-W.; Cheung, M.-K.; Chung, S.T.; Lam, W.-L.; Tsang, H.W.; Voerste, A.; Williams, I.D. Stereoselective Preparation of 10α- and 10β-Aryl Derivatives of Dihydroartemisinin. Eur. J. Org. Chem. 2003, 2098–2114. [Google Scholar]
  10. Luo, X.; Yeh, H. J.C.; Brossi, A.; Flippen-Anderson, J.L.; Gilardi, R. The Chemistry of Drugs. Configurations of Antimalarials Derived from Qinghaosu: Dihydroqinghaosu, Artemether, and Artesunic Acid. Helv. Chim. Acta 1984, 67, 1515–1522. [Google Scholar]
  11. Haynes, R.K.; Chan, H.-W.; Cheung, M.-K.; Lam, W.-L.; Soo, M.-K.; Tsang, H.-W.; Voerste, A.; Williams, I.D. C-10 Ester and Ether Derivatives of Dihydroartemisinin 10-α Artesunate, Preparation of Authentic 10-β Artesunate, and of other Ester and Ether Derivatives Bearing Potential Aromatic Intercalating Groups at C-10. Eur. J. Org. Chem. 2002, 113–132. [Google Scholar]
  12. Haynes, R.K. From Artemisinin to New Artemisinin Antimalarials: Biosynthesis, Extraction, Old and New Derivatives, Stereochemistry and Medicinal Chemistry Requirements. Curr. Topics Med. Chem. 2006, 6, 509–537. [Google Scholar] [CrossRef]
  13. Maggs, J.L.; Madden, S.; Bishop, L.P.; O’Neill, P.M.; Park, K.B. The Rat Biliary Metabolites of Dihydroartemisinin, an Antimalarial Endoperoxide. Drug Metab. Dispos. 1997, 25, 1200–1204. [Google Scholar]
  14. Ramu, K.; Baker, J.K. Synthesis, Characterization and Antimalarial Activity of the Glucuronides of the Hydroxylated Metabolites of Arteether. J. Med. Chem. 1995, 38, 1911–1921. [Google Scholar] [CrossRef]
  15. Shishan, Z. Equilibrium between Alpha and Beta Isomers of Dihydroartemisinine and its Multiple Peaks in High Performance Liquid Chromatography. Chromatographia 1986, 22, 77–80. [Google Scholar] [CrossRef]
  16. Dynamic Nuclear Magnetic Resonance Spectroscopy; Jackman, L.M.; Cotton, F.A. (Eds.) Academic Press: New York, NY, USA, 1975.
  17. Kaplan, J.I.; Fraenkel, G. NMR of Chemically Exchanging Systems; Academic Press: New York, 1980. [Google Scholar]
  18. Sandström, J. Dynamic NMR Spectroscopy; Academic Press: London, UK, 1982. [Google Scholar]
  19. Oki, M. Applications of Dynamic NMR Spectroscopy to Organic Chemistry; VCH: Deerfield Beach, FL, USA, 1985. [Google Scholar]
  20. D’Acquarica, I.; Gasparrini, F.; Pierini, M.; Villani, C.; Zappia, G. Dynamic HPLC on Chiral Stationary Phases: A Powerful Tool for the Investigation of Stereomutation Processes. J. Sep. Sci. 2006, 29, 1508–1516. [Google Scholar] [CrossRef]
  21. Giddings, J.C. Kinetic Processes and Zone Diffusion in Chromatography. J. Chromatogr. 1960, 3, 443–453. [Google Scholar] [CrossRef]
  22. Kramer, R. Simultan-Reaktionsgaschromatographie Mit Reversibler Reaktion Erster Ordnung. I. J. Chromatogr. 1975, 107, 241–252. [Google Scholar] [CrossRef]
  23. Schurig, V.; Burkle, W. Extending the Scope of Enantiomer Resolution by Complexation Gas Chromatography. J. Am. Chem. Soc. 1982, 104, 7573–7580. [Google Scholar] [CrossRef]
  24. Burkle, W.; Karfunkel, H.; Schurig, V. Dynamic Phenomena during Enantiomer Resolution by Complexation Gas Chromatography. A Kinetic Study of Enantiomerization. J. Chromatogr. 1984, 288, 1–14. [Google Scholar] [CrossRef]
  25. Jacobson, J.; Melander, W.; Vaisnys, G.; Horváth, C. Kinetic Study on Cis-Trans Proline Isomerization by High-Performance Liquid Chromatography. J. Phys. Chem. 1984, 88, 4536–4542. [Google Scholar] [CrossRef]
  26. Veciana, J.; Crespo, M.I. Dynamic HPLC: A Method for Determining Rate Constants, Energy Barriers, and Equilibrium Constants of Molecular Dynamic Processes. Angew. Chem. Int. Ed. Engl. 1991, 30, 74–77. [Google Scholar] [CrossRef]
  27. Jung, M.; Schurig, V. Determination of Enantiomerization Barriers by Computer Simulation of Interconversion Profiles: Enantiomerization of Diaziridines during Chiral Inclusion Gas Chromatography. J. Am. Chem. Soc. 1992, 114, 529–534. [Google Scholar] [CrossRef]
  28. Cabrera, K.; Jung, M.; Fluck, M.; Schurig, V. Determination of Enantiomerization Barriers by Computer Simulation of Experimental Elution Profiles Obtained by High-Performance Liquid Chromatography on a Chiral Stationary Phase. J. Chromatogr. A 1996, 731, 315–321. [Google Scholar] [CrossRef]
  29. Oxelbark, J.; Allenmark, S. Enantiomerization Kinetics Studied by Dynamic Enantioselective Liquid Chromatography: Solvent, Temperature and Stationary Phase Effects on the Rate of N-Benzyl-1,3,2-Benzodithiazole 1-Oxide Enantiomer Interconversion. J. Chem. Soc. Perkin Trans. 1999, 2, 1587–1589. [Google Scholar]
  30. Trapp, O.; Schoetz, V.; Schurig, V. Determination of Enantiomerization Barriers by Dynamic and Stopped-Flow Chromatographic Methods. Chirality 2001, 13, 403–414. [Google Scholar] [CrossRef]
  31. Trapp, O.; Schurig, V. Approximation Function for the Direct Calculation of Rate Constants and Gibbs Activation Energies of Enantiomerization of Racemic Mixtures from Chromatographic Parameters in Dynamic Chromatography. J. Chromatogr. A 2001, 911, 167–175. [Google Scholar] [CrossRef]
  32. Kiesswetter, R.; Brandl, F.; Kastner-Pustet, N.; Mannschreck, A. Chiroptical Detection During Liquid Chromatography, 9. Deconvolution of Overlapping Peaks of Enantiomers and its Applications. Chirality 2003, 15, S40–S49. [Google Scholar] [CrossRef]
  33. Krupcik, J.; Oswald, P.; Májek, P.; Sandra, P.; Armstrong, D.W. Determination of the Interconversion Energy Barrier of Enantiomers by Separation Methods. J. Chromatogr. A 2003, 1000, 779–800. [Google Scholar]
  34. Wolf, C. Dynamic Stereochemistry of Chiral Compounds—Principles and Applications; RSC Publishing: Cambridge, UK, 2008. [Google Scholar]
  35. Trapp, O. Unified Equation for Access to Rate Constants of First-Order Reactions in Dynamic and On-Column Reaction Chromatography. Anal. Chem. 2006, 78, 189–198. [Google Scholar] [CrossRef]
  36. Gasparrini, F.; Lunazzi, L.; Misiti, D.; Villani, C. Organic Stereochemistry and Conformational Analysis from Enantioselective Chromatography and Dynamic Nuclear Magnetic Resonance Measurements. Acc. Chem. Res. 1995 28, 163–170.
  37. Dell’Erba, C.; Gasparrini, F.; Grilli, S.; Lunazzi, L.; Mazzanti, A.; Novi, M.; Pierini, M.; Tavani, C.; Villani, C. Conformational Studies by Dynamic NMR. 86. Structure, Stereodynamics, and Cryogenic Enantioseparation of the Stereolabile Isomers of O-Dinaphthylphenyl Derivatives. J. Org. Chem. 2002, 67, 1663–1668. [Google Scholar]
  38. Gasparrini, F.; Grilli, R.; Leardini, L.; Lunazzi, L.; Mazzanti, A.; Nanni, D.; Pierini, M.; Pinamonti, M. Conformational Studies by Dynamic NMR. 89. Stereomutation and Cryogenic Enantioseparation of Conformational Antipodes of Hindered Aryl Oximes. J. Org. Chem. 2002, 67, 3089–3095. [Google Scholar] [CrossRef]
  39. Dalla Cort, A.; Gasparrini, F.; Lunazzi, L.; Mandolini, L.; Mazzanti, A.; Pasquini, C.; Pierini, M.; Rompietti, R.; Schiaffino, L. Stereomutations of Atropisomers of Sterically Hindered Salophen Ligands. J. Org. Chem. 2005, 70, 8877–8883. [Google Scholar]
  40. Cirilli, R.; Ferretti, R.; La Torre, F.; Secci, D.; Bolasco, A.; Carradori, S.; Pierini, M. High-Performance Liquid Chromatographic Separation of Enantiomers and Diastereomers of 2-Methylcyclohexanone Thiosemicarbazone, and Determination of Absolute Configuration and Configurational Stability. J. Chromatogr. A 2007, 1172, 160–169. [Google Scholar]
  41. Cabri, W.; Ciogli, A.; D’Acquarica, I.; Di Mattia, M.; Galletti, B.; Gasparrini, F.; Giorgi, F.; Lalli, S.; Pierini, M.; Simone, P. On-column Epimerization of Dihydroartemisinin: An Effective Analytical Approach to Overcome the Shortcomings of the International Pharmacopoeia Monograph. J. Chromatogr. B 2008, 875, 180–191. [Google Scholar] [CrossRef]
  42. Zhou, Z.M.; Anders, J.C.; Chung, H.; Theoharides, A.D. Analysis of Artesunic Acid and Dihydroqinghaosu in Blood by High-Performance Liquid Chromatography with Reductive Electrochemical Detection. J. Chromatogr. 1987, 414, 77–90. [Google Scholar] [CrossRef]
  43. Batty, K.T.; Davies, T.M.E.; Thu, L.T.; Binh, T.Q.; Anh, T.K.; Ilett, K.F. Selective High-Performance Liquid Chromatographic Determination of Artesunate and α- and β-Dihydroartemisinin in Patients with Falciparum Malaria. J. Chromatogr. B 1996, 677, 345–350. [Google Scholar] [CrossRef]
  44. Batty, K.T.; Ilett, K.F.; Davis, T.M.E. Chemical Stability of Artesunate Injection and Proposal for its Administration by Intravenous Infusion. J. Pharm. Pharmacol. 1996, 48, 22–26. [Google Scholar]
  45. Navaratnam, V.; Mordi, M.N.; Mansor, S.M. Simultaneous Determination of Artesunic Acid and Dihydroartemisinin in Blood Plasma by High-Performance Liquid Chromatography For Application in Clinical Pharmacological Studies. J. Chromatogr. B 1997, 692, 157–162. [Google Scholar] [CrossRef]
  46. Karbwang, J.; Na-Bangchang, K.; Molunto, P.; Banmairuroi, V.; Congpuong, K. Determination of Artemether and its Major Metabolite, Dihydroartemisinin, in Plasma using High-Performance Liquid Chromatography with Electrochemical Detection. J. Chromatogr. B 1997, 690, 259–265. [Google Scholar] [CrossRef]
  47. Sandrenan, N.; Sioufi, A.; Godbillon, J.; Netterb, C.; Danker, M.; van Valkenburg, C. Determination of Artemether and its Metabolite, Dihydroartemisinin, in Plasma by High-Performance Liquid Chromatography and Electrochemical Detection in the Reductive Mode. J. Chromatogr. B 1997, 691, 145–153. [Google Scholar] [CrossRef]
  48. Avery, B.A.; Venkatesh, K.K.; Avery, M.A. Rapid Determination of Artemisinin and Related Analogues using High-Performance Liquid Chromatography and an Evaporative Light Scattering Detector. J. Chromatogr. B 1999, 730, 71–80. [Google Scholar] [CrossRef]
  49. Ortelli, D.; Rudaz, S.; Cognard, E.; Veuthey, J.L. Analysis of Dihydroartemisinin in Plasma by Liquid Chromatography-Mass Spectrometry. Chromatographia 2000, 52, 445–450. [Google Scholar] [CrossRef]
  50. Souppart, C.; Gauducheau, N.; Sandrenan, N.; Richard, F. Development and Validation of a High-Performance Liquid Chromatography-Mass Spectrometry Assay for the Determination of Artemether and its Metabolite Dihydroartemisinin in Human Plasma. J. Chromatogr. B 2002, 774, 195–203. [Google Scholar] [CrossRef]
  51. Sabarinath, S.; Rajanikanth, M.; Madhusudanan, K.P.; Gupta, R.C. A Sensitive and Selective Liquid Chromatographic/Electrospray Ionization Tandem Mass Spectrometric Assay for the Simultaneous Quantification of α-,β-Arteether and its Metabolite Dihydroartemisinin in Plasma, useful for Pharmacokinetic Studies. J. Mass Spectrom. 2003, 38, 732–742. [Google Scholar] [CrossRef]
  52. Rajanikanth, M.; Madhusudanan, K.P.; Gupta, R.C. An HPLC-MS Method for Simultaneous Estimation of α,β-Arteether and its Metabolite Dihydroartemisinin, in Rat Plasma for Application to Pharmacokinetic Study. Biomed. Chromatogr. 2003, 17, 440–446. [Google Scholar] [CrossRef]
  53. Kotecka, B.M.; Rieckmann, K.H.; Davis, T.M.E.; Batty, K.T.; Ilett, K.F. Comparison of Bioassay and High Performance Liquid Chromatographic Assay of Artesunate and Dihydroartemisinin in Plasma. Acta Trop. 2003, 87, 371–375. [Google Scholar] [CrossRef]
  54. Batty, K.T.; Ilett, K.F.; Davis, T.M.E. Protein Binding and Alpha:Beta Anomer Ratio of Dihydroartemisinin in Vivo. Br. J. Clin. Pharmacol. 2004, 57, 529–533. [Google Scholar] [CrossRef]
  55. Naik, H.; Murry, D.J.; Kirsch, L.E.; Fleckenstein, L. Development and Validation of a High-Performance Liquid Chromatography-Mass Spectroscopy Assay for Determination of Artesunate and Dihydroartemisinin in Human Plasma. J. Chromatogr. B 2005, 816, 233–242. [Google Scholar] [CrossRef]
  56. Lai, C.-S.; Nair, N.K.; Mansor, S.M.; Olliaro, P.L.; Navaratnam, V. An Analytical Method with A Single Extraction Procedure and Two Separate High Performance Liquid Chromatographic Systems for the Determination of Artesunate, Dihydroartemisinin and Mefloquine in Human Plasma for Application in Clinical Pharmacological Studies of the Drug Combination. J. Chromatogr. B 2007, 857, 308–314. [Google Scholar] [CrossRef]
  57. Liu, Y.; Zeng, X.; Deng, Y.; Wang, L.; Feng, Y.; Yang, L.; Zhou, D. Application of a Liquid Chromatography/Tandem Mass Spectrometry Method for the Pharmacokinetic Study of Dihydroartemisinin Injectable Powder in Healthy Chinese Subjects. J. Chromatogr. B 2009, 877, 465–470. [Google Scholar] [CrossRef]
  58. Cabri, W.; D’Acquarica, I.; Simone, P.; Di Iorio, M.; Di Mattia, M.; Gasparrini, F.; Giorgi, F.; Mazzanti, A.; Pierini, M.; Quaglia, M.; Villani, C. Stereolability of Dihydroartemisinin: a Full Thermodynamic and Kinetic Investigation of the Epimerization by Experimental and Computational Techniques. unpublished work.
  59. International Pharmacopoeia, Monographs for Antimalarial Drugs, 4th ed.; WHO Press: Geneva, Switzerland, 2006; pp. 215–218.
  60. Li, Y.; Wu, Y.-L. An Over Four Millennium Story Behind Qinghaosu (Artemisinin) – A Fantastic Antimalarial Drug from a Traditional Chinese Herb. Curr. Med. Chem. 2003, 47, 2945–2964. [Google Scholar]
  61. Lee, S. Artemisinin, promising lead natural product for various drug developments. Mini Rev. Med. Chem. 2007, 7, 411–422. [Google Scholar] [CrossRef]

