Oxidative Decarboxylation of Levulinic Acid by Cupric Oxides

Abstract
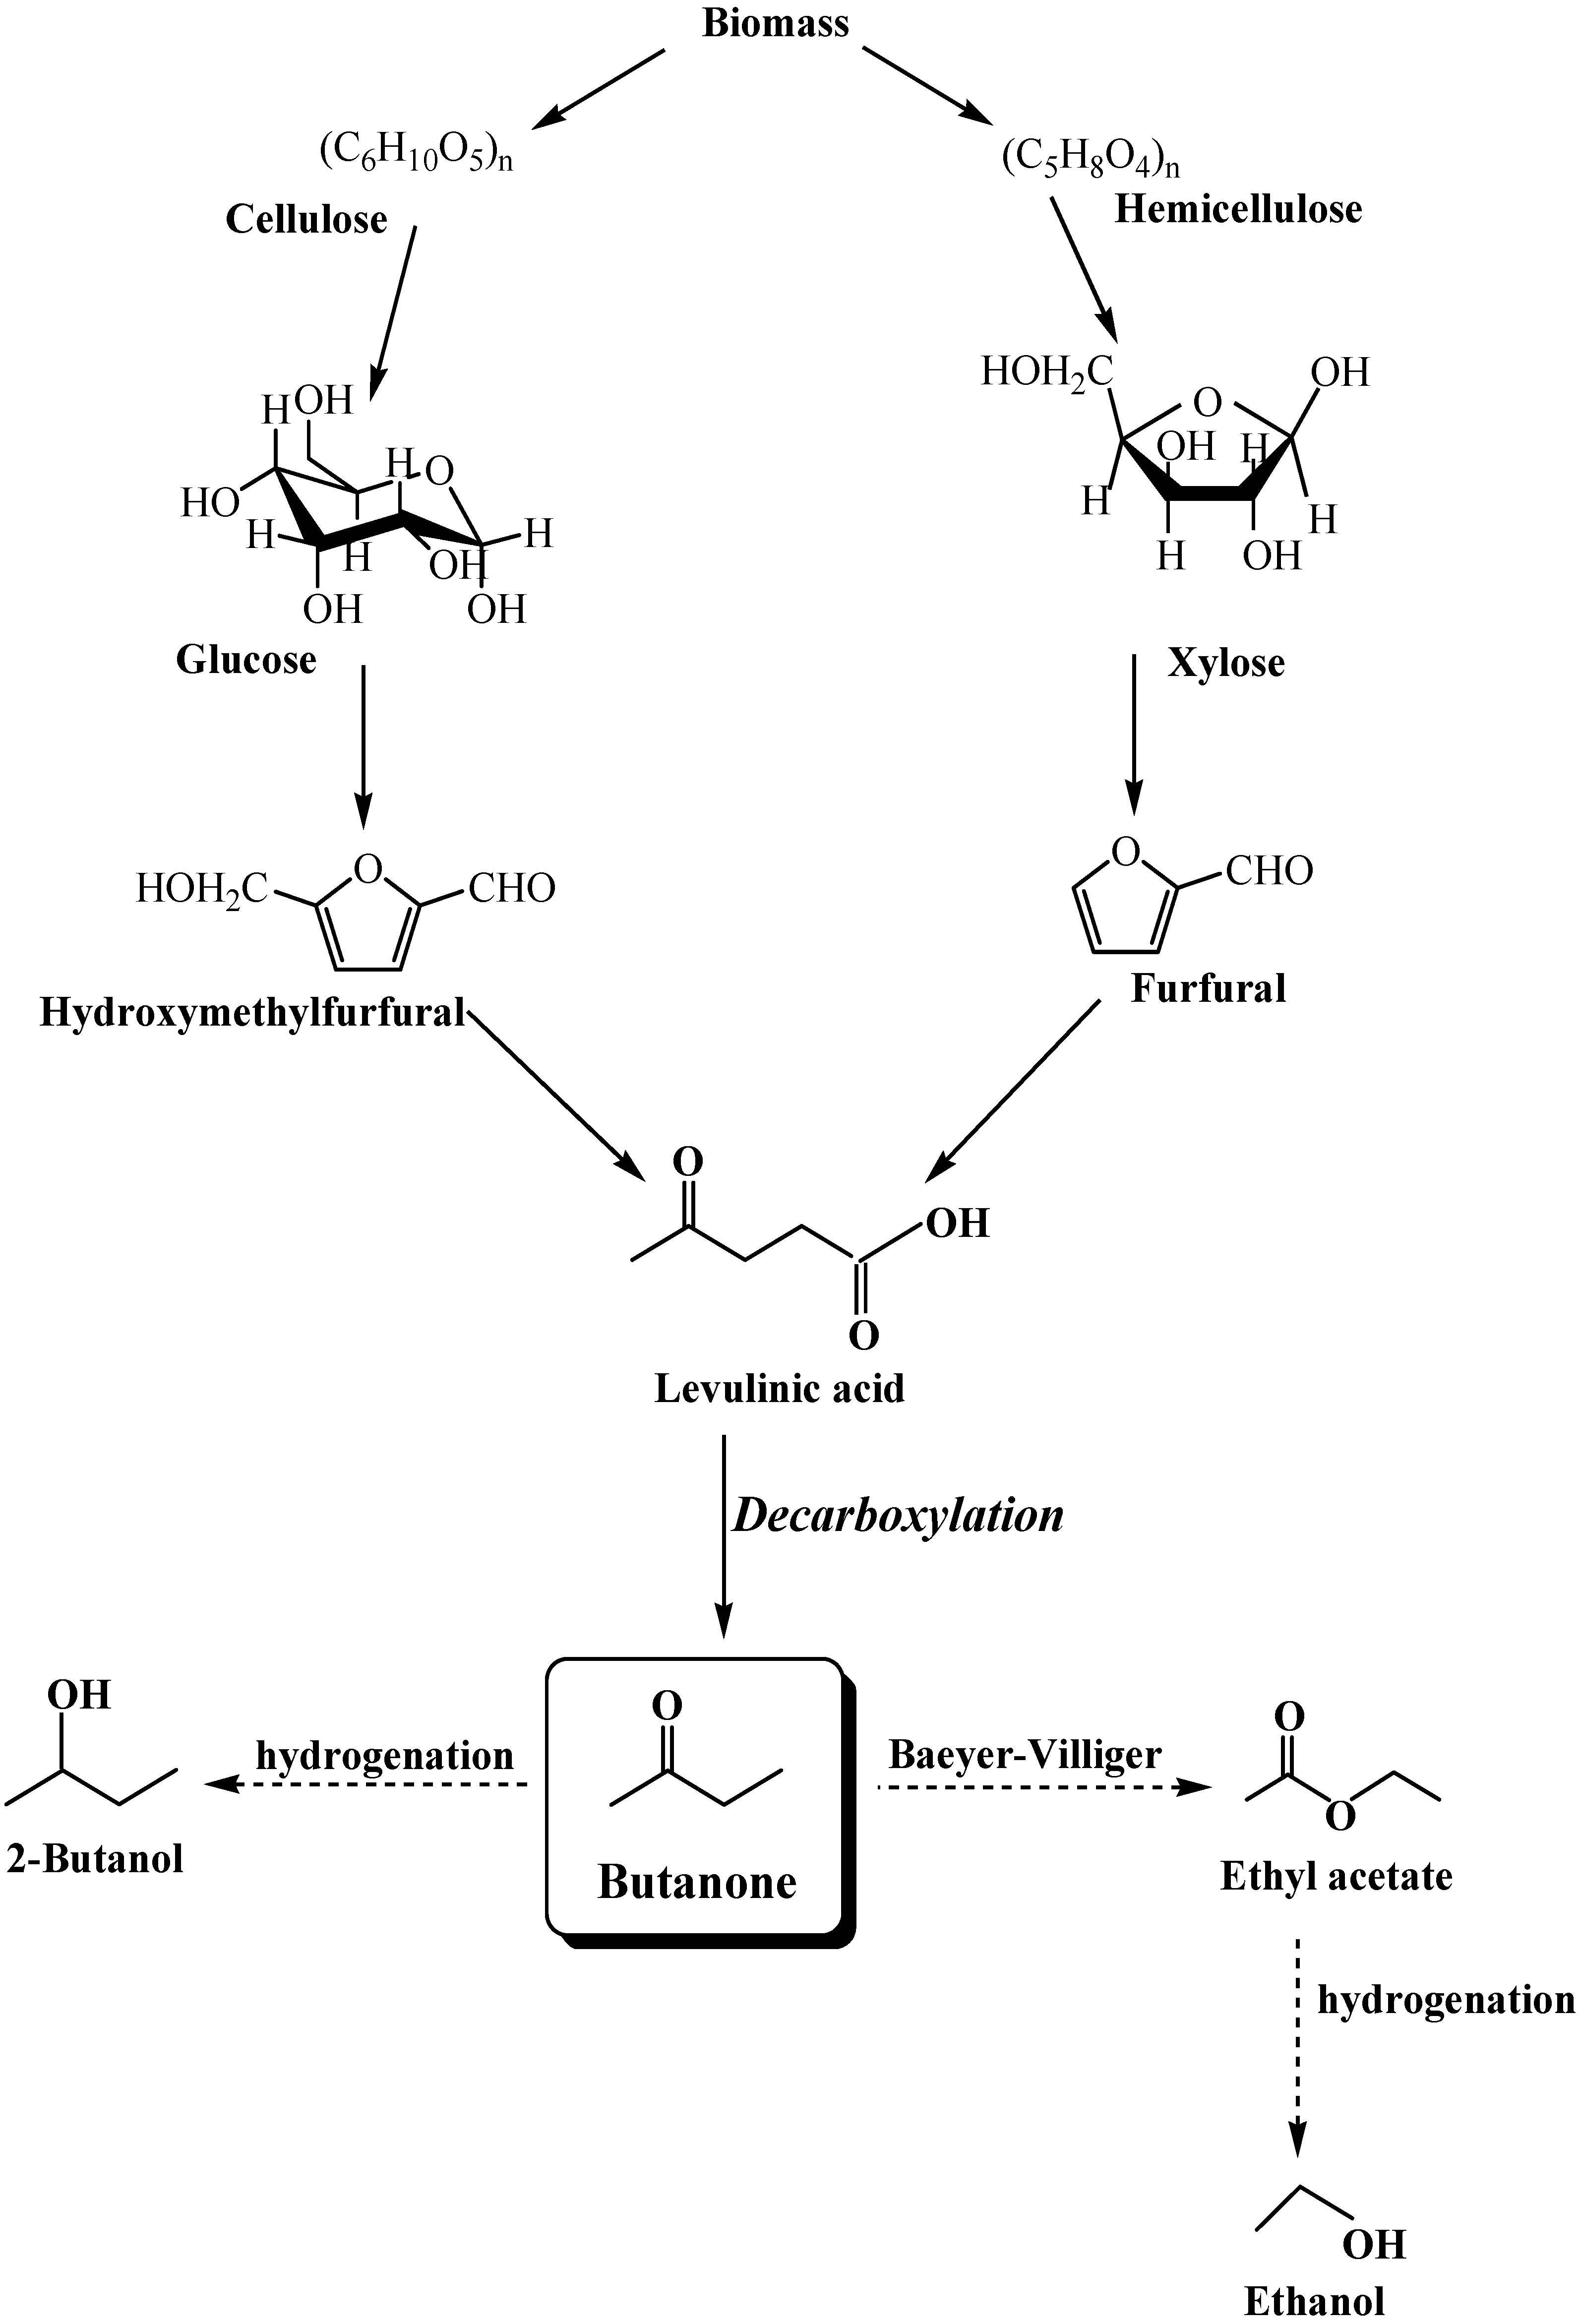
:1. Inroduction
2. Results and Discussion
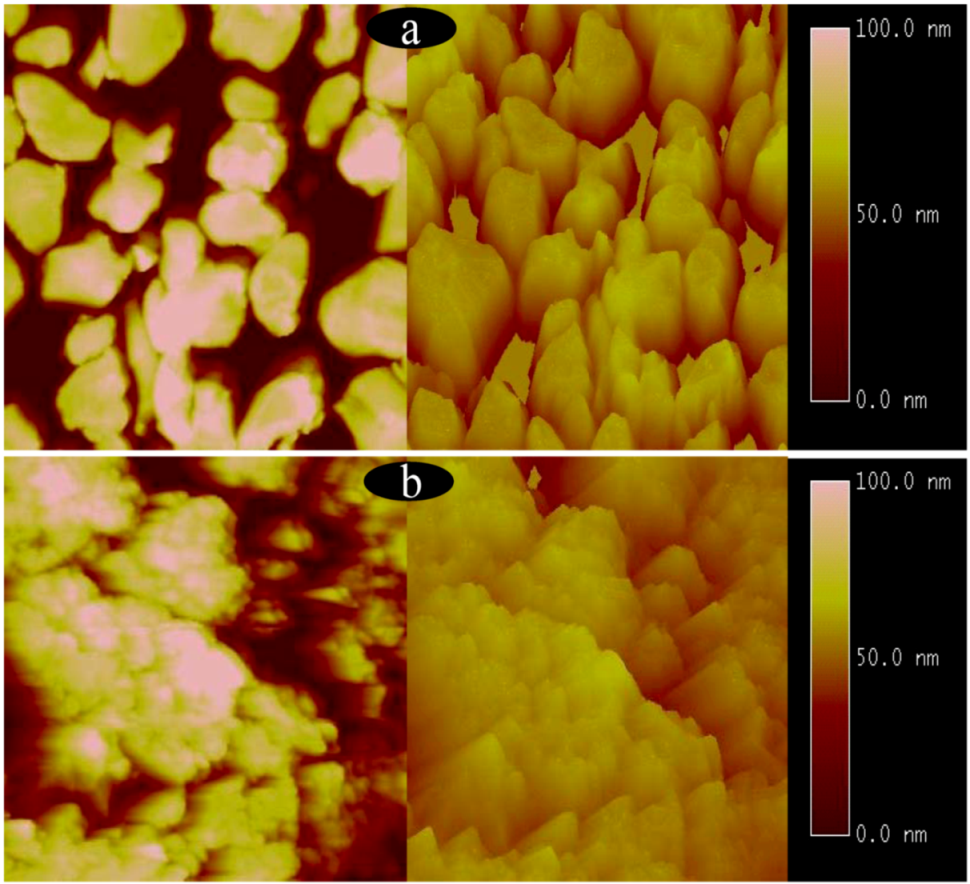
2.1. Surface structures of CuO(I) and CuO(II) with different surface roughness (Rms)


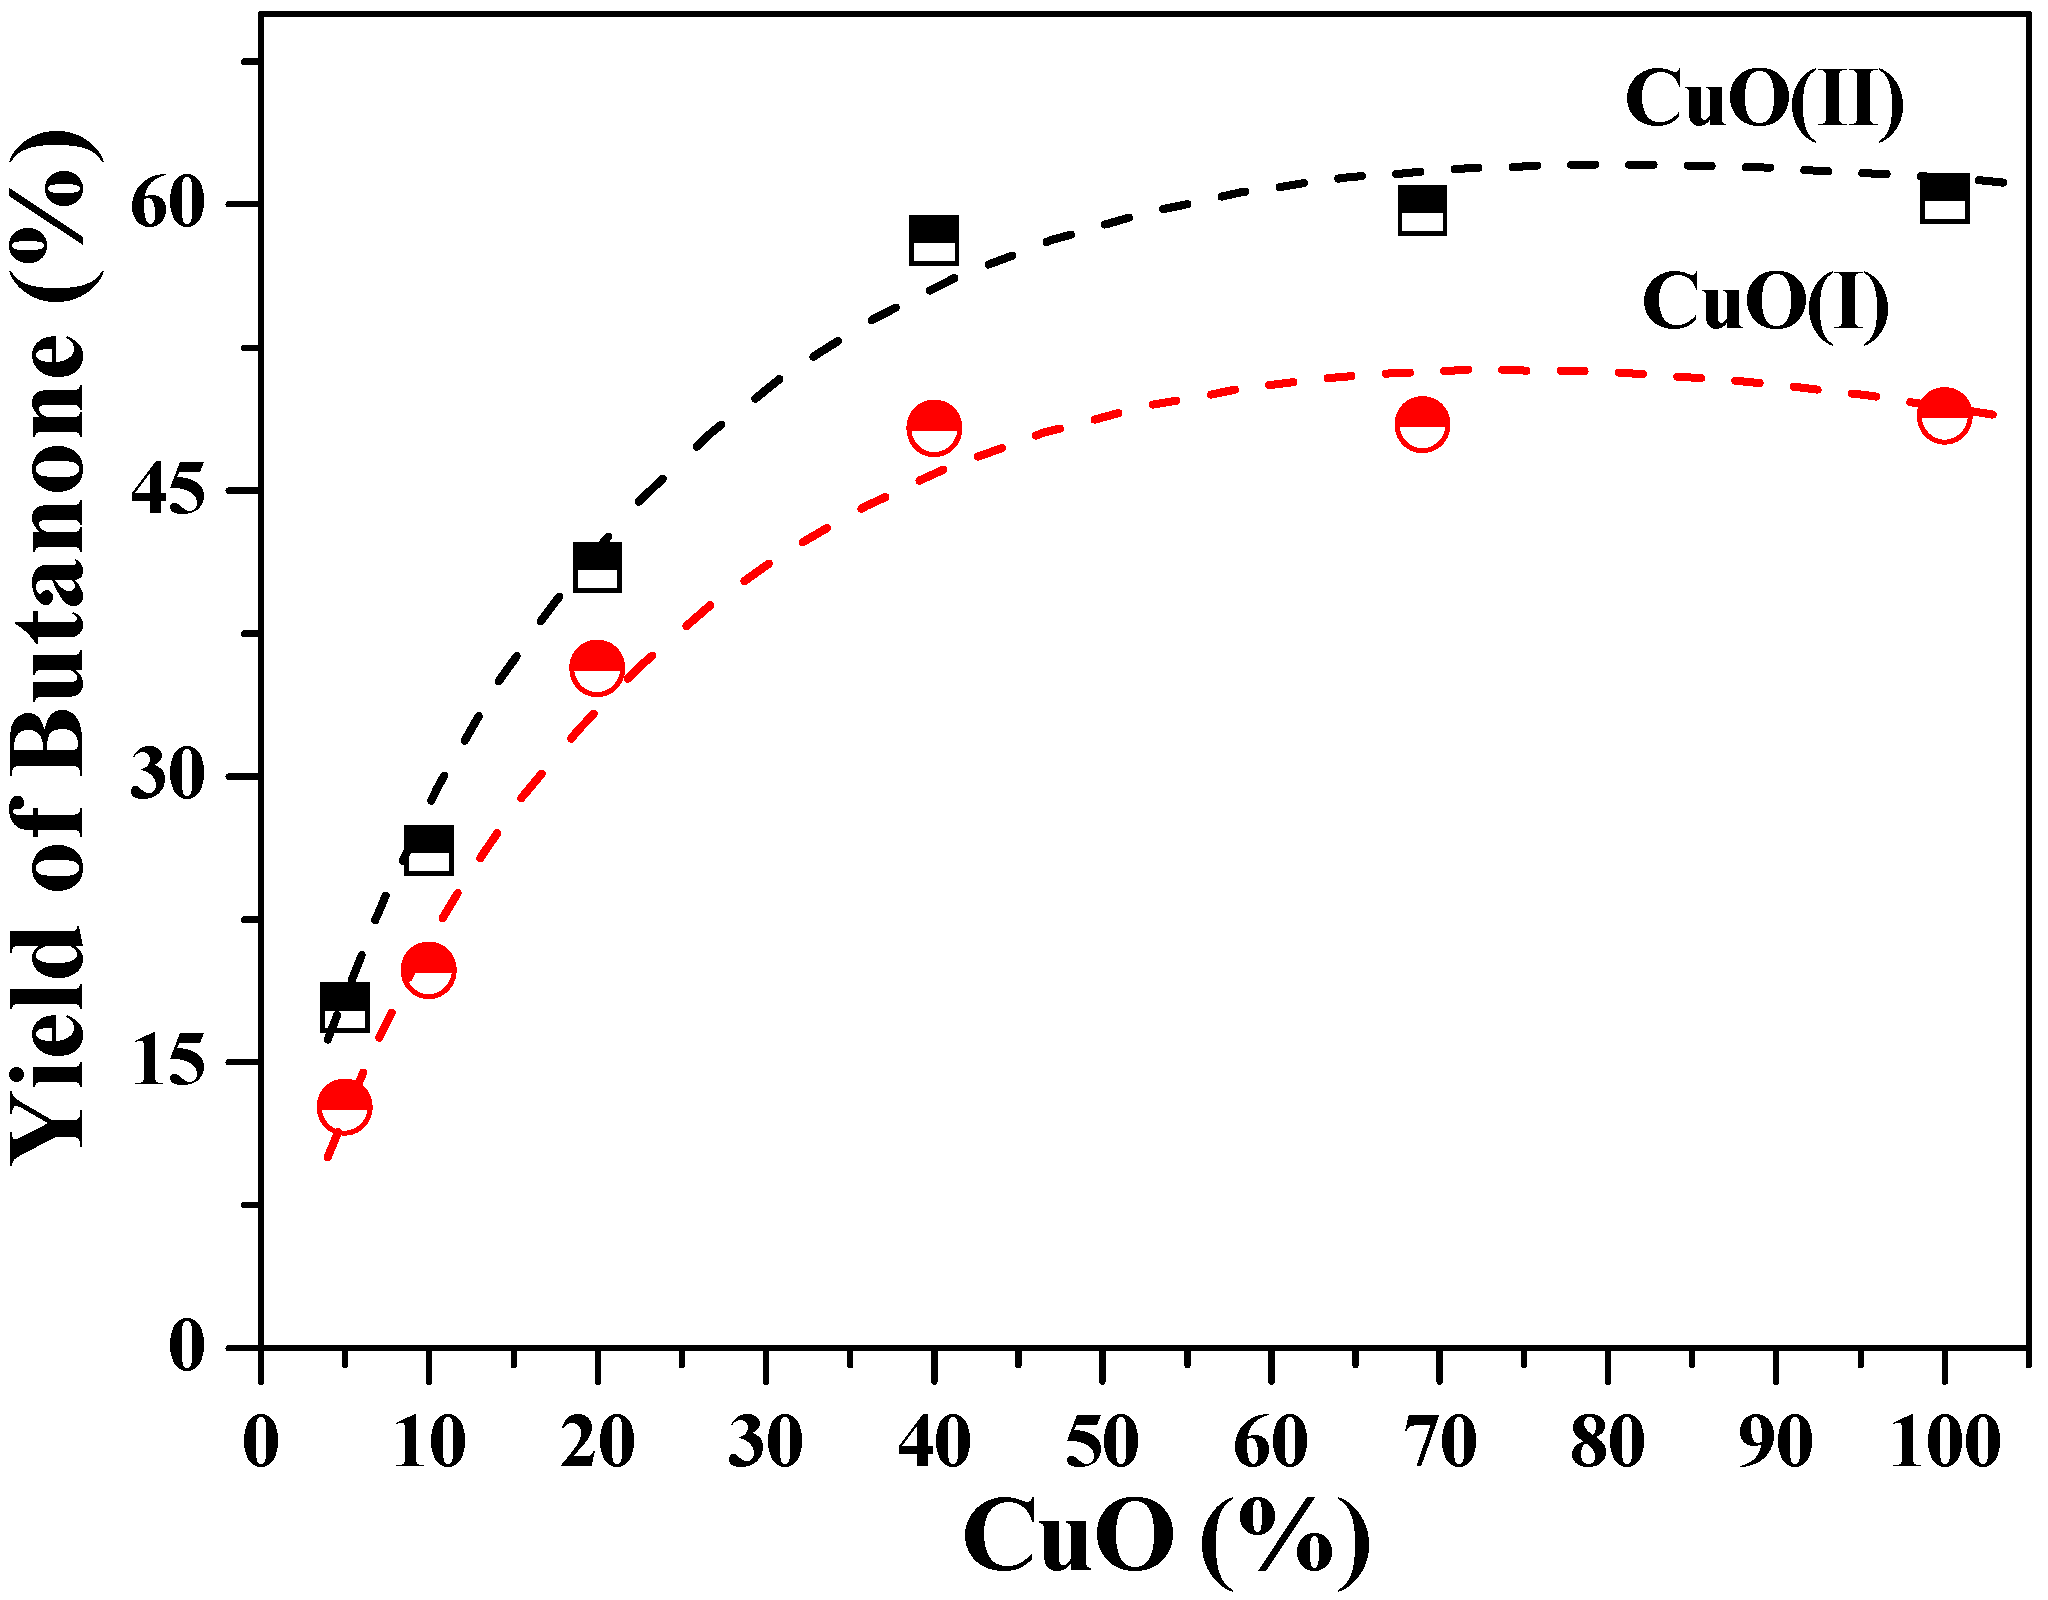
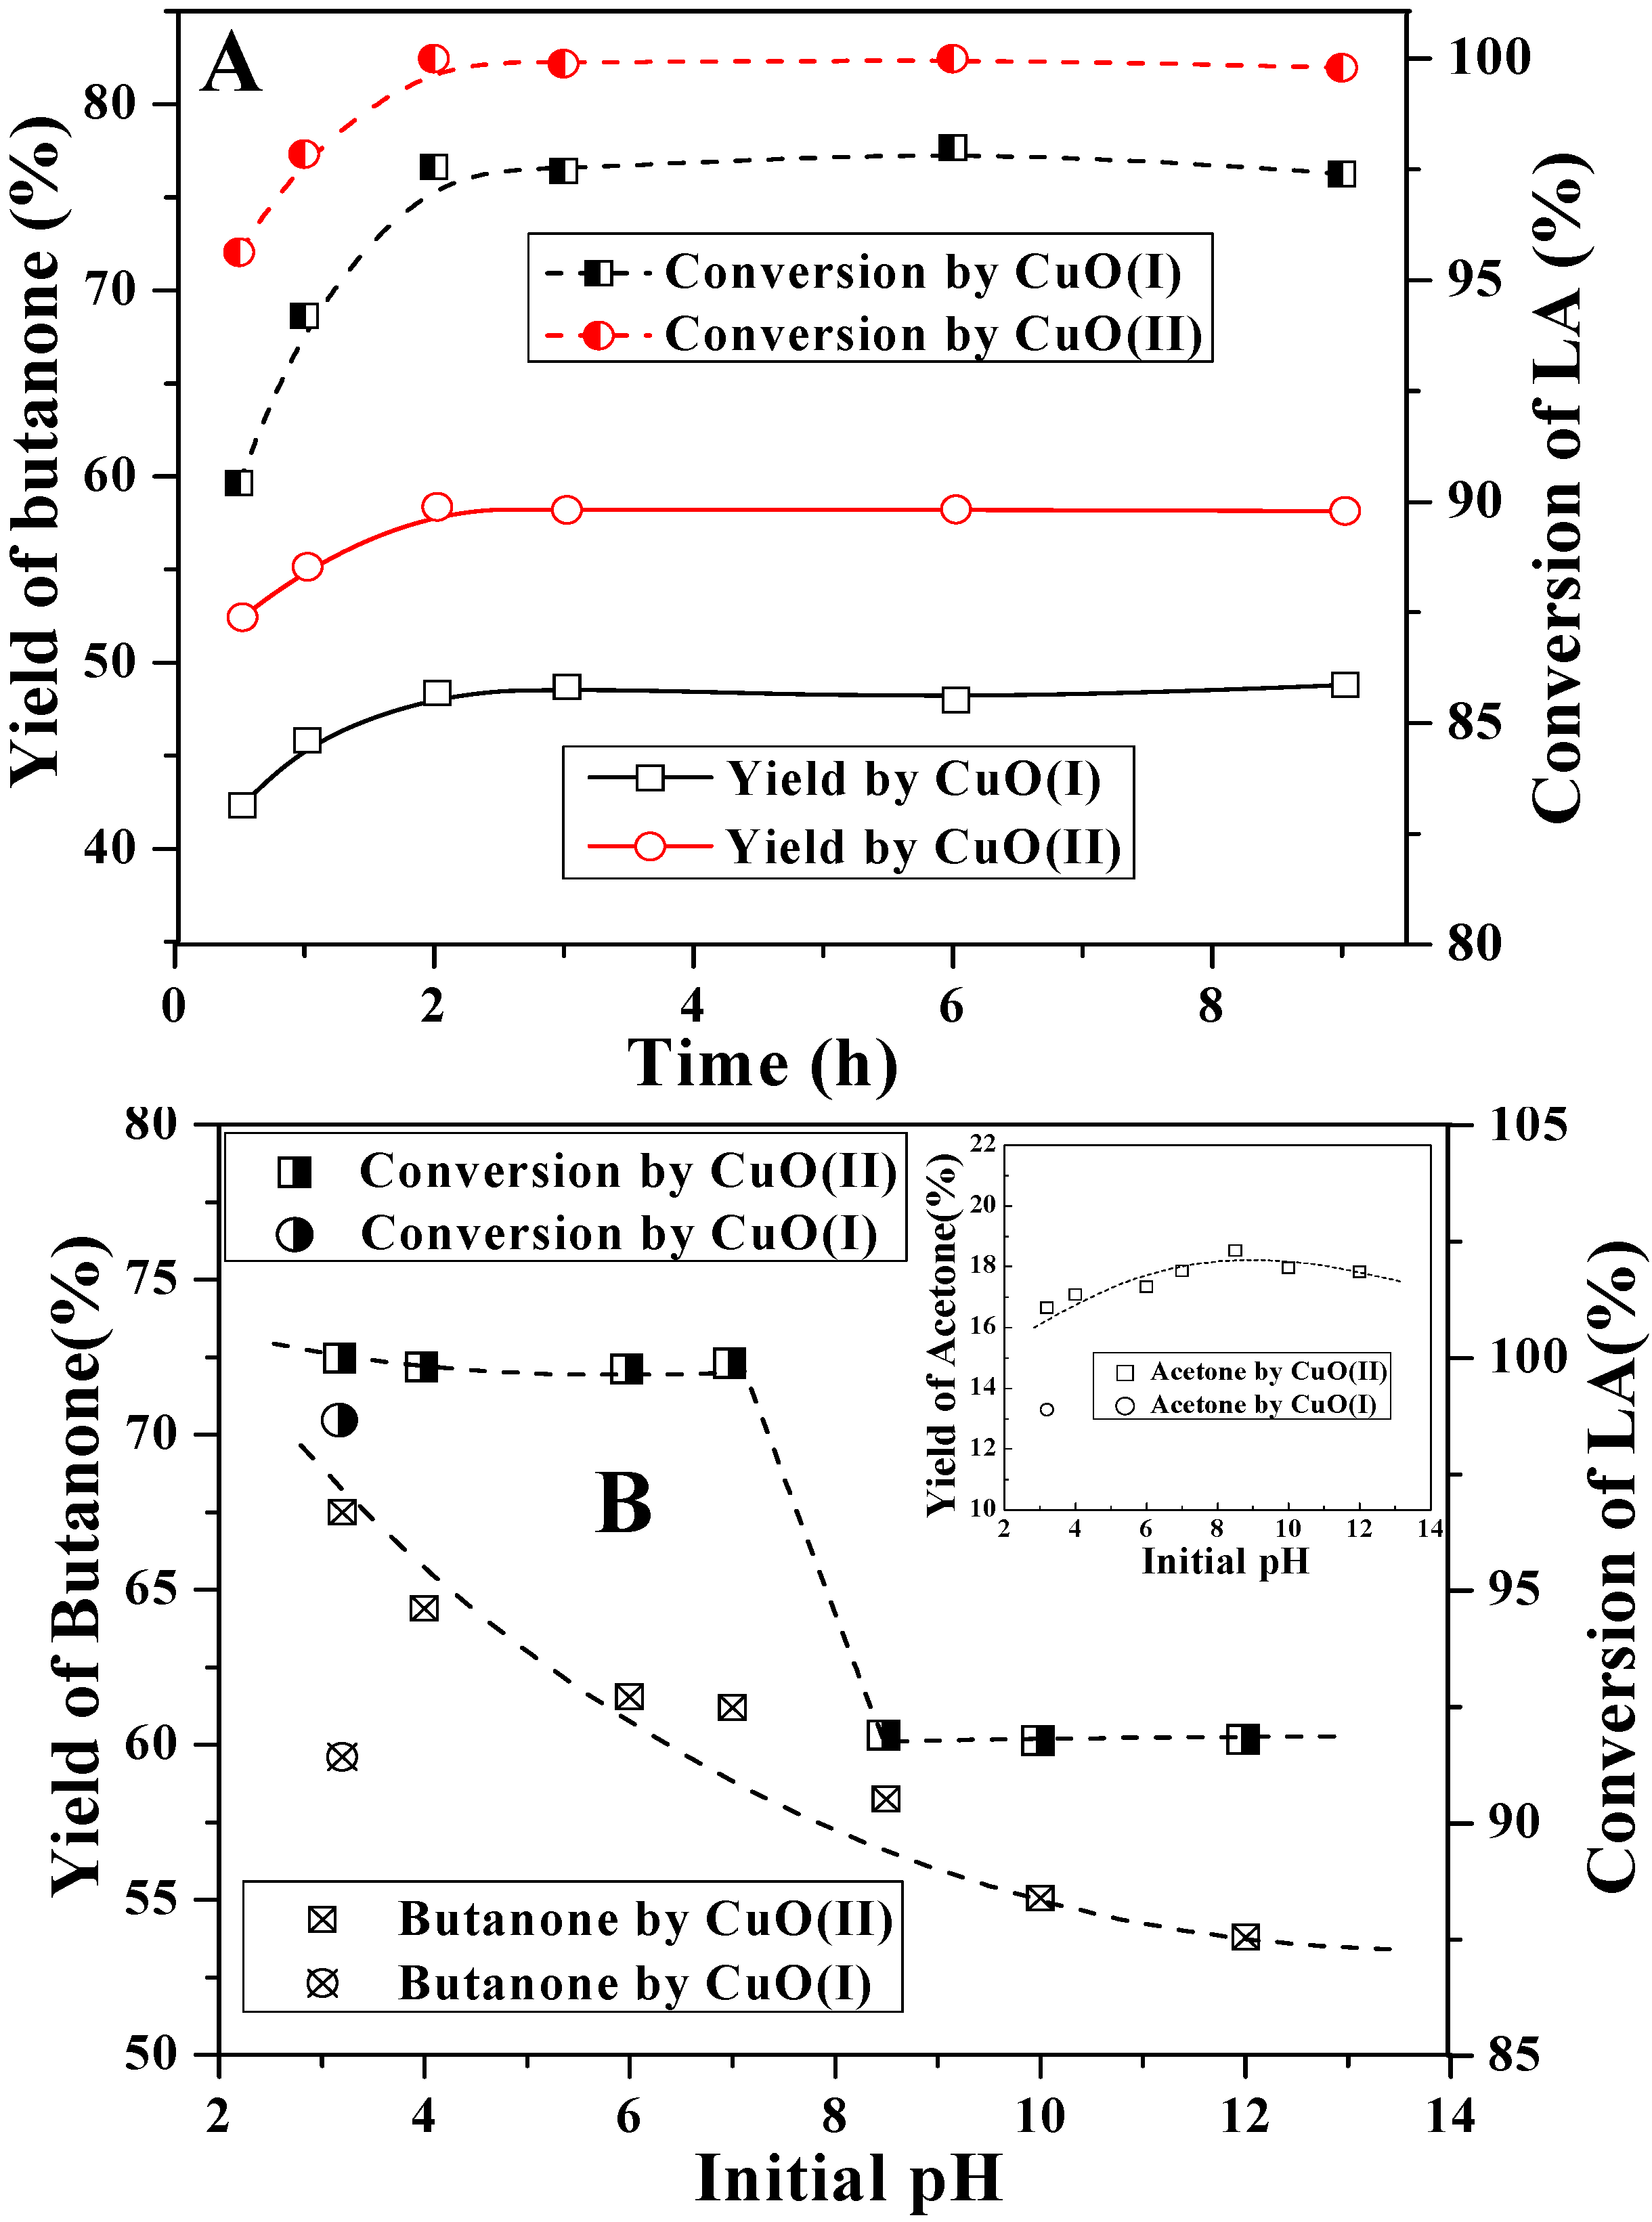
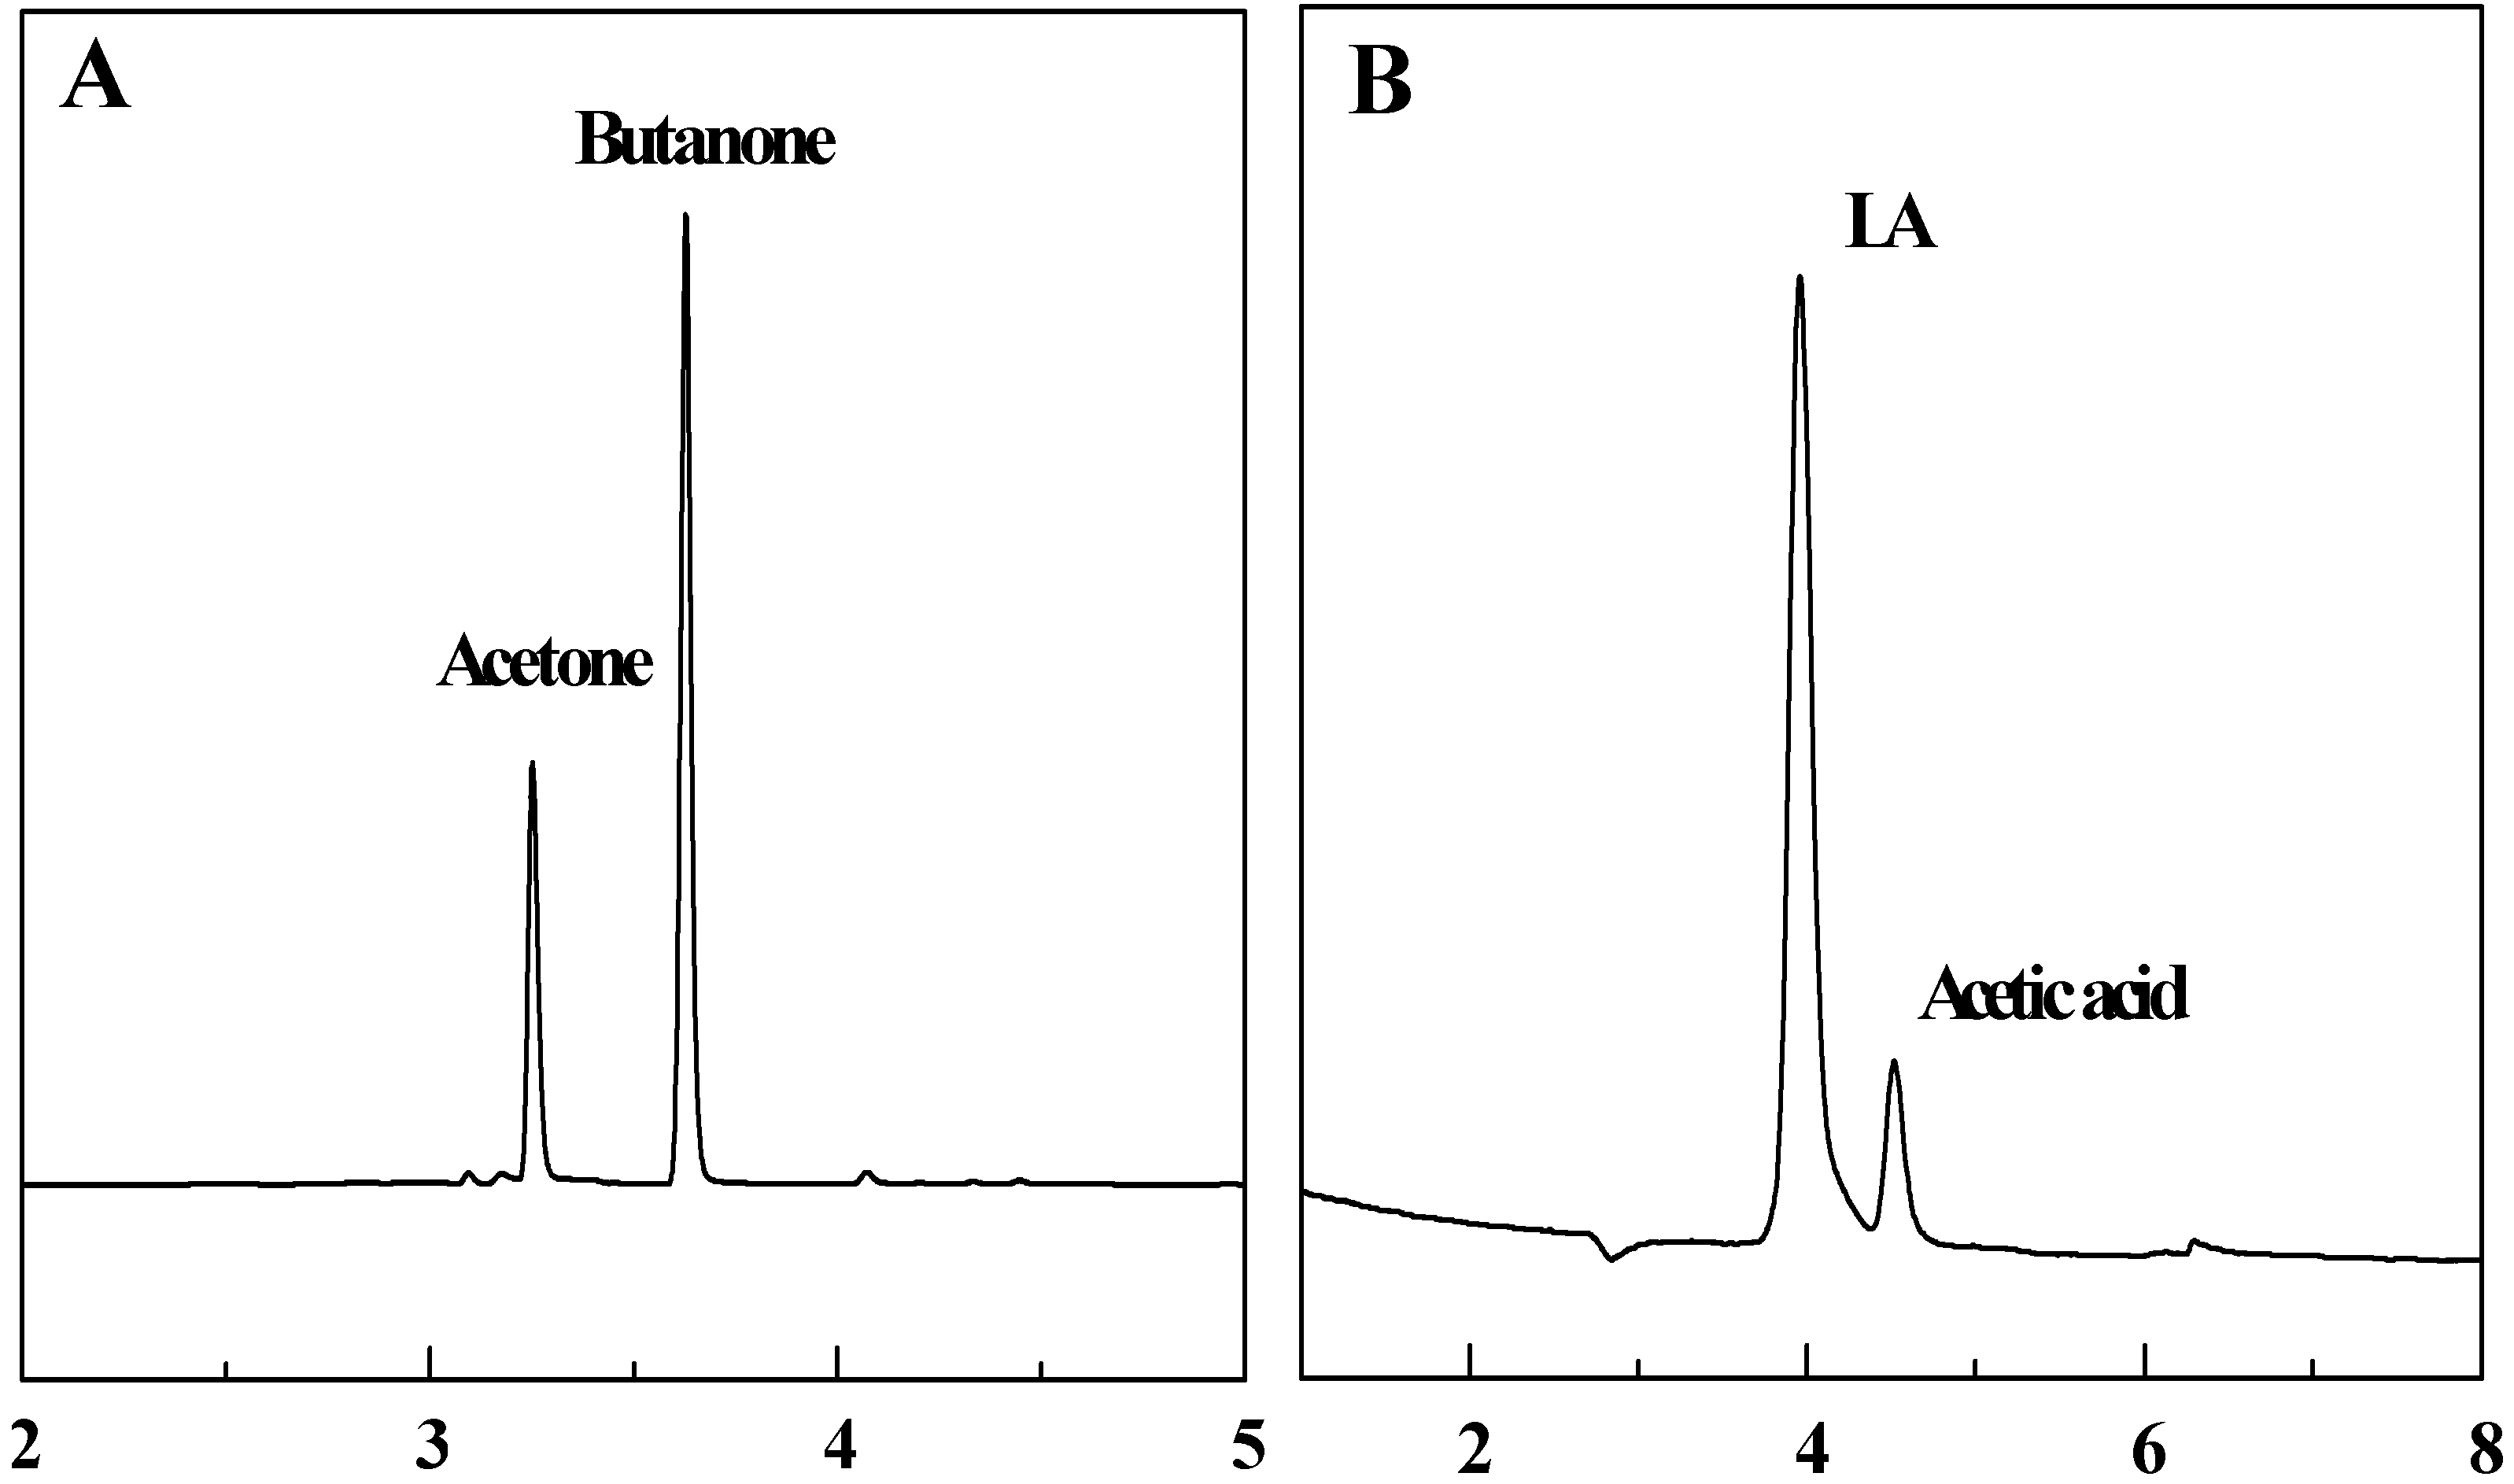
2.2. Decarboxylation of levulinic acid to butanone catalyzed by CuO(I) and CuO(II)


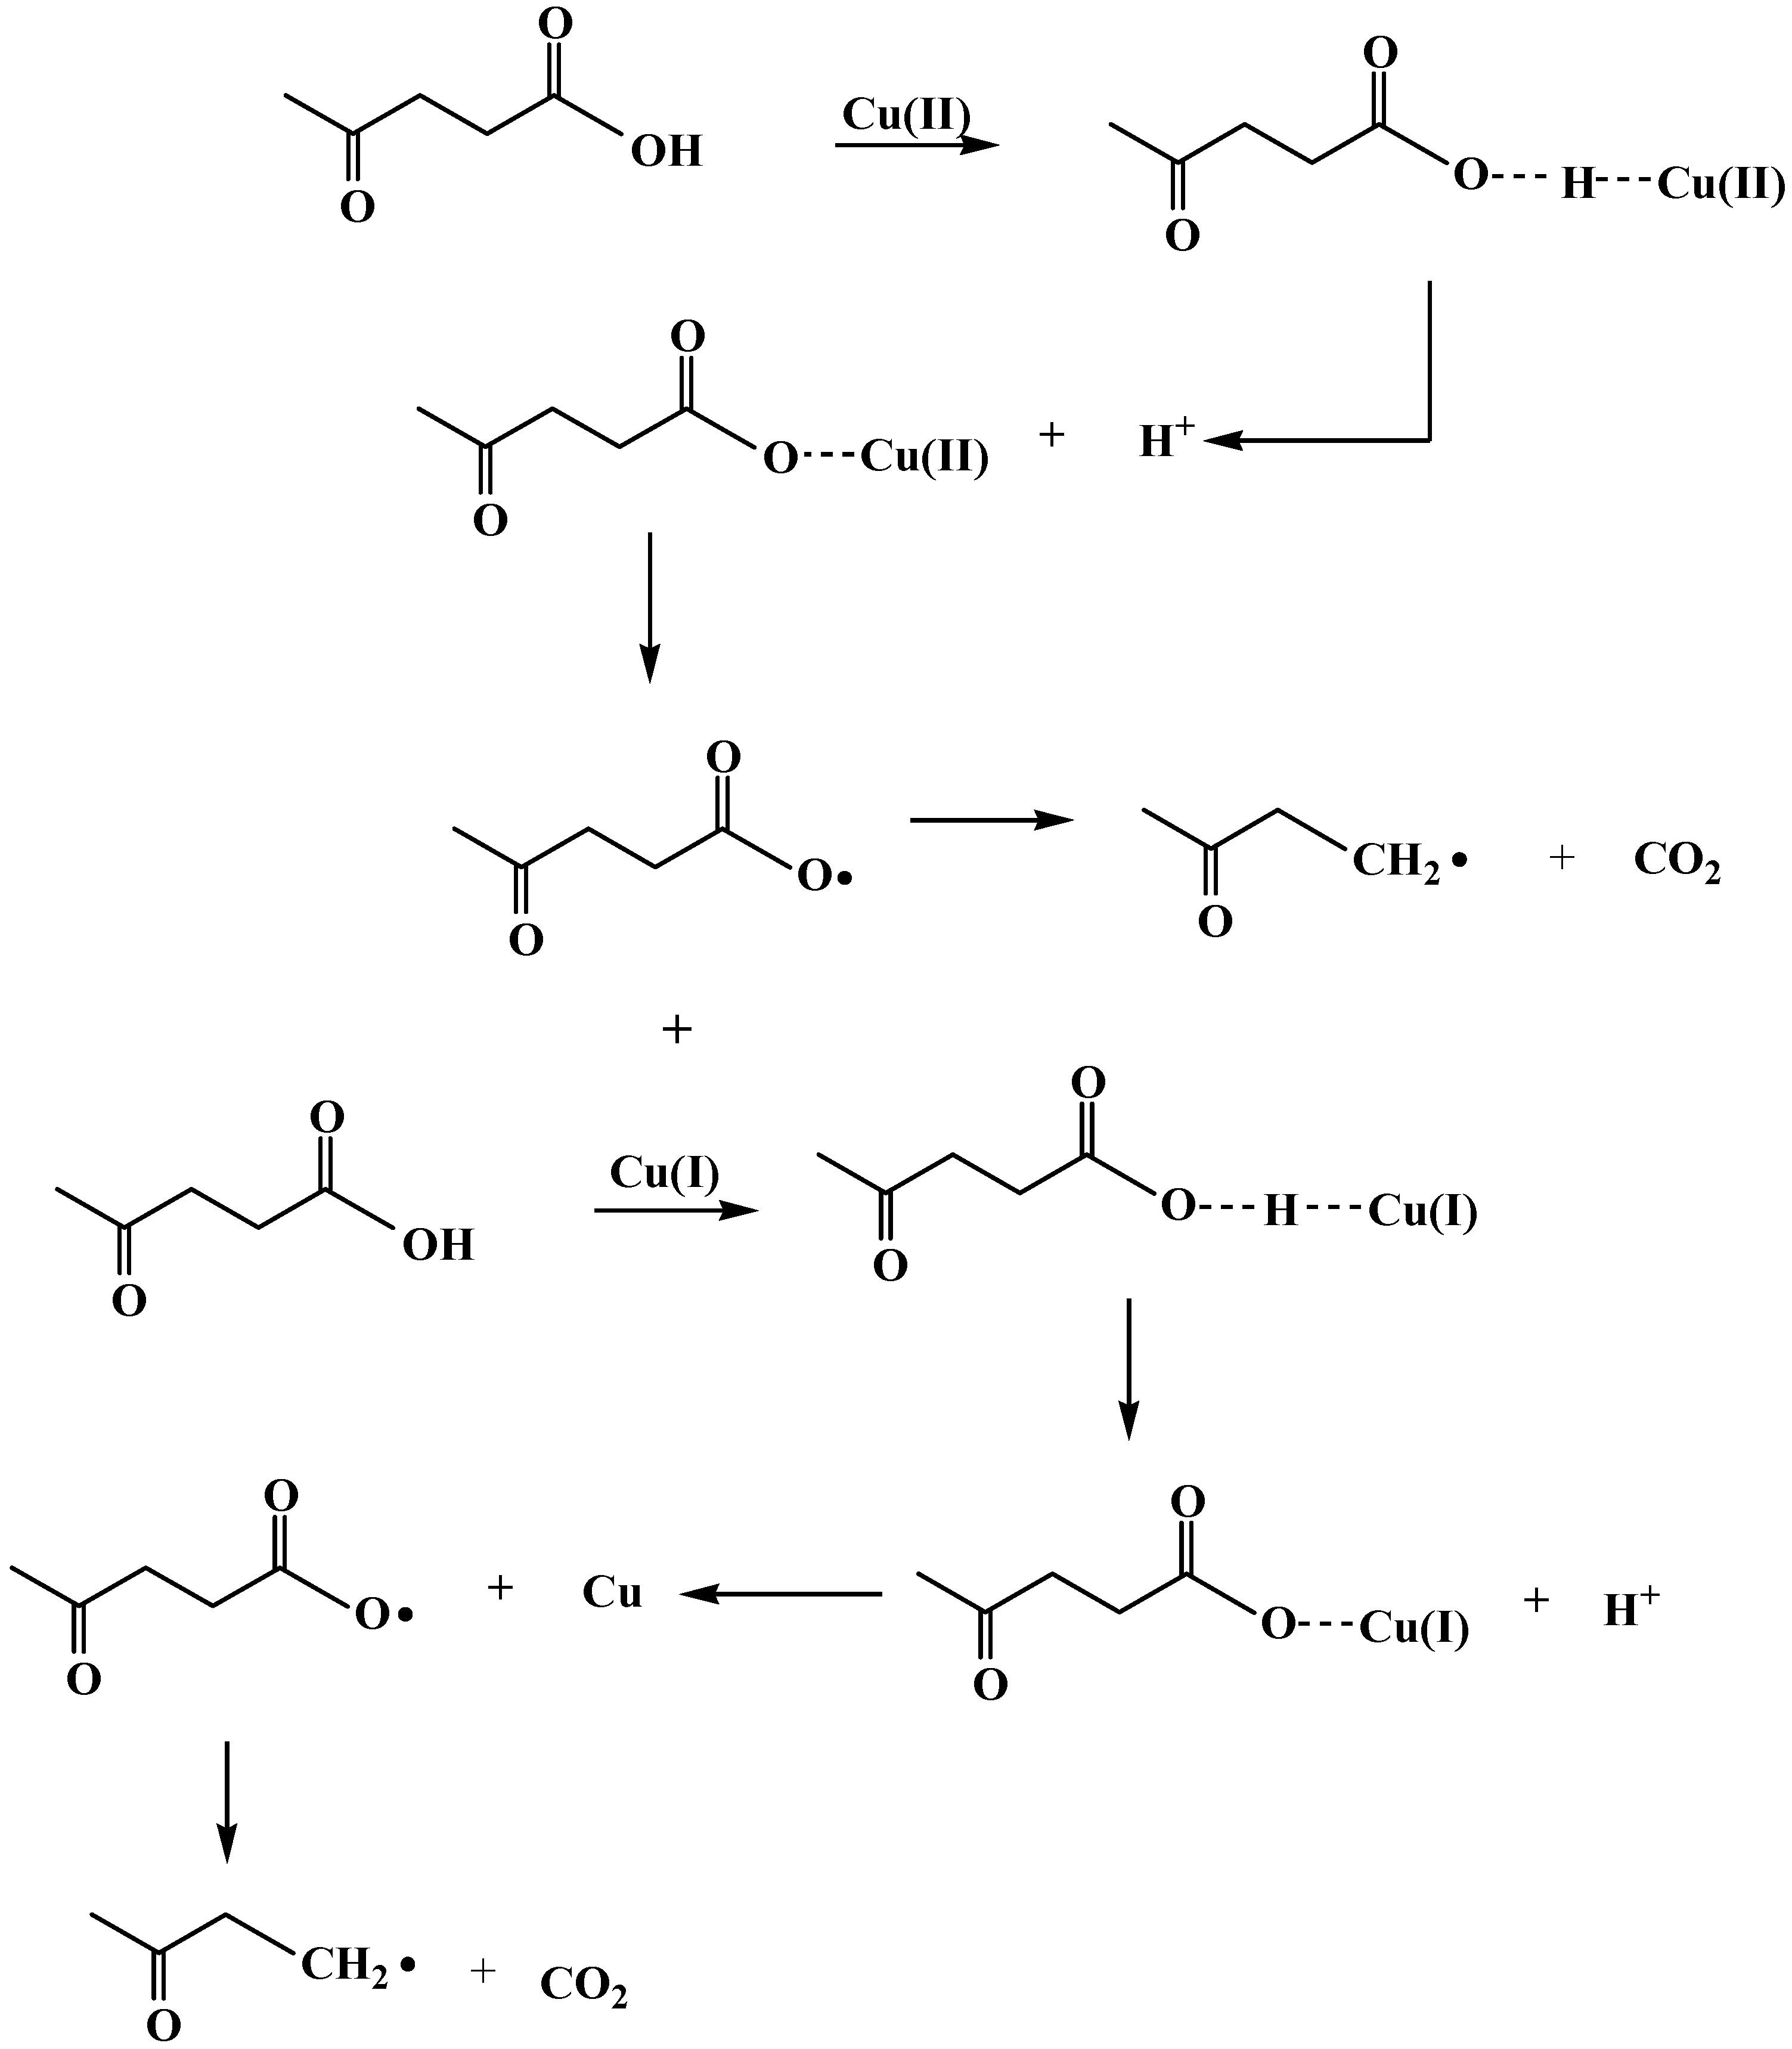
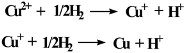
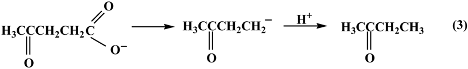
2.3. Reaction pathway for LA decarboxylation by CuO


3. Experimental
3.1. Preparation of CuO samples
3.2. Procedure for LA decarboxylation
3.3. Head space – gas chromatography detection
3.4. Ion chromatography detection
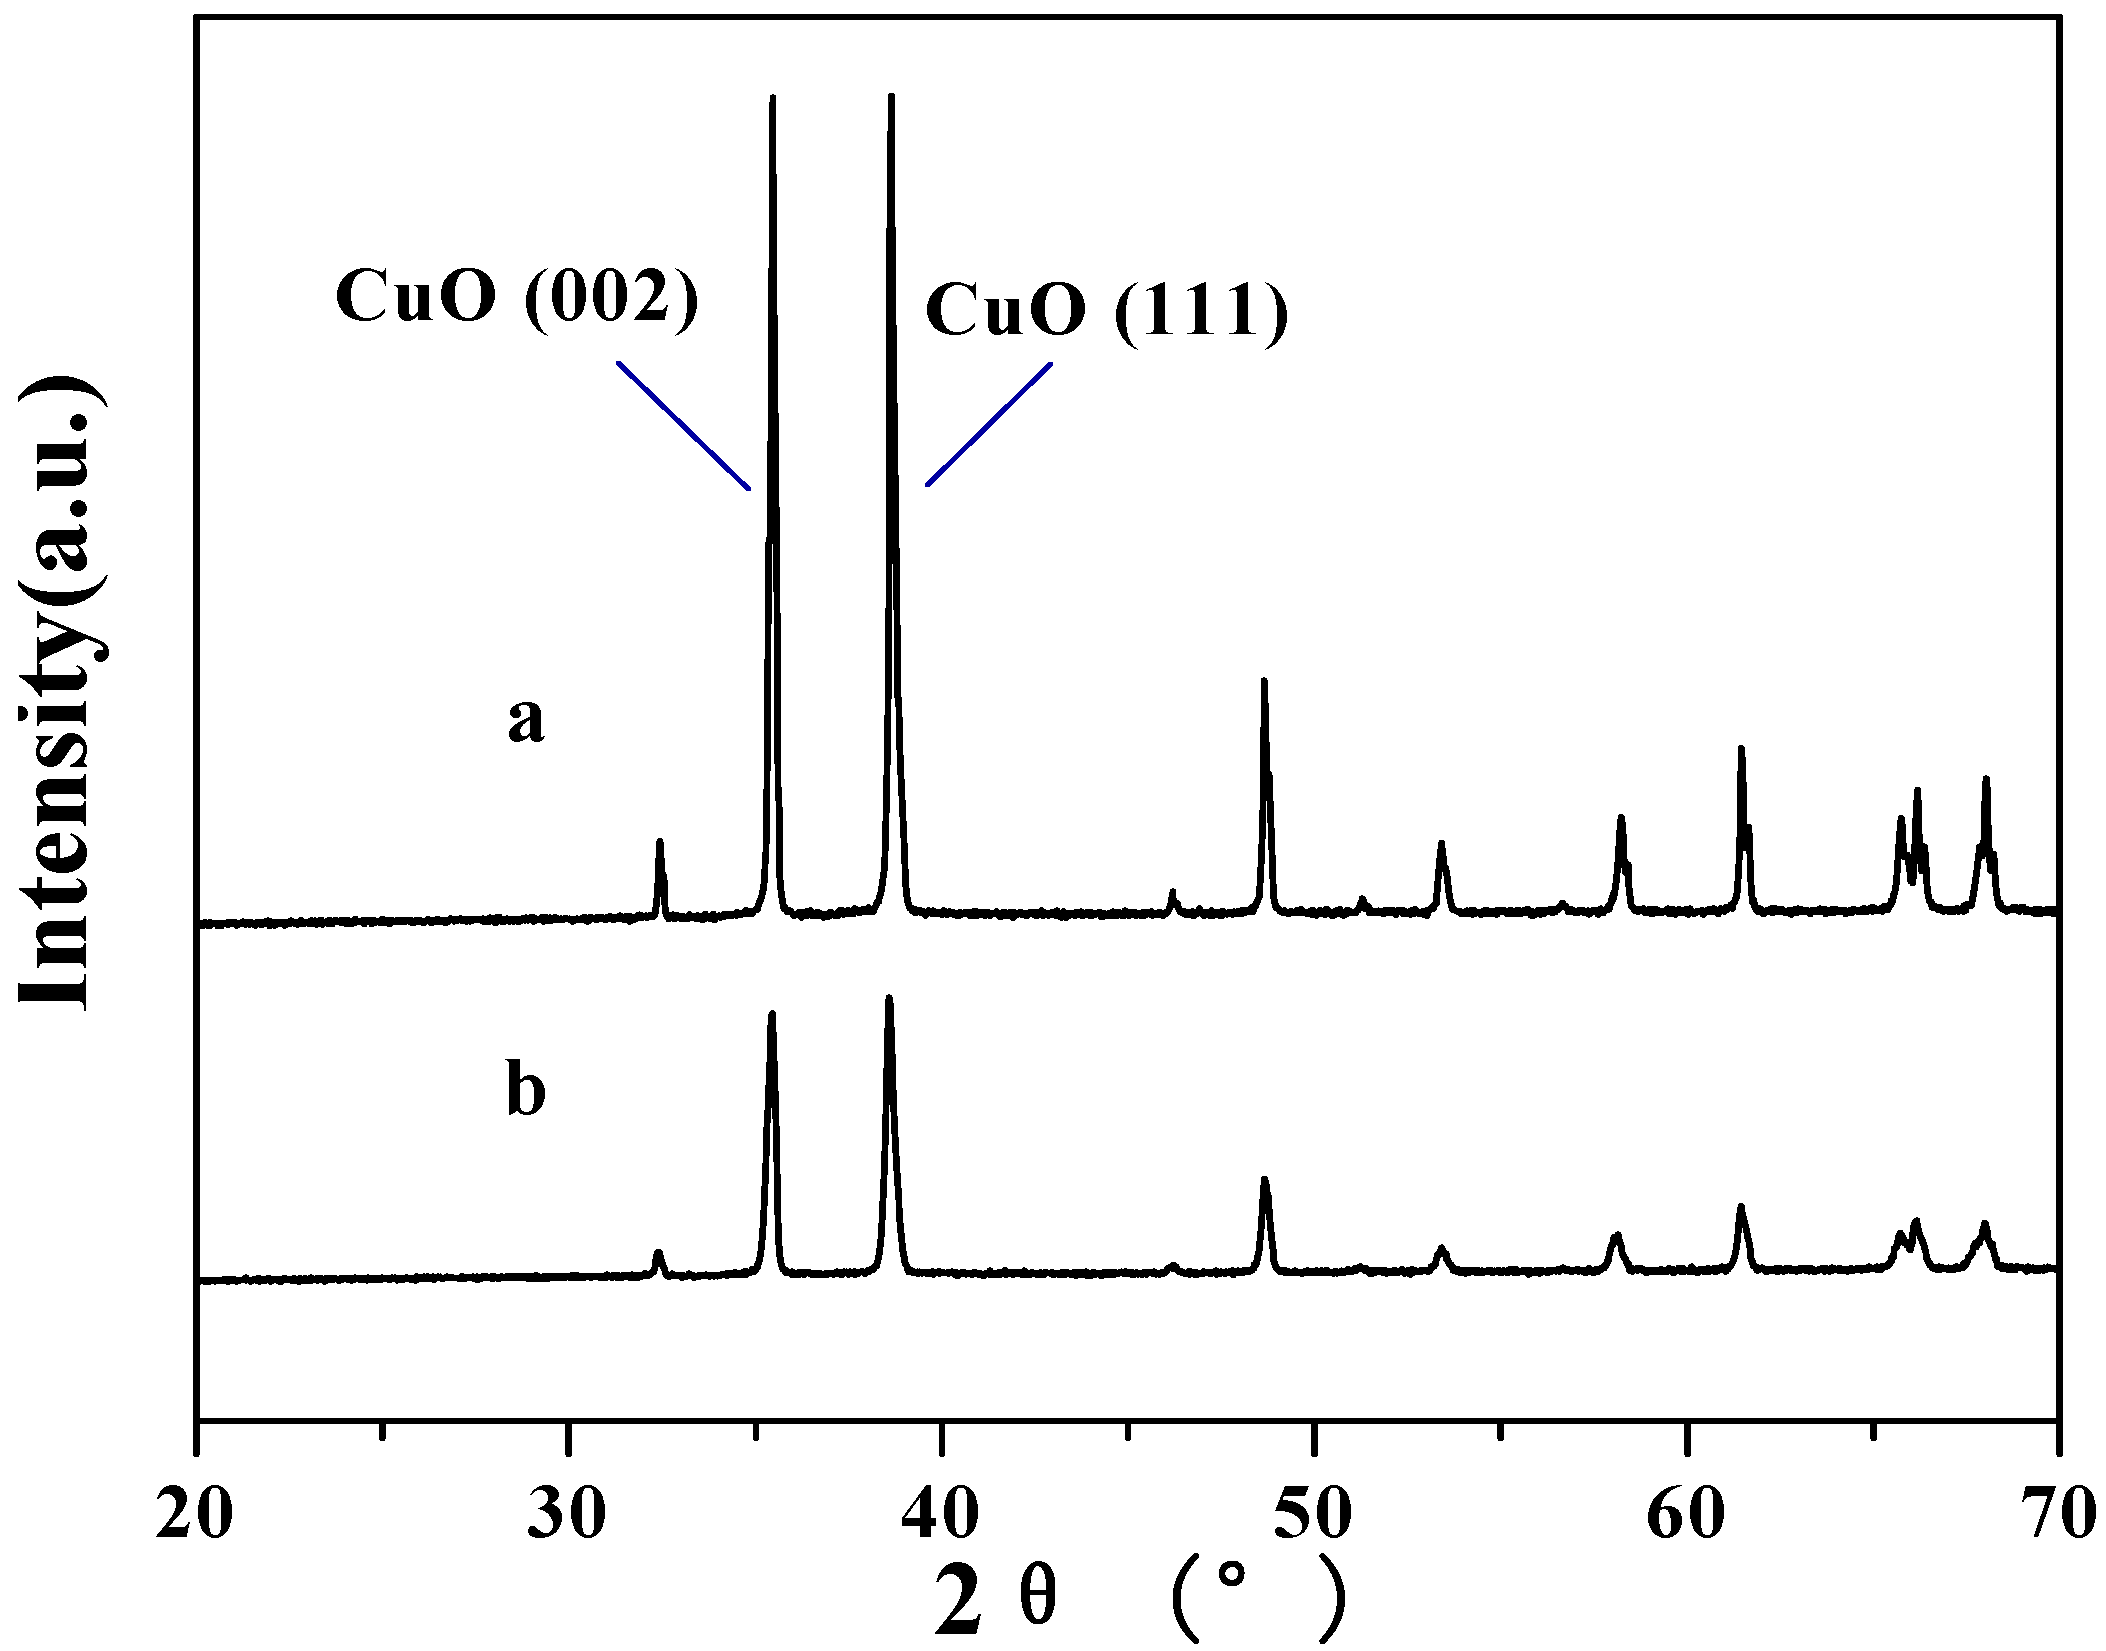
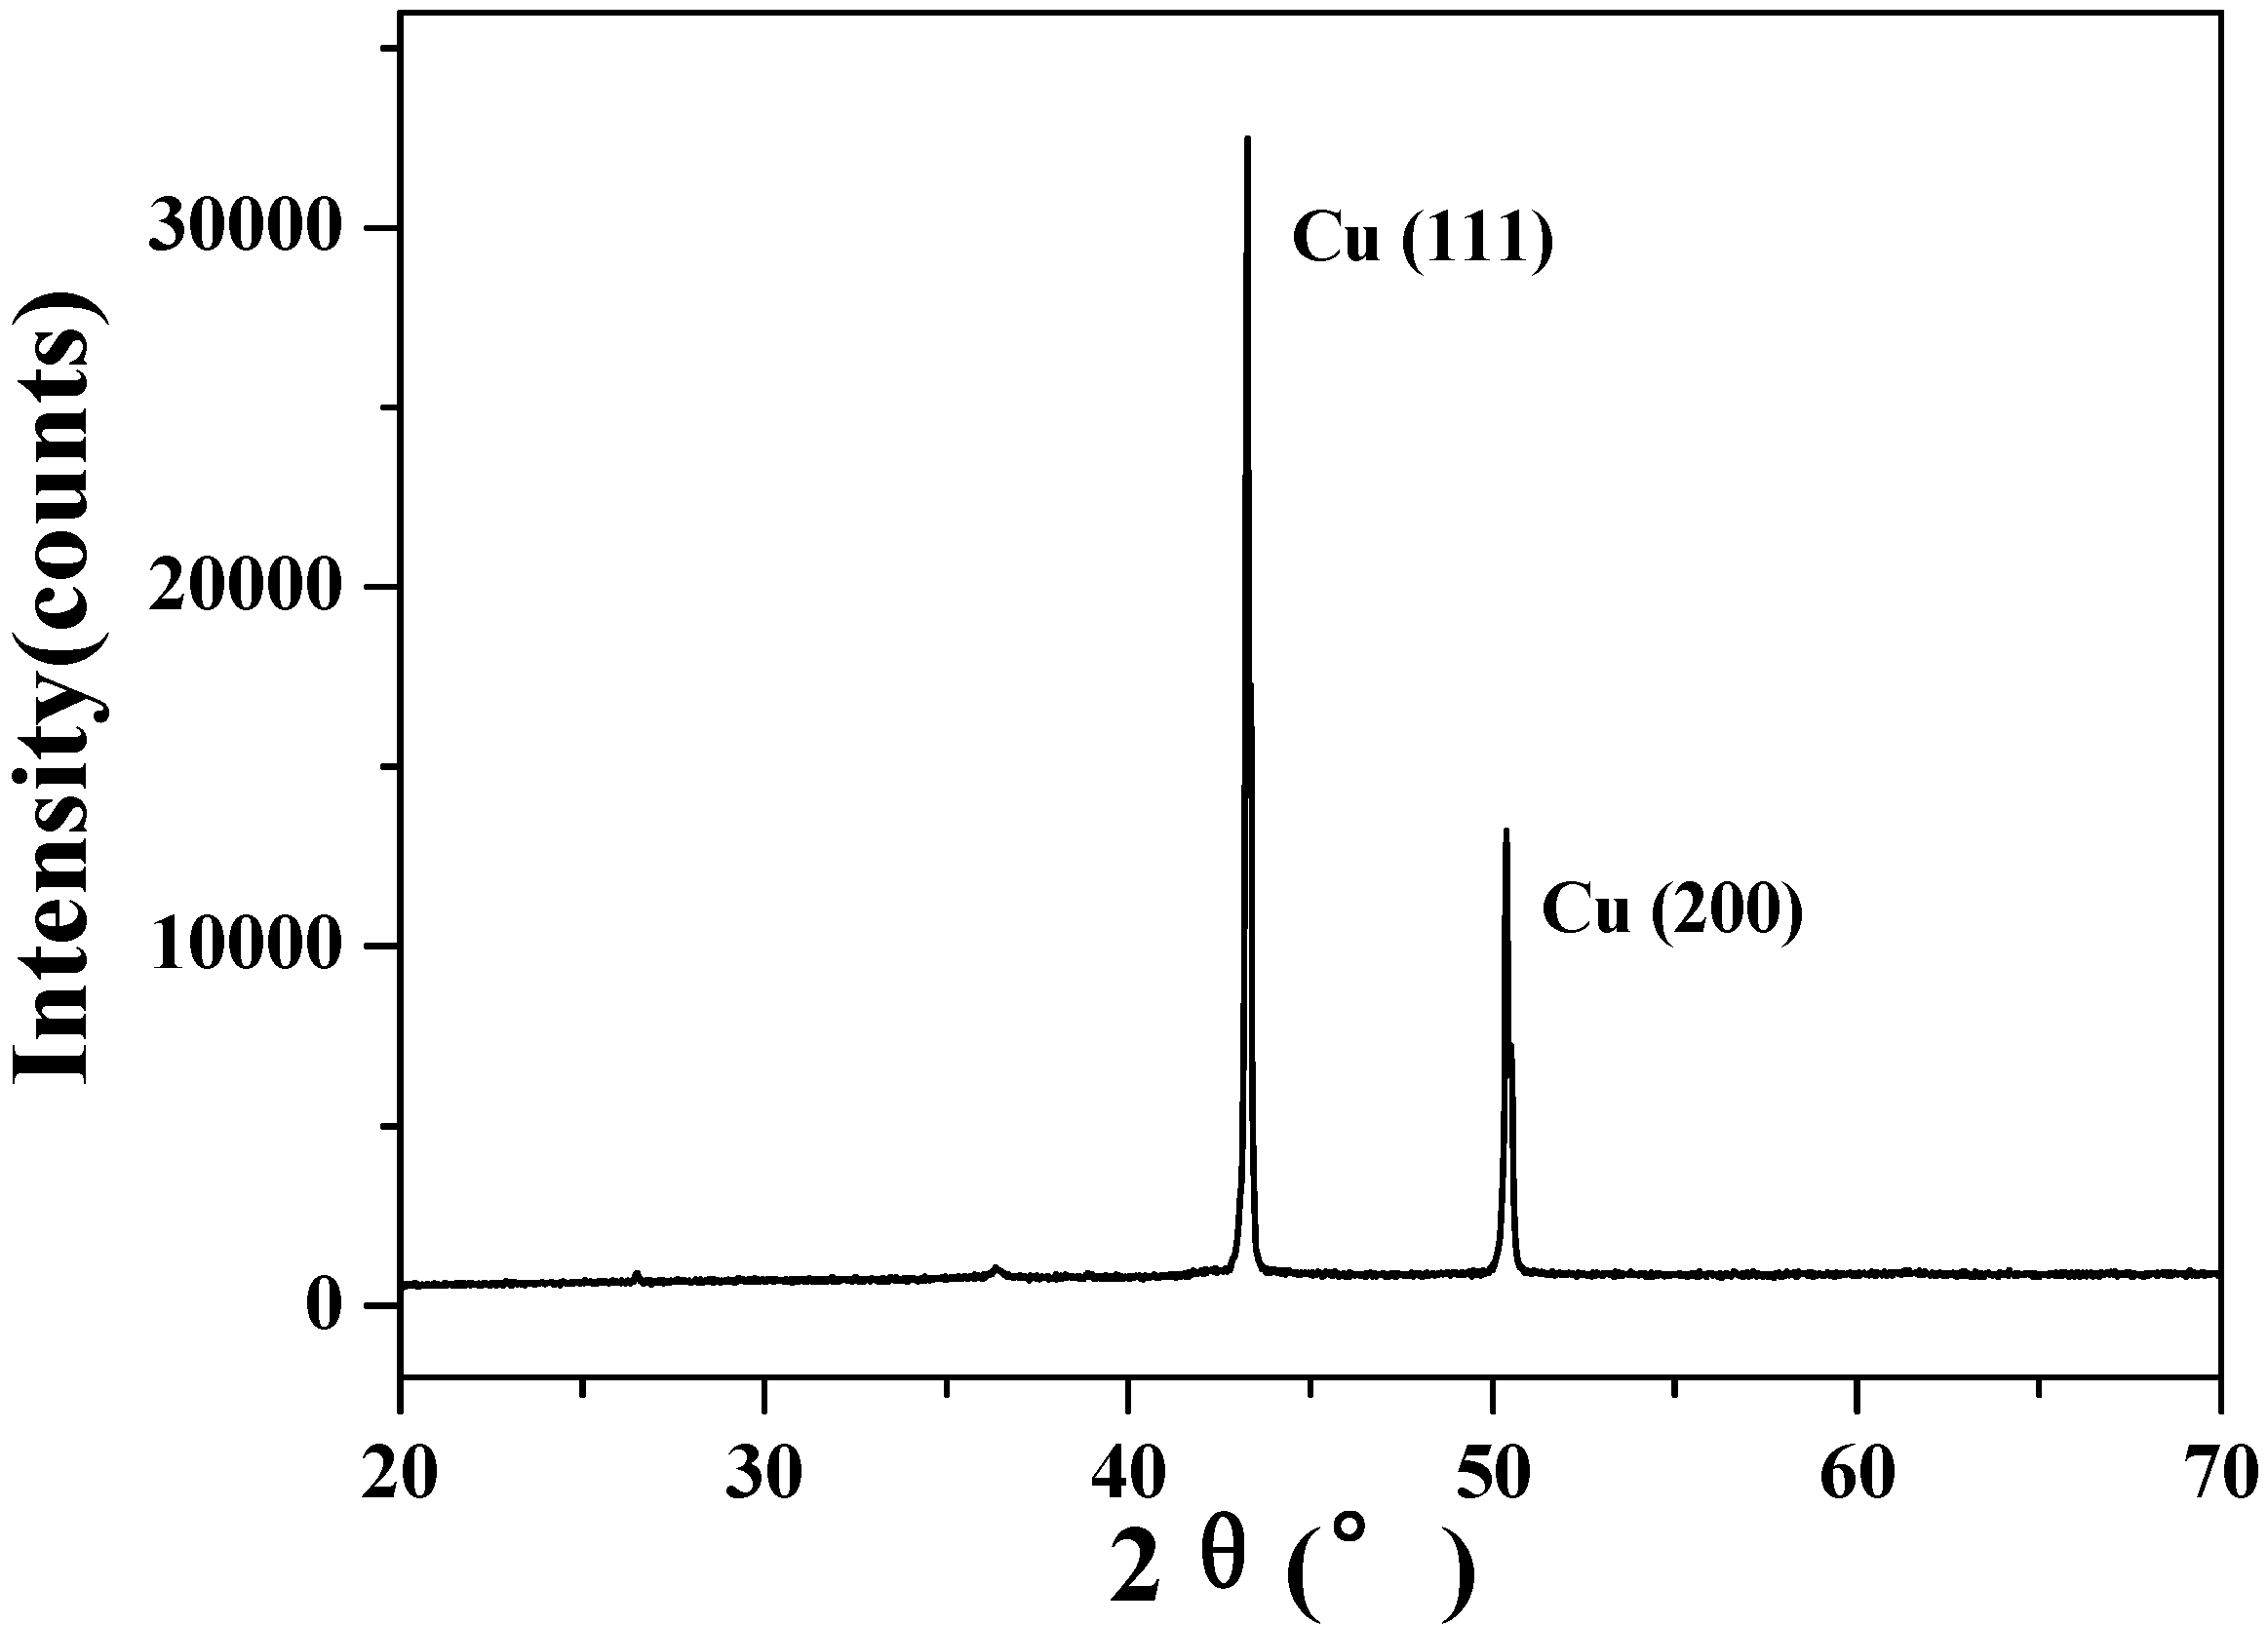
3.5. X-ray diffraction analysis
3.6. Atomic force microscope measurement
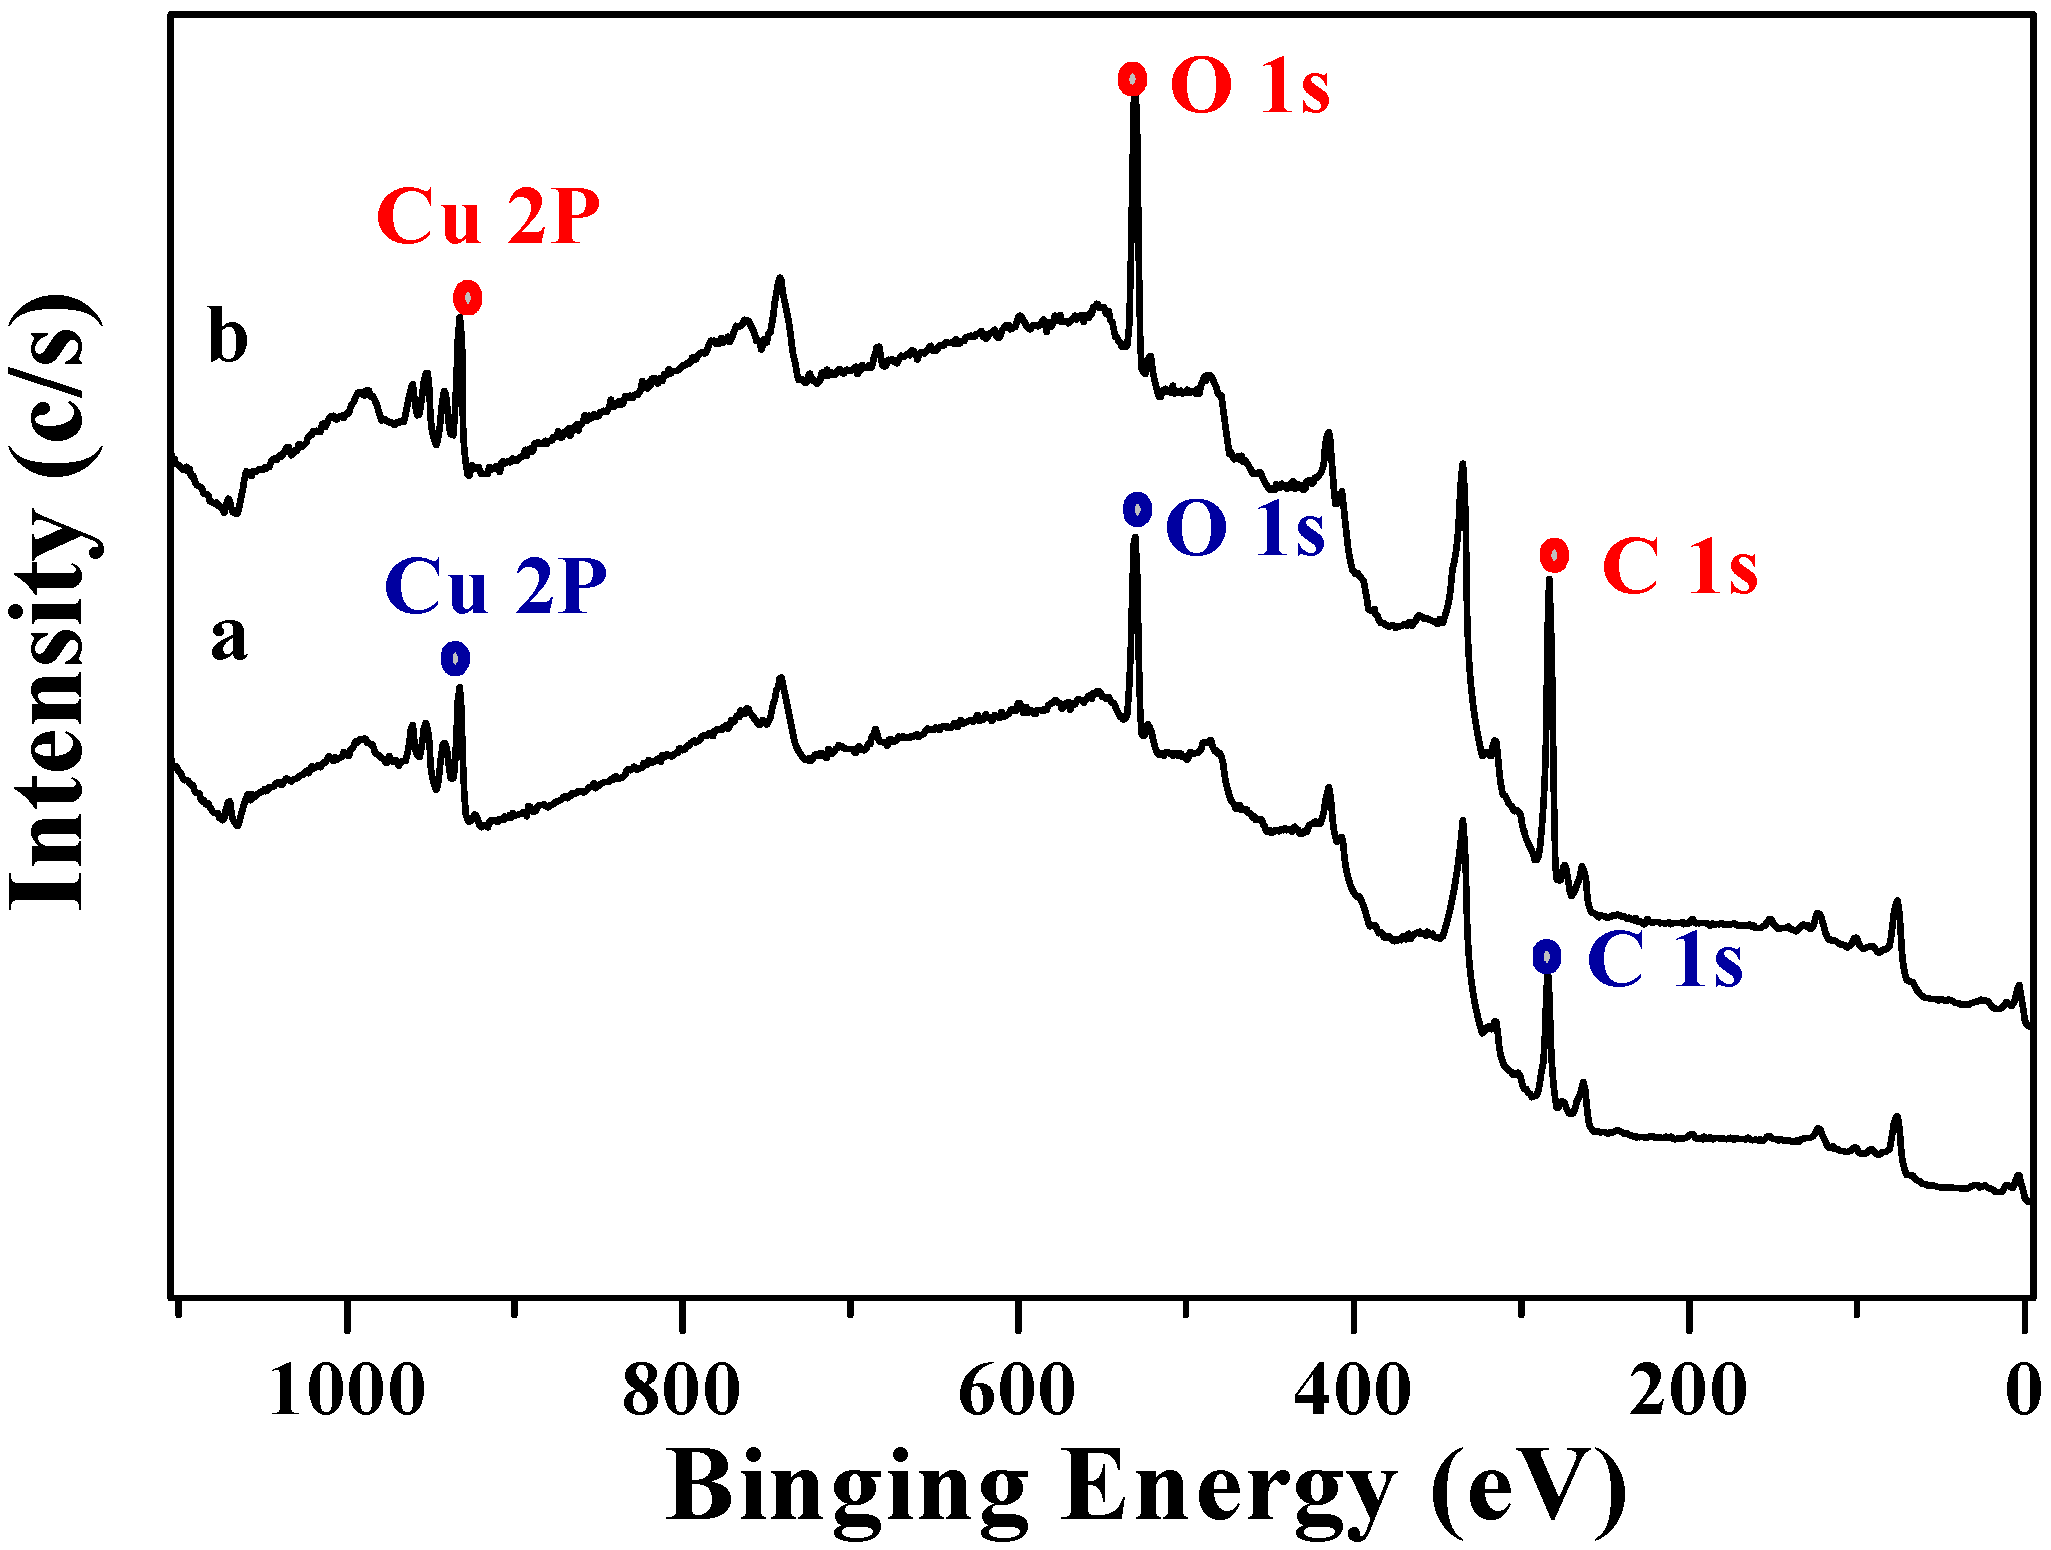
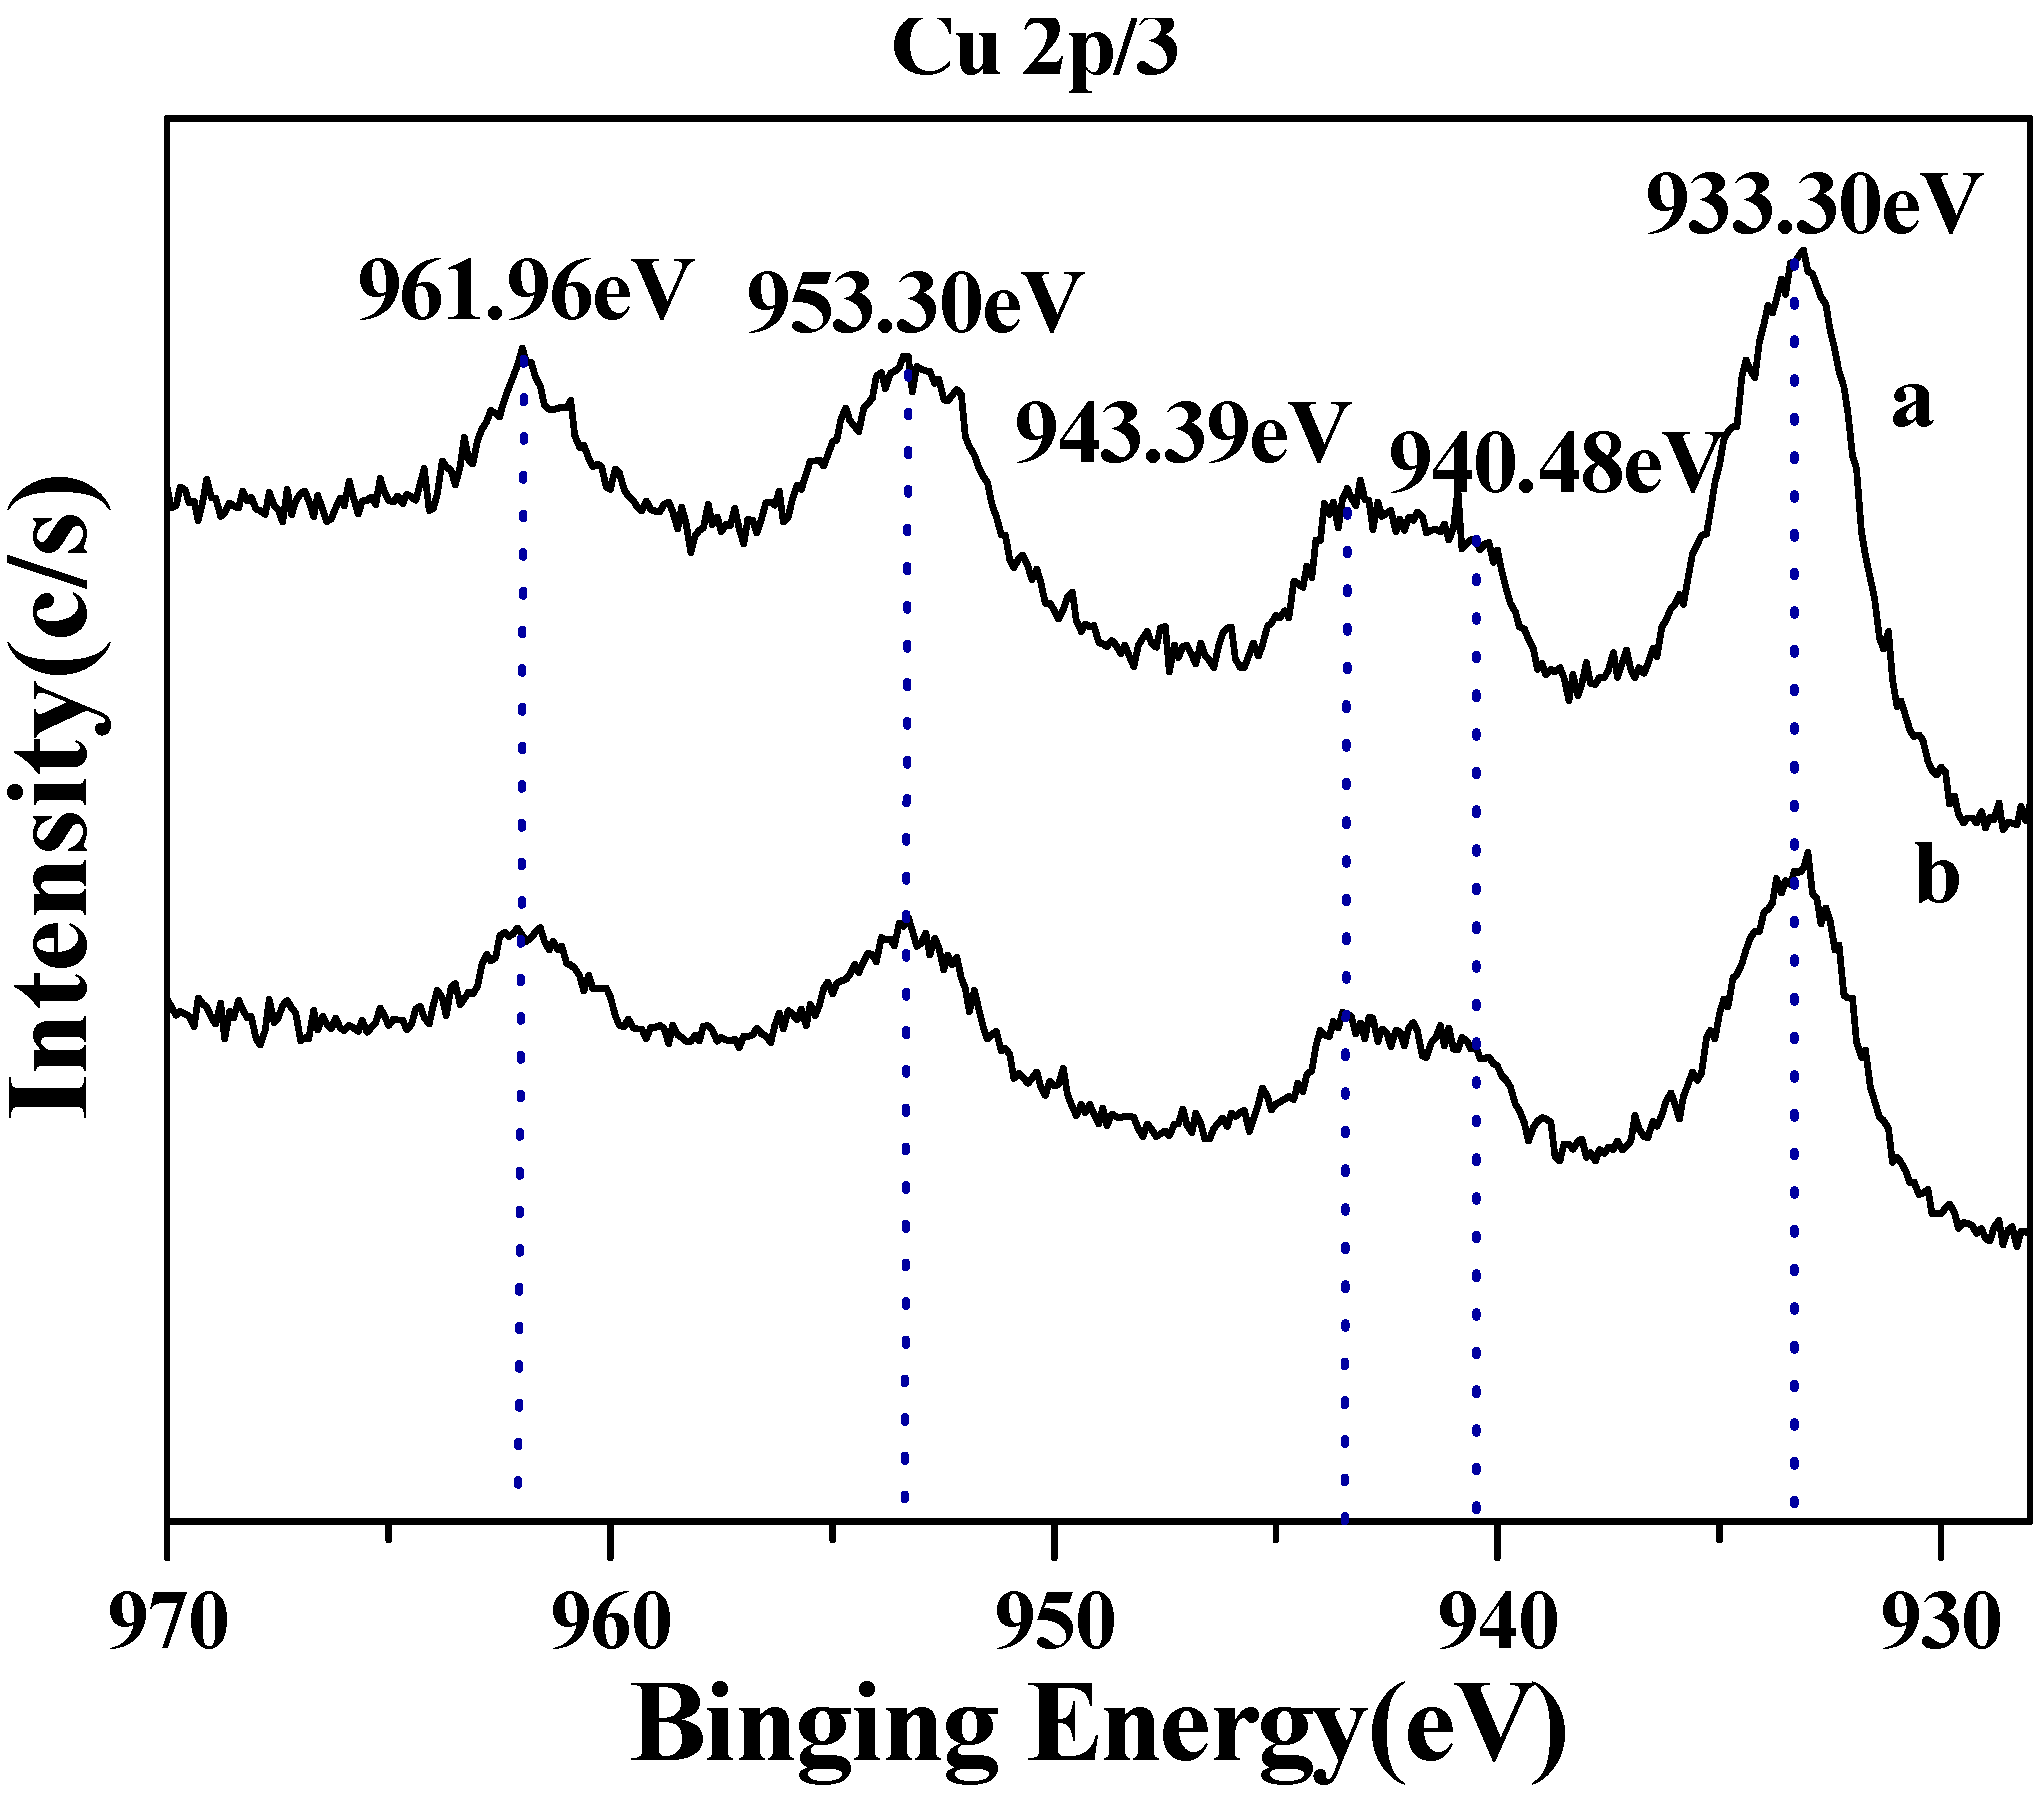
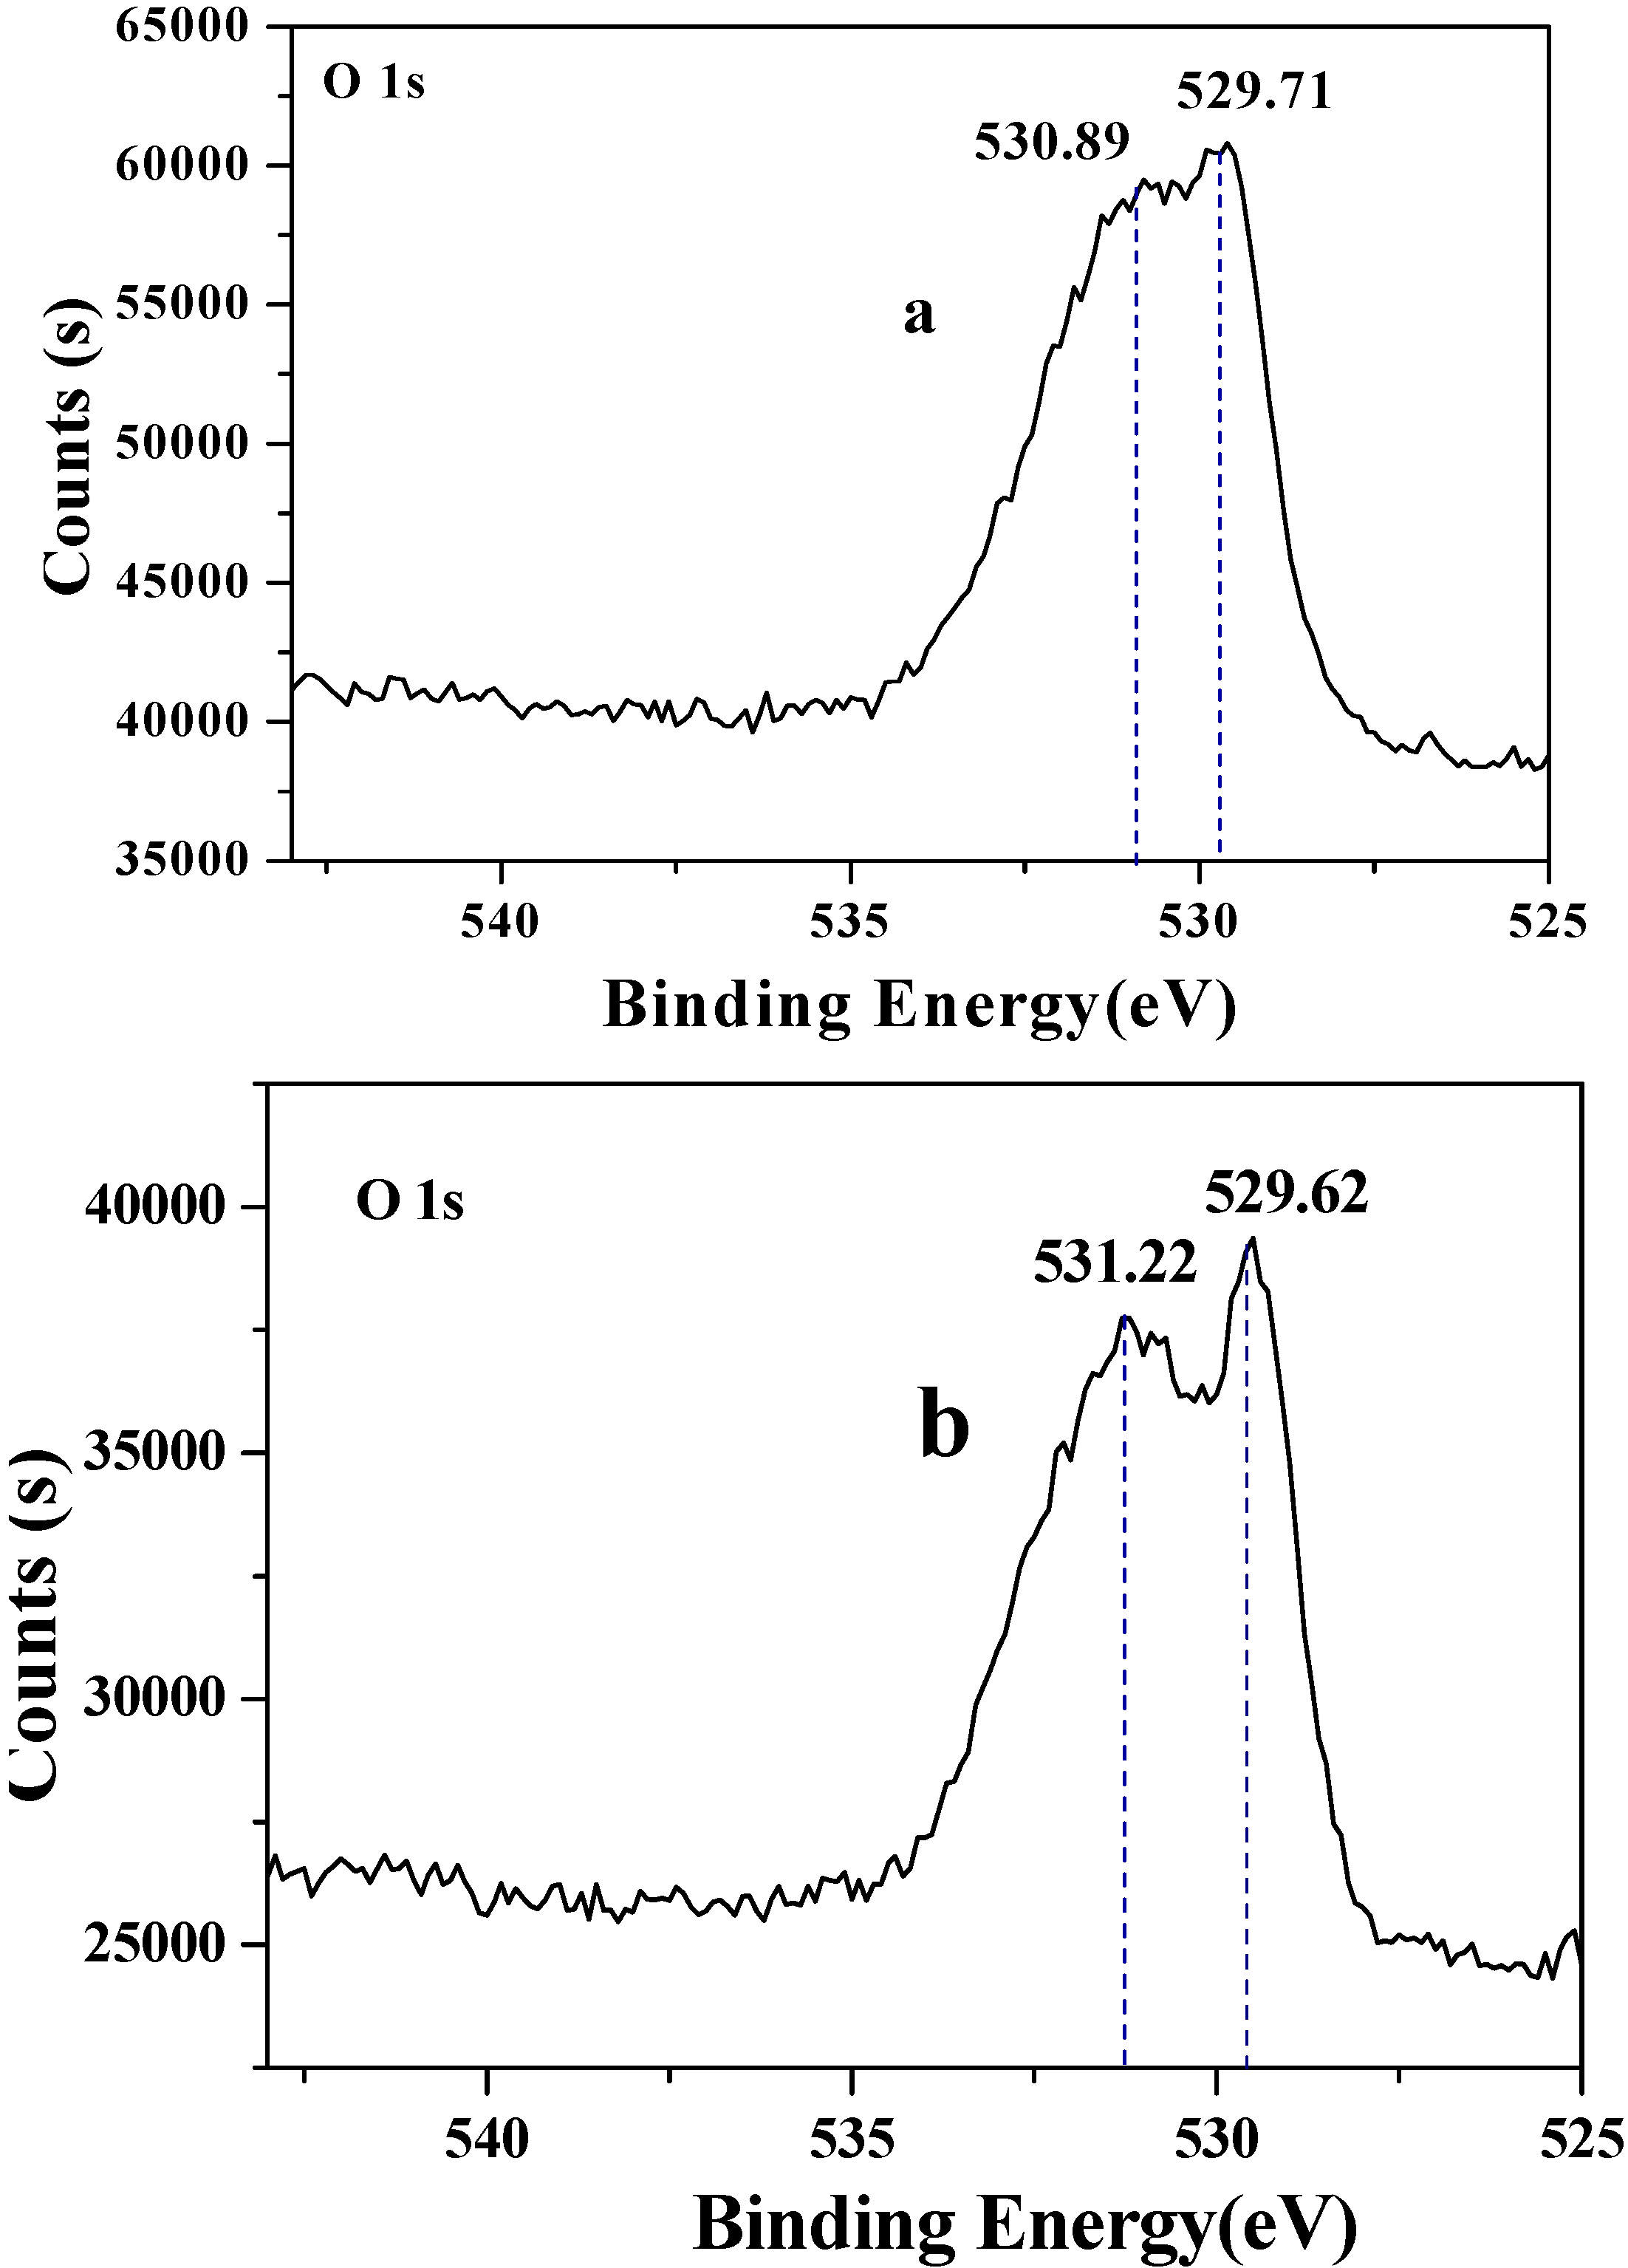
3.7. X-ray photoelectron spectrometry
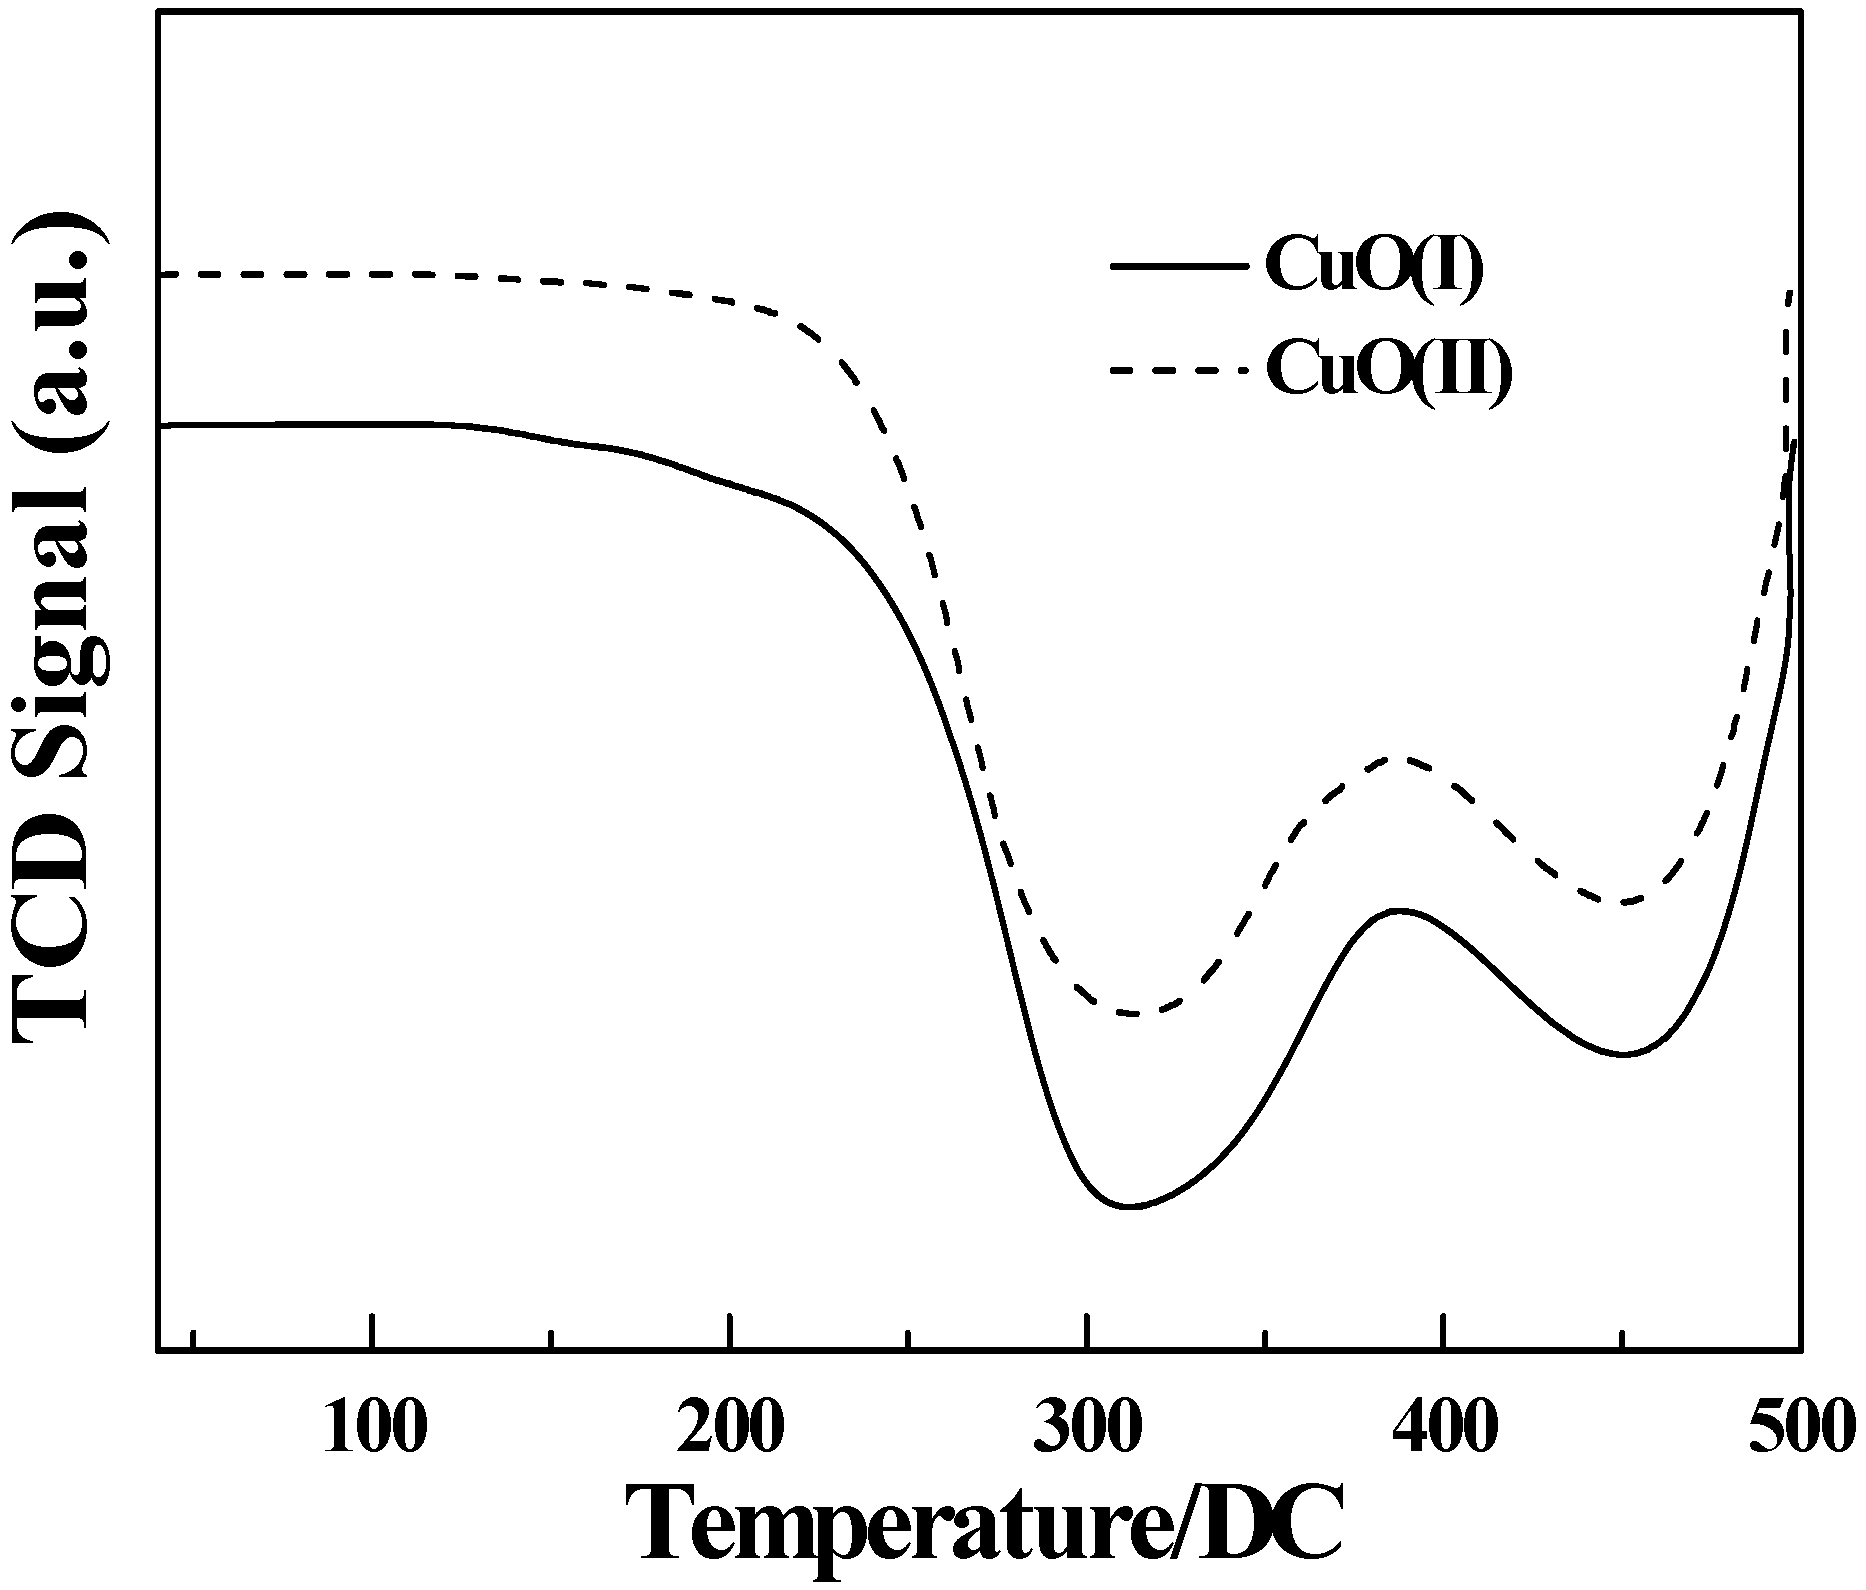
3.8. Temperature programmed reduction analysis
4. Conclusions
Acknowledgements
- Sample Availability: Samples of the compounds are available from the authors.
References and Notes
- He, Z.S. Extraction of Levulinic Acid from Paper - making Black Liquor. Chem. Ind. Eng. 1999, 2, 163–166. [Google Scholar]
- Chang, C.; Cen, P.L.; Ma, X.J. Levulinic acid production from wheat straw. Bioresour. Technol. 2007, 98, 1448–1453. [Google Scholar] [CrossRef]
- Cha, J.Y.; Hanna, M.A. Levulinic acid production based on extrusion and pressurized batch reaction. Ind. Crops Products 2002, 16, 109–118. [Google Scholar] [CrossRef]
- Fang, Q.; Hanna, M.A. Experimental studies for levulinic acid production from whole kernel grain sorghum. Bioresour. Technol. 2002, 81, 187–192. [Google Scholar] [CrossRef]
- Yan, Z.P.; Lin, L.; Liu, S.J. Synthesis of γ-Valerolactone by Hydrogenation of Biomass-derived Levulinic Acid over Ru/C Catalyst. Energy Fuels 2009, 23, 3853–3858. [Google Scholar] [CrossRef]
- Mathe, F.; Castanet, Y.; Mortreux, A.; Petit, F. Synthesis of 2-butanone from ethylene and methyl formate catalysed by rhodium-iodide complexes. Tetrahedron Lett. 1991, 32, 3989–3992. [Google Scholar] [CrossRef]
- Williamd, D.E.; George, B.L. Peroxytrifluoroacetic Acid. V. The Oxidation of Ketones to Esters. J. Am. Chem. Soc. 1955, 77, 2287–2288. [Google Scholar] [CrossRef]
- Lou, Z.Y.; Chen, X.Y.; Tian, L.; Qiao, M.H.; Fan, K.N.; He, H.Y.; Zhang, X.X.; Zong, B.N. Preparation and characterization of the chirally modified rapidly quenche skeletal Ni catalyst for enantioselective hydrogenation of butanone to R-(−)-2-butanol. J. Mol. Catal. A Chem. 2010. [Google Scholar] [CrossRef]
- Gao, F.; Li, R.J.; Garland, M. An on-line FTIR study of the liquid-phase hydrogenation of 2-butanone over Pt/Al2O3 in d8-toluene-The importance of anhydrous conditions. J. Mol. Catal. A Chem. 2007, 272, 241–248. [Google Scholar] [CrossRef]
- Qureshi, N.; Saha, B.C.; Cotta, M.A. Butanol production from wheat straw by simultaneous saccharification and fermentation using Clostridium beijerinckii: Part II—Fed-batch fermentation. Biomass Bioenergy 2008, 32, 176–183. [Google Scholar] [CrossRef]
- Mirkhani, V.; Tangestaninejad, S.; Moghadam, M.; Karimian, Z. Efficient oxidative decarboxylation of carboxylic acids with sodium periodate catalysted by supported manganese(III) porphyrin. Bioor. Med. Lett. 2003, 13, 3433–3435. [Google Scholar] [CrossRef]
- Mirkhani, V.; Tangestaninejad, S.; Moghadam, M.; Moghbel, M. Rapid and efficient oxidative decarboxylation o carboxylic acid with sodium periodate catalyzedvby manganese (III) Schiff base complexes. Bioorg. Med. Chem. 2004, 12, 903–906. [Google Scholar]
- Guitton, J.; Tinardon, F.; Lamrini, R.; Lacan, P.; Desage, M.; Francina, A.F. Decarboxylation of [1-13C]leucine by hydroxyl radicals. Free Radical Biol. Med. 1998, 25, 340–345. [Google Scholar] [CrossRef]
- Lamrini, R.; Lacan, P.; Francina, A.; Guilluy, R.; Desage, M.; Michon, J.; Becchi, M.; Brazier, J.L. Oxidative decarboxylation of benzoic acid by peroxyl radicals. Free Radical Biol. Med. 1998, 24, 280–289. [Google Scholar] [CrossRef]
- Anderson, J.M.; Kochi, J.K. Silver(I)-Catalyzed Oxidative Decarboxylation of Acids by Peroxydisulfate. The Role of Silver(II). J. Am. Chem. Soc. 1970, 92, 1651–1659. [Google Scholar] [CrossRef]
- Marchionni, G.; Petricci, S.; Spataro, G.; Pezzin, G. A study of the thermal decarboxylation of three perfluoropolyether salts. J. Fluorine Chem. 2003, 124, 123–130. [Google Scholar] [CrossRef]
- Zhang, G.; Shen, K.H.; Zhao, D.F.; Yuan, Y.K.; Wang, G.Y. Preparation of uncoated iron oxide nanoparticles by thermal decarboxylation of iron hydroxide cetylsulfonyl acetate in solution. Mater. Lett. 2008, 62, 219–221. [Google Scholar]
- Martins, C.P.B.; Awan, M.A.; Freeman, S.; Herraiz, T.; Alder, J.F.; Brandt, S.D. Fingerprint analysis of thermolytic decarboxylation of tryptophan to tryptamine catalyzed by natural oils. J. Chromatogr. A 2008, 1210, 115–120. [Google Scholar] [CrossRef]
- Farhadi, S.; Zaringhadam, P.; Sahamieh, R.Z. Photolytic decarboxylation of a-arylcarboxylic acids mediated by HgF2 under a dioxygen atmosphere. Tetrahedron Lett. 2006, 47, 1965–1968. [Google Scholar] [CrossRef]
- Chum, H.L.; Ratcliff, M. Photoelectrochemistry of Levulinic Acid on Undoped Platinized n-TIO2, Powders. J. Phys. Chem. 1983, 87, 3089–3093. [Google Scholar] [CrossRef]
- Liu, X.L.; Jiang, Z.H.; Li, J.; Zhang, Z.H.; Ren, L.Q. Super-hydrophobic property of nano-sized cupric oxide films. Surf. Coat. Technol. 2010. [Google Scholar] [CrossRef]
- Martinson, C.A.; Reddy, K.J. Adsorption of arsenic(III) and arsenic(V) by cupric oxide nanoparticles. J. Colloid Interface Sci. 2009, 336, 406–411. [Google Scholar] [CrossRef]
- Hoa, N.D.; An, S.Y.; Dung, N.Q.; Quy, N.V.; Kim, D.J. Synthesis of p-type semiconducting cupric oxide thin films and their application to hydrogen detection. Sens. Actuat. B. 2010, 146, 239–244. [Google Scholar] [CrossRef]
- Jayatissa, A.H.; Guo, K.; Jayasuriya, A.C. Fabrication of cuprous and cupric oxide thin films by heat treatment. Appl. Surf. Sci. 2009, 255, 9474–9479. [Google Scholar] [CrossRef]
- Luo, M.F.; Zhong, Y.J.; Yuan, X.X.; Zheng, X.M. TPR and TPD studies of CuO/CeO2 catalysts for low temperature CO oxidation. Appl. Catal. A Gen. 1997, 162, 121–131. [Google Scholar] [CrossRef]
- Luo, M.F.; Fang, P.; He, M.; Xie, Y.L. In situ XRD, Raman, and TPR studies of CuO/Al2O3 catalysts for CO oxidatio. J. Mol. Catal. A Chem. 2005, 239, 243–248. [Google Scholar] [CrossRef]
- Torre-Abreu, C.; Ribeiro, M.F.; Henriques, C.; Delahay, G. NO TPD and H2-TPR studies for characterisation of CuMOR catalysts -The role of Si/Al ratio, copper content and cocation. Appl. Catal., B: Environ. 1997, 14, 261–272. [Google Scholar] [CrossRef]
- Zhou, Y.Z.; Li, S.; Li, Q.S.; Zhang, S.W. Theoretical investigation of the decarboxylation reaction of CH3CO2 radical. J. Mol. Struct. Theochem. 2008, 854, 40–45. [Google Scholar] [CrossRef]
- Snåre, M.; Kubičková, I.; Mäki-Arvela, P.; Eränen, K.; Wärnå, J.; Yu, D. Production of diesel fuel from renewable feeds: Kinetics of ethyl stearate decarboxylation. Chem. Eng. J. 2007, 134, 29–34. [Google Scholar] [CrossRef]
- Chuchev, K.; BelBruno, J.J. Mechanisms of decarboxylation of ortho-substituted benzoic acids. J. Mol. Struct. Theochem. 2007, 807, 1–9. [Google Scholar] [CrossRef]
- Ma, Y.X.; Wu, R.M. Chemistry English; Publishing Company of Wuhan University: Lanzhou, China, 2003; pp. 126–131. [Google Scholar]
- Feng, J.C.; Zhu, Y. Purification and Preparation of Reagent Commonly Used in Organic Labs; Publishing Company of Science: Beijing, China, 2006; pp. 5–7. [Google Scholar]
© 2010 by the authors; licensee MDPI, Basel, Switzerland. This article is an open access article distributed under the terms and conditions of the Creative Commons Attribution license (http://creativecommons.org/licenses/by/3.0/).
Share and Cite
Gong, Y.; Lin, L.; Shi, J.; Liu, S. Oxidative Decarboxylation of Levulinic Acid by Cupric Oxides. Molecules 2010, 15, 7946-7960. https://doi.org/10.3390/molecules15117946
Gong Y, Lin L, Shi J, Liu S. Oxidative Decarboxylation of Levulinic Acid by Cupric Oxides. Molecules. 2010; 15(11):7946-7960. https://doi.org/10.3390/molecules15117946
Chicago/Turabian StyleGong, Yan, Lu Lin, Jianbin Shi, and Shijie Liu. 2010. "Oxidative Decarboxylation of Levulinic Acid by Cupric Oxides" Molecules 15, no. 11: 7946-7960. https://doi.org/10.3390/molecules15117946
APA StyleGong, Y., Lin, L., Shi, J., & Liu, S. (2010). Oxidative Decarboxylation of Levulinic Acid by Cupric Oxides. Molecules, 15(11), 7946-7960. https://doi.org/10.3390/molecules15117946