
Tissue Distribution of Mercury and Its Relationship with Selenium in Atlantic Bluefin Tuna (Thunnus thynnus L.)


Abstract
:1. Introduction
2. Material and Methods
2.1. Sample Collection
2.2. Metal Analysis
2.3. Data Analysis
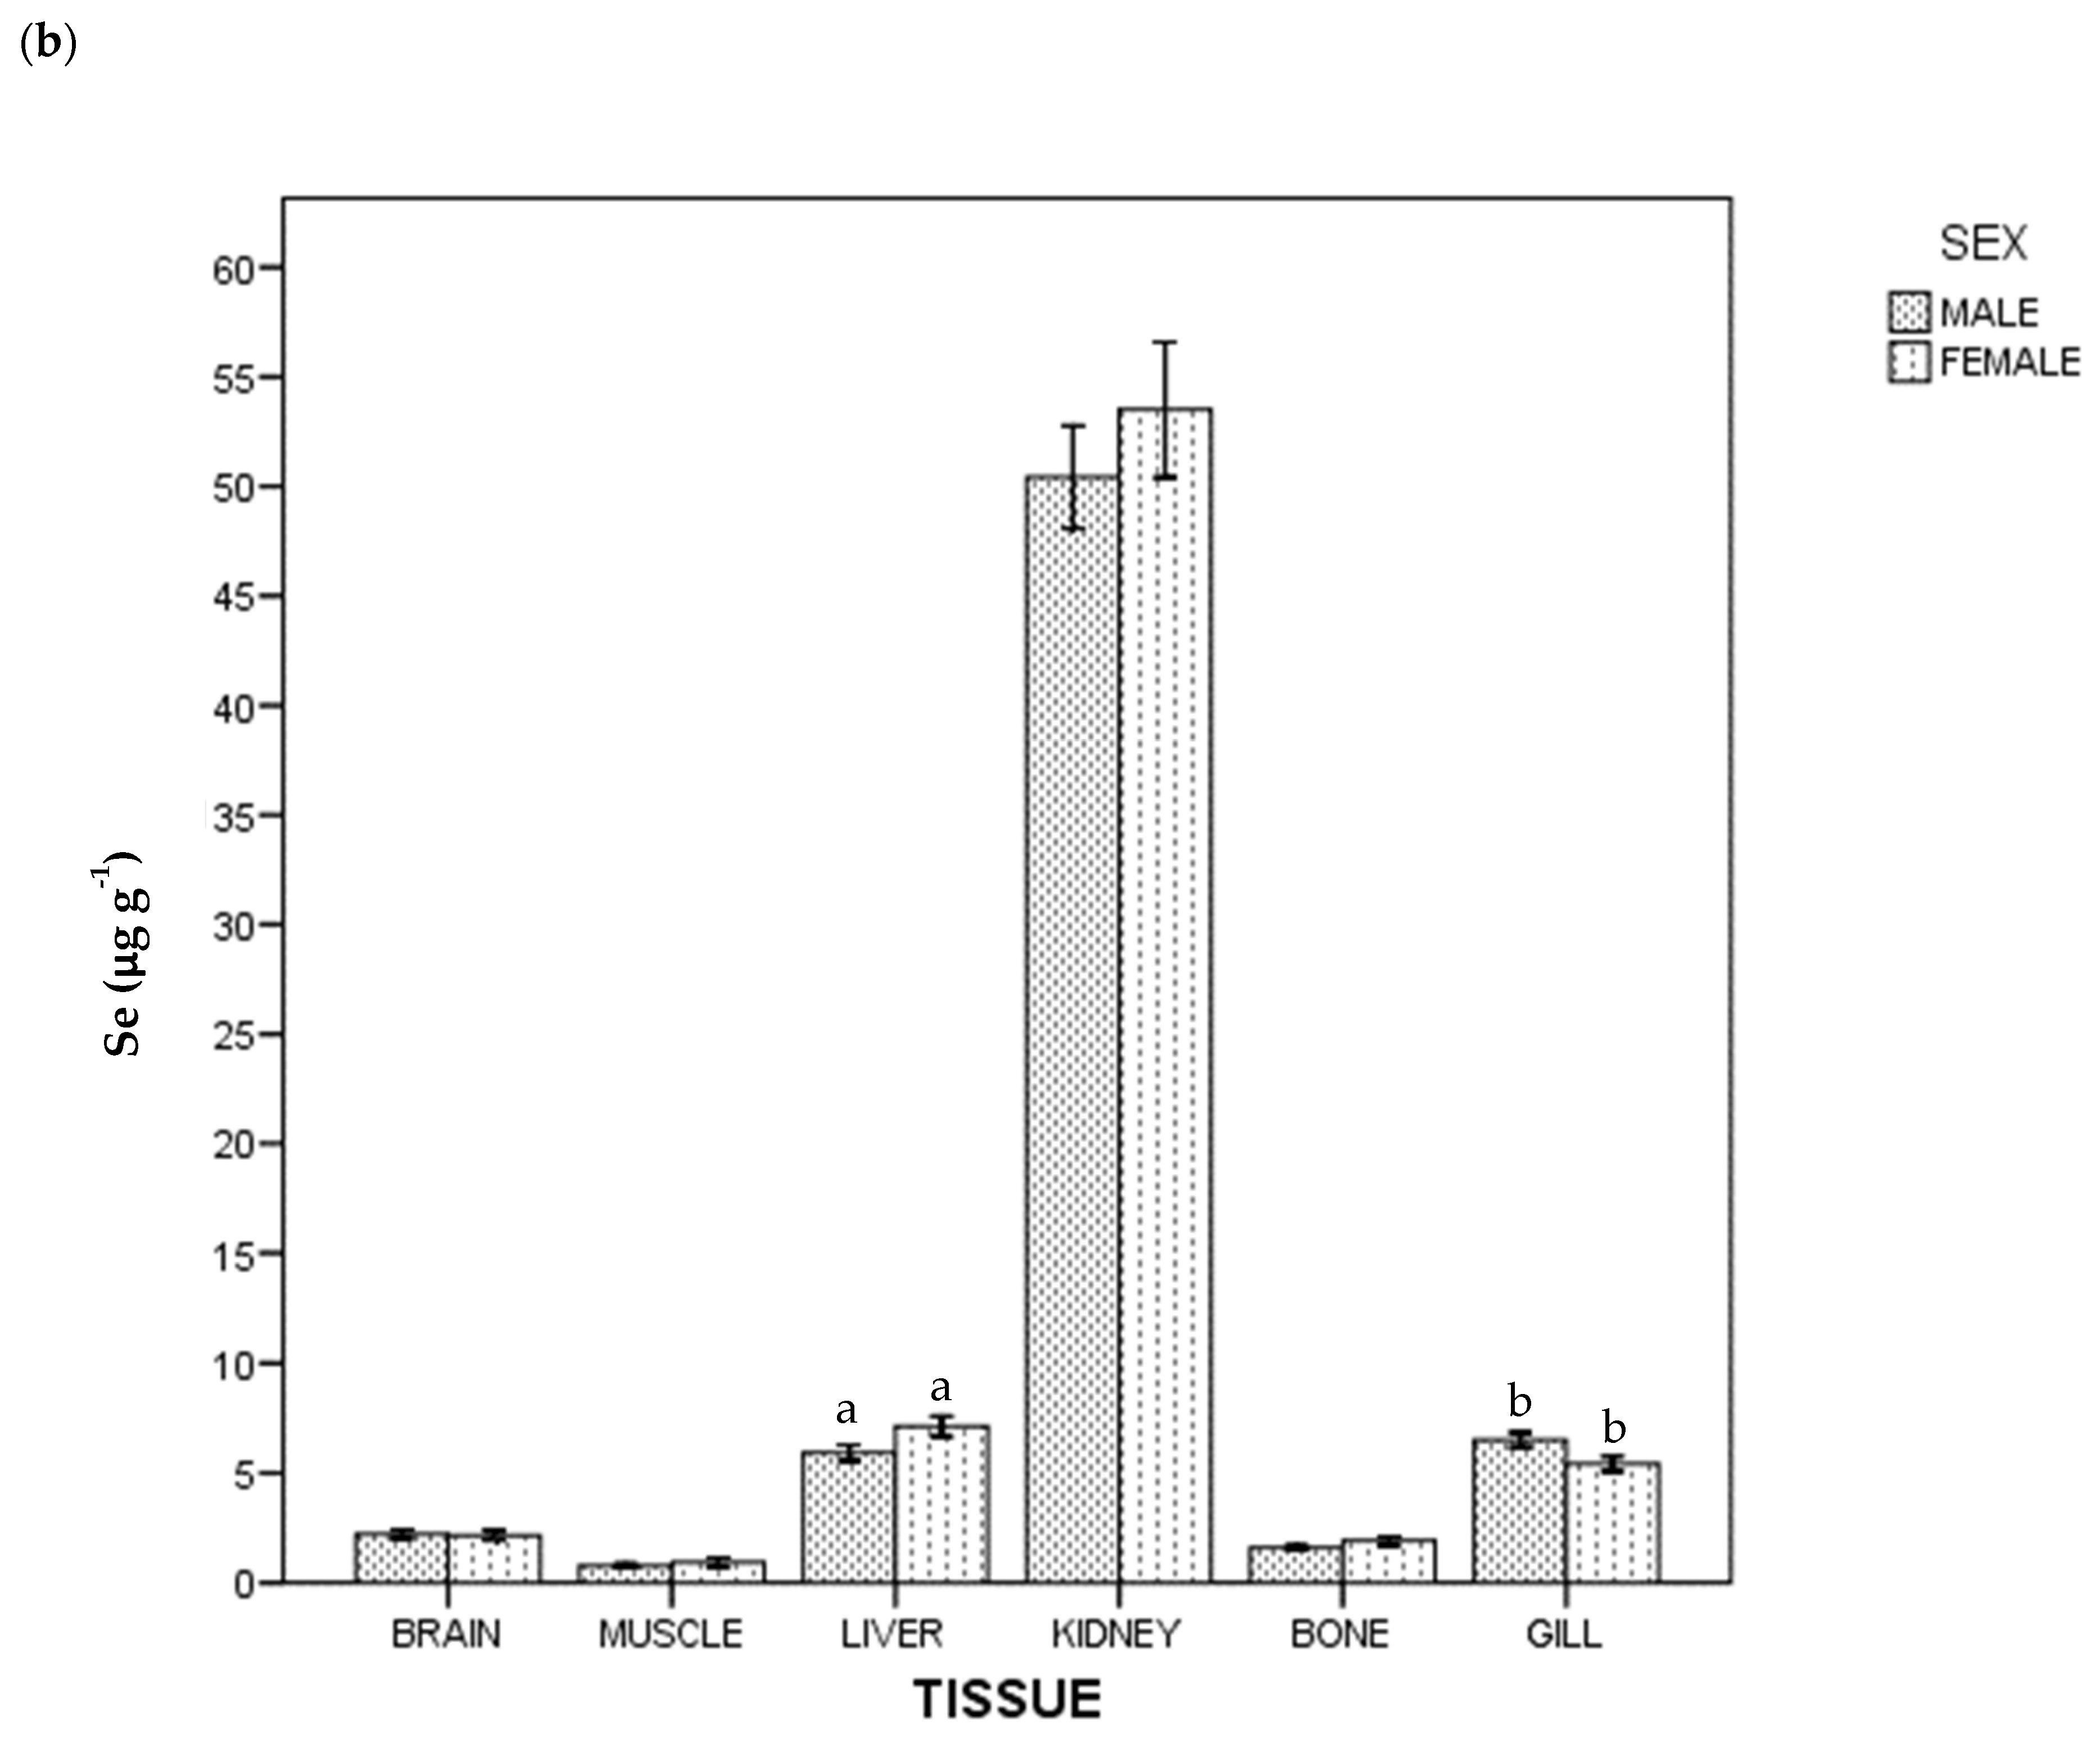
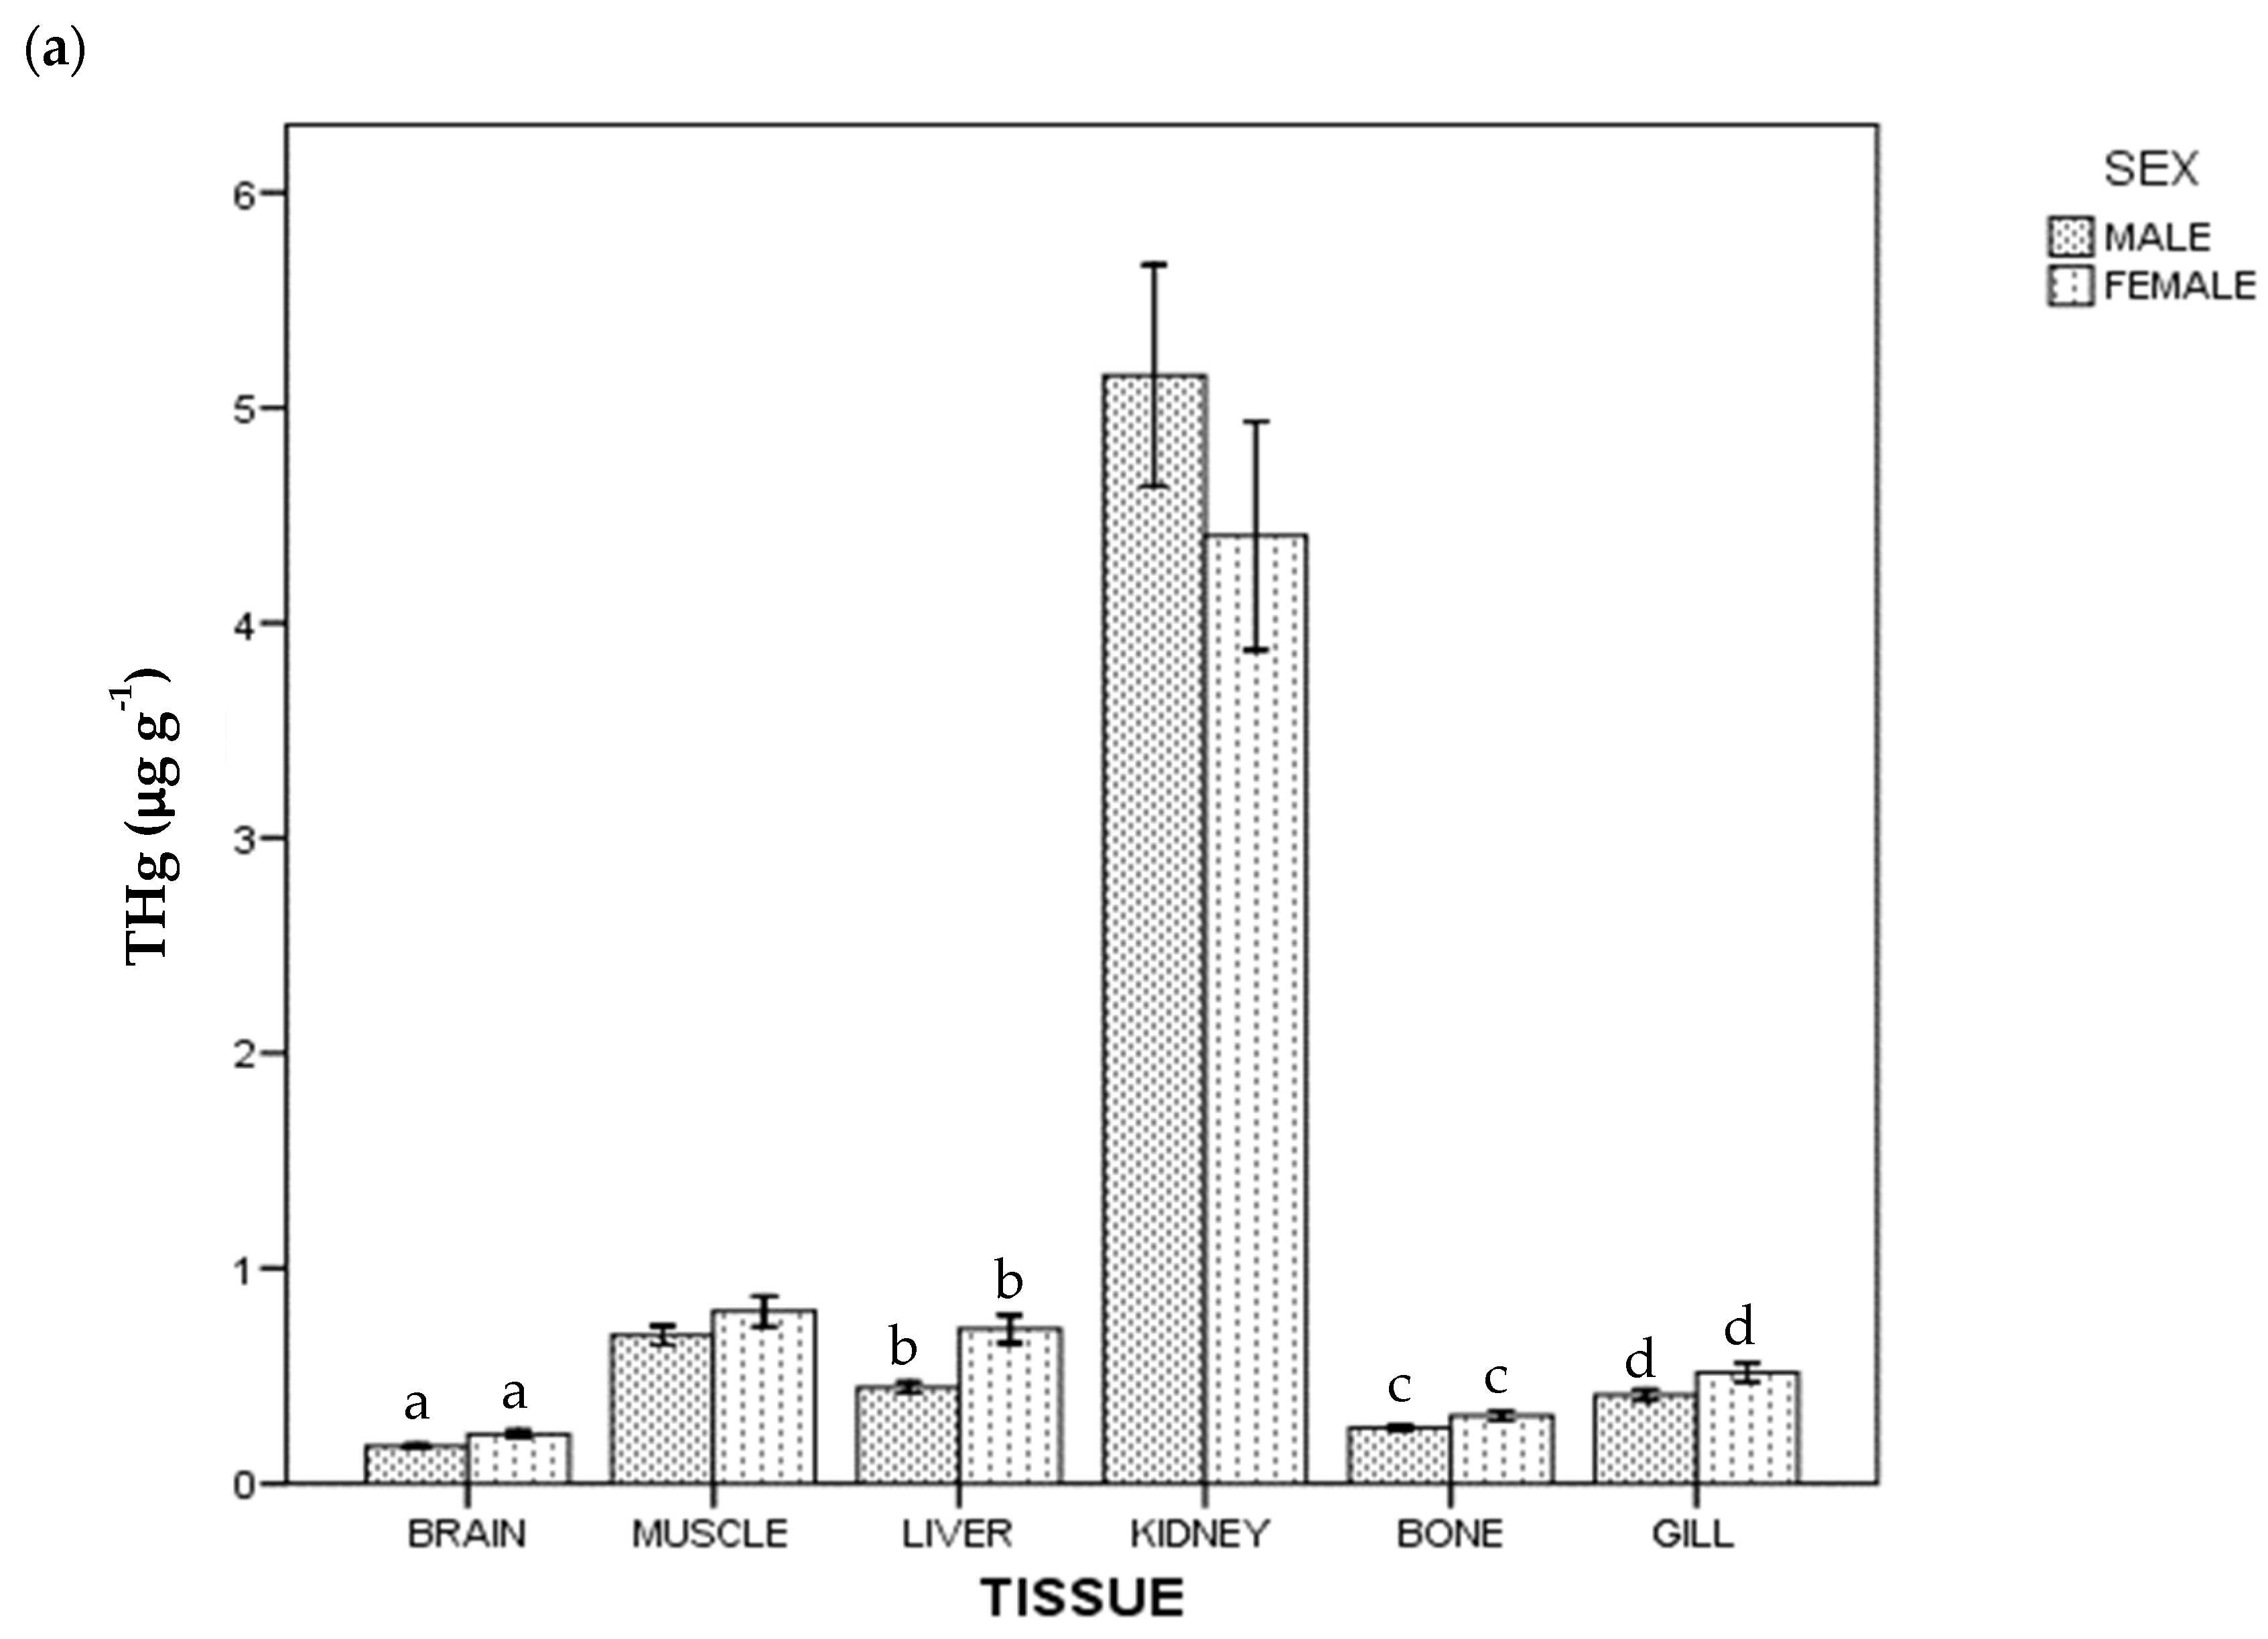
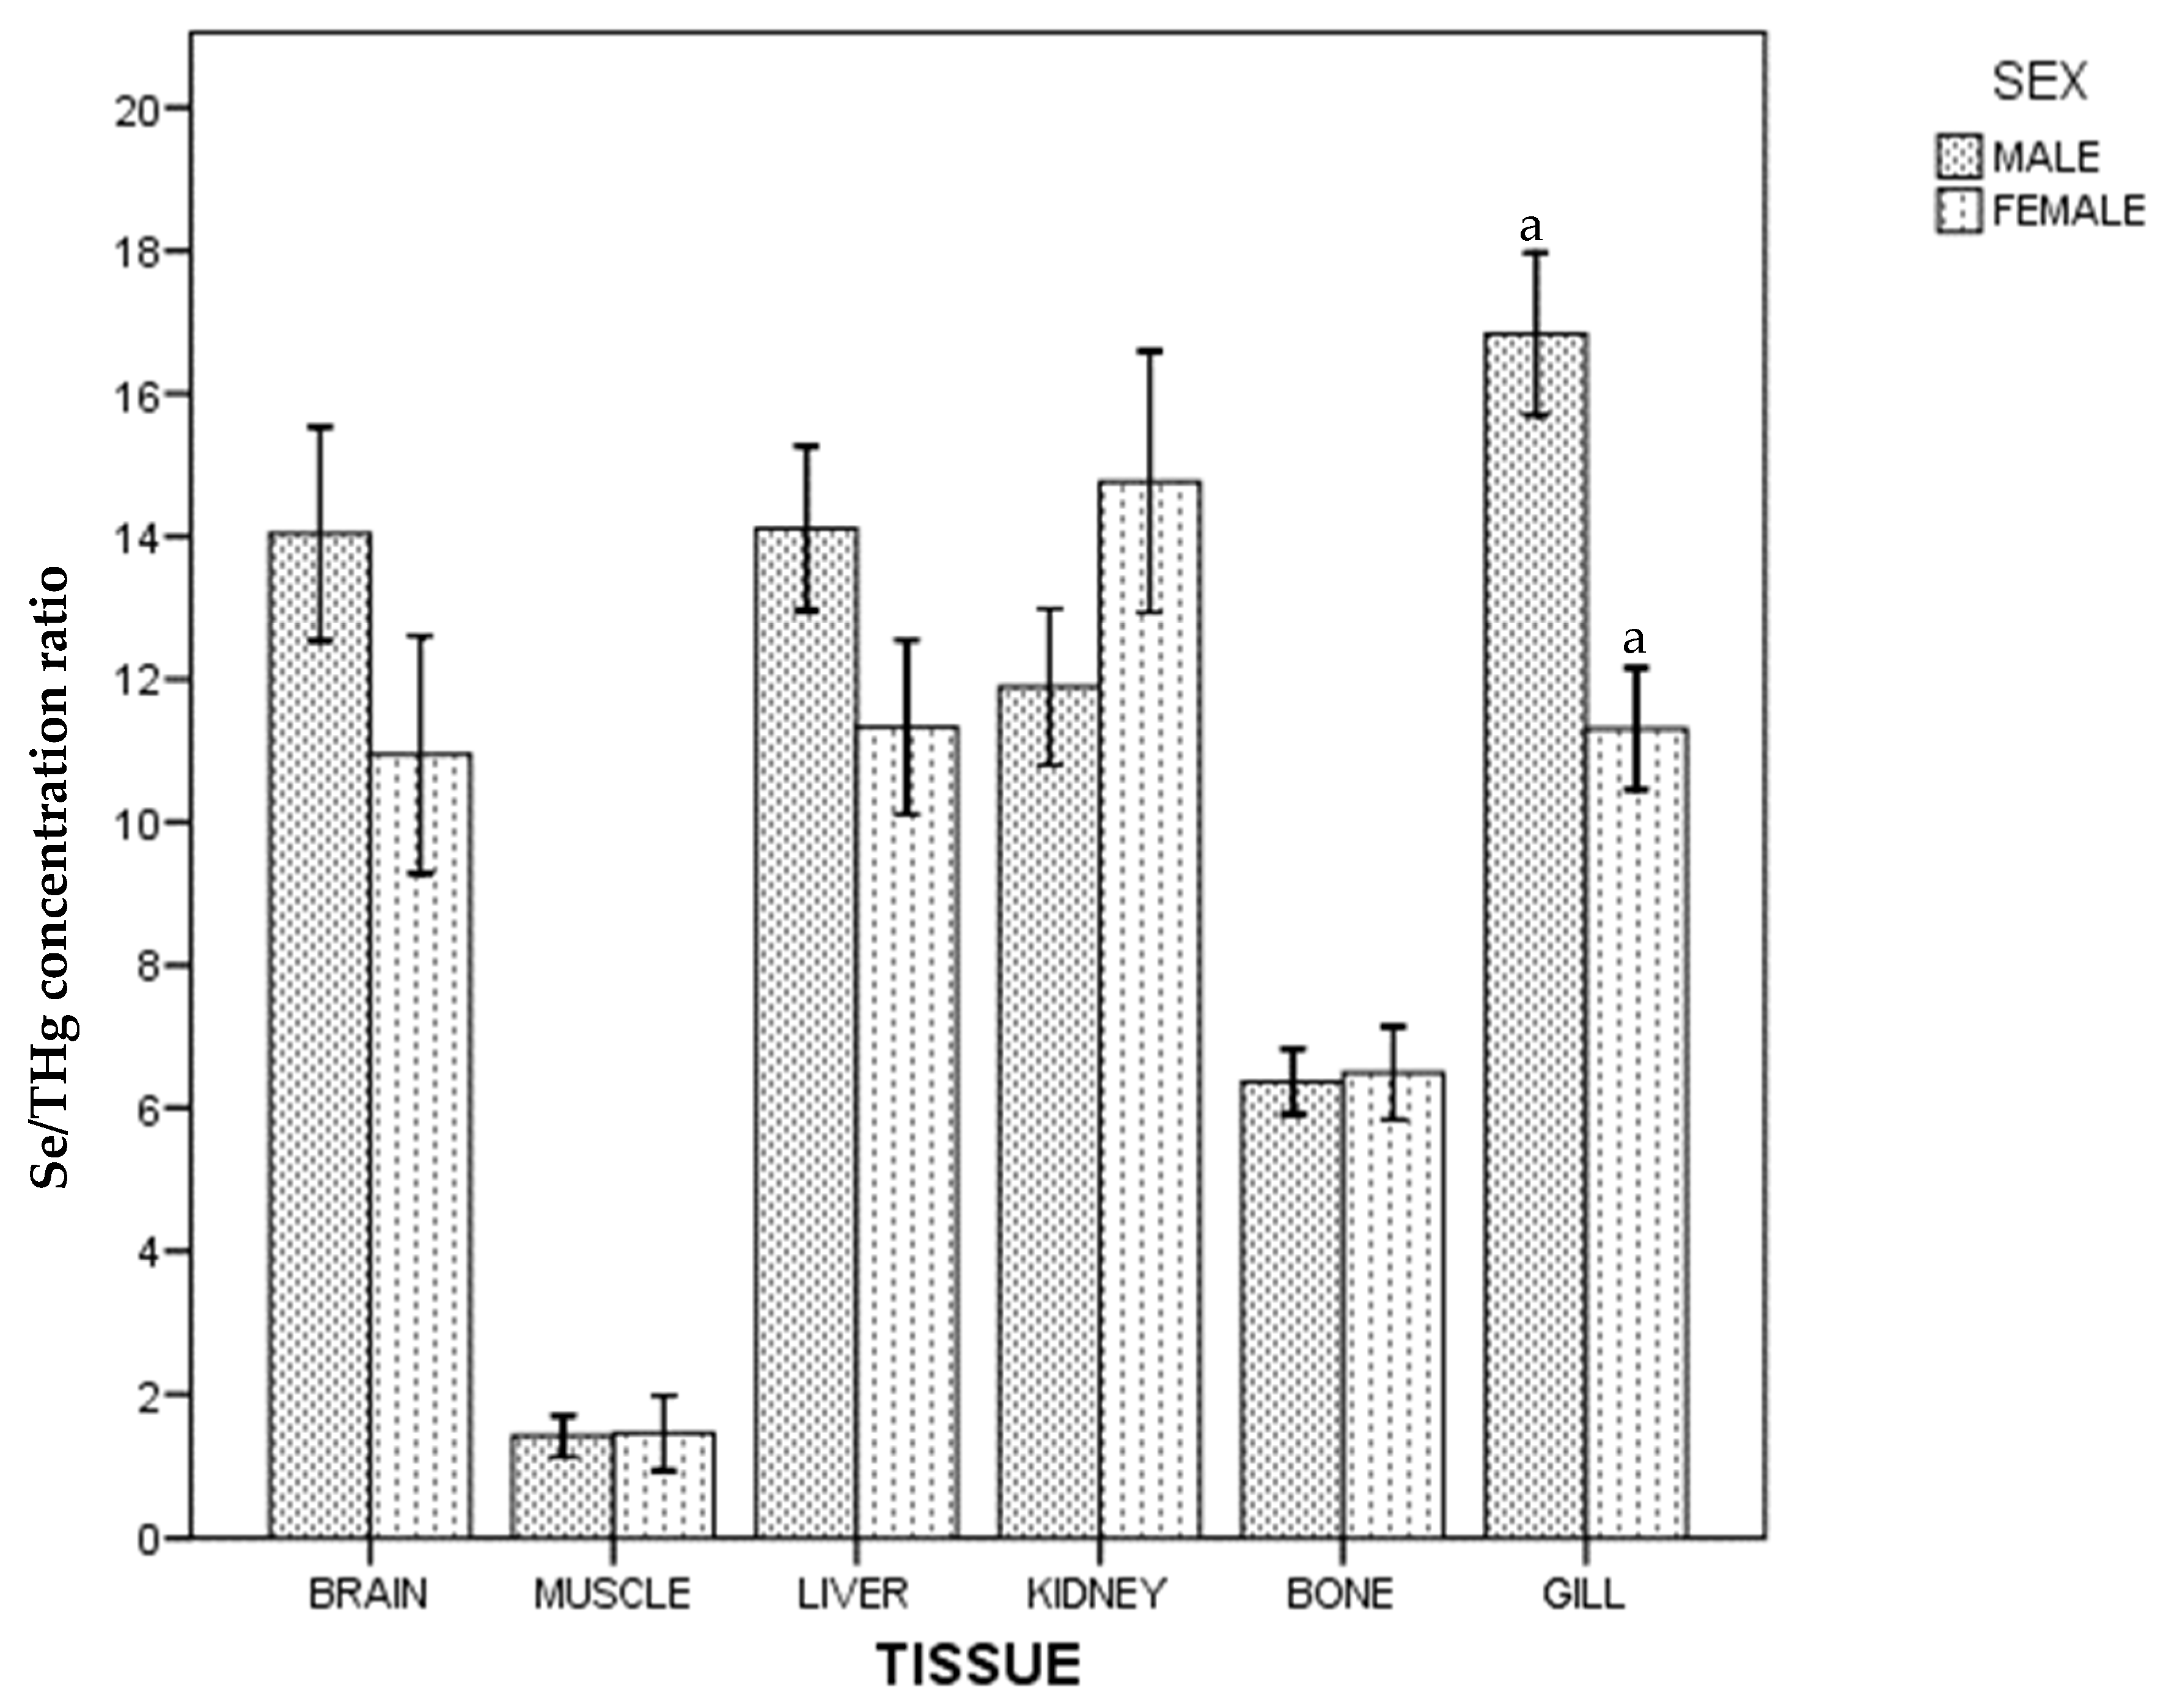
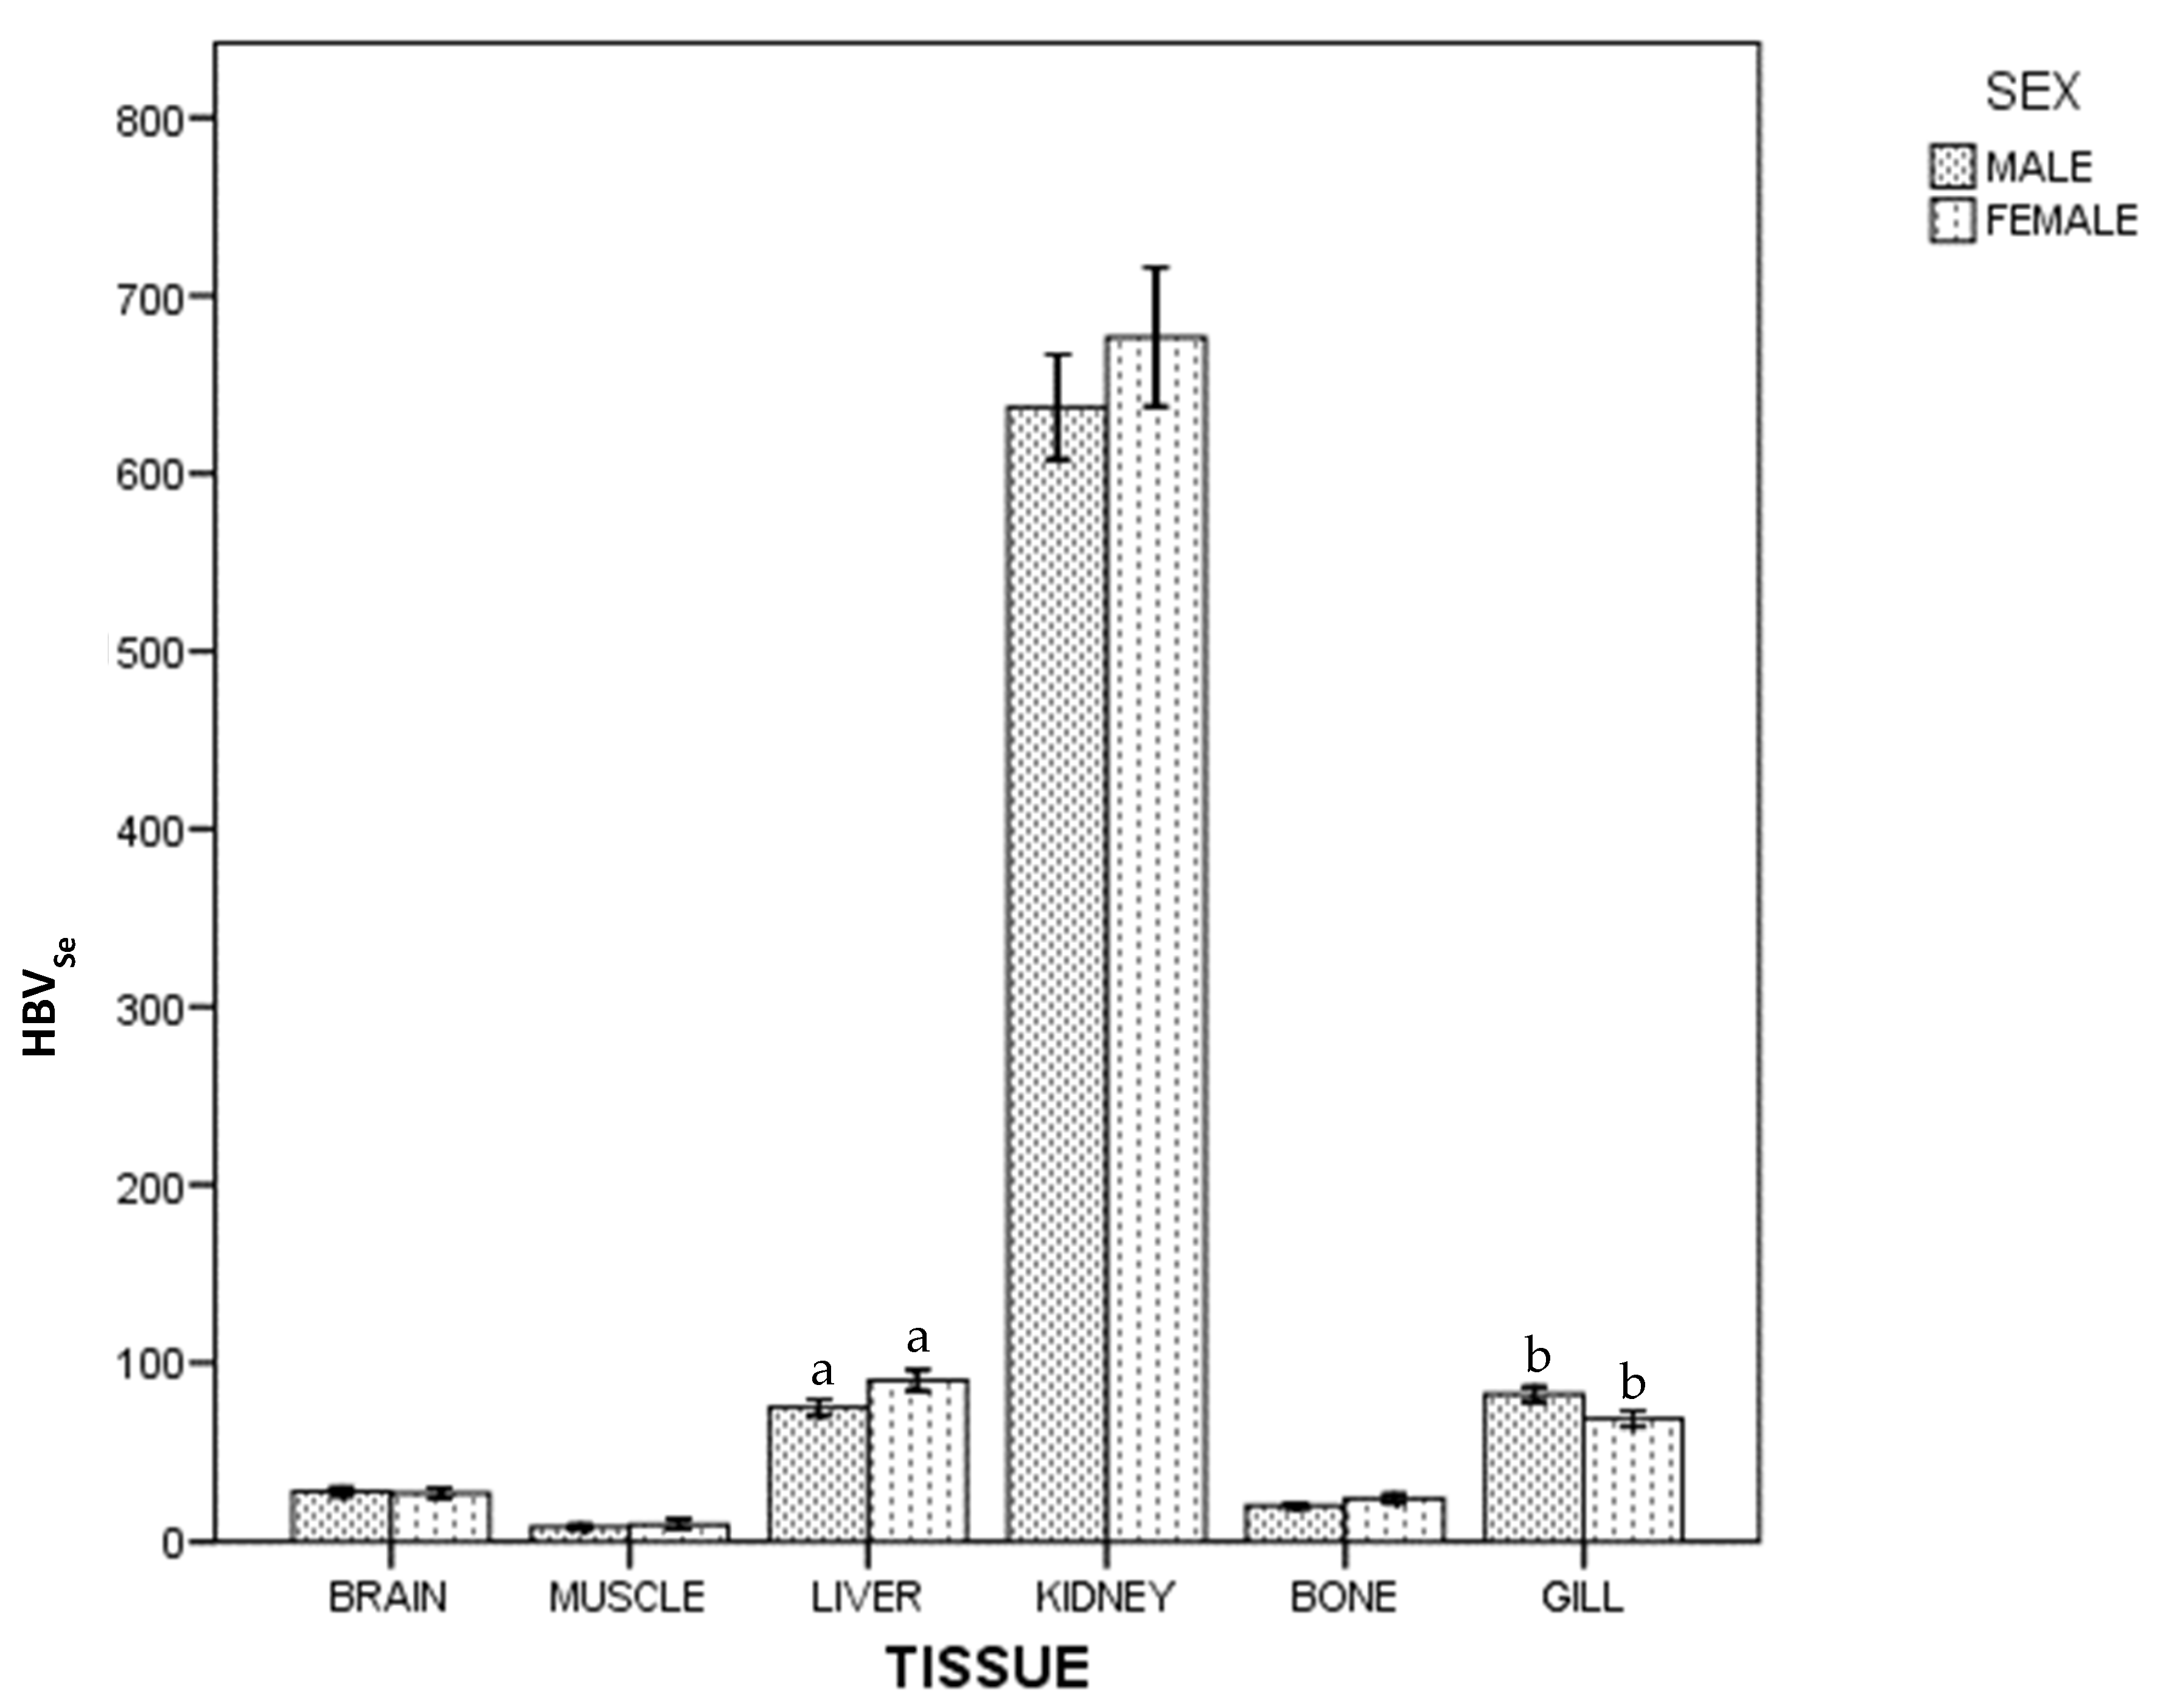
3. Results
4. Discussion
4.1. Kidney
4.2. Gills
4.3. Muscle
4.4. Liver
4.5. Brain
4.6. Bone
4.7. Mercury and Selenium by Sex
5. Conclusions
Author Contributions
Funding
Institutional Review Board Statement
Informed Consent Statement
Data Availability Statement
Acknowledgments
Conflicts of Interest
References
- Halpern, B.S.; Walbridge, S.; Selkoe, K.A.; Kappel, C.V.; Micheli, F.; D’Agrosa, C.; Bruno, J.F.; Casey, K.S.; Ebert, C.; Fox, H.E.; et al. A global map of human impact on marine ecosystems. Science 2008, 319, 948–952. [Google Scholar] [CrossRef] [PubMed] [Green Version]
- Serrano, O.; Mateo, M.A.; Dueñas-Bohórquez, A.; Renom, P.; López-Sáez, J.A.; Martínez Cortizas, A. The posidonia oceanica marine sedimentary record: A holocene archive of heavy metal pollution. Sci. Total Environ. 2011, 409, 4831–4840. [Google Scholar] [CrossRef]
- Li, H.; Gao, X.; Gu, Y.; Wang, R.; Xie, P.; Liang, M.; Ming, H.; Su, J. Comprehensive large-scale investigation and assessment of trace metal in the coastal sediments of Bohai Sea. Mar. Pollut. Bull. 2018, 129, 126–134. [Google Scholar] [CrossRef]
- Tarnawski, M.; Baran, A. Use of chemical indicators and bioassays in bottom sediment ecological risk assessment. Arch. Environ. Contam. Toxicol. 2018, 74, 395–407. [Google Scholar] [CrossRef] [PubMed] [Green Version]
- Communication from the Commission to the Council and the European Parliament. Community Strategy Concerning Mercury SEC (2005) 10OM/2005/0020 final. Available online: https://eur-lex.europa.eu/legal-content/EN/TXT/PDF/?uri=CELEX:52005DC0020&from=EN (accessed on 28 October 2021).
- ATSDR. ATSDR’s Substance Priority List. Available online: https://www.atsdr.cdc.gov/spl/index.html#2019spl (accessed on 28 October 2021).
- Decision Nº 2455/2001/EC of the European Parliament and of the Council of 20 November 2001 establishing the list of priority substances in the field of water policy and amending Directive 2000/60/EC. Off. J. Eur. Union 2001, L331, 1–5.
- Directive 2013/39/EU of the European Parliament and of the Council of 12 August 2013 amending Directives 2000/60/EC and 2008/105/EC as regards priority substances in the field of water policy. Off. J. Eur. Union 2001, L226, 1–17.
- U.S.E.P.A. United States Environmental Protection Agency, List of Priority Pollutants. Available online: http://water.epa.gov/scitech/methods/cwa/pollutants.cfm (accessed on 28 October 2021).
- UNEP. Minamata Convention on Mercury. Available online: www.mercuryconvention.org (accessed on 28 October 2021).
- de Almeida Rodrigues, P.; Ferrari, R.G.; Dos Santos, L.N.; Conte Junior, C.A. Mercury in aquatic fauna contamination: A systematic review on its dynamics and potential health risks. J. Environ. Sci. 2019, 84, 205–218. [Google Scholar] [CrossRef]
- Bellanger, M.; Pichery, C.; Aerts, D.; Berglund, M.; Castaño, A.; Cejchanová, M.; Crettaz, P.; Davidson, F.; Esteban, M.; Fischer, M.E.; et al. Economic benefits of methylmercury exposure control in Europe: Monetary value of neurotoxicity prevention. Environ. Health 2013, 12, 3. [Google Scholar] [CrossRef] [PubMed] [Green Version]
- Grandjean, P.; Bellanger, M. Calculation of the disease burden associated with environmental chemical exposures: Application of toxicological information in health economic estimation. Environ. Health 2017, 16, 123. [Google Scholar] [CrossRef] [PubMed] [Green Version]
- Cinnirella, S.; Bruno, D.E.; Pirrone, N.; Horvat, M.; Živković, I.; Evers, D.C.; Johnson, S.; Sunderland, E.M. Mercury concentrations in biota in the Mediterranean Sea, a compilation of 40 years of surveys. Sci. Data 2019, 6, 205. [Google Scholar] [CrossRef] [Green Version]
- Ogrinc, N.; Hintelmann, H.; Kotnik, J.; Horvat, M.; Pirrone, N. Sources of mercury in deep-sea sediments of the Mediterranean Sea as revealed by mercury stable isotopes. Sci. Rep. 2019, 9, 11626. [Google Scholar] [CrossRef] [PubMed] [Green Version]
- Bernhard, M.; Renzoni, A. Mercury concentration in Mediterranean marine organisms and their environment: Natural and anthropogenic origin. Thalassia Jugosl. 1977, 13, 265. [Google Scholar]
- Bacci, E. Mercury in the Mediterranean. Mar. Pollut. Bull. 1989, 20, 59–63. [Google Scholar] [CrossRef]
- Lahaye, V.; Bustamante, P.; Dabin, W.; Van Canneyt, O.; Dhermain, F.; Cesarini, C.; Pierce, G.J.; Caurant, F. New insights from age determination on toxic element accumulation in striped and bottlenose dolphins from Atlantic and Mediterranean waters. Mar. Pollut. Bull. 2006, 52, 1219–1230. [Google Scholar] [CrossRef] [Green Version]
- Cossa, D.; Harmelin-Vivien, M.; Mellon-Duval, C.; Loizeau, V.; Averty, B.; Crochet, S.; Chou, L.; Cadiou, J.F. Influences of Bioavailability, Trophic Position, and Growth on Methylmercury in Hakes (Merluccius merluccius) from North-western Mediterranean and North-eastern Atlantic. Environ. Sci. Technol. 2012, 46, 4885–4893. [Google Scholar] [CrossRef]
- Prato, E.; Biandolino, F. The contribution of fish to the Mediterranean diet. In The Mediterranean Diet; Preedy, V.R., Watson, R.S., Eds.; Academic Press: Tucson, AZ, USA, 2015; pp. 165–174. [Google Scholar]
- Schartup, A.T.; Thackray, C.P.; Qureshi, A.; Dassuncao, C.; Gillespie, K.; Hanke, A. Sunderland EM. Climate change and overfishing increase neurotoxicant in marine predators. Nature 2019, 572, 648–650. [Google Scholar] [CrossRef]
- EFSA Panel on Contaminants in the Food Chain (CONTAM). Scientific Opinion on the risk for public health related to the presence of mercury and methylmercury in food. EFSA J. 2012, 10, 2985. [Google Scholar]
- EFSA NDA Panel (EFSA Panel on Dietetic Products, Nutrition and Allergies). Scientific Opinion on health benefits of seafood (fish and shellfish) consumption in relation to health risks associated with exposure to methylmercury. EFSA J. 2014, 12, 3761. [Google Scholar] [CrossRef] [Green Version]
- EFSA Scientific Committee. Statement on the benefits of fish/seafood consumption compared to the risks of methylmercury in fish/seafood. EFSA J. 2015, 13, 3982. [Google Scholar] [CrossRef] [Green Version]
- Commission Regulation (EC) N 629/2008 of 2 July 2008 amending Regulation (EC) No 1881/2006 setting maximum levels for certain contaminants in foodstuffs. Off. J. Eur. Union 2008, L173, 6–9.
- Ha, E.; Basu, N.; Bose-O’Reilly, S.; Dórea, J.G.; McSorley, E.; Sakamoto, M.; Chan, H.M. Current progress on understanding the impact of mercury on human health. Environ. Res. 2017, 152, 419–433. [Google Scholar] [CrossRef] [PubMed] [Green Version]
- Ferreira-Rodríguez, N.; Castro, A.J.; Tweedy, B.N.; Quintas-Soriano, C.; Vaughn, C.C. Mercury consumption and human health: Linking pollution and social risk perception in the southeastern United States. J. Environ. Manage. 2021, 282, 111528. [Google Scholar] [CrossRef] [PubMed]
- Zheng, N.; Wang, S.; Dong, W.; Hua, X.; Li, Y.; Song, X.; Chu, Q.; Hou, S.; Li, Y. The Toxicological Effects of Mercury Exposure in Marine Fish. Bull. Environ. Contam. Toxicol. 2019, 102, 714–720. [Google Scholar] [CrossRef] [PubMed]
- Licata, P.; Trombetta, D.; Cristani, M.; Naccari, C.; Martino, D.; Calò, M.; Naccari, F. Heavy metals in liver and muscle of bluefin tuna (Thunnus thynnus) caught in the Straits of Messina (Sicily, Italy). Environ. Monit. Assess. 2005, 107, 239–248. [Google Scholar] [CrossRef] [PubMed]
- Garrido Gamarro, E.; Orawattanamateekul, W.; Sentina, J.; Srinivasa Gopal, T.K. By-Products of Tuna Processing. In Globefish Research Programme; FAO: Rome, Italy, 2013; Volume 112, pp. 1–48. [Google Scholar]
- Hosch, G. Design options for the development of tuna catch documentation schemes. In FAO Fisheries and Aquaculture Technical Paper; FAO: Rome, Italy, 2016; Volume 596, pp. 1–144. [Google Scholar]
- Storelli, M.M.; Giacominelli-Stuffler, R.; Storelli, A.; Marcotrigiano, G.O. Accumulation of mercury, cadmium, lead and arsenic in swordfish and bluefin tuna from the Mediterranean Sea: A comparative study. Mar. Pollut. Bull. 2005, 50, 1004–1007. [Google Scholar] [CrossRef]
- Hernández-Hernández, F.; Medina, J.; Nsuategui, J.; Conesa, M. Heavy metal concentrations in some marine organisms from the Mediterranean Sea (Castellón, Spain): Metal accumulation in different tissues. Sci. Mar. 1990, 54, 113–129. [Google Scholar]
- Srebocan, E.; Pompe-Gotal, J.; Prevendar-Crnic, A.; Ofner, E. Mercury concentrations in captive Atlantic bluefin tuna (Thunnus thynnus) farmed in the Adriatic Sea. Vet. Med. 2007, 52, 175–177. [Google Scholar] [CrossRef] [Green Version]
- Ralston, N.V.C.; Kaneko, J.J.; Raymond, L.J. Selenium health benefit values provide a reliable index of seafood benefits vs. risks. J. Trace Elem. Med. Biol. 2019, 55, 50–57. [Google Scholar] [CrossRef]
- Khan, K.U.; Zuberi, A.; Fernandes, J.B.K.; Ullah, I.; Sarwar, H. An overview of the ongoing insights in selenium research and its role in fish nutrition and fish health. Fish Physiol. Biochem. 2017, 43, 1689–1705. [Google Scholar] [CrossRef]
- Sarangi, G.K.; Romagné, F.; Castellano, S. Distinct patterns of selection in selenium-dependent genes between land and aquatic vertebrates. Mol. Biol. Evol. 2018, 35, 1744–1756. [Google Scholar] [CrossRef]
- Olmedo, P.; Hernández, A.F.; Pla, A.; Femia, P.; Navas-Acien, A.; Gil, F. Determination of essential elements (copper, manganese, selenium and zinc) in fish and shellfish samples. Risk and nutritional assessment and mercury–selenium balance. Food Chem. Toxicol. 2013, 62, 299–307. [Google Scholar]
- Ralston, N.V.C.; Ralston, C.R.; Raymond, L.J. Selenium health benefit values: Updated criteria for mercury risk assessments. Biol. Trace Elem. Res. 2016, 171, 262–269. [Google Scholar] [CrossRef] [Green Version]
- Cort, J.L. Age and growth of the bluefin tuna, Thunnus thynnus (L.) of the Northwest Atlantic. ICCAT Coll. Vol. Sci. Pap. 1991, 35, 213–230. [Google Scholar]
- Costley, C.T.; Mossop, K.F.; Dean, J.R.; Garden, L.M.; Marshall, J.; Carrol, J. Determination of mercury in environmental and biological samples using pyrolysis atomic absorption spectrometry with gold amalgamation. Anal. Chim. Acta 2000, 405, 179–183. [Google Scholar] [CrossRef]
- Melgar, M.J.; Núñez, R.; García, M.A. Selenium intake from tuna in Galicia (Spain): Health risk assessment and protective role against exposure to mercury and inorganic arsenic. Sci. Total Environ. 2019, 694, 133716. [Google Scholar] [CrossRef]
- Storelli, M.M.; Marcotrigiano, G.O. Total mercury levels in muscle tissue of swordfish (Xiphias gladius) and bluefin tuna (Thunnus thynnus) from the Mediterranean Sea (Italy). J. Food Prot. 2001, 64, 1058–1061. [Google Scholar] [CrossRef]
- Storelli, M.M.; Giacominelli Stuffler, R.; Marcotrigiano, G.O. Total and methylmercury residues in tuna-fish from the Mediterranean Sea. Food Addit. Contam. 2002, 19, 715–720. [Google Scholar] [CrossRef] [PubMed]
- Özden, Ö.; Erkan, N.; Kaplan, M.; Karakulak, F.S. Toxic metals and omega 3 fatty acids of bluefin tuna from aquaculture: Health risk and benefits. Expos. Health 2018, 12, 9–18. [Google Scholar] [CrossRef]
- Kaneko, J.J.; Ralston, N.V.C. Selenium and mercury in pelagic fish in the central north Pacific near Hawaii. Biol. Trace Elem. Res. 2007, 119, 242–254. [Google Scholar] [CrossRef]
- Ruelas-Inzunza, J.; Šlejkovec, Z.; Mazej, D.; Fajon, V.; Horvat, M.; Ramos-Osuna, M. Bioaccumulation of As, Hg, and Se in tunas Thunnus albacares and Katsuwonus pelamis from the Eastern Pacific: Tissue distribution and As speciation. Environ. Sci. Pollut. Res. 2018, 25, 19499–19509. [Google Scholar] [CrossRef]
- Annibaldi, A.; Truzzi, C.; Carnevali, O.; Pignalosa, P.; Api, M.; Scarponi, G.; Illuminati, S. Determination of Hg in farmed and wild Atlantic bluefin tuna (Thunnus thynnus L.) muscle. Molecules 2019, 24, 1273. [Google Scholar] [CrossRef] [PubMed] [Green Version]
- Di Bella, G.; Potortì, A.G.; Lo Turco, V.; Bua, D.; Licata, P.; Cicero, N.; Dugo, G. Trace Elements in Thunnus thynnus from Mediterranean Sea and benefit–risk assessment for consumers. Food Addit. Contam. Part B Surveill. 2015, 8, 175–181. [Google Scholar] [CrossRef]
- Milatou, N.; Dassenakis, M.; Megalofonou, P. Do fattening process and biological parameters affect the accumulation of metals in Atlantic Bluefin Tuna? Food Addit. Contam. Part A Chem. Anal. Control. Expo. Risk Assess. 2015, 32, 1129–1139. [Google Scholar] [CrossRef] [PubMed]
- Storelli, M.M.; Barone, G.; Cuttone, G.; Giungato, D.; Garofalo, R. Occurrence of toxic metals (Hg, Cd and Pb) in fresh and canned tuna: Public health implications. Food Chem. Toxicol. 2010, 48, 3167–3170. [Google Scholar] [CrossRef]
- Renzi, M.; Cau, A.; Bianchi, N.; Focardi, S.E. Levels of mercury and polychlorobiphenyls in bluefin tuna from the Western Mediterranean Sea: A food safety issue? J. Environ. Prot. 2014, 5, 106–113. [Google Scholar] [CrossRef] [Green Version]
- Berntssen, M.; Hylland, K.; Julshamn, K.; Lundebye, A.K.; Waagbø, R. Maximum limits of organic and inorganic mercury in fish feed. Aquac. Nutr. 2004, 10, 83–97. [Google Scholar] [CrossRef]
- Sandheinrich, M.; Wiener, J. Methylmercury in freshwater fish: Recent advances in assessing toxicity of environmentally relevant exposures. Environ. Contam. Biota Interpret. Tissue Conc. 2011, 2, 169–190. [Google Scholar]
- Jaffar, M.; Ashraf, M. Selected trace metal concentrations in different tissues of fish from coastal waters of Pakistan (Arabian Sea). Indian, J. Mar. Sci. 1988, 17, 231–234. [Google Scholar]
- Martin, J.H.; Knauer, G.A. The elemental composition of plankton. Geochim. Cosmochim. Acta 1973, 37, 1639–1653. [Google Scholar] [CrossRef]
- Koffi, K.M.; Saki, S.J.; Kouadio, A.I.; Atse, B.C.; Biego, G.H.M. Accumulation of cadmium, lead, and mercury in different organs of three tuna fish species from coastal zone of Cote d’Ivoire. Int. J. Agric. Innov. Res. 2014, 3, 1473–2319. [Google Scholar]
- Kojadinovic, J.; Potier, M.; Le Corre, M.; Cosson, R.P.; Bustamante, P. Bioaccumulation of trace elements in pelagic fish from the Western Indian Ocean. Environ. Pollut. 2007, 146, 548–566. [Google Scholar] [CrossRef] [Green Version]
- Burger, J.; Jeitner, C.; Donio, M.; Pittfield, T.; Gochfeld, M. Mercury and selenium levels, and selenium:mercury molar ratios of brain, muscle and other tissues in bluefish (Pomatomus saltatrix) from New Jersey, USA. Sci. Total Environ. 2013, 15, 278–286. [Google Scholar] [CrossRef] [PubMed] [Green Version]
- Raihan, S.M.; Moniruzzaman, M.; Park, Y.; Lee, S.; Bai, S.C. Evaluation of dietary organic and inorganic mercury threshold levels on induced mercury toxicity in a marine fish model. Animals 2020, 10, 405. [Google Scholar] [CrossRef] [Green Version]
- Cizdziel, J.; Hinners, T.; Cross, C.; Pollard, J. Distribution of mercury in the tissues of five species of freshwater fish from Lake Mead, U.S.A. J. Environ. Monit. 2003, 5, 802–807. [Google Scholar] [CrossRef]
- Hogstrand, C.; Haux, C. A radioimmunoassay for perch (Perca fluviatilis) metalothionein. Toxicol. Appl. Pharmacol. 1990, 102, 56. [Google Scholar] [CrossRef]
- Ajsuvakova, O.P.; Alexey, A.; Tinkov, M.; Aschner, J.; Rocha, B.T.; Michalke, B.; Skalnaya, M.G.; Skalny, A.N.; Butnariu, M.; Dadar, M.; et al. Sulfhydryl groups as targets of mercury toxicity. Coord. Chem. Rev. 2020, 417, 213343. [Google Scholar] [CrossRef] [PubMed]
- Bradley, M.A.; Barst, B.D.; Basu, N. A review of mercury bioavailability in humans and fish. Int. J. Environ. Res. Public Health 2017, 14, 169. [Google Scholar] [CrossRef] [PubMed] [Green Version]
- Smith, J.C.; Allen, P.V.; Turner, M.D.; Most, B.; Fisher, H.L.; Hall, L.L. The Kinetics of Intravenously Administered Methyl Mercury in Man. Toxicol. Appl. Pharmacol. 1994, 128, 251–256. [Google Scholar] [CrossRef]
- Smith, J.C.; Farris, F.F. Methyl mercury pharmacokinetics in man: A reevaluation. Toxicol. Appl. Pharmacol. 1996, 137, 245–252. [Google Scholar] [CrossRef]
- Mieiro, C.L.; Bervoets, L.; Joosen, S.; Blust, R.; Duarte, A.C.; Pereira, M.E.; Pacheco, M. Metallothioneins failed to reflect mercury external levels of exposure and bioaccumulation in marine fish–Considerations on tissue and species specific responses. Chemosphere 2011, 85, 114–121. [Google Scholar] [CrossRef]
- Spiller, H.A. Rethinking mercury: The role of selenium in the pathophysiology of mercury toxicity. Clin. Toxicol. 2017, 10, 1–14. [Google Scholar] [CrossRef] [PubMed]
- Acosta-Lizárraga, L.G.; Bergés-Tiznado, M.E.; Bojórquez-Sánchez, C.; Osuna-Martínez, C.C.; Páez-Osuna, F. Bioaccumulation of mercury and selenium in tissues of the mesopelagic fish Pacific hake (Merluccius productus) from the northern Gulf of California and the risk assessment on human health. Chemosphere 2020, 255, 126941. [Google Scholar] [CrossRef] [PubMed]
- Torres, J.; Eira, C.; Miquel, J.; Ferrer-Maza, D.; Delgado, E.; Casadevall, M. Effect of intestinal tapeworm Clestovothrium crassiceps on concentrations of toxic elements and selenium in European hake Merluccius merluccius from the Gulf of lion (northwestern Mediterranean Sea). J. Agric. Food Chem. 2015, 63, 9349–9356. [Google Scholar] [CrossRef] [PubMed]
- Monteiro, D.A.; Rantin, F.T.; Kalinin, A.L. Inorganic mercury exposure: Toxicological effects, oxidative stress biomarkers and bioaccumulation in the tropical freshwater fish matrinxã, Brycon amazonicus (Spix and Agassiz, 1829). Ecotoxicology 2010, 19, 105–123. [Google Scholar] [CrossRef] [PubMed]
- Xu, Q.; Zhao, L.; Wang, Y.; Xie, Q.; Yin, D.; Feng, X.; Wang, D. Bioaccumulation characteristics of mercury in fish in the Three Gorges Reservoir, China. Environ. Pollut. 2018, 243, 115–126. [Google Scholar] [CrossRef]
- Nakao, M.; Seoka, M.; Tsukamasa, Y.; Kawasaki, K.I.; Ando, M. Possibility for decreasing of mercury content in bluefin tuna Thunnus orientalis by fish culture. Fish Sci. 2007, 73, 724–731. [Google Scholar] [CrossRef]
- Burger, J.; Gochfeld, M.; Shukla, T.; Jeitner, C.; Burke, S.; Donio, M.; Shukla, S.; Snigaroff, R.; Snigaroff, D.; Stamm, T.; et al. Heavy metals in Pacific cod (Gadus macrocephalus) from the Aleutians: Location, age, size, and risk. J. Toxicol. Environ. Health 2007, 70, 1897–1911. [Google Scholar] [CrossRef]
- Wang, X.; Wang, W.X. Selenium induces the demethylation of mercury in marine fish. Environ. Pollut. 2017, 231, 1543–1551. [Google Scholar] [PubMed]
- Burger, J.; Gochfeld, M. Heavy metals in commercial fish in New Jersey. Environ. Res. 2005, 99, 403–412. [Google Scholar] [CrossRef]
- Yamashita, Y.; Amlund, H.; Suzuki, T.; Hara, T.; Hossain, A.M.; Yabu, T.; Touhata, K.; Yamashita, M. Selenoneine, total selenium, and total mercury content in the muscle of fishes. Fish. Sci. 2011, 77, 679–686. [Google Scholar] [CrossRef]
- Yamashita, Y.; Yamashita, M.; Lida, H. Selenium content in seafood in Japan. Nutrients 2013, 5, 388–395. [Google Scholar] [CrossRef] [Green Version]
- Burger, J.; Gochfeld, M. Selenium and mercury molar ratios in commercial fish from New Jersey and Illinois: Variation within species and relevance to risk communication. Food Chem. Toxicol. 2013, 57, 235–245. [Google Scholar] [CrossRef] [PubMed] [Green Version]
- Bjørklund, B.; Aaseth, J.; Ajsuvakovad, O.P.; Nikonorove, A.A.; Skalny, A.V.; Skalnay, M.G.; Tinkov, A.A. Molecular interaction between mercury and selenium in neurotoxicity. Coord. Chem. Rev. 2017, 332, 30–37. [Google Scholar] [CrossRef]
- Ralston, N.V.C. Effects of soft electrophiles on selenium physiology. Free Radic. Biol. Med. 2018, 127, 134–144. [Google Scholar] [CrossRef] [PubMed]
- Ralston, N.V.C.; Raymond, L.J. Mercury’s neurotoxicity is characterized by its disruption of selenium biochemistry. Biochim. Biophys. Acta Gen. Subj. 2018, 1862, 2405–2416. [Google Scholar] [CrossRef]
- Ordiano-Flores, A.; Rosíles-Martínez, R.; Galván-Magaña, F. Biomagnification of mercury and its antagonistic interaction with selenium in yellowfin tuna Thunnus albacares in the trophic web of Baja California Sur, Mexico. Ecotoxicol. Environ. Saf. 2012, 86, 182–187. [Google Scholar] [CrossRef] [PubMed]
- Grgec, A.S.; Kljaković-Gašpić, Z.; Orct, T.; Tičina, V.; Sekovanić, A.; Jurasović, J.; Piasek, M. Mercury and selenium in fish from the eastern part of the Adriatic Sea: A risk-benefit assessment in vulnerable population groups. Chemosphere 2020, 261, 127742. [Google Scholar] [CrossRef]
- Torres, P.; Rodrigues, A.; Soares, L.; Garcia, P. Metal concentrations in two commercial tuna species from an active volcanic region in the Mid-Atlantic Ocean. Arch. Environ. Contam. Toxicol. 2016, 70, 341–347. [Google Scholar] [CrossRef]
- Tallandini, L.; Cecchi, R.; De Boni, S.; Galassini, S.; Ghermandi, G.; Gialanella, G.; Liu, N.; Moro, R.; Turchetto, M.; Zhang, Y. Toxic levels of selenium in enzymes and selenium uptake in tissues of a marine fish. Biol. Trace Elem. Res. 1996, 51, 97–106. [Google Scholar] [CrossRef]
- Anonymous. The EU Trade Deficit for Fisheries and Aquaculture Products Continues to Rise. 2020. Available online: https://www.eumofa.eu/es/the-eu-fish-market-2020-edition-is-now-online (accessed on 28 October 2021).
- Commission Regulation (EU) 2019/1869 of 7 November 2019 amending and correcting Annex I to Directive 2002/32/EC of the European Parliament and of the Council as regards maximum levels for certain undesirable substances in animal feed. Off. J. Eur. Union 2019, L289, 32–36.
- Yang, L.; Zhang, Y.; Wang, F.; Luo, Z.; Guo, S.; Strähle, U. Toxicity of mercury: Molecular evidence. Chemosphere 2020, 245, 125586. [Google Scholar] [CrossRef] [PubMed]
- Risher, J.F. Elemental Mercury and Inorganic Mercury Compounds: Human Health Aspects. Concise International Chemical Assessment Document 50; World Health Organization: Geneva, Switzerland, 2003. [Google Scholar]
- Kern, J.K.; Geier, D.A.; Sykes, L.K.; Haley, B.E.; Geier, M.R. The relationship between mercury and autism: A comprehensive review and discussion. J. Trace Elem. Med. Biol. 2016, 37, 8–24. [Google Scholar] [CrossRef] [PubMed] [Green Version]
- Siblerud, R.; Mutter, J.; Moore, E.; Naumann, J.; Walach, H. A hypothesis and evidence that mercury may be an etiological factor in Alzheimer’s disease. Int. J. Environ. Res. Public Health 2019, 16, 5152. [Google Scholar] [CrossRef] [Green Version]
- Morcillo, P.; Esteban, M.A.; Cuesta, A. Mercury and its toxic effects on fish. AIMS Environ. Sci. 2017, 4, 386–402. [Google Scholar] [CrossRef]
- Mieiro, C.L.; Pereira, M.E.; Duarte, A.C.; Pacheco, M. Brain as a critical target of mercury in environmentally exposed fish (Dicentrarchus labrax)-Bioaccumulation and oxidative stress profiles. Aquat. Toxicol. 2011, 103, 233–240. [Google Scholar] [CrossRef]
- Farina, M.; Avila, D.S.; Da Rocha, J.B.T.; Aschner, M. Metals, oxidative stress and neurodegeneration: A focus on iron, manganese and mercury. Neurochem. Int. 2013, 62, 575–594. [Google Scholar] [CrossRef] [Green Version]
- Pereira, P.; Puga, S.; Cardoso, V.; Pinto-Ribeiro, F.; Raimundo, J.; Barata, M.; Pousão-Ferreira, P.; Pacheco, M.; Almeida, A. Inorganic mercury accumulation in brain following waterborne exposure elicits a deficit on the number of brain cells and impairs swimming behavior in fish (white seabream—Diplodus sargus). Aquat. Toxicol. 2016, 170, 400–412. [Google Scholar] [CrossRef]
- Cardoso, T.P.; Mársico, E.T.; Medeiros, R.J.; Tortelly, R.; Sobreiro, L.G. Mercury level and histopathologic analysis of muscle, kidney and brain of largehead hairtail (Trichiurus lepturus) collected in Itaipu beach-Niterói, Rio de Janeiro, Brazil. Cienc. Rural 2009, 39, 540–546. [Google Scholar] [CrossRef]
- Núnez-Nogueira, G. Concentration of essential and non-essential metals in two shark species commonly caught in Mexican (Gulf of Mexico) coastline. In Contaminación e Impacto Ambiental: Diagnóstico y Tendencias, 2nd ed.; Botello, A.V., Rendón-von Osten, J., Gold-Bouchot, G., Agraz-Hernandéz, C., Eds.; Instituto Nacional de Ecología Univ. Autón. de Campeche, Univ.: Campeche, México; Nal. Autón. de México: Tlacopac, Mexico, 2005; Volume 26, pp. 451–474. [Google Scholar]
- Vahter, M.E.; Mottet, N.K.; Friberg, L.T.; Lind, S.B.; Charleston, J.S.; Burbacher, T.M. Demethylation of methyl mercury in different brain sites of Macaca fascicularis monkeys during long-term subclinical methyl mercury exposure. Toxicol. Appl. Pharmacol. 1995, 134, 273–284. [Google Scholar] [CrossRef]
- Allen, J.W.; Shanker, G.; Tan, K.H.; Aschner, M. The consequences of methylmercury exposure on interactive functions between astrocytes and neurons. Neurotoxicology 2002, 23, 755–759. [Google Scholar] [CrossRef]
- Wang, X.; Wu, F.; Wang, W.X. In vivo mercury demethylation in a marine fish (Acanthopagrus schlegeli). Environ. Sci. Technol. 2017, 51, 6441–6451. [Google Scholar] [CrossRef] [PubMed]
- Shalini, R.; Jeyasekaran, G.; Shakila, R.J.; Arisekar, U. Trace element concentrations in the organs of fish along the southeast coast of India. Mar. Pollut. Bull. 2021, 162, 111817. [Google Scholar] [CrossRef]
- Ugarte, A.; Abrego, Z.; Unceta, N.; Goicolea, M.A.; Barrio, R.J. Evaluation of the bioaccumulation of trace elements in tuna species by correlation analysis between their concentrations in muscle and first dorsal spine using microwave-assisted digestion and ICP-MS. Intern. J. Environ. Anal. Chem. 2012, 92, 1761–1775. [Google Scholar] [CrossRef]
- Perugini, M.; Visciano, P.; Manera, M.; Zaccaroni, A.; Vincenzo, O.; Amorena, M. Heavy metal (As, Cd, Hg, Pb, Cu, Zn, Se) concentrations in muscle and bone of four commercial fish caught in the central Adriatic Sea, Italy. Environ. Monit. Assess. 2014, 186, 2205–2213. [Google Scholar] [CrossRef]
- Wang, X.; Wang, W.X. Physiologically based pharmacokinetic model for inorganic and methylmercury in a marine fish. Environ. Sci. Technol. 2015, 49, 10173–10181. [Google Scholar] [CrossRef] [PubMed]
- Bastos, W.R.; Dórea, J.G.; Bernardi, J.V.E.; Manzatto, A.G.; Mussy, M.H.; Lauthartte, L.C.; Lacerda, L.D.; Malm, O. Sex-related mercury bioaccumulation in fish from the Madeira River, Amazon. Environ. Res. 2016, 144, 73–80. [Google Scholar] [CrossRef]
- Madenjian, C.P.; Chipps, S.R.; Blanchfield, P.J. Time to refine mercury mass balance models for fish. FACETS 2021, 6, 272–286. [Google Scholar] [CrossRef]


| n = 43 | THg | Se | Se/THg | HBVSe |
|---|---|---|---|---|
| Brain | 0.198 ± 0.010 (0.084–0.350) | 2.188 ± 0.145 (0.802–4.609) | 12.672 ± 1.124 (2.759–32.018) | 27.664 ± 1.836 (9.975–58.349) |
| Muscle | 0.737 ± 0.040 (0.089–1.603) | 0.847 ± 0.110 (0.293–3.516) | 1.435 ± 0.274 (0.414–10.471) | 8.777 ± 1.500 (0.351–44.459) |
| Liver | 0.566 ± 0.038 (0.166–1.542) | 6.452 ± 0.298 (1.390–12.801) | 12.881 ± 0.856 (5.382–28.803) | 81.601 ± 3.770 (17.543–162.049) |
| Kidney | 4.821 ± 0.371 (1.636–11.234) | 51.776 ± 1.884 (32.910–81.000) | 13.162 ± 1.025 (5.362–39.447) | 654.663 ± 23.811 (416.305–1022.739) |
| Bone | 0.283 ± 0.013 (0.145–0.531) | 1.736 ± 0.106 (0.430–4.565) | 6.422 ± 0.379 (1.255–11.668) | 21.875 ± 1.349 (4.908–57.731) |
| Gill | 0.458 ± 0.025 (0.187–1.030) | 6.024 ± 0.250 (3.194–10.567) | 14.391 ± 0.843 (5.329–30.163) | 76.216 ± 3.170 (40.345–133.805) |
| Fork Length | Weight | Age | THg | Se | |||||||||||
|---|---|---|---|---|---|---|---|---|---|---|---|---|---|---|---|
| Whole |  |  | Whole | | | Whole | | | Whole | | | Whole | | | |
| Fork length | |||||||||||||||
| Weight | 0.827 ** | 0.692 ** | 0.850 ** | ||||||||||||
| Age | 0.369 * | 0.521 ** | |||||||||||||
| THg | 0.330 * K | 0.448 * K | −0.326 * L | ||||||||||||
| Se | 0.319 * K | 0.477 * Bo | 0.484 * K | -0.399 ** L | 0.476 * K | −0.305 * M | 0.395 ** L 0.531 ** K | 0.594 ** K | 0.531 * K 0.537 * G | ||||||
| Brain | Muscle | Liver | Kidney | Bone | Gills | |||||||||||||
|---|---|---|---|---|---|---|---|---|---|---|---|---|---|---|---|---|---|---|
| Whole | | | Whole | | | Whole | | | Whole | | | Whole | | | Whole | | | |
| Brain | ||||||||||||||||||
| Muscle | 0.355 * | 0.459 * | ||||||||||||||||
| Liver | 0.632 ** | 0.465 * | 0.571 * | 0.463 ** | 0.625 ** | |||||||||||||
| Kidney | ||||||||||||||||||
| Bone | 0.509 ** | 0.518 ** | 0.362 * | 0.433 ** | ||||||||||||||
| Gills | 0.532 ** | 0.531 ** | 0.403 ** | 0.550 * | 0.719 ** | 0.420 * | 0.816 ** | 0.403 ** | 0.665 ** | 0.371 * | 0.519 ** | |||||||
| Brain | Muscle | Liver | Kidney | Bone | Gills | |||||||||||||
|---|---|---|---|---|---|---|---|---|---|---|---|---|---|---|---|---|---|---|
| Whole | | | Whole | | | Whole | | | Whole | | | Whole | | | Whole | | | |
| Brain | ||||||||||||||||||
| Muscle | ||||||||||||||||||
| Liver | ||||||||||||||||||
| Kidney | 0.522 ** | |||||||||||||||||
| Bone | 0.447 ** | 0.564 * | 0.556 ** | |||||||||||||||
| Gills | ||||||||||||||||||
| Location | n | Origin | Weight (Kg) | Tissue | Hg | Se | Reference |
|---|---|---|---|---|---|---|---|
| South-East Malta | 40 | Farm | 238 ± 93 | Muscle | 0.61 ± 0.20 | 1.07 ± 0.86 | [48] |
| Sardinia (Italy) | 33 | Wild | 45 ± 26 | Muscle | 1.68 ± 0.58 | 0.64 ± 0.31 | |
| Ionian Sea (Greece) | 20 | Farm | 80–540 (254.9 ± 96.7) | Muscle | 0.57 ± 0.21 (0.28–1.28) | na | [50] |
| Adriatic Sea | 29 | Farm | 100–300 | Muscle | 0.899 (0.490–1.809) | na | [34] |
| 15 | Liver | 1.165 (0.324–3.248) | na | ||||
| Strait of Messina (Italy) | 14 | Wild | 50-190 | Muscle | 3.03 ± 0.55 (2.45–4.21) | na | [29] |
| Liver | 1.88 ± 0.54 (1.32–3.02) | na | |||||
| Ionian Sea | 73 (pools, n = 7) | Wild | 2.85–4.36 (3.613 ± 0.471) | Muscle | 0.20 ± 0.07 (0.13–0.35) | na | [32] |
| Liver | 0.39 ± 0.10 (0.27–0.60) | na | |||||
| Mediterranean Sea (Spain) | 3 | Wild | 0.74–1.085 | Muscle | 0.207 ± 0.087 (0.144–0.306) | na | [33] |
| Liver | 0.276 ± 0.005 (0.270–0.280) | na | |||||
| Mediterranean Sea (Italy) | 23 | Wild | 130–290 | Muscle | 0.446 (0.246–0.714) | 0.607 (0.270–1.207) | [49] |
| Tyrrenian Sea | 169 | Wild | 39.5 ± 43.8 (0.33–158) | Muscle | 1.02 ± 0.99 (0.07–4.26) | na | [43] |
| Ionian Sea | 161 (14 pools) | Wild | 36.1 ± 23.53 (5.3–83) | Muscle | 1.18 ± 0.85 (0.16–2.59) | na | [44] |
| Aegean Sea (Turkey) | 6 | Farm | 91.5 ± 2.59 | Muscle | 0.454 ± 0.048 | na | [45] |
| 43 | 235.60 ± 75.53 | Muscle | 0.490 ± 0.064 | na | |||
| Tyrrhenian Sea | 20 | Farm | 56.4 ± 34.0 (13–161) | Muscle | 0.61 (0.07–1.76) | na | [51] |
| Mediterranean Sea (Italy) | 23 | Farm | 135.7 ± 45.8 (46.5–258.8) | Muscle | 0.660 ± 0.585 (0.140–2.211) | na | [52] |
Publisher’s Note: MDPI stays neutral with regard to jurisdictional claims in published maps and institutional affiliations. |
© 2021 by the authors. Licensee MDPI, Basel, Switzerland. This article is an open access article distributed under the terms and conditions of the Creative Commons Attribution (CC BY) license (https://creativecommons.org/licenses/by/4.0/).
Share and Cite
Belmonte, A.; Muñoz, P.; Santos-Echeandía, J.; Romero, D. Tissue Distribution of Mercury and Its Relationship with Selenium in Atlantic Bluefin Tuna (Thunnus thynnus L.). Int. J. Environ. Res. Public Health 2021, 18, 13376. https://doi.org/10.3390/ijerph182413376
Belmonte A, Muñoz P, Santos-Echeandía J, Romero D. Tissue Distribution of Mercury and Its Relationship with Selenium in Atlantic Bluefin Tuna (Thunnus thynnus L.). International Journal of Environmental Research and Public Health. 2021; 18(24):13376. https://doi.org/10.3390/ijerph182413376
Chicago/Turabian StyleBelmonte, Antonio, Pilar Muñoz, Juan Santos-Echeandía, and Diego Romero. 2021. "Tissue Distribution of Mercury and Its Relationship with Selenium in Atlantic Bluefin Tuna (Thunnus thynnus L.)" International Journal of Environmental Research and Public Health 18, no. 24: 13376. https://doi.org/10.3390/ijerph182413376
APA StyleBelmonte, A., Muñoz, P., Santos-Echeandía, J., & Romero, D. (2021). Tissue Distribution of Mercury and Its Relationship with Selenium in Atlantic Bluefin Tuna (Thunnus thynnus L.). International Journal of Environmental Research and Public Health, 18(24), 13376. https://doi.org/10.3390/ijerph182413376