1. Introduction
In recent years, global warming has become a very serious problem. The global average temperature increased every year by around 1 °C because of the increase of greenhouse gas concentrations. Carbon dioxide plays the most crucial role in the greenhouse effect, as it remains much longer in the atmosphere than other gasses. The CO
2 emissions increased from 2 billion tons in 1900 to over 36 billion tons in 2020 [
1].
Since the steady growth of anthropogenic CO2 in the atmosphere is observed it is vital to engage in an ongoing effort to reduce the consequence of global greenhouse emissions causing climate change by establishing an effective approach for capturing CO2.
The application of porous materials for CO
2 capturing is a promising strategy. Especially carbonaceous materials offer advantages of high stability, rapid kinetics, low desorption temperature. The cost of carbonaceous materials is very low if the raw materials are renewable sources or even waste. Therefore, many researchers are focused on developing technologies, leading to the capture and storage of carbon dioxide, especially adsorption techniques, which are currently considered very promising [
2]. Recently, many solid adsorbents have been reported, which could be applied in the CO
2 capture: activated carbons [
3,
4], zeolites [
5], metalloorganic structures [
6], porous polymers [
7], carbon nanosheets [
8], metal oxides [
9], TiO
2 modified by nitrogen [
10], activated carbons-TiO
2 composites [
11], TiO
2 modified by amines [
12], TiO
2/titanate composite nanorods [
13], TEPA-modified titanate composite nanorods [
14], carbon nanotubes [
15], monoliths [
16]. Among the above-mentioned materials, the carbonaceous materials are considered as particularly promising with regard to a low production cost, well developed porosity, large surface area, readily controlled structure, good thermal and chemical stability and large efficiency as well as the wide spectrum of usage [
17,
18].
The adsorption capacity and the efficiency of the activated carbon adsorption system are predicted from equilibrium sorption isotherms. The adsorption of gases and solutes is usually described through isotherms, that describing the relationship between an amount of adsorbed adsorbate and its equilibrium concentration in bulk solution at a constant temperature. The isotherm is used to characterize and evaluate the most important properties of adsorbent such as adsorbent affinity, adsorption capacity, adsorption mechanism and quantitative distribution of adsorbate on adsorbent and bulk solution. The adsorption process is described by isotherm models of two, three, four, and even five parameters [
15,
19,
20]. To determine adsorption isotherm and its constant, experimental and calculation stages are required. Amongst the existing theoretical adsorption models Langmuir, Freundlich, Sips, Toth, Unilan, Fritz-Schlunder, Radke-Prausnitz, Temkin-Pyzhev, Dubinin-Radushkevich, and Jovanovich equations were selected to quantitatively compare the applicability of isotherm models for fitting the experimental data of the CO
2 adsorption. The equations which define the absolute amount of adsorbed gas dependent on the pressure were described below:
1.1. Langmuir Isotherm
The Langmuir isotherm, which is the simplest model, was designed to characterize the adsorption of the gas-solid phase. It is also used to quantify and compare the maximum adsorption capacity of different sorbents. The Langmuir theory postulates monolayer coverage of adsorbate; adsorption occurs at specific homogeneous sites (all sites are equal, resulting in equal adsorption energies). Once an adsorbate molecule occupies a site, no more adsorption can take place at that site. The sorbent has a limited capacity for the adsorbate [
21,
22]. The Langmuir isotherm is expressed following Equation (1):
where q
mL is the maximum adsorption capacity [mmol/g], b
L is the Langmuir constant [bar
−1], p is pressure [bar], q is the adsorbed quantity under p pressure [mmol/g].
1.2. Freundlich Isotherm
The Freundlich model describes an adsorption on heterogeneous surfaces with different adsorption energies [
23,
24] according to Equation (2):
where k
F is the Freundlich constant [mmol/g], n
F is the heterogeneity factor.
1.3. Toth Isotherm
The Toth isotherm model is the next empirical equation developed to enhance isotherm fitting between experimental and calculated data. The Toth isotherm model is useful in describing heterogeneous adsorption systems, which settles with both low and high-end boundaries of the concentration [
25,
26] according to Equation (3):
where q
mT is the maximum adsorption capacity [mmol/g], b
T is the Toth constant [bar
−1], n
T is the heterogeneity factor.
1.4. Sips Isotherm
The Sips model is commonly used for the specification of the heterogeneous adsorbents like activated carbons [
27,
28]. It is reduced to the Freundlich model at low adsorbate concentrations, and at high adsorbate concentrations, it is similar to the Langmuir model [
29] and can be expressed by an Equation (4):
where q
mS is the maximum adsorption capacity [mmol/g],
bS is the Sips constant [bar
−1],
nS is the heterogeneity factor.
1.5. Fritz-Schlunder Isotherm
Fritz and Schlunder elaborated an empirical Equation (5) that is suitable for an extended range of experimental results because of many coefficients in the isotherm [
30]:
where q
mFS is the maximum adsorption capacity [mmol/g], b
FS is the Fritz-Schlunder constant [bar
−1], n
FS is the Fritz-Schlunder model exponent.
1.6. Radke-Prausnitz Isotherm
The Radke-Prausnitz model has several significant properties that make it the preferred choice for most adsorption systems with low adsorbate concentrations. At a low adsorbate concentration, the isotherm model reduces to a linear isotherm. At a high adsorbate concentration, it approaches the Freundlich isotherm, and when n
RP = 0, it becomes a Langmuir isotherm. Another essential property of this isotherm is that it gives a good fit over an extended range of adsorbate concentrations. Radke-Prausnitz equation can be expressed as [
31]:
where q
mRP is the maximum adsorption capacity [mmol/g], b
RP is the Radke-Prausnitz constant [bar
−1], n
RP is Radke-Prausnitz model exponent.
1.7. Unilan Isotherm
Unilan model (7) assumes a heterogeneous surface and almost continuous energy distribution of site yields [
32]:
where q
mU is the maximum adsorption capacity [mmol/g], b
U is the Unilan constant [bar
−1], s is the constant dependent on the difference between the minimum and maximum adsorption energy.
1.8. Temkin Isotherm
This is an empirical two-parameter model for the isotherm of adsorption on a heterogeneous solid. The isotherm corresponds to the continuous, unlimited energy distribution of adsorption sites. The isotherm equation assumes that the heat of adsorption of all molecules in the layer decreases linearly from the adsorbent-adsorbate interaction, and the adsorption is characterized by an equable distribution of the bonding energy. The Temkin equation can be described as (8) [
33]:
where R is the universal gas constant [J/(mol·K)],
bTe is the Temkin-Pyzhev constant connected with the heat of sorption [J/mol],
ATe is the Temkin-Pyzhev constant.
1.9. Dubinin-Radushkevich Isotherm
The Dubinin-Radushkevich model is connected with adsorption energy. It mainly concerns adsorption in micropores. It was assumed that the pore size distribution is heterogeneous and can be described by a Gaussian function. Volumetric filling of micropores was assumed as a result of the increased adsorption potential resulting from the overlapping of the adsorption potentials close to the walls. In the case of a flat surface, increased heat of adsorption occurs at the creation of a monolayer, and in the case of micropores, the adsorption density is increased when filling the micropores. The Dubinin-Radushkevich equation can be described as follows (9) [
34]:
where A is defined by Equation (10):
where
bDR is the Dubinin-Radushkevich constant connected with the heat of sorption [mol
2/kJ
2], q
mDR is the Dubinin-Radushkevich constant connected with amount of adsorbed gas.
1.10. Jovanovic Isotherm
The Jovanovic model retains the assumptions of the Langmuir model taking into account the possibility of additional interactions resulting in the multi-layer sorption effect. The Jovanovich equation can serve as the local isotherm in the general integral equation describing adsorption on a heterogeneous surface (11) [
35]:
where
bJ is the Jovanovich constant.
The nonlinear optimization was used to determine the fitted isotherm. Nonlinear model can be an influential substitute to linear regression because it involves the most flexible curve-fitting functionality. Using nonlinear regression, the sum of the squares of the errors (SSE) must be minimized by an iterative method over the entire range of data. The other error functions such as the hybrid fractional error function (HYBRID), the average relative error (ARE), the Marquardt’s percent standard deviation (MPSD), and the sum of the absolute errors (SAE) can be also utilized to expect the best isotherm. The smaller error of the estimate indicates the more accurate prediction. The best set of parameters for each isotherm was selected using the sum of the normalized error (SNE). Detailed information about error functions was defined by Equations (12)–(16):
The Sum of the Squares of the Errors (SSE) [
36]:
where
qe,calc is the calculated adsorption capacity [mmol/g],
qe,exp is the experimentally measured adsorption capacity [mmol/g].
The Hybrid Fractional Error Function (HYBRID) [
37]:
The Average Relative Error Function (ARE) [
38]:
The Marquardt’s Percent Standard Deviation (MPSD) [
39]:
The Sum of the Absolute Errors Function (SAE) [
40]:
The aim of each error function is to obtain various set of isotherm parameters, thus, the optimal parameters are hard for straight interpretation. It may also happen that on the basis of different error functions, another model should be recognized as the best. Thus, the selection of error function could influence on the obtained isotherm parameters. The sum of the normalized errors (SNE) can be applied to the important parameters comparison [
36]. Shortly, to calculate SNE, the values of the errors obtained for each error function for every group of isotherm constants were divided by the maximum errors for that error function. A function was chosen on the basis of the lowest number of SNE with the best defined empirical results.
The goal of the present study is to examine the CO2 adsorption over the activated carbons derived from beet molasses connected with the research of the influence of the isotherm kind and the model used to calculate its parameters on the calculations by the two and three parametric models taking into discuss the error functions.
The novelty of the work was the application of solid KOH as an activator. All the carbon sources described in the literature are solid-state. While, molasses is liquid and was described only by Legrouri et al. [
41] and our group [
42]. Legrouri et al. [
41] used sulphuric acid as an activator. In our previous research [
42] we dried and ground molasses in order to get powder moreover KOH solution was applied. The new method presented here is much simpler and inexpensive (no drying necessary).
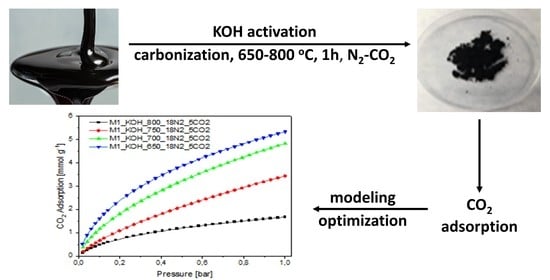
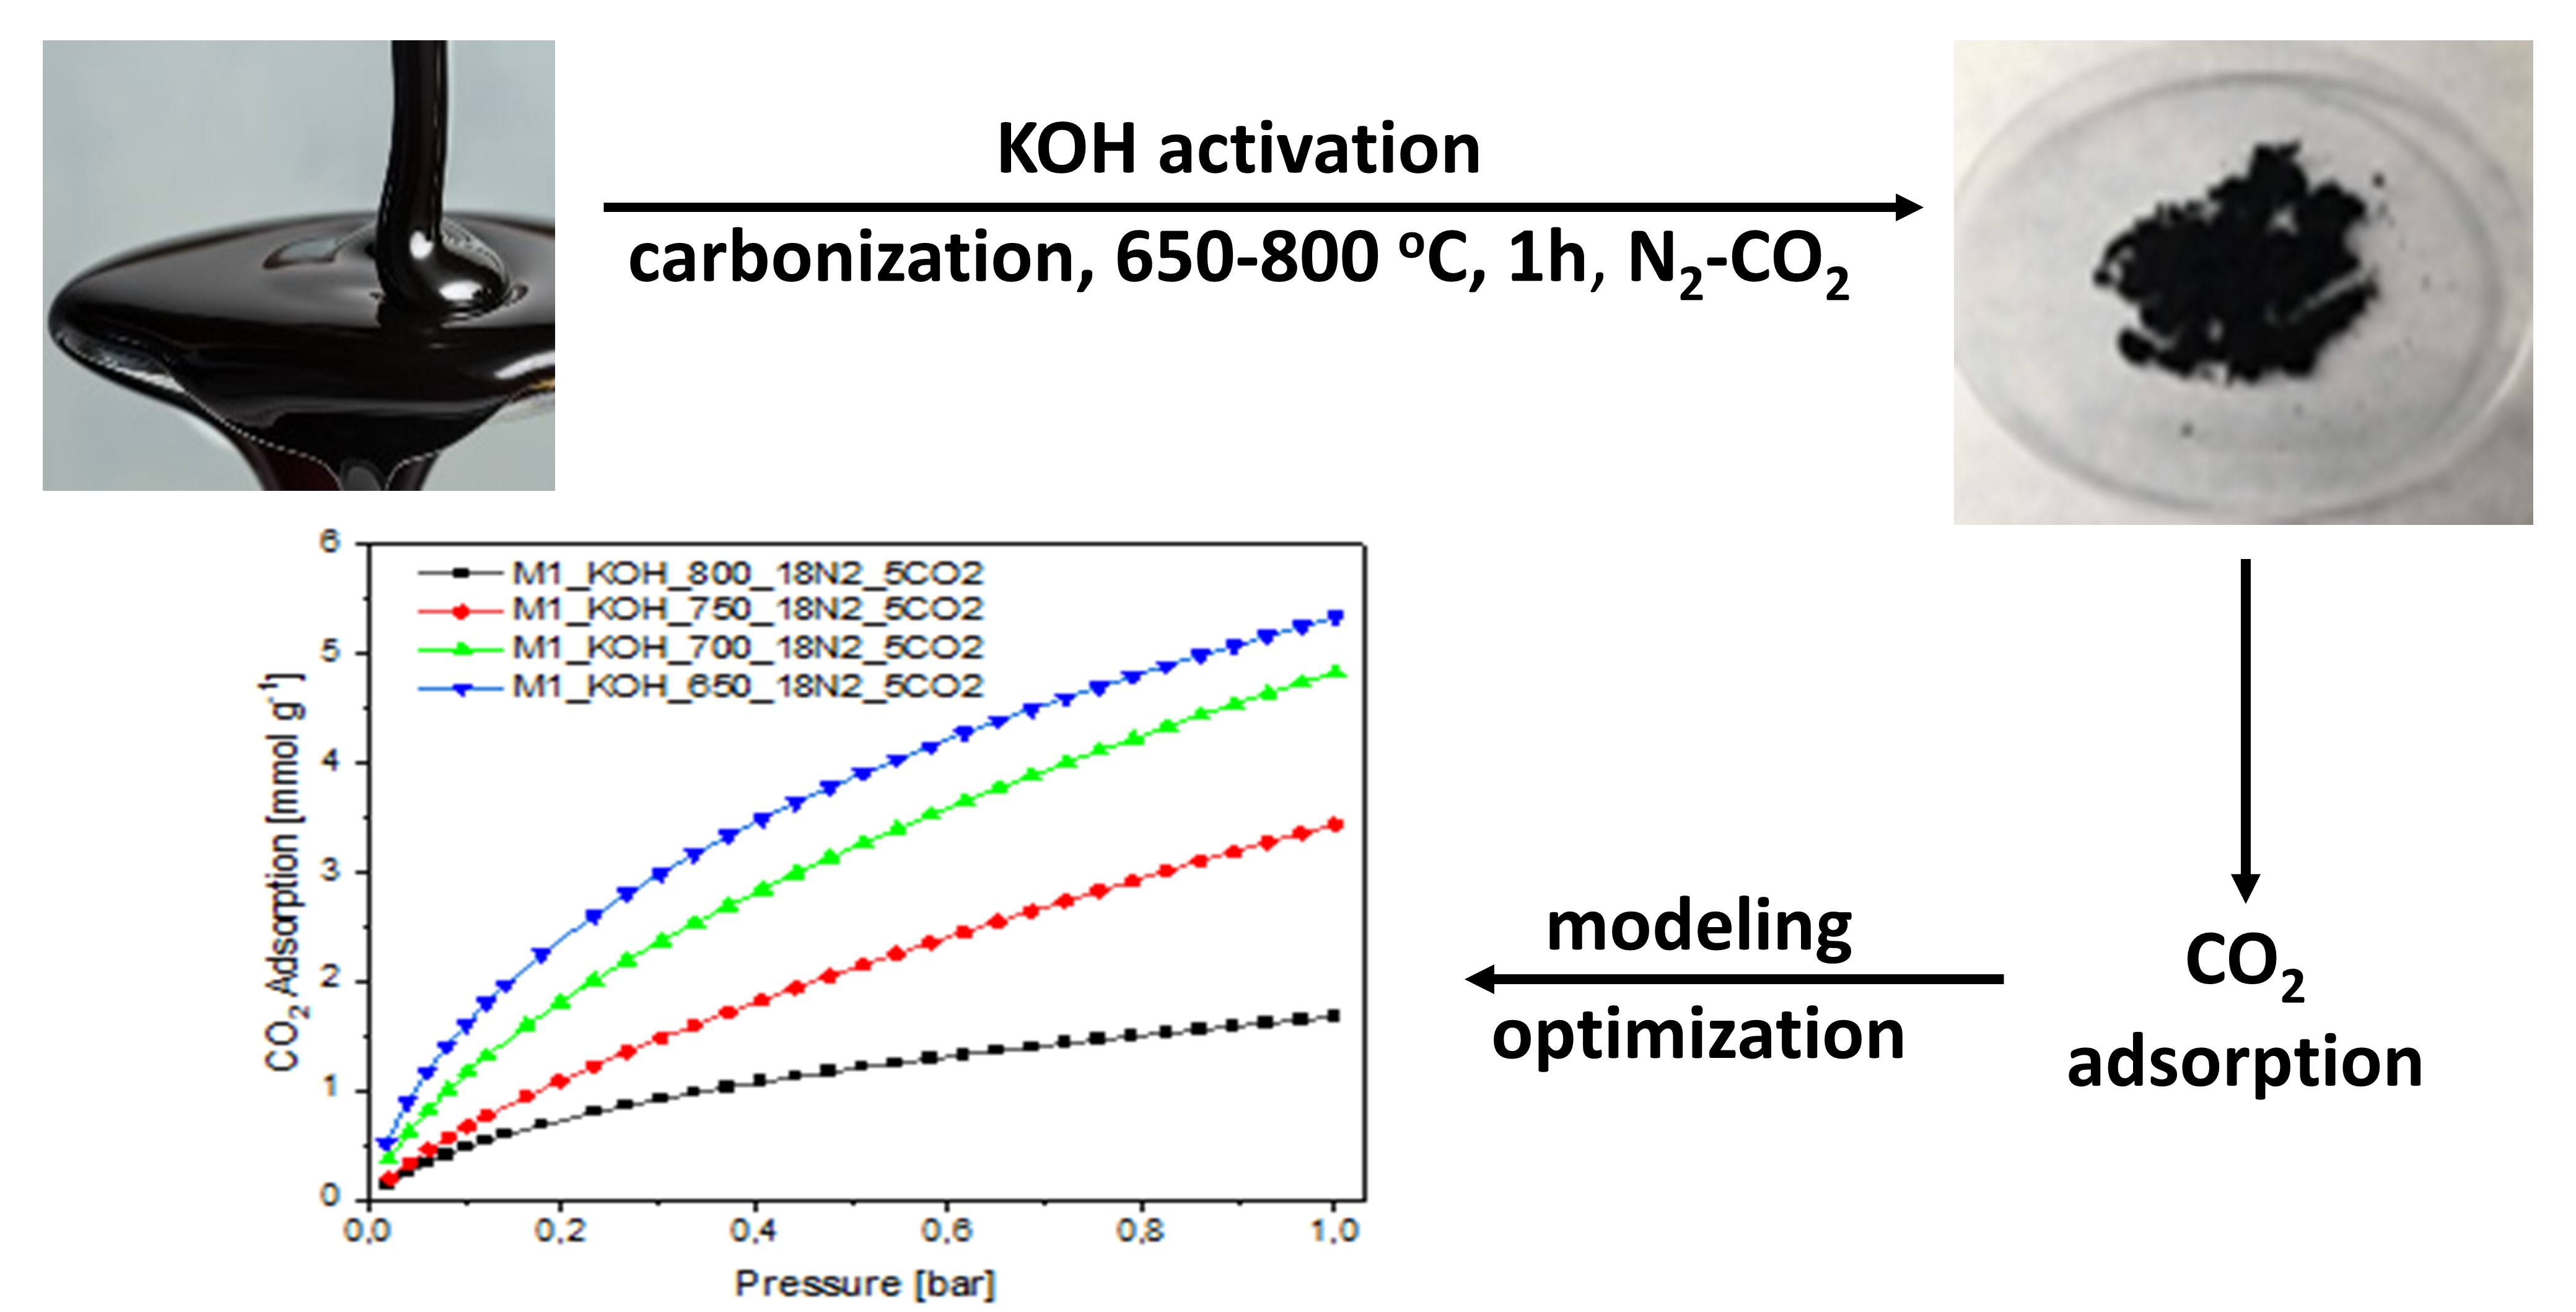
2. Materials and Methods
Chemical activation of beet molasses was carried out with the use of solid potassium hydroxide. Liquid molasses was weighed into a plastic cup, and then potassium hydroxide was added in such an amount that the mass ratio of molasses to activator was 1:1. Then, the material was vigorously mixed until the raw material was clearly saturated with solid potassium hydroxide and left at ambient temperature for 3 h. After this time, the impregnated material was placed in a laboratory dryer (20 h, 200 °C). The carbonaceous precursor impregnated in this way was carbonized. A physical activation process was conducted in a tubular reactor kept for 1 h in electrical furnace in the temperature range of 650–800 °C and the temperature was increased 10 °C per minute to a chosen value. The process was carried out in the nitrogen-carbon dioxide atmosphere (flow rate equal to 18 dm3/h, flow of the carbon dioxide 5 dm3/h). The activation process parameters like, time, N2-CO2 flow rate, and the heating rate of furnace in all the experiments were identical. They were assumed, based on many previous tests, to result in the best settings ensuring the maximum enhancement of the surface area of studied carbons. The derived activated carbon containing the decomposition products of potassium hydroxide or potassium carbonate were rinsed with deionized water to attain a neutral reaction. When the sample was evaporated, the activated carbon was flooded with 1 mol/dm3 HCl solution and was left behind for 20 h. In the following stage, carbons were rinsed with deionized water until complete removal of chloride ions. Then samples were dried at temperature of 110 °C for 16 h. The activated carbons were denoted as: M1_KOH_650_18N2_5CO2, M1_KOH_700_18N2_5CO2, M1_KOH_750_18N2_5CO2, M1_KOH_800_18N2_5CO2, where: M1 is beet molasses, KOH is an activating agent, 650, 700, 750, 800 is an activation temperature, and 18N2_5CO2 is the gaseous activating atmosphere. All activated carbons were characterized by nitrogen adsorption at −196 °C by means of Sorption Surface Area and Pore Size Analyzer (ASAP 2460, Micrometrics, Novcross, USA). To remove the contaminants from samples, the adsorption measurements were preceded by heating at temperature of 250 °C for 12 h with the heating rate of 1°/min under the reduced pressure thanks to the constant operation of pump. From N2 sorption isotherms, the following parameters describing the porous structure have been obtained:
where
W is the mass of gas adsorbed at a relative pressure
p/p0,
p is the nitrogen pressure,
p0 is equal to 1.01 bar;
Total pore volume (Vp,N2) calculated from the maximum adsorption of nitrogen vapor for p/p0 = 0.99;
Pores in a range of micropores (Vmic,N2) and mesopores were evaluated using N2 analysis at −196 °C temperature by the DFT method (density functional theory).
The N2 adsorption isotherm at −196 °C gives data about the micropore structure with a size over 1.5 nm and the mesopores, and partly macropores. The CO2 adsorption measurements were studied at temperature of 0 °C, under pressure to 1 bar using ASAP. So as to control the experiment temperature, investigated were located in a thermostat. Before the CO2 adsorption measurements, the activated carbons were outgassed at temperature of 250 °C for 12 h.
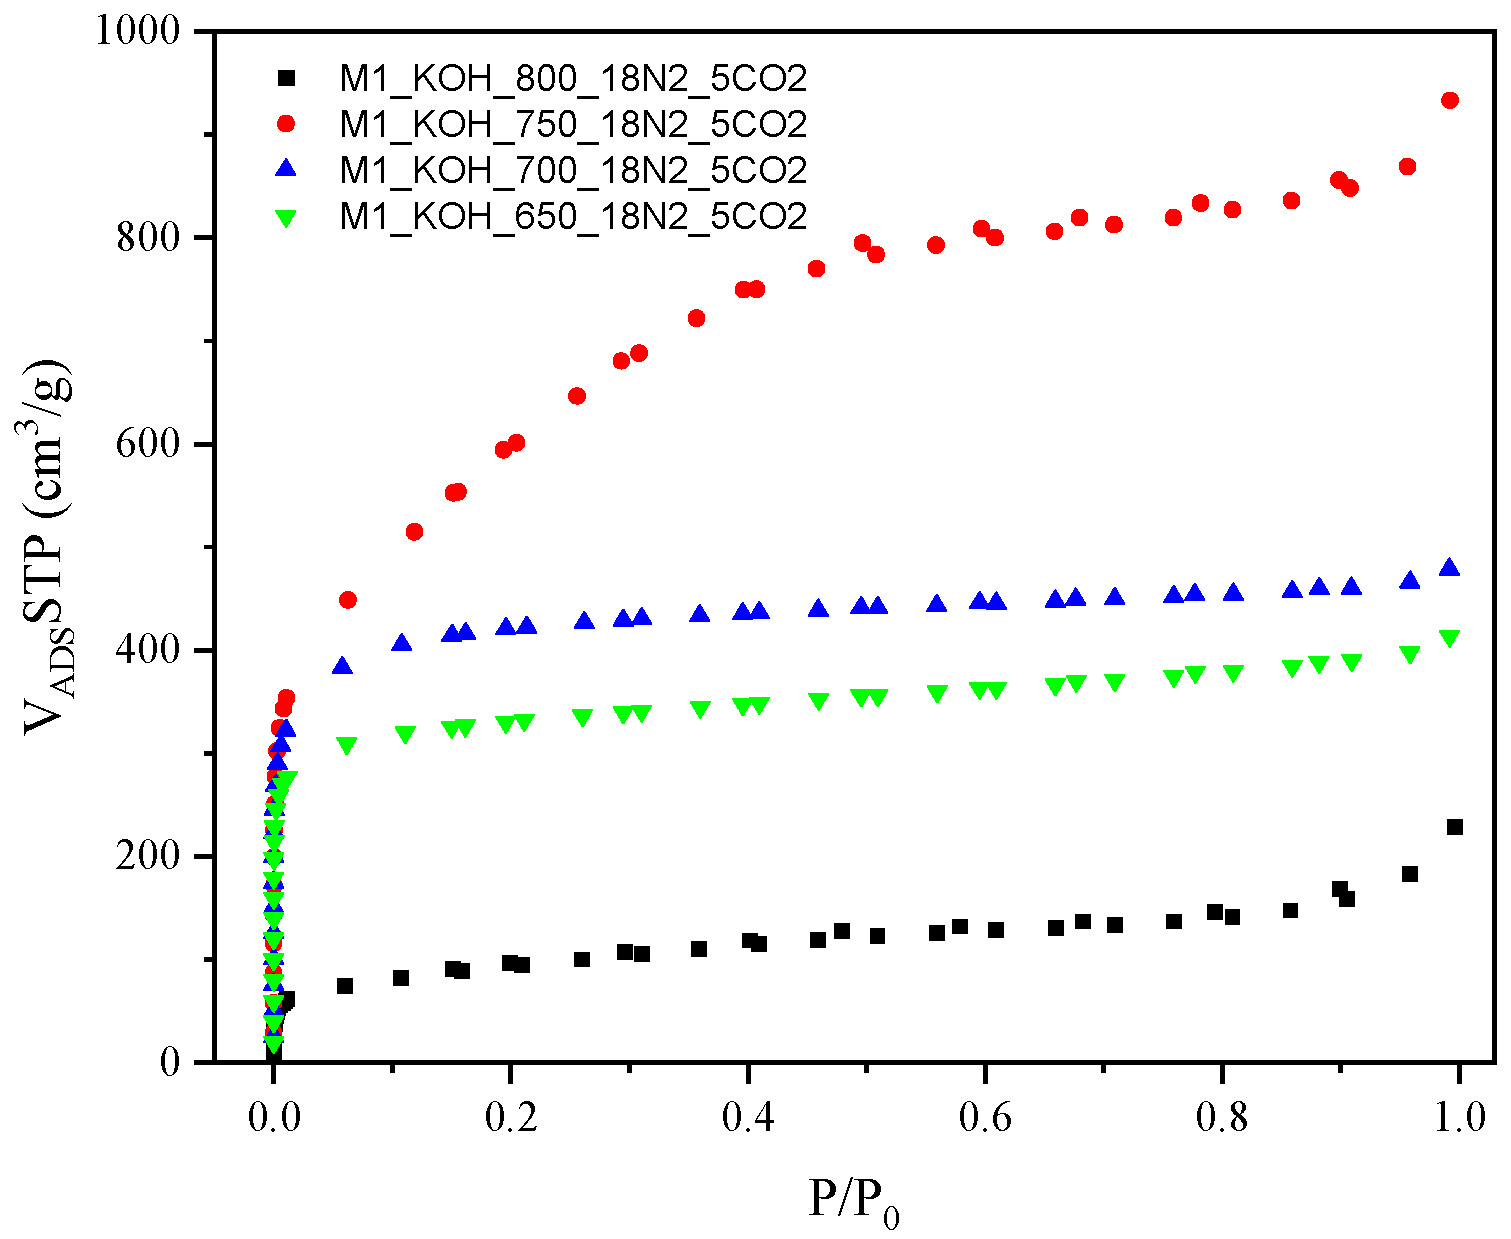
3. Results and Discussion
The results of undermentioned adsorption-desorption isotherms of N
2 on the examined activated carbons are shown in
Figure 1.
The isotherms established a high adsorption of N2 at low relative pressure that is representative for the microporous samples. A high N2 adsorption at a low relative pressure (under 0.1 p/p0) designates high volume of the micropores with a thin pore size distribution. It was observed, that the nitrogen adsorption measured at temperature −196 °C meaningfully increased in case of all carbon samples along with increase of an activation temperature during the thermal treatment, however, with one exception i.e., the lowest nitrogen capacity was achieved for carbon activating at the highest temperature (800 °C).
By International Union of Pure and Applied Chemistry (IUPAC) classification, the nitrogen adsorption isotherms correspond to the Type I at the first range (low value of the relative pressure p/p0), while in the medium and higher range to the Type IV. A representative feature of the Type IV isotherm is the existence of sharply formed hysteresis loop which is related with capillary condensation occurring in the area of mesopores. The isotherms established the hysteresis loop of the Type IV. It was concluded that the capillary condensation in the mesopores occurs in the range of relative pressure p/p0 = 0.45–1, for all four samples, designating the presence of mesopores.
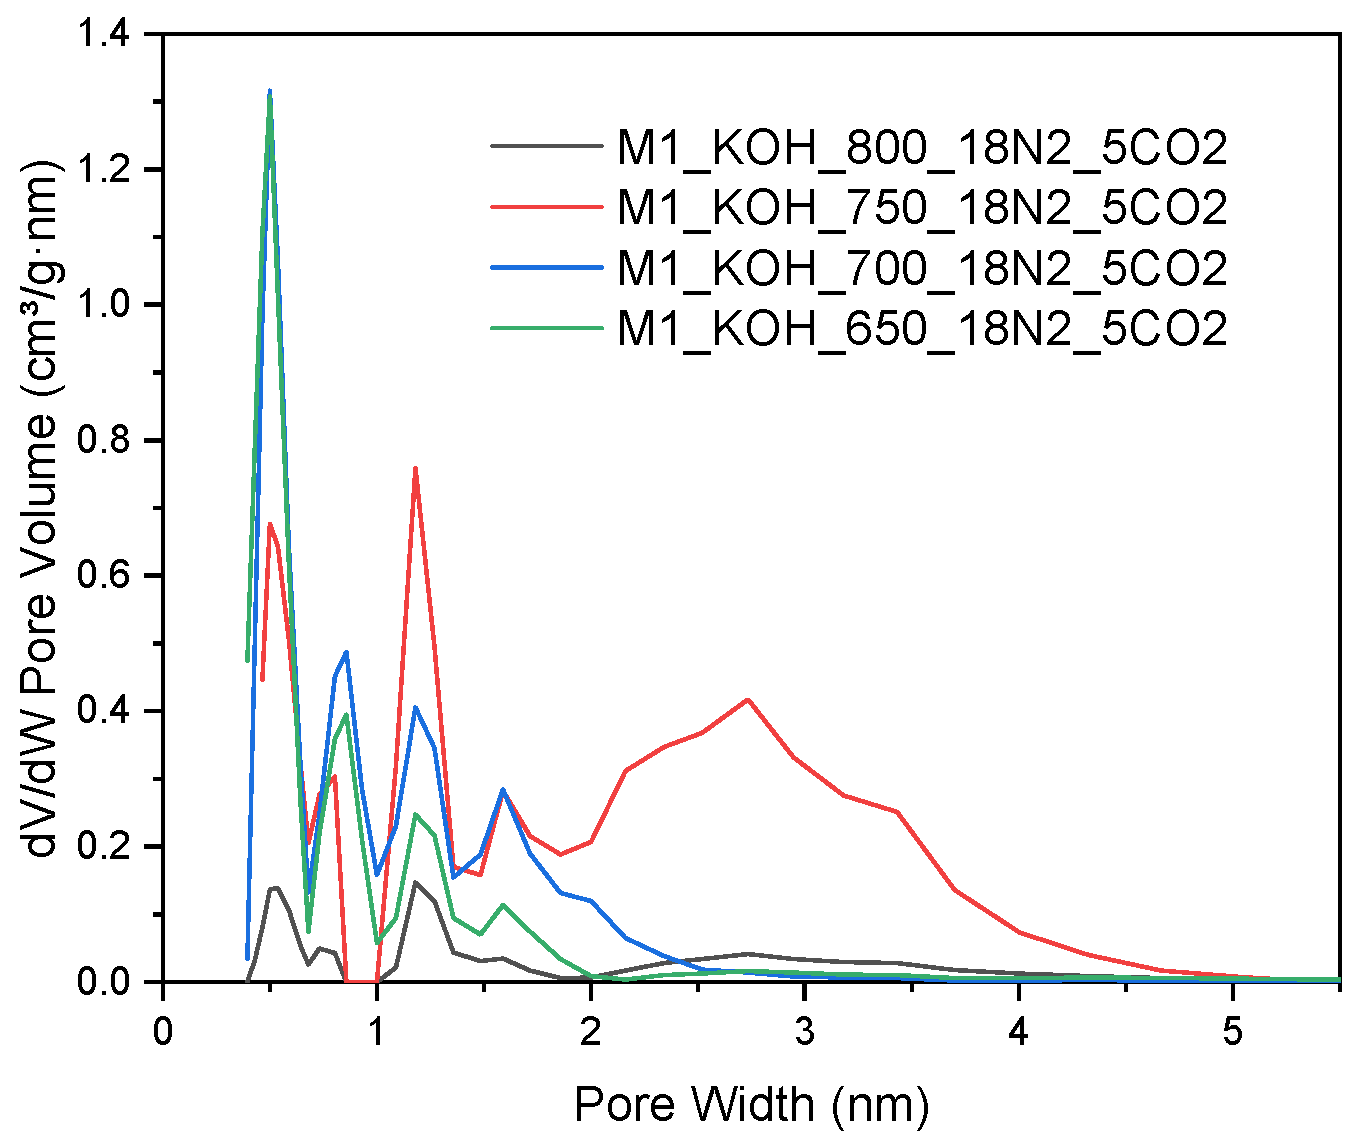
Taking into account an analysis of pore size distribution, more comprehensive information can be found regarding the structure of the adsorption over tested materials. In order to investigate the relationships between the pore size of the studied carbons and a temperature of activation process, an analysis of the size distribution of the activated carbons based on the N
2 adsorption was performed. The pore distribution shown in
Figure 2 directs for the fact that all samples in addition to a relatively well developed microporosity indicates the advanced mesoporosity as well. The used method provides information on the porosity for pores in the range from 0.35 to 300 nm, depending on the used adsorbate. However, in
Figure 2 only pores up to 5 nm are presented, as there were no larger pores in the tested activated carbons.
The textural properties of all samples were compiled in
Table 1. In case of samples M1_650_18N2_5CO2, M1_700_18N2_5CO2, M1_750_18N2_5CO2, higher surface areas and pore volumes were obtained with increasing activation temperature. However, for sample M1_800_18N2_5CO2 the tendency is the differing, as observed in
Table 1. The largest BET surface area (2075 m
2/g) attained the M1_750_18N2_5CO2 carbon. In the other hand, the most microporous material with the micropore volume of 0.53 cm
3/g were M1_700_18N2_5CO2 carbon.
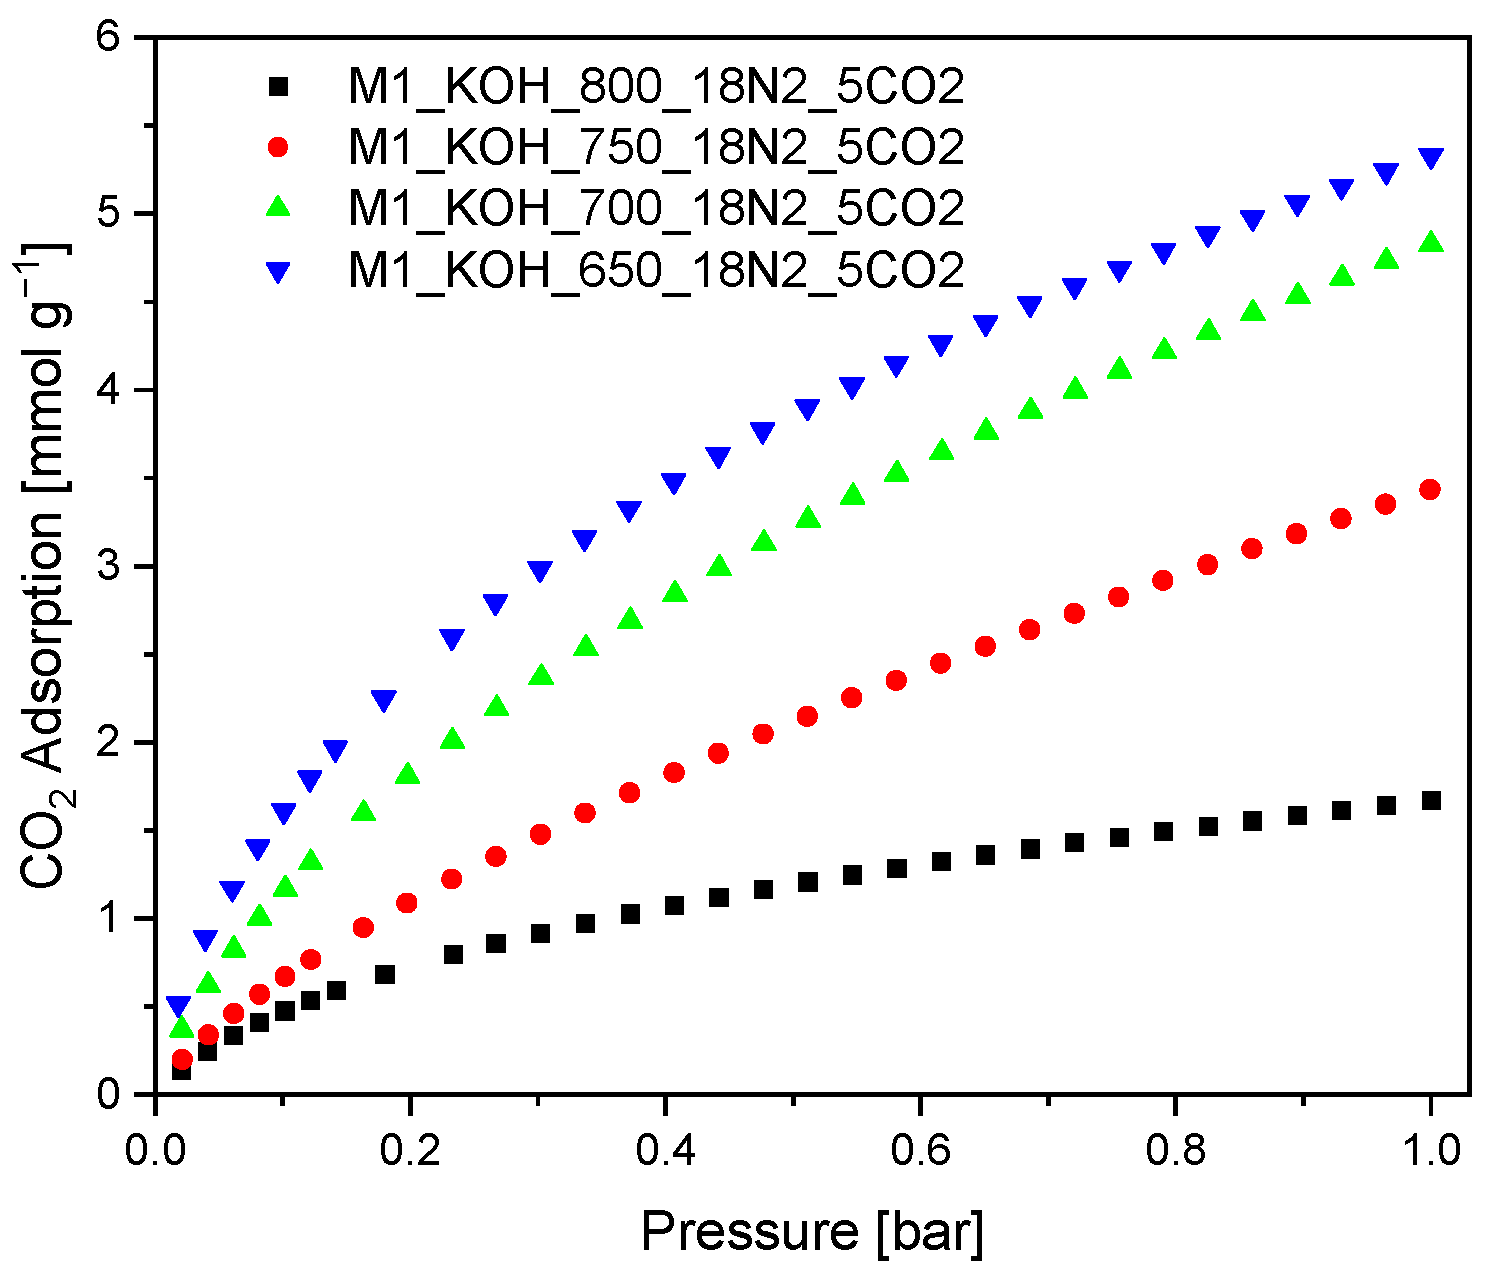
The CO
2 adsorption on the surface of the activated carbons was measured at temperature of 0 °C under pressure of 1 bar. The experimental CO
2 capacity at 0 °C are given in
Figure 3.
It was evidenced, that the CO
2 adsorption capacity at temperature 0 °C increased along with decreasing carbonization temperature. These results are surprising because they are contrary to the literature reports [
43], where the CO
2 adsorption efficiency increases along with increasing: specific surface area, total pore volume as well as micropore volume. Therefore, it can be concluded that in the case of studied activated carbons the key role is played by pores with diameter in the range from 0.3 to 0.6 nm with ignoble participation of the larger pores.
Table 2 summarizes the results of adsorption CO
2 on activated carbons produced from various carbon precursors.
All isotherms match to type I of IUPAC classification, characteristic for microporous adsorbents. Experimental CO2 adsorption isotherms constituted the basis for calculating equation parameters in all models.
The sets of CO
2 adsorption isotherm parameters and error functions with SNE are compiled in
Table 3,
Table 4,
Table 5,
Table 6,
Table 7,
Table 8,
Table 9,
Table 10,
Table 11 and
Table 12. The comparison of the SNE was undertaken and, hence, the isotherm constants which present the closest fitting to the measured data were attained.
The parameters fitting results to Langmuir model are exposed in
Table 3.
Presented constants were estimated by nonlinear regression making use of the different error functions. The values of constants qmL and bL are quite similar. Langmuir isotherm does not provide a good model for the CO2 adsorption over all activated carbons. As indicated by the SNE, the parameter set that produces the best overall Langmuir fit are HYBRID for all four activated carbons.
The Freundlich isotherms constants and error functions are shown in
Table 4.
Based on SNE, the ARE for M1_800_18N2_5CO2, and HYBRID for M1_650_18N2_5CO2, M1_700_18N2_5CO2, M1_750_18N2_5CO2 give the best Freundlich fit. Nevertheless, the best Freundlich fit cannot be acceptable.
The fitting parameters to Sips model are shown in
Table 5.
The SNE indicated that the HYBRID gives the best Sips fit.
The Toth isotherms constants and error functions are shown in
Table 6.
The SNE specified that the MPSD for M1_650_18N2_5CO2, SAE for M1_750_18N2_5CO2, and HYBRID for the rest two activated carbons give the best Toth fit.
The fitting parameters to Unilan model are shown in
Table 7.
The SNE specified that the ARE for M1_650_18N2_5CO2, and HYBRID for the rest of the activated carbons give the best Unilan fit.
The Fritz-Schlunder isotherms constants and error functions are shown in
Table 8.
The SNE specified that the SAE for M1_750_18N2_5CO2, and HYBRID for the rest of the activated carbons give the best Fritz-Schlunder fit.
The Temkin isotherms constants and error functions are shown in
Table 9.
The SNE specified that the HYBRID for all activated carbons gives the best Temkin fit.
The Dubinin-Raduskevich isotherms constants and error functions are shown in
Table 10.
The SNE specified that the HYBRID for the all activated carbons gives the Dubinin-Raduskevich fit.
The Jovanovich isotherms constants and error functions are shown in
Table 11.
The SNE specified that the ARE for M1_700_18N2_5CO2, and HYBRID for the rest of the two activated carbons give the best Jovanovivh fit.
The Radke-Prausnitz isotherms constants and error functions are shown in
Table 12.
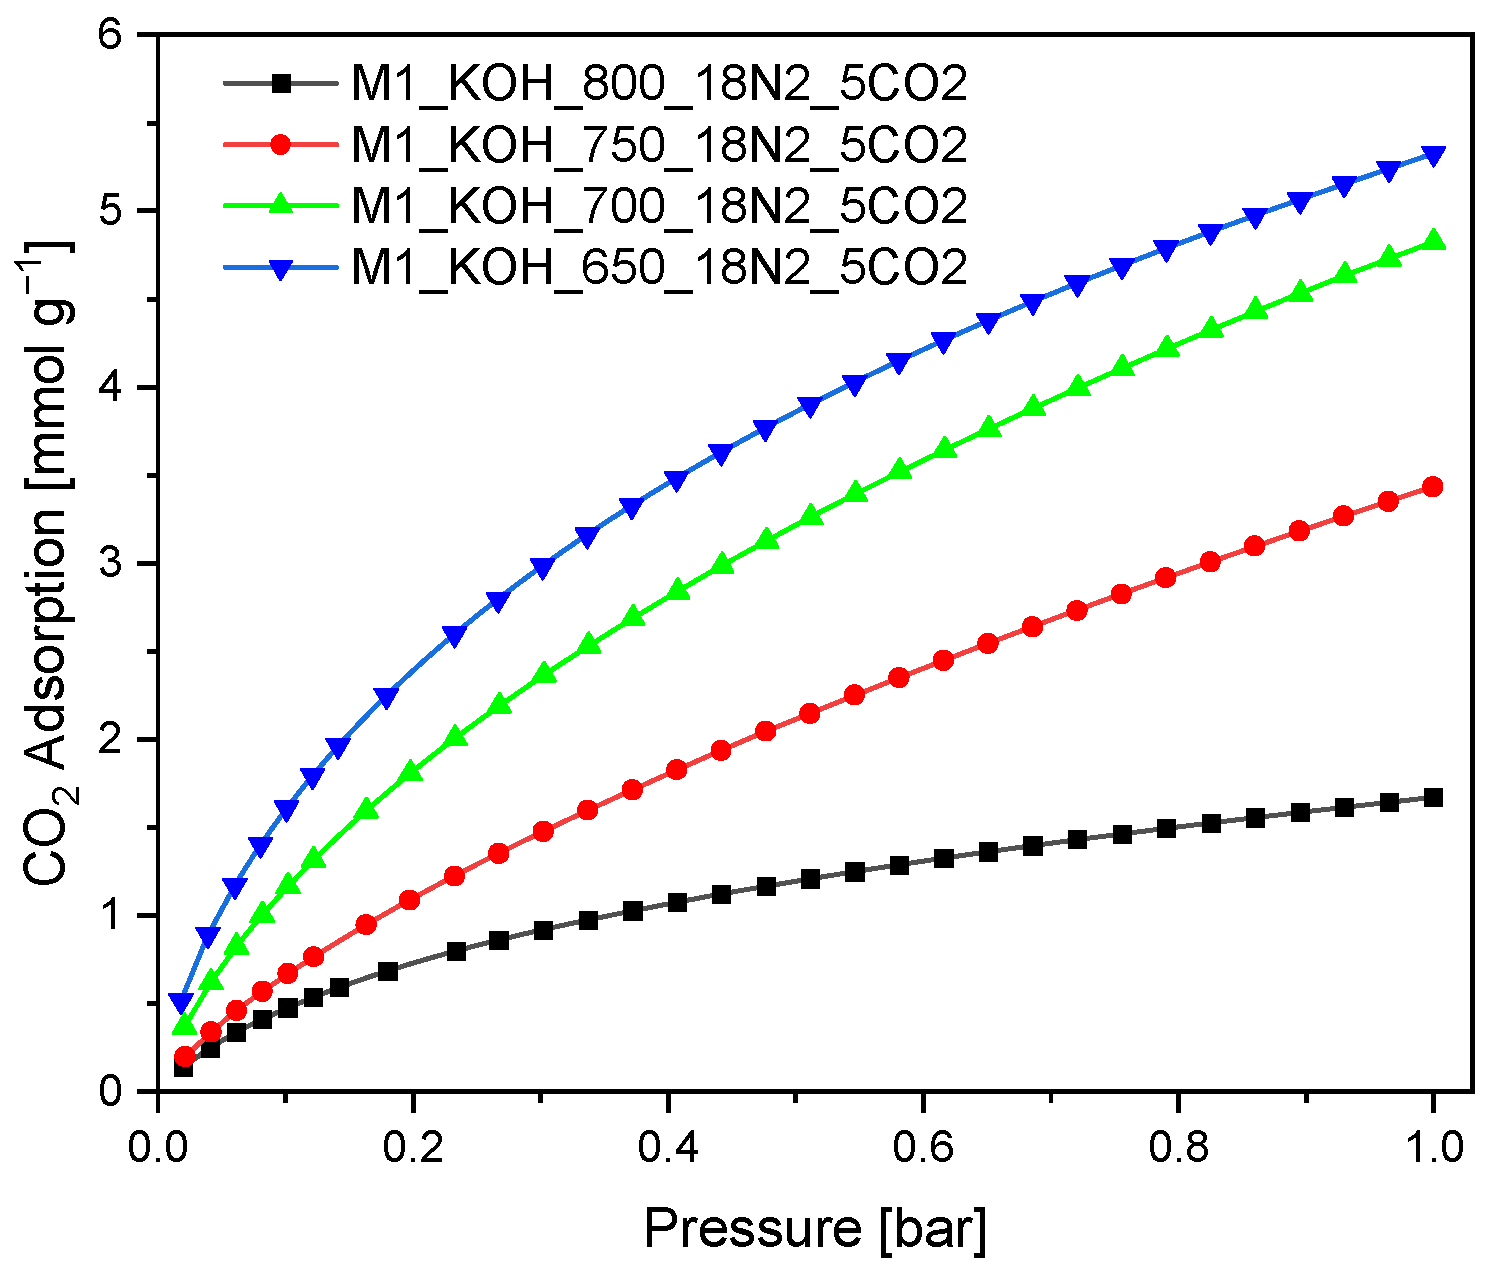
The SNE specified that the MPSD for M1_750_18N2_5CO2, the ARE for M1_800_18N2_5CO2 and HYBRID for the two activated carbons give the best Radke-Prausnitz fit. The three constants q
mRP, b
RP, n
RP are comparable over the whole range of error functions. The SNE for M1_650_18N2_5CO2, M1_800_18N2_5CO2 were the lowest of all the studied models. The Radke-Prausnitz equation gives a rational approximation to the optimum parameter set. The theoretical Radke-Prausnitz isotherms and experimental data are presented in
Figure 4.
The Radke-Prausnitz model is advised for the analysis of the empirical data. A similar result can be concluded based on
Figure 4. The experimental adsorption isotherm matches quite well with Radke-Prausnitz equation model regardless of the error function.


