Abstract
Trackers for activity and physical fitness have become ubiquitous. Although recent work has demonstrated significant relationships between mental effort and physiological data such as skin temperature, heart rate, and electrodermal activity, we have yet to demonstrate their efficacy for the forecasting of mental effort such that a useful mental effort tracker can be developed. Given prior difficulty in extracting relationships between mental effort and physiological responses that are repeatable across individuals, we make the case that fusing self-report measures with physiological data within an internet or smartphone application may provide an effective method for training a useful mental effort tracking system. In this case study, we utilized over 90 h of data from a single participant over the course of a college semester. By fusing the participant’s self-reported mental effort in different activities over the course of the semester with concurrent physiological data collected with the Empatica E4 wearable sensor, we explored questions around how much data were needed to train such a device, and which types of machine-learning algorithms worked best. We concluded that although baseline models such as logistic regression and Markov models provided useful explanatory information on how the student’s physiology changed with mental effort, deep-learning algorithms were able to generate accurate predictions using the first 28 h of data for training. A system that combines long short-term memory and convolutional neural networks is recommended in order to generate smooth predictions while also being able to capture transitions in mental effort when they occur in the individual using the device.
1. Introduction
From activity trackers to smartwatches, the use of wearable sensors (henceforth referred to as wearables) for collecting physiological and movement data is becoming commonplace. For some time, researchers have investigated how to leverage wearables to facilitate a number of outcomes in varied domains, such as physical activity [1,2], disease management or monitoring [3,4], and even education [5,6]. In some areas, such as physical activity tracking, the research base is well established, having been systematically reviewed and meta-analyzed [2,7,8]. However, in other areas, such as education, research is just emerging.
As an interdisciplinary team of computer scientists and education researchers, we are interested in the use of wearables in education. Specifically, we questioned how wearables can be used to facilitate learning inside and outside of formal educational settings. This work faced a number of challenges in the educational space, from deciding on what type of sensor to use (e.g., wrist-worn or head-worn) to understanding what wearable data correlated with in relation to learning processes, through identifying the most effective ways to analyze data from wearables.
Despite these challenges, research on the use of wearables in education is expanding. Researchers have proposed the use of wearables for varied purposes, such as detecting a student’s mood [9], detecting a student’s hand motions [10], or predicting students’ cognitive load and mental focus [11]. While these cases represent only specific areas of work in the field, they highlight three important themes: detecting mood, detecting movements, and predicting cognitive outcomes.
In this study, we focused on the third theme, predicting cognitive outcomes from data collected via wearables. Specifically, we sought to investigate if it was possible to predict the mental effort of a learner based on the physiological parameters collected from a wearable, and to study the efficacy of the system to detect transitions in mental effort from one activity to another. We believe that this work can build toward the creation of sensor-based tools that can help students self-regulate their own learning [11].
2. Review of Literature
2.1. The Use of Wearables in Education
As noted, researchers have investigated the use of wearables in various ways within the educational domain or wearable data in relation to educationally relevant variables. In addition to the themes already discussed, researchers have also examined critical issues such as the feasibility and usability of wearables in educational environments [12,13], how wearables influence teaching practices [14], and detecting attention or interest [15,16]. However, work involving wearables in educational settings has often encountered challenges. Two prominent challenges are linking the data from the wearable to the learning process and finding an effective way to analyze the data.
The question of what is being measured by the wearable in relation to education is particularly notable and deserves closer examination. First, it is critical to define what physiological outcomes can be measured through wearables and may be of interest to educational researchers. Wearables such as the Empatica E4 have been used to measure electrodermal activity, skin temperature, and heart rate [11]. Some have linked wearable data to engagement [17,18,19], while others have used the data as indexes or measures of mental effort, mental workload, or cognitive load (for the purposes of this paper, we use these terms synonymously, referring to the load placed on the working memory during a task). Based on existing research, we believe that mental effort or mental workload is an appropriate correlate [1] to physiological activity, because mental workload demands can cause an unconscious, automatic response by the autonomic nervous system [20]. In addition, there is a plethora of research around using physiological measures to examine mental workload or mental effort (for reviews, see [21,22,23]).
The second prominent challenge researchers face is how to best analyze the data from wearables in educational contexts. Some researchers have analyzed physiological variables individually, such as heart rate, electrodermal activity, or skin temperature [18,24,25]. However, a recent systematic review revealed that there was no single physiological measure that captured all aspects of mental workload measurement [21]. This could explain why some studies that have examined individual variables have found reasonably accurate results, whereas studies that have taken a multimodal data analysis approach have found more promising results. For instance, one study found that heart rate could predict mental workload changes 62.5% of the time, while galvanic skin response showed 75% accuracy [26]. Meanwhile, [11] used a multimodal approach and found that using a random forest classifier resulted in strong classification accuracy when classifying students as being engaged in activities that required different levels of mental workload (area under the receiver operator characteristic (ROC) curve (AUC) = 0.93–0.99, F1 = 0.85–0.94). While unimodal or multimodal data analysis is a concern, the analysis techniques that are best suited for this type of work have also been explored, ranging from descriptive [18] through machine-learning methods [11,27]. At the present time there is not enough evidence to say which machine-learning algorithm works best for predicting mental workload. That is one gap in the literature that this study addresses.
While a basis for connecting physiological measures to mental workload is important, in educational realms it is also important to understand how these measures can be tied back to theoretical foundations about how people learn. In the next section, we explore cognitive load theory (CLT), a widely used theory for designing instruction.
2.2. Cognitive Load Theory
Cognitive load theory has been used in educational research for more than 30 years, but has increasingly been used as a framework for research across various disciplines. The central idea of CLT is that the working memory is limited and can only process a certain amount of information at one time [28,29,30]; this limitation is well known and has been shown in psychological research [31,32]. Furthermore, CLT specifies that working memory load can be caused by two distinct sources. Intrinsic load is caused by the complexity of the materials being learned, while extraneous load is due to other factors not related to the content itself, such as the way the material is presented, with optimal instruction being designed to appropriately manage the intrinsic load placed on the learners while minimizing the extraneous load they experience [28,29,30].
Given the widespread use of CLT as a theoretical framework over the last three decades, it should not be surprising that there have been many approaches to measuring cognitive load. Unfortunately, few have been theoretically and psychometrically sound, and they have been critiqued in the literature (for reviews and critiques, see [33,34,35]). However, many of the challenges in relation to measuring cognitive load are in relation to measuring specific types of cognitive load (i.e., intrinsic or extraneous) rather than measuring the broader construct of overall cognitive load. In fact, some have stated that it may not be possible to measure the different types of cognitive load through self-report [36], although recent measures [37,38] have been argued to be worthy of further research [39].
While measures of the different types of cognitive load have been critiqued in the literature, measuring overall cognitive load has also been common. This approach has been critiqued when it has been misaligned with study goals; for example, when trying to make claims about extraneous load but measuring overall load, but otherwise it has been a relatively common practice. In particular, a one-item measure of mental effort has been commonly used as an indicator of overall cognitive load [40]. Furthermore, physiological measures have also been used as indicators of overall cognitive load, such as electroencephalography [41] and eye tracking [42].
2.3. Purpose of the Present Study
Previous work around cognitive load theory has laid the groundwork for using physiological measures for measuring overall cognitive load [41,42], and research around mental workload has shown that a variety of physiological measures can be used to measure different aspects of mental workload [21]. Building from these foundations and leveraging machine learning, in this study we explored the prediction of mental effort based on multimodal physiological measures collected from a wrist-worn wearable. In particular, we focused on the efficacy of merging self-report data and sensor data to train a device to predict cognitive load into the future, and further studied the efficacy for detecting the transition from one activity to another. Our research questions included:
- (1)
- How much data does it take to train a device to accurately detect an individual’s level of mental effort into the future, and how robust are these predictions over time?
- (2)
- Which machine-learning algorithms are most and least effective for merging self-report data with physiological data toward making accurate longitudinal predictions, including the automated detection of transitions between different levels of mental effort associated with different learning activities?
By exploring these research questions, we ultimately make a case for the current state of the art for automated tracking of mental effort using a wearable device, including offering insight into current limitations of the technology and best practices for training an automated mental effort detection system.
3. Materials and Methods
3.1. N = 1 Case Study Design
In this study, we sought to understand how physiological data from a wearable fitness tracker could be used to train a wearable mental effort detection system for a single participant. We were primarily interested in how many data were necessary to train such a system for an individual and the efficacy of different machine-learning models in learning temporal trends. To satisfy these goals, we used a longitudinal n = 1 case study design [43]. The goal of a case study is to generate a rich description of a single case, which typically constitutes a single participant or entity [44]. Since our aim in this study was to evaluate the efficacy of a device for long-term monitoring of mental effort, it made sense to focus on a single participant over an extended time period. When context-dependent generalizability is desired, [44] argued that studying a case that is situated within that context is among the strongest approaches available. With the fields of psychology and medicine focusing less on giving general answers applying to everyone and more on individualizing care, it is not surprising that the n = 1 design has increased in popularity in the medical research community [45,46], and it is especially applicable for a study to understand how we might go about training an automated system to track mental effort for an individual [47].
3.2. Data Collection and Preparation
The case in this study was a 19-year-old college student obtaining a bachelor of science in medical laboratory science. The proclaimed gender of the participant was female with an ethnicity of Caucasian. She was a sophomore in her studies, making class attendance and learning a familiar process. The college student logged physiological and self-report data while attending her class sessions, which were online due to the COVID-19 pandemic, from 1 September 2020 to 3 December 2020. Online instruction was a new route of learning for her.
Data were obtained through the use of the Empatica E4 wristband device [48] over the course of the Fall 2020 semester. The E4 collected data for activities such as actively paying attention in class, asking questions, collaborative small group discussions, organizing due dates in a personal planner, and emailing teaching assistants and professors. There were also data sessions that included studying and doing homework outside of class time. These activities included online homework assignments, studying with fellow students, and watching online lecture videos for review of class material. Finally, there were everyday tasks performed while collecting data, such as scrolling on social media, cooking, tutoring, grocery shopping and eating dinner. Overall, the data collection process for all sessions was the same. The E4 wristband was turned on promptly at the start of each class or task and kept on throughout the entire duration of the activity. The watch data collection session ended promptly at the end of a session, and a cognitive load survey was completed [40]. The participant’s self-reported cognitive load rating after each activity was based on Paas’ mental effort 1–9 ordinal scale [40], with 1 being very very low mental effort and 9 being very very high mental effort.
To predict the mental effort based on the physiological parameters, six measures from the Empatica E4 device were recorded and utilized. These measures were acceleration (ACC) on three orthogonal axes X, Y, and Z; electrodermal activity (EDA) (μS); skin temperature (TEMP) (°C); and heart rate (HR) (beats per minute). These measures were recorded by the E4 wristband while the student was performing different activities (descriptive statistics in Table 1).

Table 1.
Descriptive analysis of the physiological features extracted from the Empatica E4.
The E4 wristband sampled heart rate at a frequency of 1 Hz, EDA and skin temperature at 4 Hz, and acceleration at 32 Hz. In order to remove the false readings at the beginning of each session as the device stabilized, we removed the initial 40 readings from heart rate, which was sampled at 1 Hz. Likewise, as EDA and temperature were sampled at 4 Hz, and acceleration was sampled at 32 Hz, we removed the corresponding readings from these physiological parameters as well. Thereafter, to combine all the physiological parameters in a consolidated data set, EDA, temperature, heart rate, and acceleration were downsampled to 1 Hz while accounting for the fact that heart rate was calculated as a moving average of the previous 10 s of data. For each activity, these corresponding physiological parameters were combined and arranged chronologically, after which we found that a total of 92.3 h of data over 91 separate activities were recorded; these data were used for further analysis.
3.3. Training and Testing the Machine-Learning Models
To predict the mental effort based on the physiological parameters and to predict transition from one activity to another, traditional machine-learning models, a time-dependent baseline model, and deep-learning models were implemented. All models took a supervised approach in attempting to predict the participant’s self-reported level of mental effort based on her physiological data at each second. As traditional machine-learning models, logistic regression, random forest, and k-nearest neighbors were implemented with six physiological parameters as the predictors and mental effort as the outcome. As our data set was arranged in a chronological manner, time-series modeling was also implemented using aMarkov switching effects regression model as the baseline model. Finally, we explored the efficacy of using deep learning models including long short-term memory, recurrent neural networks, and convolutional neural networks. Toward understanding how many data were needed to train these models in order to provide a reasonable forecast at a later time, training sets were divided into first 10%, 20%, 30%, 40%, 50%, 60%, 70%, 80%, and 90% of data; and correspondingly, the respective test set was divided into the last 90%, 80%, 70%, 60%, 50%, 40%, 30%, 20%, and 10% of the total data. We implemented the traditional machine-learning models, a time-dependent baseline model, and deep-learning models on all these training and test split ratios. We selected the best-performing algorithms and examined the minimum training and test split ratios for which they returned satisfactory results based on the F1 and R-squared values of the models on the test data.
3.4. Traditional Machine-Learning Models
The traditional machine-learning models used in this study were designed to make a categorical prediction of the participant’s mental workload based on the assumption that the outcome of each time point was independent and identically distributed. Within the traditional machine-learning methods, we utilized logistic regression as a baseline model using scikit-learn’s logistic regression function on the training data set, which used the one-vs-rest (OvR) scheme to model multiclass output. Random forest is an ensemble-learning technique in which many decision trees are used to provide solutions, and was shown to perform well in previous work [11]. The scikit-learn random forest implementation was used for this purpose, with the number of decision trees set to 1000. K-nearest neighbors (KNN) classifies the outcome on new data based on the k-nearest training examples. We used the scikit-learn k-nearest neighbors function to model KNN on our data set, with 3 as the number of neighbors using the Euclidean distance metric.
3.5. Time-Dependent Baseline Model
Given the temporal nature of the data, we utilized the Markov-switching dynamic regression model [48] in Stata as a temporal baseline model. This is an interpretable machine-learning model that describes how an outcome changes its state over time. At their most basic level, Markov models predict a current state based on the previous state and a transition probability matrix. Markov-switching models build upon this by allowing incorporation of state-specific relationships, thereby improving our understanding of how the physiological parameters related to mental effort within each state. Given our interest in a device that was able to distinguish between high and low states of mental effort, we utilized a 2-state Markov-switching model that allowed for switching effects and variances, which was shown to be successful in a previous work [49].
3.6. Deep-Learning Models
Deep-learning models are based on artificial neural network models in which many hidden neurons arranged in multiple layers extract features from raw data and adjust their weights to best predict the output. We implemented deep-learning models using Python’s Keras library. For this study, we implemented three deep-learning models on our data set.
Convolutional neural networks (CNNs) [50] take advantage of the hierarchical pattern in data for regularization. They employ a mathematical operation called convolution in one of the layers. They consist of multiple layers such as the convolutional layer, the pooling layer, the rectified linear unit (ReLU) correction layer, and the fully connected layer. Earlier researchers [51] demonstrated the use of CNNs for time-series modeling using convolution and pooling operations. To model CNN for time-series forecasting, we divided the sequence into multiple input/output patterns called samples, with 10 time steps as input and 1 time step as output for the next-step prediction that was learned by the model.
Recurrent neural networks (RNNs) [52] are used to model temporal sequences. They have feedback loops in the recurrent layers that help them maintain information in ‘memory’ over time, but they are unable to learn long-term memory dependencies. We implemented an RNN using Keras sequential model [53] implementation in Python with one hidden RNN layer of 10 neurons and one dense output layer. We used the default batch size of 32 and the number of epochs was 10, with the mean absolute error as the performance metric and ‘adam’ [54] as an optimization technique.
Long short-term memory (LSTM) [55] is an extension to the RNN architecture that overcomes the vanishing gradient problem encountered in RNN that enables it to have a long-term memory. We implemented LSTM using Keras sequential model [53] implementation in Python with 1 hidden LSTM layer of 10 neurons and 1 dense output layer. We used the default batch size of 32 and number of epochs was 10, with the mean absolute error as a performance metric and ‘adam’ [54] as an optimization technique.
4. Results
4.1. Interpretive Modeling
To begin exploring the relationships between the physiological features and self-reported mental effort, we first inspected the parameter estimates from our interpretable machine-learning models: logistic regression (ordinal logit link) (Table 2) and the two-state Markov-switching dynamic regression (Table 3). The logistic-regression model suggested that although all of the features were highly significant due to the large number of time samples, EDA and skin temperature had the biggest effect sizes. Specifically, the model indicated that a higher EDA was indicative of a higher level of mental effort (odds ratio (OR) = 2.48, p < 0.001), while a drop in skin temperature may be indicative of higher levels of mental effort (OR = 0.82, p < 0.001). Of the three acceleration axes, acceleration in the Y and Z directions may be indicative of mental effort, with negative (OR = 0.99, p < 0.001) and positive (OR = 1.01, p < 0.001) relationships, respectively.
Table 2.
Parameter estimates from the ordinal logistic regression model (threshold values omitted).
Table 3.
Parameter estimates for the two-state Markov-switching dynamic regression model.
The two-state Markov switching model expanded on this story by providing a glimpse of the relative effects of these features in low and high mental effort states. When the participant was in a low mental effort state (State 1), it appeared that skin temperature was the most important physiological response indicator, with lower values indicative of higher levels of mental effort (estimate = −0.057, standard error (SE) = 0.0018, Z = −32.4, p < 0.001). In this state of lower mental effort, EDA (estimate = −0.274, SE = 0.028, Z = −9.8, p < 0.001) tended to go down with increasing mental effort. This relationship switched, however, when the participant entered the high mental effort state (State 2), with higher EDA values indicating higher levels of mental effort (estimate = 0.96, SE = 0.0175, Z = 55.0, p < 0.001). In this state, we also observed that the effect of skin temperature retained its negative relationship, but the strength of the association became stronger (estimate = −0.27, SE = 0.0014, Z = −194.0, p < 0.001). As far as movement was concerned, in the low mental effort state, movement tended to have a positive relationship with mental effort. While this positive relationship was retained for acceleration in the X direction when the participant entered the higher mental workload state, acceleration in the Y and Z directions switched to being indicators of lower mental workload. From these relationships, it appeared that motion of the arms tended to increase with mental workload until the point when the participant entered a state of more intense concentration (higher mental effort), at which time movement slowed down as concentration further increased.
4.2. Forecasting Mental Effort Using the Traditional Machine-Learning Models
Looking at the results of logistic regression as shown in Table 4, we found that with this model, the maximum R-squared and F1 values for the test data were achieved for 80:20 train and test split ratios. The F1 score and R-squared for the test data increased marginally as the test set ratio decreased from 70% to 40%, after which they decreased further for the 30% test ratio. For the 20% test ratio, they again increased and then decreased for the 10% test ratio. The difference in the number of transitions predicted on the test data and the actual number of transitions reduced with the decrease in the test set ratio.
Table 4.
Forecasting efficacy of the logistic regression model for different training and testing partitions.
After implementing the random forest algorithm, the results given in Table 5 showed that the F1 score was very low and the R-squared value was negative for all train and test split ratios, which indicated poor performance of this model on our data set and indicated overfitting on the training data set [56]. The difference in the number of transitions predicted on the test data and the actual number of transitions were also very high, which indicated that random forest was not able to predict the transitions in the test data set.
Table 5.
Forecasting efficacy of the random forest model for different training and testing partitions.
The results of KNN implementation on our data set, as shown in Table 6, demonstrated that the F1 score was very low and the R-squared value was negative for all the train and test split ratios, which again indicated that the model overfitted the training data and performed very poorly on the test data set. The difference in the number of transitions predicted on the test data and the actual number of transitions was also very high as compared to that with logistic regression.
When we implemented logistic regression, KNN, and random forest as machine-learning models on our data set with different train and test split ratios, we found that these models performed poorly on the test data and were not good models for time-series modeling and predicting the transitions from one activity to another. However, the predictions of the logistic regression model were stationary across time (Figure 1), and provided a useful starting point for understanding the relationship between the physiological measures and mental effort and the relative importance of the respective features in the prediction of mental effort.
Table 6.
Forecasting efficacy of the k-nearest neighbors (k = 3) model for different training and testing partitions.
Table 6.
Forecasting efficacy of the k-nearest neighbors (k = 3) model for different training and testing partitions.
| Train % | Test % | Test Data | ||||
|---|---|---|---|---|---|---|
| First | Last | F1 | RMSE | No. of Transitions Present in the Test Set | No. of Transitions Detected | R-Squared * |
| 10 | 90 | 0.10 | 3.17 | 73 | 177,875 | 0 |
| 20 | 80 | 0.10 | 2.94 | 65 | 176,784 | 0 |
| 30 | 70 | 0.16 | 2.87 | 58 | 165,135 | 0 |
| 40 | 60 | 0.16 | 2.81 | 51 | 146,844 | 0 |
| 50 | 50 | 0.17 | 2.72 | 42 | 124,335 | 0 |
| 60 | 40 | 0.17 | 2.68 | 32 | 99,789 | 0 |
| 70 | 30 | 0.19 | 2.48 | 24 | 74,603 | 0 |
| 80 | 20 | 0.21 | 2.40 | 16 | 49,196 | 0 |
| 90 | 10 | 0.22 | 2.21 | 8 | 24,564 | 0 |
* R-squared for test data was negative and therefore set to 0.
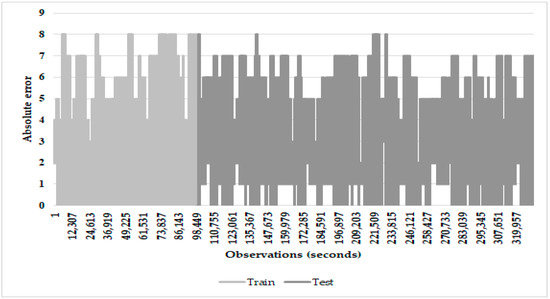
Figure 1.
Absolute error versus observations in seconds for the logistic regression model with a 30%/70% training/testing split.
4.3. Forecasting Mental Effort Using the Time-Dependent Baseline Model
After implementing a two-state Markov-switching effects model, the results as shown in Table 7 indicated that this model offered a marked improvement over logistic regression. The highest F1 score (F1 = 0.33) was calculated with a 50:50 train test ratio, which carried a root-mean-square error (RMSE) of 1.06 and an R-squared value of 0.75. The relatively low RMSE indicated that although many of the predictions missed the user’s self-reported level of mental effort, these were nonetheless close in proximity, which is an important consideration for an ordinal measure. R-squared values between 0.44 and 0.76 were obtained across all train and test split ratios. Although the model predicted many transitions that did not actually occur in the data, the predictions offered by this model were smoother than those offered by the logistic regression model. Inspection of the absolute error over time (Figure 2) indicated that efficacy for prediction remained stationary across time.
Table 7.
Forecasting efficacy of the two-state Markov-switching effects dynamic regression model for different training and testing partitions.
Table 7.
Forecasting efficacy of the two-state Markov-switching effects dynamic regression model for different training and testing partitions.
| Train % | Test % | Test Data | ||||
|---|---|---|---|---|---|---|
| First | Last | F1 | RMSE | No. of Transitions Present in the Test Set | No. of Transitions Detected | R-Squared * |
| 10 | 90 | 0.24 | 1.46 | 73 | 37,639 | 0.62 |
| 20 | 80 | 0.06 | 1.78 | 65 | 6624 | 0.44 |
| 30 | 70 | 0.30 | 1.18 | 58 | 12,658 | 0.73 |
| 40 | 60 | 0.31 | 1.11 | 51 | 9968 | 0.74 |
| 50 | 50 | 0.33 | 1.06 | 42 | 6615 | 0.75 |
| 60 | 40 | 0.30 | 1.04 | 32 | 3967 | 0.76 |
| 70 | 30 | 0.26 | 1.00 | 24 | 2567 | 0.72 |
| 80 | 20 | 0.31 | 0.88 | 16 | 2205 | 0.75 |
| 90 | 10 | 0.22 | 0.95 | 8 | 830 | 0.61 |
* R-squared for test data.
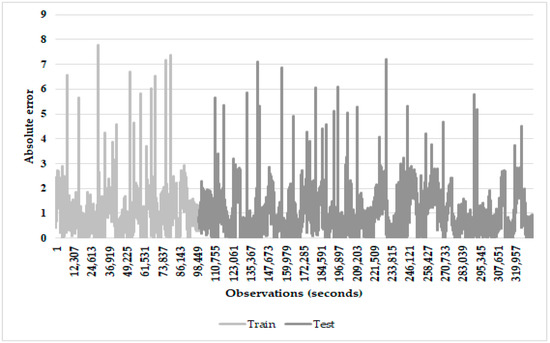
Figure 2.
Absolute error versus observations in seconds for the two-state Markov-switching dynamic regression model with a 30%/70% training/testing split.
4.4. Forecasting Mental Effort Using the Deep-Learning Models
The LSTM algorithm, as shown in Table 8, depicted that the F1 and R-squared values were about 0.99 for all test and train split ratios. This model was able to predict the number of transitions in the test data set accurately for the train ratio of 30% and above. However, after examining the graph of absolute error versus observations in seconds (Figure 3), it was found that the transition was not predicted correctly at the exact moment when it occurred, but rather predicted it a step later.
Table 8.
Forecasting efficacy of the LSTM model for different training and testing partitions.
Table 8.
Forecasting efficacy of the LSTM model for different training and testing partitions.
| Train % | Test % | Test Data | ||||
|---|---|---|---|---|---|---|
| First | Last | F1 | RMSE | No. of Transitions Present in the Test Set | No. of Transitions Detected | R-Squared * |
| 10 | 90 | 0.9998 | 0.22 | 73 | 413 | 0.99 |
| 20 | 80 | 0.9998 | 0.18 | 65 | 71 | 0.99 |
| 30 | 70 | 0.9998 | 0.13 | 58 | 58 | 0.9967 |
| 40 | 60 | 0.9997 | 0.13 | 51 | 51 | 0.9967 |
| 50 | 50 | 0.9997 | 0.09 | 42 | 42 | 0.9983 |
| 60 | 40 | 0.9998 | 0.08 | 32 | 32 | 0.9985 |
| 70 | 30 | 0.9998 | 0.07 | 24 | 24 | 0.9987 |
| 80 | 20 | 0.9998 | 0.06 | 16 | 16 | 0.999 |
| 90 | 10 | 0.9998 | 0.05 | 8 | 8 | 0.9989 |
* R-squared for test data.
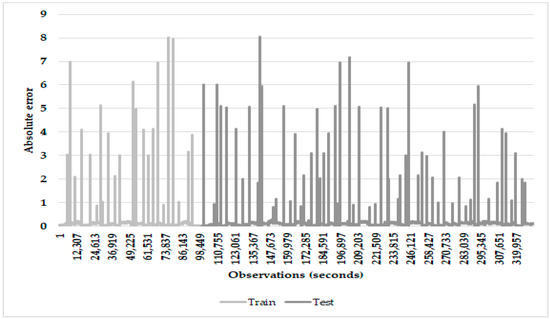
Figure 3.
Absolute error versus observations in seconds for the LSTM with a 30%/70% training/testing split.
The RNN results (Table 9) showed that when the training ratio was 40% and above, the number of transitions predicted for the test data and the actual number of transitions were equal. Similarly to LSTM, the transition was not predicted at the exact moment when it occurred in the test data set. The F1 score and R-squared for the data test set was about 0.99 at a test ratio of 40% and above.
Table 9.
Forecasting efficacy of the RNN model for different training and testing partitions.
CNNs were not originally developed for time-series modeling, but the layers can be defined in a way to support time-series-based predictions. When we implemented the CNN, the results as shown in Table 10 indicated that there was a significant difference in the number of transitions predicted on the test data and the actual number of transitions; however, the high R-squared values (>0.9 for when 20% or more of the initial data were used for training) and RMSE below 1 indicated that missed predictions tended to be quite close in proximity to the actual reported values. The prediction efficacy improved steadily as the proportion of training data increased. When more than 50% of the initial values were used for training, F1 scores above 0.9 were achieved, indicating that CNNs could be potentially useful for forecasting.
Table 10.
Forecasting efficacy of the CNN model for different training and testing partitions.
5. Discussion
Previous work has demonstrated both the utility and limitations of the current state of the art of the EduFit system: using wearables to facilitate near real-time monitoring of mental effort. A cross-sectional study with multiple participants showed that learning activity, as well as whether or not a participant was in a high mental effort state, could be predicted accurately, and that ensemble models such as random forest showed the greatest utility for prediction, even when training sets were comparatively limited [11]. However, in all cases, the attempt to predict a person’s mental effort using another person’s physiological data was met with limited success, even when the data were normalized with respect to the individual’s unique average and variability. With regards to moving forward with the effort to develop an automated tracker for mental effort, this showed that it is currently unrealistic to develop and implement a pretrained universal algorithm for the prediction of mental effort; individual variability in physiology and its relationship with mental effort is too great for such an algorithm to work well. We therefore began this study by hypothesizing that an individual could train their own device through the fusion of physiological data and manual entry of self-reported mental effort on various tasks through a web or smartphone application. The key question was: how long would it take to adequately train a device on an individual, and which machine-learning approaches are most useful in generating accurate predictions into the future?
Although random forest was the best-performing algorithm in previous work, it was among the worst-performing algorithms for forecasting the participant’s mental workload in this study. Although the RMSE dropped consistently as more training data were added, the R-squared value for the testing set was negative in all cases, implying that simply using the participant’s most commonly reported mental effort state performed better as a predictor than the random forest model. This meant that although random forest may have worked well for interpolation between time points, it lacked efficacy for forecasting due to overfitting. Within the scope of traditional machine-learning approaches, logistic regression actually performed better, showing low, but nonetheless positive, R-squared values, indicating that it tended to perform better in forecasting situations than simply using the most commonly reported mental effort level as the sole predictor. The statistical significance of the physiological and activity measures in the logistic regression model (Table 2) also testified to this.
Within the scope of models that account for time dependency, the two-state Markov-switching dynamic regression model performed relatively well as a baseline model, with the first 30% of the data being sufficient to train the model to forecast the remainder of the data, with an RMSE around 1 and an R-squared value above 0.7. This model was simple to implement and carried interpretability, but the deep-learning algorithms showed better performance. With the first 30% of data used for training, LSTM converged to an R-squared of above 0.99, and was able to model all transitions remaining in the data. The absence of short-term memory in the RNN meant that it took slightly longer to train, with an extra 10% of training data needed to reach the level of performance of the LSTM. As seen in Figure 1 and Figure 3, the reliance on previous observations in making predictions caused them to model the transition a short time after the transition in mental effort actually occurred. This was where the efficacy of the CNN may have come into play—its less strict temporal dependency meant that it was less dependent on immediately previous data, including transitions in the data, and so it provided predictions that were relatively independent of the immediate transitions that were occurring. Although the CNN’s predictions indicated many transitions in the data that did not actually occur, the high R-squared value, low RMSE, and high F1 scores indicated that the predictions were relatively close to the actual reported level of mental effort, reaching the best performance when 50% or more of the data were used for training. A next step in the research will be to develop a way to combine the CNN and LSTM models such that both smoothness of the predictions and the ability of the system to capture transitions when they occur can be optimized.
6. Conclusions
The objective of conducting this study was to train a device to predict cognitive load into the future, and for detecting the transition from one level of mental effort to another. Our research findings included the amount of data it took to train a device to accurately detect an individual’s level of mental effort into the future, and that deep-learning methods are the most effective algorithms in making accurate longitudinal predictions.
Earlier studies [11,49] focused on using physiological measures for measuring overall cognitive load and leveraging machine learning to predict mental effort. Similar to [49], in this study, we focused on data from one student; however, in this study we focused on the efficacy of self-training their device by focusing on merging self-report data and the sensor data to predict their cognitive load in the future and detect transitions from one activity to another. In addition to traditional machine-learning algorithms, we experimented with deep-learning methods and found that these algorithms performed well in predicting mental effort of a student into the future; however, further work is needed in order to better detect transitions in mental effort.
Despite an abundance of literature documenting meaningful relationships between physiological changes and cognitive load, our analysis showed that predicting mental effort was not as straightforward as making predictions around physical processes such as exercise and sleep. It is unlikely that we will find a single model that will work well for everybody, and so the EduFit framework will necessarily rely on the willingness of an individual to train their own device with respect to their lifestyle and individual interpretation of their mental effort. Our models suggested that the first 30% of the data, which equates to 33 activity transitions over approximately 28 h of data collection, was sufficient to train a deep-learning model to make useful predictions for an additional 65 h when the measures were sampled at 1 measurement per second. Since these data were collected across a semester-long (approximately 3 months) timeframe, we feel reasonably confident that deep learning may represent a promising approach for fusing self-report and sensor data to create a useful mental-effort tracking system. However, testing over a longer period of time may be necessary before we can draw conclusions around how this type of model would perform over years, which is more representative of the duration of a program of study.
Author Contributions
Experimental design, J.G. and W.R.; data collection, J.G.; data management, J.G. and A.A.; data analysis, A.A. and W.R.; literature review, N.S. All authors were involved in the writing, final review and approval of the manuscript. All authors have read and agreed to the published version of the manuscript.
Funding
J.G. was supported by the National Science Foundation under grant no. 1742339.
Institutional Review Board Statement
The study was conducted in accordance with the Declaration of Helsinki, and the protocol was approved by the Ethics Committee of Wright State University (06046).
Informed Consent Statement
Informed consent was obtained from all subjects involved in the study.
Data Availability Statement
Data are available upon request by contacting the corresponding author. Data are not publicly available due to privacy restrictions.
Conflicts of Interest
The authors declare no conflict of interest.
References
- Nuss, K.; Moore, K.; Nelson, T.; Li, K. Effects of Motivational Interviewing and Wearable Fitness Trackers on Motivation and Physical Activity: A Systematic Review. Am. J. Health Promot. 2021, 35, 226–235. [Google Scholar] [CrossRef]
- Brickwood, K.J.; Watson, G.; O’Brien, J.; Williams, A.D. Consumer-Based Wearable Activity Trackers Increase Physical Activity Participation: Systematic Review and Meta-Analysis. JMIR mHealth uHealth 2019, 7, e11819. [Google Scholar] [CrossRef] [PubMed]
- Schwartz, F.L.; Marling, C.R.; Bunescu, R.C. The Promise and Perils of Wearable Physiological Sensors for Diabetes Management. J. Diabetes Sci. Technol. 2018, 12, 587–591. [Google Scholar] [CrossRef] [PubMed] [Green Version]
- Rodriguez-León, C.; Villalonga, C.; Munoz-Torres, M.; Ruiz, J.R.; Banos, O. Mobile and Wearable Technology for the Monitoring of Diabetes-Related Parameters: Systematic Review. JMIR mHealth uHealth 2021, 9, e25138. [Google Scholar] [CrossRef]
- Zhou, Z.X.; Tam, V.; Lui, K.S.; Lam, E.Y.; Yuen, A.; Hu, X.; Law, N. Applying Deep Learning and Wearable Devices for Educational Data Analytics. In Proceedings of the 2019 IEEE 31st International Conference on Tools with Artificial Intelligence (ICTAI), Portland, OR, USA, 4–6 November 2019; pp. 871–878. [Google Scholar]
- Zhou, Z.X.; Tam, V.; Lui, K.S.; Lam, E.Y.; Hu, X.; Yuen, A.; Law, N. A Sophisticated Platform for Learning Analytics with Wearable Devices. In Proceedings of the 2020 IEEE 20th International Conference on Advanced Learning Technologies (ICALT), Tartu, Estonia, 6–9 July 2020; pp. 300–304. [Google Scholar]
- Gal, R.; May, A.M.; van Overmeeren, E.J.; Simons, M.; Monninkhof, E.M. The Effect of Physical Activity Interventions Comprising Wearables and Smartphone Applications on Physical Activity: A Systematic Review and Meta-Analysis. Sports Med. Open 2018, 4, 42. [Google Scholar] [CrossRef] [PubMed]
- Davergne, T.; Pallot, A.; Dechartres, A.; Fautrel, B.; Gossec, L. Use of Wearable Activity Trackers to Improve Physical Activity Behavior in Patients with Rheumatic and Musculoskeletal Diseases: A Systematic Review and Meta-Analysis. Arthritis Care Res. 2019, 71, 758–767. [Google Scholar] [CrossRef]
- Mehmood, R.; Lee, H. Towards Building a Computer Aided Education System for Special Students Using Wearable Sensor Technologies. Sensors 2017, 17, 317. [Google Scholar] [CrossRef] [PubMed]
- Liang, J.M.; Su, W.C.; Chen, Y.L.; Wu, S.L.; Chen, J.J. Smart Interactive Education System Based on Wearable Devices. Sensors 2019, 19, 3260. [Google Scholar] [CrossRef] [Green Version]
- Romine, W.L.; Schroeder, N.L.; Graft, J.; Yang, F.; Sadeghi, R.; Zabihimayvan, M.; Kadariya, D.; Banerjee, T. Using Machine Learning to Train a Wearable Device for Measuring Students’ Cognitive Load during Problem-Solving Activities Based on Electrodermal Activity, Body Temperature, and Heart Rate: Development of a Cognitive Load Tracker for Both Personal and Classroom Use. Sensors 2020, 20, 4833. [Google Scholar]
- Sun, J.; Liu, Y. Using Smart Bracelets to Assess Heart Rate Among Students During Physical Education Lessons: Feasibility, Reliability, and Validity Study. JMIR mHealth uHealth 2020, 8, e17699. [Google Scholar] [CrossRef]
- Evmenova, A.S.; Graff, H.J.; Genaro Motti, V.; Giwa-Lawal, K.; Zheng, H. Designing a Wearable Technology Intervention to Support Young Adults with Intellectual and Developmental Disabilities in Inclusive Postsecondary Academic Environments. J. Spec. Educ. Technol. 2019, 34, 92–105. [Google Scholar] [CrossRef]
- Madeira, C.A.; Quintana, R.M.; Slotta, J.D. Wearable Technology for Teachers: Support for Classroom Orchestration. In Proceedings of the Annual Meeting of the American Educational Research Association, Washington, DC, USA, 8–12 April 2016. AERA Online Paper Repository. [Google Scholar]
- Jacob, S.; Ishimaru, S.; Dengel, A. Interest Detection While Reading Newspaper Articles by Utilizing a Physiological Sensing Wristband. In Proceedings of the 2018 ACM International Joint Conference and 2018 International Symposium on Pervasive and Ubiquitous Computing and Wearable Computers, Singapore, 8–12 October 2018; pp. 78–81. [Google Scholar]
- Zhu, Z.; Ober, S.; Jafari, R. Modeling and Detecting Student Attention and Interest Level Using Wearable Computers. In Proceedings of the 2017 IEEE 14th International Conference on Wearable and Implantable Body Sensor Networks (BSN), Eindhoven, The Netherlands, 9–12 May 2017; pp. 13–18. [Google Scholar]
- Cain, R.; Lee, V.R. Measuring Electrodermal Activity to Capture Engagement in an Afterschool Maker Program. In Proceedings of the 6th Annual Conference on Creativity and Fabrication in Education, Stanford, CA, USA, 14–16 October 2016; pp. 78–81. [Google Scholar]
- Terriault, P.; Kozanitis, A.; Farand, P. Use of Electrodermal Wristbands to Measure Students’ Cognitive Engagement in the Classroom. In Proceedings of the Canadian Engineering Education Association (CEEA), Charlottetown, PE, Canada, 20–23 June 2021. [Google Scholar] [CrossRef]
- Camacho, V.L.; de la Guia, E.; Olivares, T.; Flores, M.J.; Orozco-Barbosa, L. Data Capture and Multimodal Learning Analytics Focused on Engagement with a New Wearable IoT Approach. IEEE Trans. Learn. Technol. 2020, 13, 704–717. [Google Scholar] [CrossRef]
- Wiberg, H.; Nilsson, E.; Lindén, P.; Svanberg, B.; Poom, L. Physiological Responses Related to Moderate Mental Load during Car Driving in Field Conditions. Biol. Psychol. 2015, 108, 115–125. [Google Scholar] [CrossRef] [PubMed]
- Charles, R.L.; Nixon, J. Measuring Mental Workload Using Physiological Measures: A Systematic Review. Appl. Ergon. 2019, 74, 221–232. [Google Scholar] [CrossRef] [PubMed]
- Kramer, A.F. Physiological Metrics of Mental Workload: A Review of Recent Progress. In Multiple-Task Performance; CRC Press: Boca Raton, FL, USA, 2020; pp. 279–328. [Google Scholar]
- De Waard, D. The Measurement of Drivers’ Mental Workload; The Traffic Research Centre VSC, University of Groningen: Groningen, The Netherlands, 1996. [Google Scholar]
- De Avila, U.E.R.; de França Campos, F.R. 15 Minutes of Attention in Class: Variability of Heart Rate, Personality, Emotion and Chronotype. Creat. Educ. 2019, 10, 2428–2447. [Google Scholar] [CrossRef] [Green Version]
- Di Lascio, E.; Gashi, S.; Santini, S. Unobtrusive Assessment of Students’ Emotional Engagement during Lectures Using Electrodermal Activity Sensors. Proc. ACM Interact. Mob. Wearable Ubiquitous Technol. 2018, 2, 103. [Google Scholar] [CrossRef]
- Zhang, H.; Zhu, Y.; Maniyeri, J.; Guan, C. Detection of Variations in Cognitive Workload Using Multi-Modality Physiological Sensors and a Large Margin Unbiased Regression Machine. In Proceedings of the 2014 36th Annual International Conference of the IEEE Engineering in Medicine and Biology Society, Chicago, IL, USA, 26–30 August 2014; pp. 2985–2988. [Google Scholar]
- Giannakos, M.N.; Sharma, K.; Papavlasopoulou, S.; Pappas, I.O.; Kostakos, V. Fitbit for Learning: Towards Capturing the Learning Experience Using Wearable Sensing. Int. J. Hum. Comput. Stud. 2020, 136, 102384. [Google Scholar] [CrossRef]
- Sweller, J. Cognitive Load Theory and Educational Technology. Educ. Technol. Res. Dev. 2020, 68, 1–16. [Google Scholar] [CrossRef]
- Sweller, J.; Chandler, P.; Kalyuga, S. Cognitive Load Theory; Springer: New York, NY, USA, 2011. [Google Scholar]
- Paas, F.; Sweller, J. Implications of cognitive load theory for multimedia learning. In The Cambridge Handbook of Multimedia Learning; Cambridge University Press: New York, NY, USA, 2014; pp. 27–42. [Google Scholar]
- Cowan, N. The Magical Mystery Four: How Is Working Memory Capacity Limited, and Why? Curr. Dir. Psychol. Sci. 2010, 19, 51–57. [Google Scholar] [CrossRef] [Green Version]
- Cowan, N. The Magical Number 4 in Short-Term Memory: A Reconsideration of Mental Storage Capacity. Behav. Brain Sci. 2001, 24, 87–114. [Google Scholar] [CrossRef] [Green Version]
- Ayres, P. Subjective measures of cognitive load: What can they reliably measure? In Cognitive Load Measurement and Application: A Theoretical Framework for Meaningful Research and Practice; Routledge/Taylor & Francis Group: New York, NY, USA, 2018; pp. 9–28. ISBN 978-1-138-23897-8. [Google Scholar]
- De Jong, T. Cognitive Load Theory, Educational Research, and Instructional Design: Some Food for Thought. Instr. Sci. 2010, 38, 105–134. [Google Scholar] [CrossRef] [Green Version]
- Schroeder, N.L.; Cenkci, A.T. Do Measures of Cognitive Load Explain the Spatial Split-Attention Principle in Multimedia Learning Environments? A Systematic Review. J. Educ. Psychol. 2019, 112, 254. [Google Scholar] [CrossRef]
- Sweller, J. Element Interactivity and Intrinsic, Extraneous, and Germane Cognitive Load. Educ. Psychol. Rev. 2010, 22, 123–138. [Google Scholar] [CrossRef]
- Leppink, J.; Paas, F.; Van der Vleuten, C.P.M.; Van Gog, T.; Van Merriënboer, J.J.G. Development of an Instrument for Measuring Different Types of Cognitive Load. Behav. Res. 2013, 45, 1058–1072. [Google Scholar] [CrossRef] [PubMed]
- Leppink, J.; Paas, F.; van Gog, T.; van der Vleuten, C.P.M.; van Merriënboer, J.J.G. Effects of Pairs of Problems and Examples on Task Performance and Different Types of Cognitive Load. Learn. Instr. 2014, 30, 32–42. [Google Scholar] [CrossRef]
- Sweller, J. The role of independent measures of load in cognitive load theory. In Cognitive Load Measurement and Application; Routledge: Oxfordshire, UK, 2018; pp. 3–7. ISBN 1-315-29625-X. [Google Scholar]
- Paas, F.G. Training Strategies for Attaining Transfer of Problem-Solving Skill in Statistics: A Cognitive-Load Approach. J. Educ. Psychol. 1992, 84, 429–434. [Google Scholar] [CrossRef]
- Antonenko, P.; Paas, F.; Grabner, R.; van Gog, T. Using Electroencephalography to Measure Cognitive Load. Educ. Psychol. Rev. 2010, 22, 425–438. [Google Scholar] [CrossRef]
- Cook, A.E.; Wei, W.; Preziosi, M.A. The use of ocular-motor measures in a convergent approach to studying cognitive load. In Cognitive Load Measurement and Application: A Theoretical Framework for Meaningful Research and Practice; Routledge/Taylor & Francis Group: New York, NY, USA, 2018; pp. 112–128. [Google Scholar]
- Lundervold, D.A.; Belwood, M.F. The best kept secret in counseling: Single-case (N=1) experimental designs. J. Couns. Dev. 2000, 78, 92–102. [Google Scholar] [CrossRef]
- Stake, R. The Art of Case Study Research; Sage Publications: New York, NY, USA, 1995. [Google Scholar]
- Morgan, D.L.; Morgan, R.K. Single-participant research design: Bringing science to managed care. Am. Psychol. 2001, 56, 119–127. [Google Scholar] [CrossRef]
- Foster, L.H. A best kept secret: Single-subject research design in counseling. Couns. Outcome Res. Eval. 2010, 1, 30–39. [Google Scholar] [CrossRef]
- Real-Time Physiological Signals. E4 EDA/GSR Sensor. Empatica. Available online: https://www.empatica.com/en-eu/research/e4/ (accessed on 20 November 2021).
- Hamilton, J.D. A new approach to the economic analysis of nonstationary time series and the business cycle. Econom. J. Econom. Soc. 1989, 57, 357–384. [Google Scholar] [CrossRef]
- Romine, W.; Schroeder, N.; Edwards, A.; Banerjee, T. Longitudinal Classification of Mental Effort Using Electrodermal Activity, Heart Rate, and Skin Temperature Data from a Wearable Sensor. In International Conference on Pattern Recognition; Springer: Cham, Switzerland, 2021; pp. 86–95. [Google Scholar]
- Albawi, S.; Mohammed, T.; Al-Zawi, S. Understanding of a convolutional neural network. In Proceedings of the 2017 International Conference on Engineering and Technology (ICET), Antalya, Turkey, 21–23 August 2017; pp. 1–6. [Google Scholar] [CrossRef]
- Zhao, B.; Lu, H.; Chen, S.; Liu, J.; Wu, D. Convolutional neural networks for time series classification. J. Syst. Eng. Electron. 2017, 28, 162–169. [Google Scholar] [CrossRef]
- Connor, J.; Les, A. Recurrent neural networks and time series prediction. In Proceedings of the IJCNN-91-Seattle International Joint Conference on Neural Networks, Seattle, WA, USA, 8–12 July 1991; Volume 1. [Google Scholar]
- Manaswi, N.K. Understanding and Working with Keras. In Deep Learning with Applications Using Python; Apress: Berkeley, CA, USA, 2018. [Google Scholar] [CrossRef]
- Kingma, D.P.; Jimmy, B. Adam: A method for stochastic optimization. arXiv 2014, arXiv:1412.6980. [Google Scholar]
- Hochreiter, S.; Schmidhuber, J. Long Short-Term Memory. Neural. Comput. 1997, 9, 1735–1780. [Google Scholar] [CrossRef] [PubMed]
- Dietterich, T. Overfitting and undercomputing in machine learning. ACM Comput. Surv. (CSUR) 1995, 27, 326–327. [Google Scholar] [CrossRef]
Publisher’s Note: MDPI stays neutral with regard to jurisdictional claims in published maps and institutional affiliations. |
© 2021 by the authors. Licensee MDPI, Basel, Switzerland. This article is an open access article distributed under the terms and conditions of the Creative Commons Attribution (CC BY) license (https://creativecommons.org/licenses/by/4.0/).