
The Potential of Ecological Distributed Energy Generation Systems, Situation, and Perspective for Poland


 and
and
Abstract
:1. Introduction
“Energy cannot be created or destroyed; it can only be changed from one form to another.” (Albert Einstein)
“Nothing is lost, nothing is created, everything is transformed.” (Antoine-Laurent de Lavoisier [1])
- To review the global energy situation with particular attention on the technologies that could be used as the ecological distributed energy generation systems;
- To review the technologies that could be used as ecological distributed energy generation systems from the perspective of Poland.
- (a)
- If the renewable energy sources could provide sufficient energy to replace the conventional energy sources (from global and Polish perspectives)?
- (b)
- What renewable energy sources are suitable as ecological distributed energy generation systems in Poland?
- (c)
- What are the most Strengths, Weaknesses, Opportunities, and Threats for the essential technologies to replace conventional energy sources in Poland?
- (d)
- What are the scenarios for energy production in Poland?
2. Materials and Methods
- Desk research—a literature review was performed on reports and academic publications obtained mainly from the digital libraries. The desk research results were used to prepare the global energy situation review, characteristics of the different energy sources that could be used in distributed power plants, and partly the current state of production and prognosis of energy in Poland. The desk research results were also used to prepare the CAWI survey used in the Delphi method to collect the information from participants.
- The Delphi method—was developed by RAND Corporation in 1950 [7]. The Delphi approach makes use of an interactive iterative technique to look for professionals in assess or behavior predictive research. The classical Delphi approach consists of 4 key features: anonymity, iteration, managed feedback, and statistical summary [8,9,10,11]. The CAWI method became used to guide the Delphi approach. The CAWI technique was used to support the Delphi method.
- The Computer-Assisted-Web Interview (CAWI) technique—authors used the method to collect experts’ opinions on energy sources in ecological distributed energy generation systems, especially their strengths, weaknesses, opportunities, and threats. A mostly five-point scale was used. The data were collected in two rounds. In the first round of the survey, mainly open-ended questions were included. Then in the second round, the survey included five-point scale questions to evaluate the most frequent factors from the first round. Finally, the authors analyzed the collected data to prepare the weighted SWOT
- The Weighted SWOT analysis—SWOT analysis is a widely used technique to map out the present Strengths (S), Weaknesses (W), Opportunities (O), and Threats (T). The SWOT Analysis has two main steps: listing the key internal strengths and weaknesses and listing the key external opportunities and threats. Because SWOT analysis is often subjective, the authors prepared a weighted SWOT score matrix, where the metrics are defined as below:
- ○
- Weight (W)—the relative importance of a given factor in the range from 0.00 to 1.00 (0.00—insignificant factor; 1.00—significant factor). The total weight −1.00;
- ○
- Rating (R)—on a scale from 1 to 5. The higher rating, the more like to attain;
- ○
- Weighted score—that was computed by multiplying each factor’s weight by its rating;
- ○
- Total Weighted Score (TWS) = (W) × (R);
- ○
- Internal Factors Ratio (IFR) = (S TWS)/(W TWS).
- ○
- General characteristics;
- Current usage;
- Possibility to use as a distributed powerplant;
- Usage potential;
- Levelized cost of energy (LCOE).
- “ACC, VOMC, FOMC, and FC—annualized capital costs, variable O & M costs, fixed O & M costs, and fuel costs.
- OC means a lump-sum investment of a facility ($/kW), and FXC is the annual fixed costs $/kW. CRF is the capacity recovery factor that converts the costs expressed in terms of capacity to the related costs in terms of energy. CAF is the capacity availability factor.
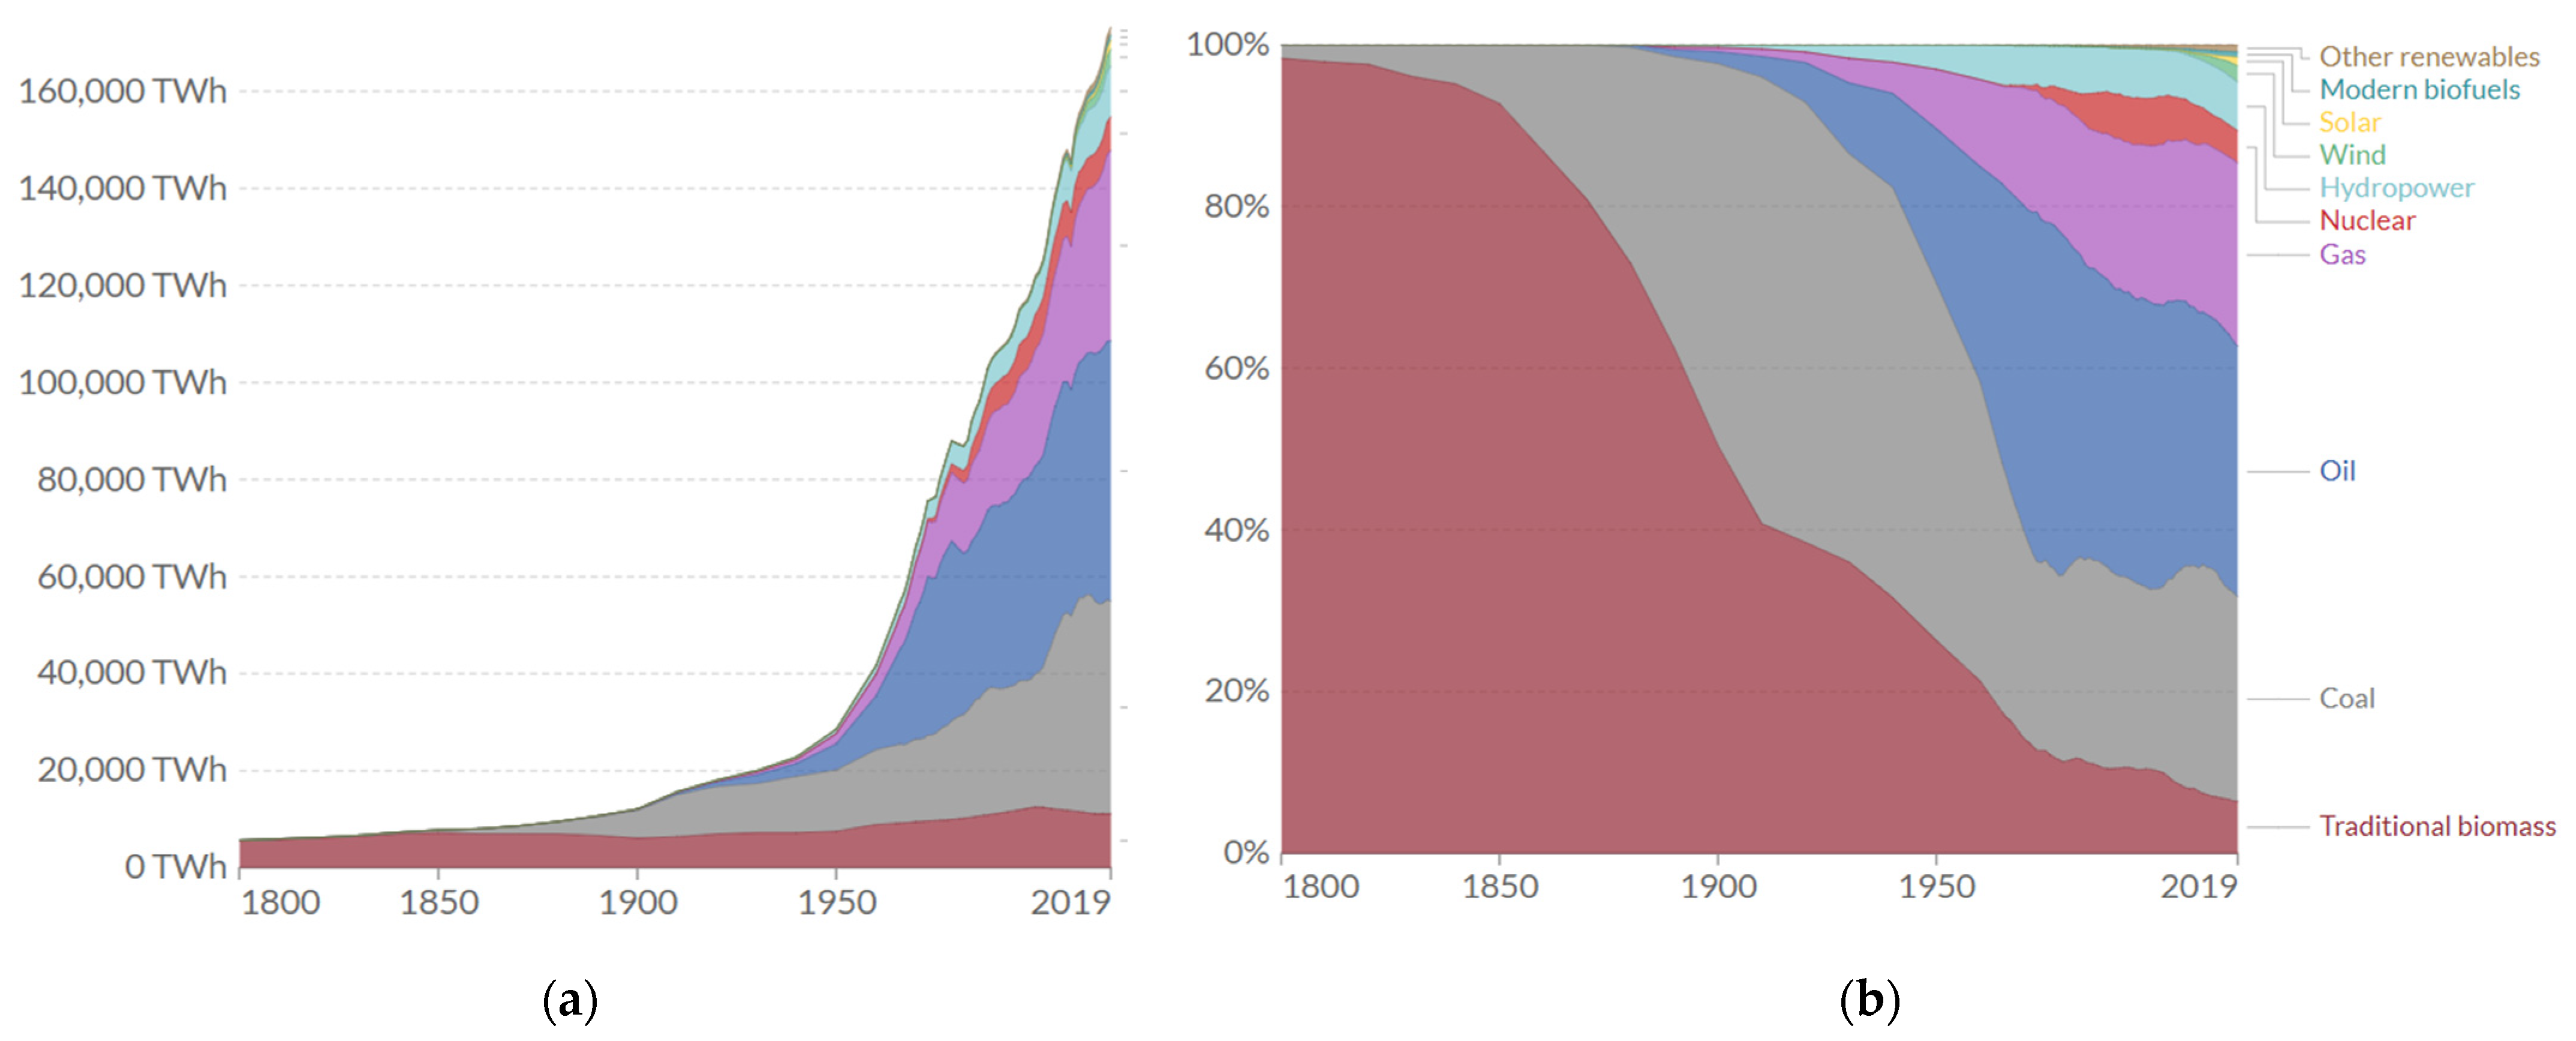
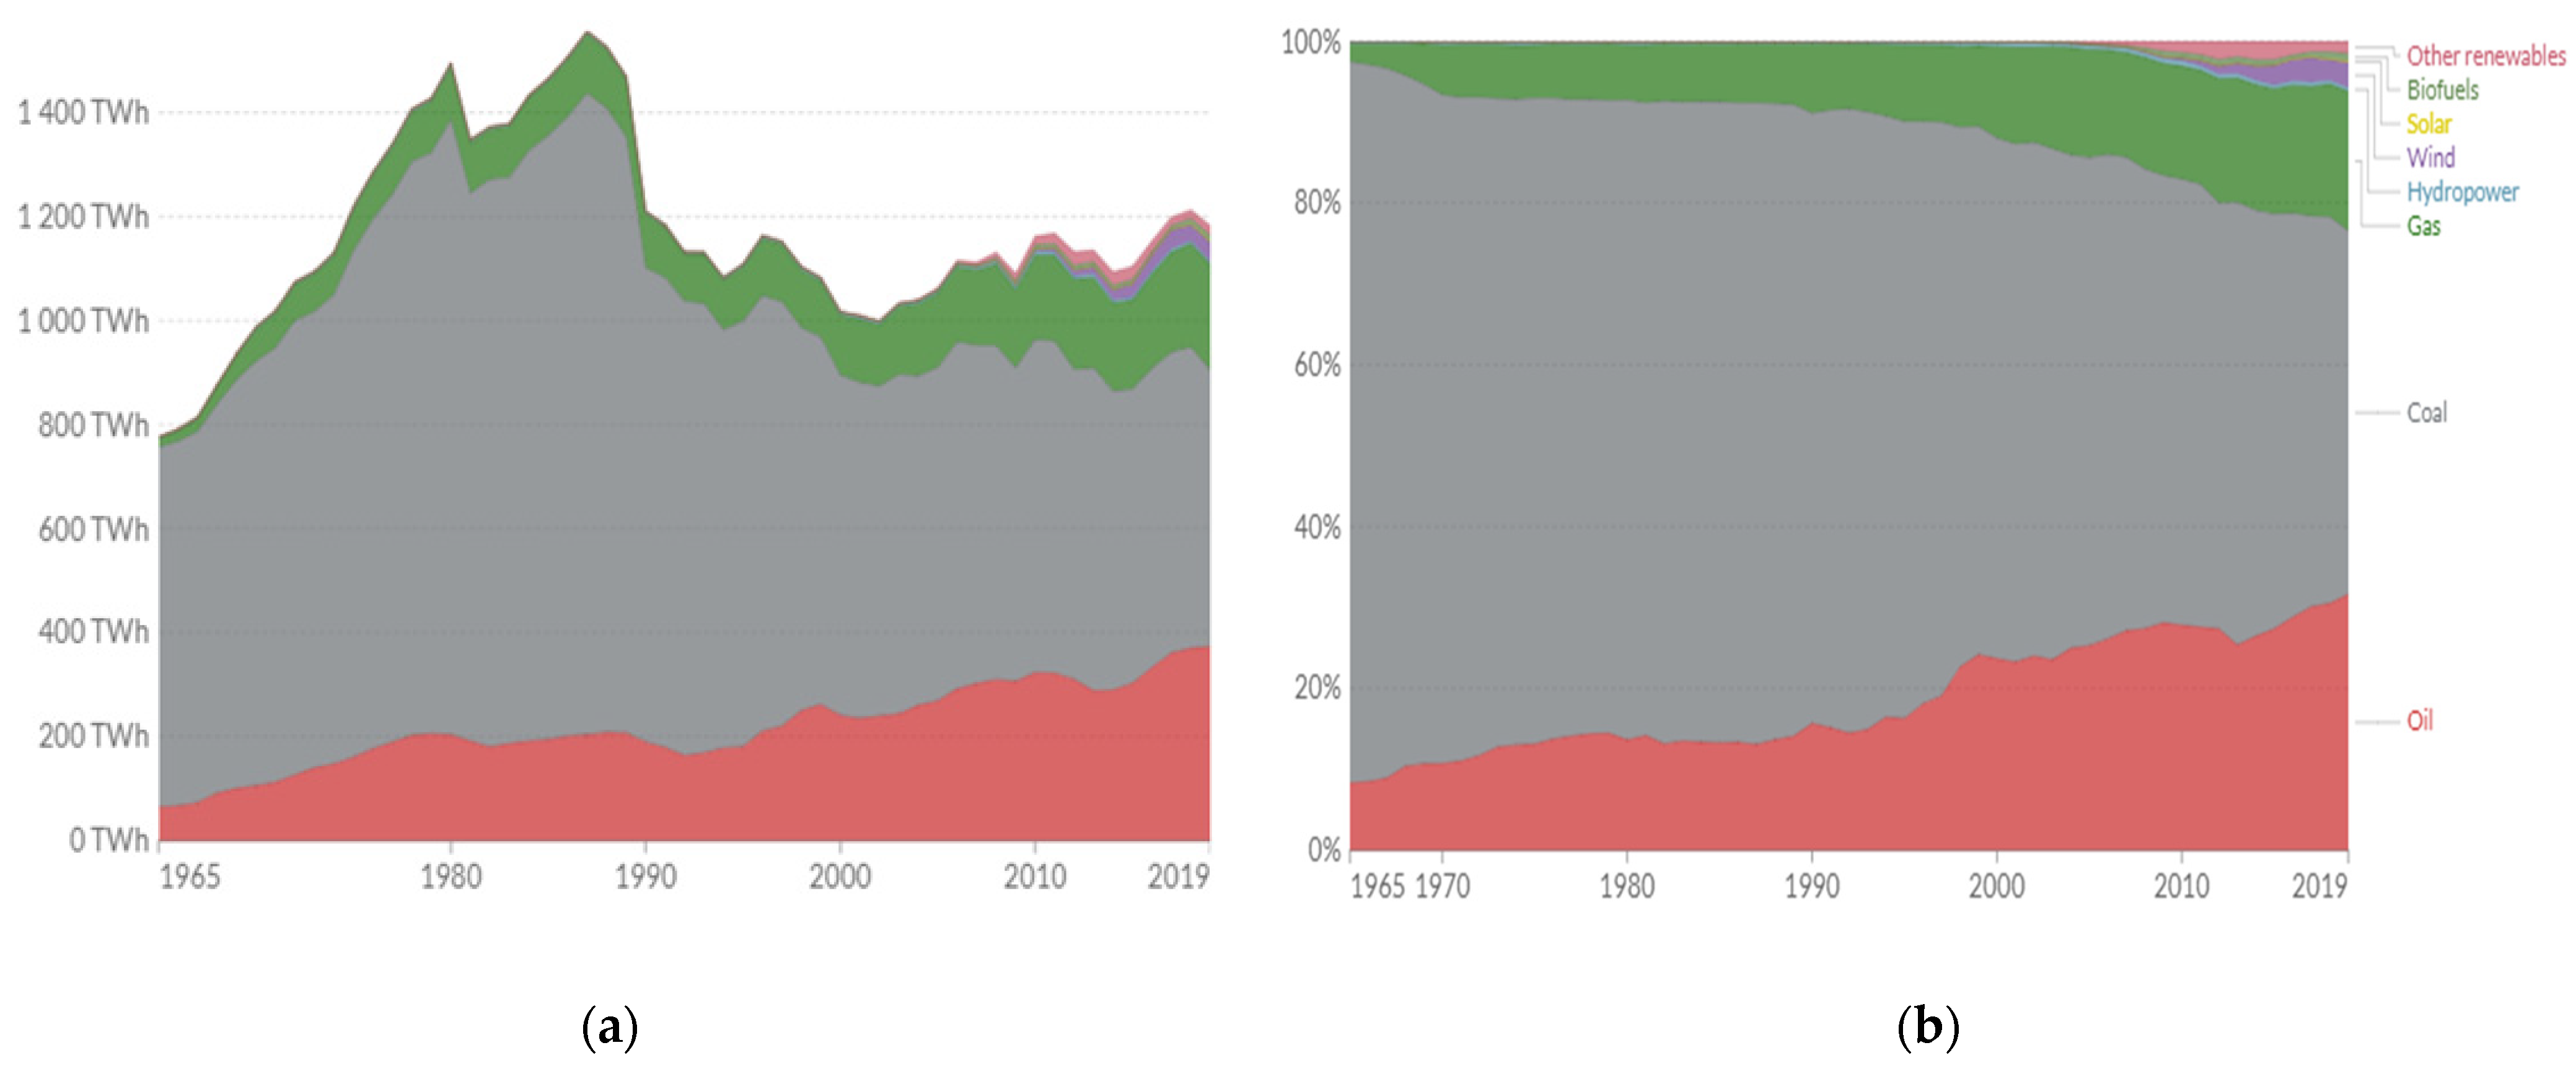
3. Global Energy Situation Review
4. Characteristics of the Different Energy Sources That Could Be Used in Ecological Distributed Energy Generation Systems
- Monocrystalline silicon (mono-Si) solar cells feature a single-crystal composition;
- Polycrystalline silicon cells that are made from cast square ingots—large blocks of molten silicon carefully cooled and solidified.
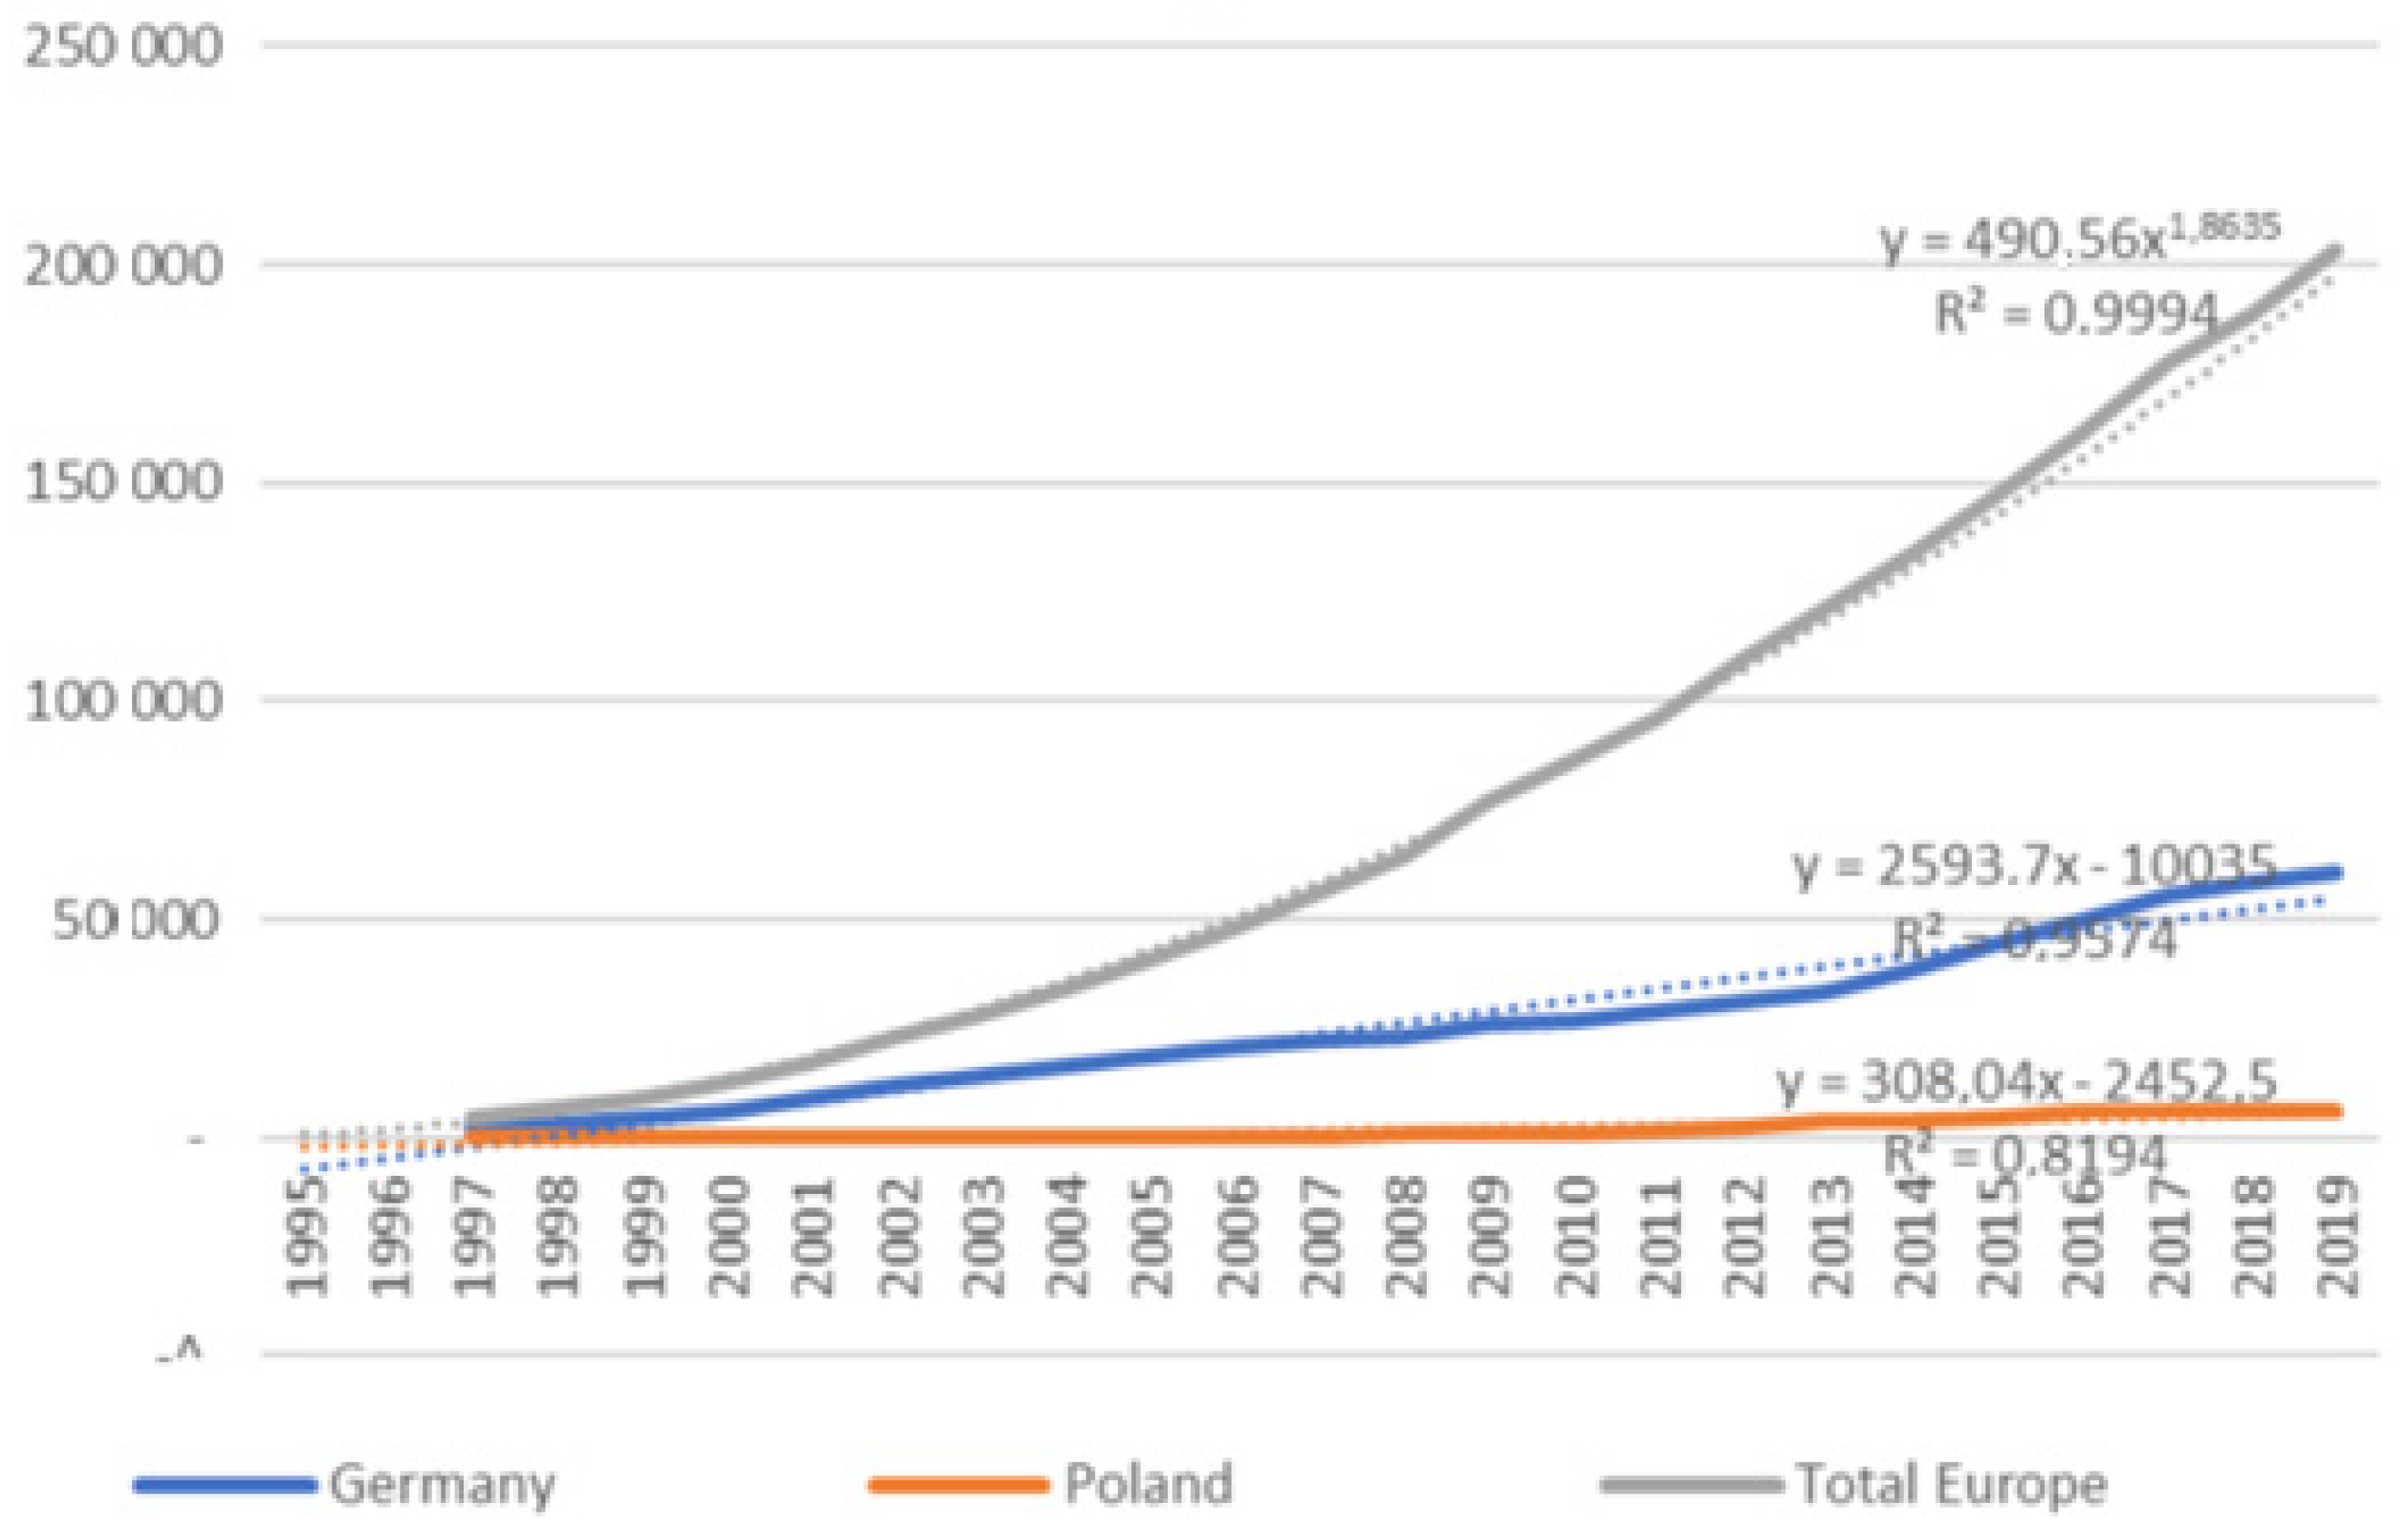
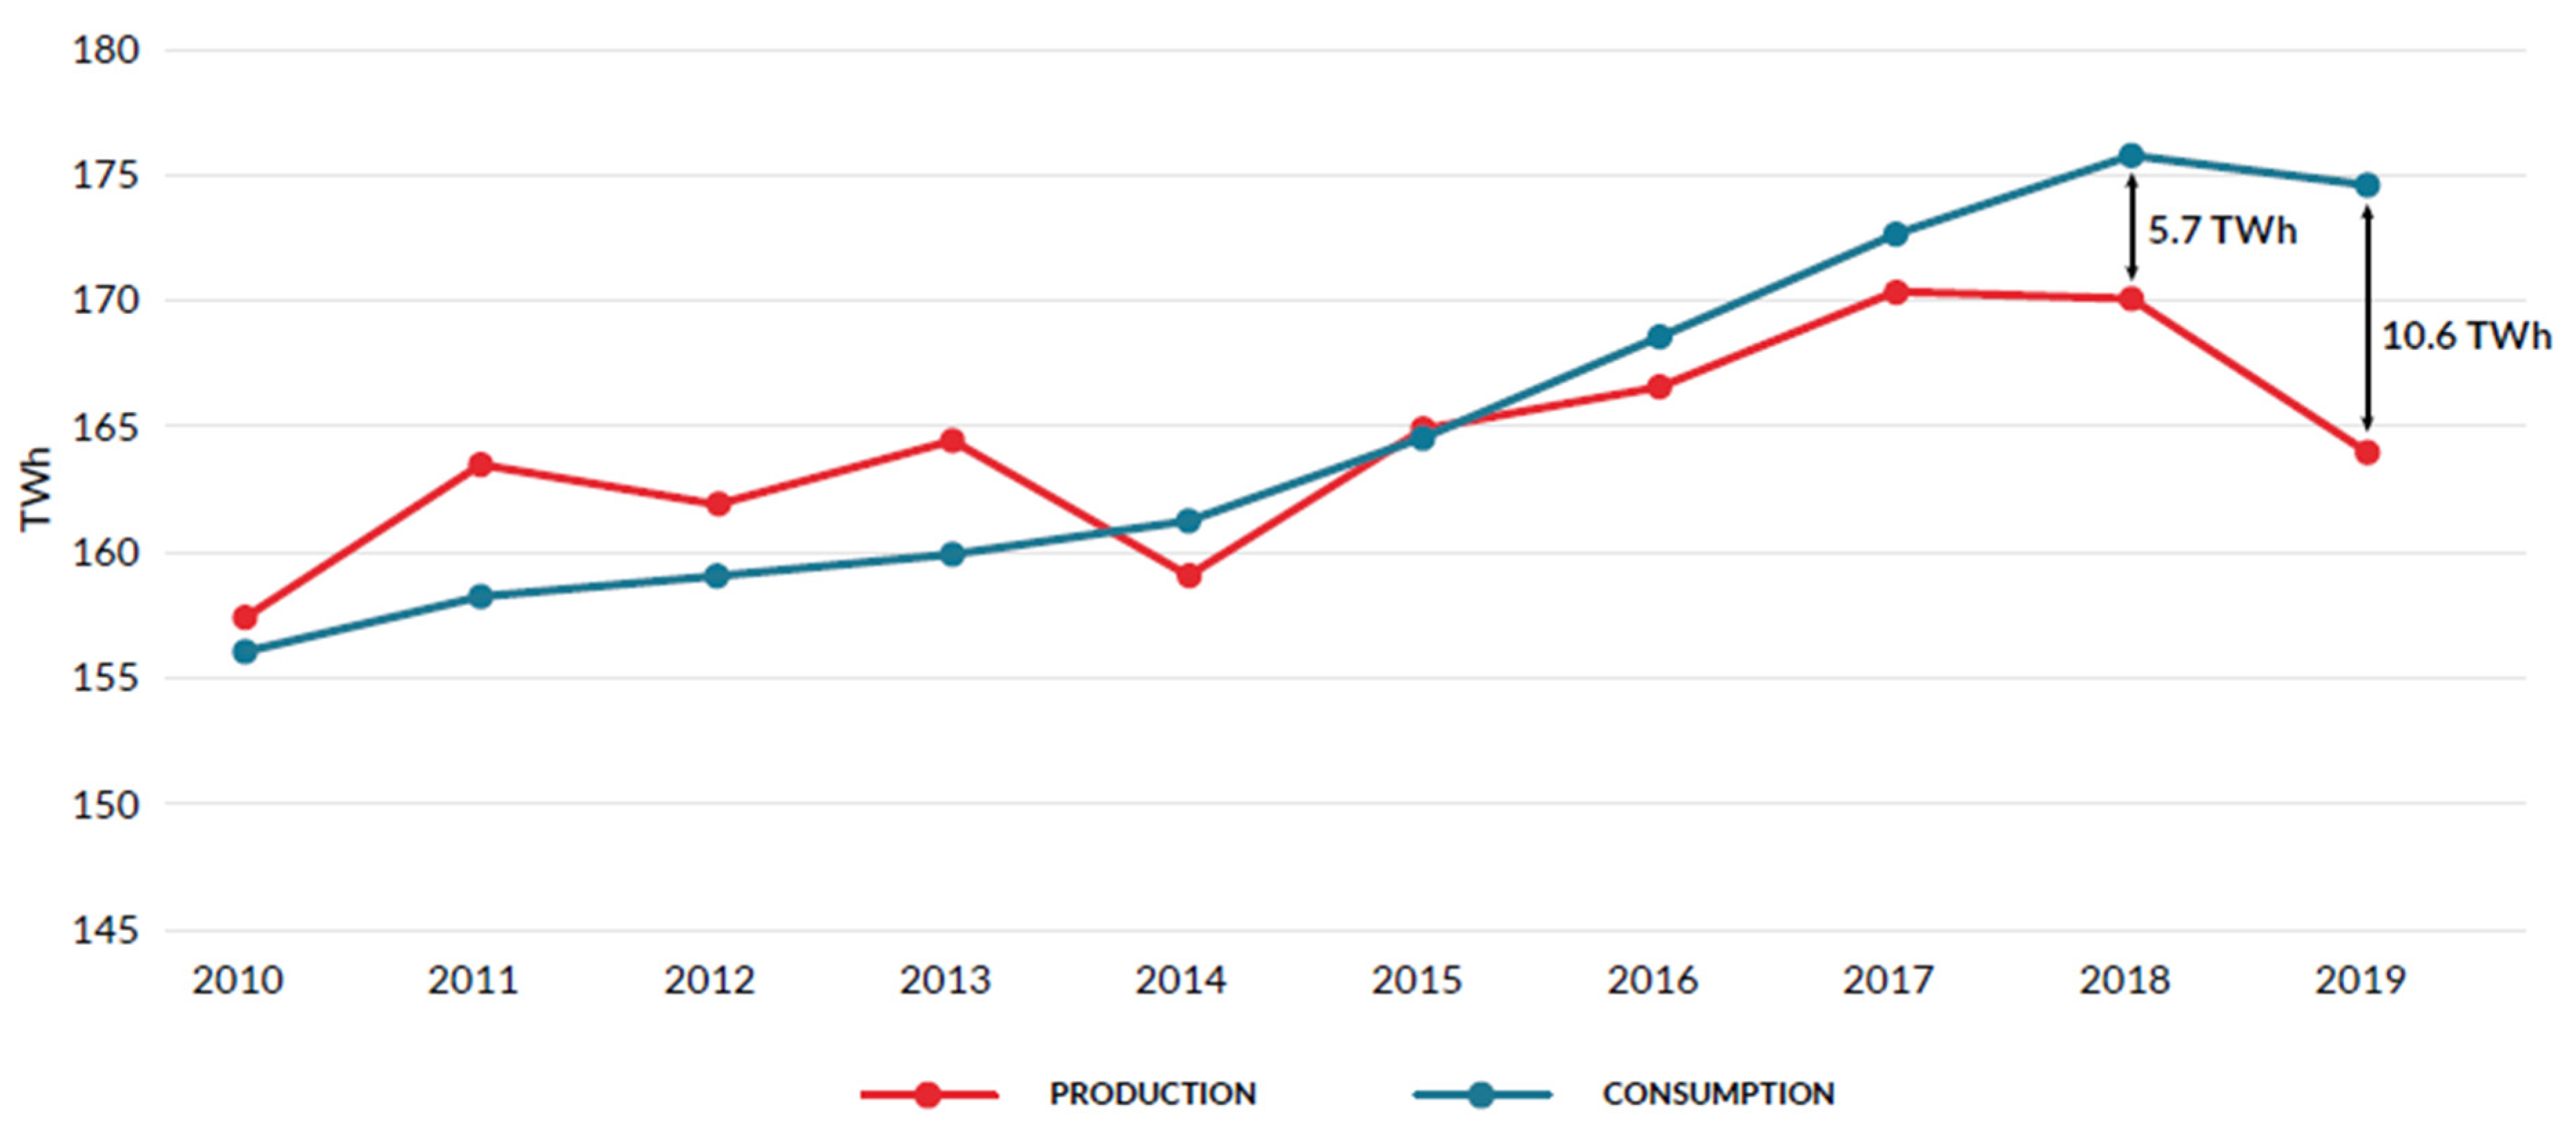
5. The Current State of Production and Prognosis of Energy in Poland
5.1. Polish Energy Sector—Overview and Limitations
- Microgeneration systems—from 1 W to 5 kW;
- Small generation systems—from 5 kW to 5 MW;
- Medium generation systems—from 5 MW to 50 MW;
- Large generation—from 50 to 150 MW” [70].
5.2. Photovoltaic Systems
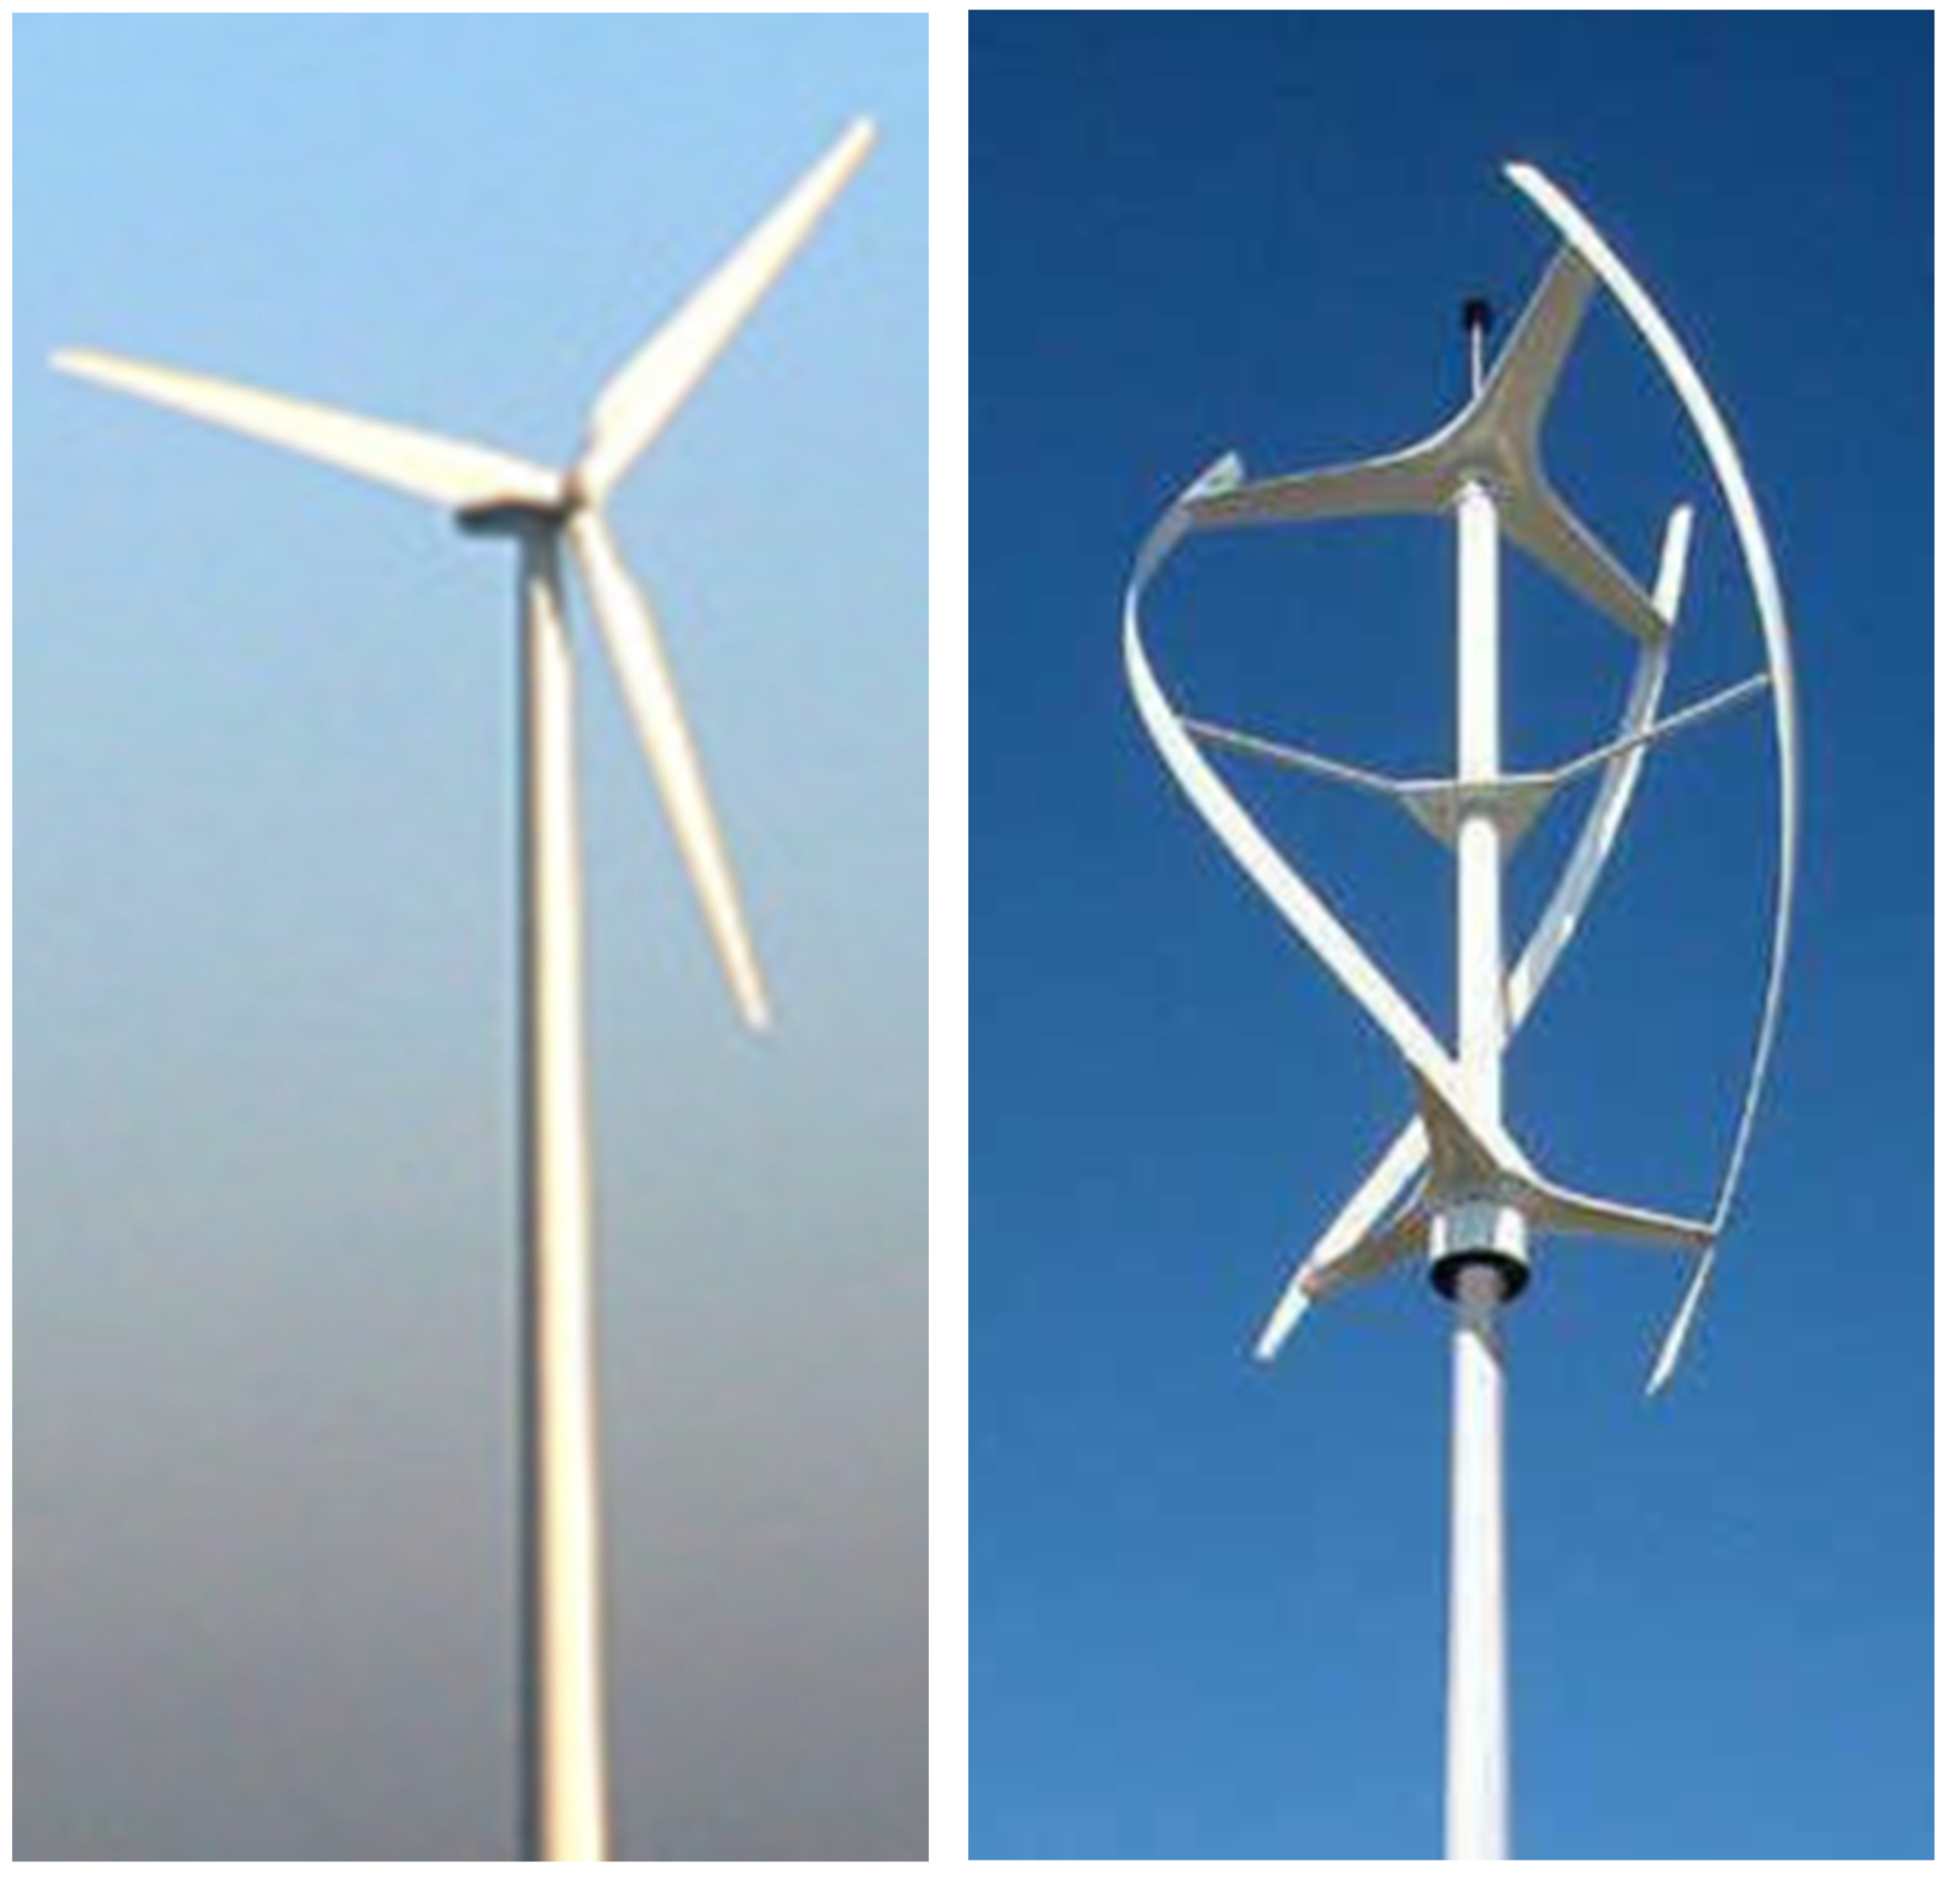
5.3. Wind Systems
5.4. Hydropower Systems
5.5. Biogas and Biomass Systems
5.6. Other Energy Systems
- Geothermal systems—according to the Polish Geological Institute, National Research Institute Poland, it has great potential. According to estimates, the geothermal resources of Poland, available in 80 percent of the country, would be enough to meet the country’s heat needs by 30 percent [83]. It has to be noticed that usability of geothermal resources in Poland is limited by their temperature: (1) level—low-level geotherm—down to 100 m +10 °C temperature could be obtained, which would provide an excellent possibility to set up “water to water” heat pumps, which are more effective during winter than “air to water systems”; (2) level—average temperature geotherm—down to 3 km—the temperature of about +100 °C could be obtained—which is a suitable temperature for a geothermal heating plant; (3) level—high-temperature geotherm—down to 6 km—the temperature of about +200 °C could be obtained—which is a suitable temperature for a geothermal electricity plant. The considerable advantage of geothermal systems is that the systems could be used to heat or cool the facilities.
- Nuclear systems—“As nuclear power generation has become established since the 1950s, the average size of reactor units has grown from 60 MWe to more than 1600 MWe, with corresponding economies of scale in operation” [84,85]. One can see the growing popularity of small and medium reactors (SMRs), more commonly recognized as “small modular reactors”. SMRs are typically under 15 MWe. There are designed mainly for remote communities. The units can be set up independently or like LEGO bricks, combined in a larger complex. There are also plans to construct tiny self-contained units for distant locations. SMRs are viewed as far more manageable than large ones, especially in terms of costs. Another reason for interest in SMRs is that they may be located in closed coal-fired power plants. “The World Nuclear Association outlines the characteristics of an SMR, which include (a) modest power and compact architecture; (b) modularity of construction; and (c) the possibility for sub-grade siting of the reactor unit, which provides better protection from natural or man-made risks”. Once, the IBM engineers had believed that the world needed five computers a year. They were wrong. Who knows, maybe the SMR for energy generation will be the same for which the Apple II was for the information revolution and will be used instead of classic high pollutive coal power plants in Poland.
5.7. Scenarios for Renewable Energy Sources Development in Poland
- Catastrophe—due to Polish legislation, the current state of the energy sector would be preserved. The government wants to protect the national grid, so for it to change the way to enable and use small on-grid power plants to build new energy systems would be economically unjustified. Some investors decide to set up off-grid, but that would be a margin in the energy consumption scale. The electricity prices mainly due to emission prices go up. The energy to fulfill growing demand would be imported. High energy prices would make the Polish economy uncompetitive;
- Full RES—that could be treated as a mix of scenarios that the RES technologies would fulfill the demand for electricity and heat. This scenario can be believed because it is estimated that in a single hour, the amount of power from the sun that reaches the Earth is more than the entire world consumes in a year. The RES energy systems, like wind or photovoltaic, do not provide the energy constantly. Currently, there are not efficient enough energy storage systems developed to store enough energy produced to provide reliable power. Only biomass, biogas, and geothermal systems could provide energy regularly. Still, substantial technological development has to be achieved to make them more efficient and ready to fulfill the growing energy demand. For the scenario to succeed, severe investments into the national grid have to be built. The lesson learned from the Grand Ethiopian Renaissance Dam project shows that financing of the dam could be in a public–private partnership.
- Clean coal and RES—a lot of research has been done on coal gasification [86,87]. Hydrogen, for example, could be the final product of the process. The gasification process could be done underground and in a remote installation. The process would be done in distributed locations. The facilities could be placed near the demand site because the final product would be electricity or heat to provide society or industry. To succeed in this scenario, substantial investments into the national grid have to be made.
- Nuclear MIX—as time goes and as the Polish energy companies take no action, the only way to fulfill international agreements would be to install SMRs instead of disabling coal plants. To succeed in this scenario, substantial investments into the national grid would need to be made.
6. Discussion
7. Conclusions
- (1)
- Based on literature studies and LOCE analysis, photovoltaic systems would be game-changers to allow the globe to switch to the “zero-emission” economy. The PV systems would be supported with wind systems and biogas systems located mainly in rural areas. In some areas nuclear systems would also play an important role;
- (2)
- The review of the technologies that could be used as the ecological distributed energy generation systems from Poland’s perspective showed that the PV systems supported with wind systems and biogas systems located predominantly in the rural areas would help achieve the Agenda 2030 goals.
- (a)
- Renewable energy sources could provide sufficient energy to replace the conventional energy sources (from global and Polish perspectives). As mentioned before, the only energy that comes from the sun would fulfill all current and future consumption. The only problem is developing more efficient systems that would transform solar energy and develop energy storage systems that would minimize the weaknesses, especially of the PV and wind systems. From the Polish perspective, the ideal energy mix, in the authors’ opinion, would be PV systems, wind, biogas, and hydropower systems supported with energy storage systems (hydropower systems could also be used as energy storage). The remaining energy could be obtained from natural gas, which also comes from the environmentally friendly coal gasification process.
- (b)
- PV systems, as well as wind, biogas, and hydropower systems are suitable as ecological distributed energy generation systems in Poland.
- (c)
- In general, the main strength of the technologies to replace conventional energy sources in Poland is that all systems require low maintenance costs. Unfortunately, these systems require high initial costs, and this is the most important weakness. The most important thread of the development of alternative energy systems in Poland is government policy. However, theoretically, a society interested in financing ecological distributed energy generation systems could change the policy or policymakers.
- (d)
- Unfortunately, the “Catastrophe scenario” mentioned above is coming true—due to Polish legislation, and the current state of the energy sector will be preserved.
Author Contributions
Funding
Institutional Review Board Statement
Informed Consent Statement
Data Availability Statement
Conflicts of Interest
References
- De Lavoisier, A.L. Traité Élémentaire de Chimie; Forgotten Books: Maxtor, France, 2019. [Google Scholar]
- Ghiani, E.; Serpi, A.; Pilloni, V.; Sias, G.; Simone, M.; Marcialis, G.; Armano, G.; Pegoraro, P.A. Multidisciplinary Approach for the Development of Smart Distribution Networks. Energies 2018, 11, 2530. [Google Scholar] [CrossRef] [Green Version]
- Lovins, A.B.; Ürge-Vorsatz, D.; Mundaca, L.; Kammen, D.M.; Glassman, J.W. Recalibrating climate prospects. Environ. Res. Lett. 2019, 14, 120201. [Google Scholar] [CrossRef]
- Binz, C.; Tang, T.; Huenteler, J. Spatial lifecycles of cleantech industries—The global development history of solar photovoltaics. Energy Policy 2017, 101, 386–402. [Google Scholar] [CrossRef] [Green Version]
- Poulek, V.; Khudysh, A.; Libra, M. Innovative low concentration PV systems with bifacial solar panels. Solar Energy 2015, 120, 113–116. [Google Scholar] [CrossRef]
- Boamah, F.; Rothfuß, E. From technical innovations towards social practices and socio-technical transition? Re-thinking the transition to decentralised solar PV electrification in Africa. Energy Res. Soc. Sci. 2018, 42, 1–10. [Google Scholar] [CrossRef]
- Ceran, B.; Szczerbowski, R. Analiza techniczno-ekonomiczna instalacji fotowoltaicznej. In Zeszyty Naukowe Instytutu Gospodarki Surowcami Mineralnymi i Energią PAN; PAN: Warsaw, Poland, 2017. [Google Scholar]
- Dalkey, N.; Helmer, O. An experimental application of the Delphi method to the use of experts. Manag. Sci. 1963, 9, 458–467. [Google Scholar] [CrossRef]
- Skulmoski, G.J.; Hartman, F.T.; Krahn, J. The Delphi method for graduate research. J. Inf. Technol. Educ. Res. 2007, 6, 1–21. [Google Scholar] [CrossRef]
- Rowe, G.; Wright, G. The Delphi technique as a forecasting tool: Issues and analysis. Int. J. Forecast. 1999, 15, 353–375. [Google Scholar] [CrossRef]
- Dalkey, N.C. The Delphi Method: An Experimental Study of Group Opinion; Rand Corp.: Santa Monica, CA, USA, 1969. [Google Scholar]
- Kurttila, M.; Pesonen, M.; Kangas, J.; Kajanus, M. Utilizing the analytic hierarchy process (AHP) in SWOT analysis—A hybrid method and its application to a forest-certification case. For. Policy Econ. 2000, 1, 41–52. [Google Scholar] [CrossRef]
- Hill, T.; Westbrook, R. SWOT analysis: It’s time for a product recall. Long Range Plan. 1997, 30, 46–52. [Google Scholar] [CrossRef]
- Alptekin, N. Integration of SWOT analysis and TOPSIS method in strategic decision making process. Macrotheme Rev. 2013, 2, 1–8. [Google Scholar]
- Engel, A. Practical Creativity, and Innovation in Systems Engineering; John Wiley & Sons: Hoboken, NJ, USA, 2018. [Google Scholar]
- Timilsina, G.R. Are renewable energy technologies cost competitive for electricity generation? Renew. Energy 2021, 180, 658–672. [Google Scholar] [CrossRef]
- Lovins, A. A 40 Year Plan for Energy. Available online: https://www.ted.com/talks/amory_lovins_a_40_year_plan_for_energy/transcript (accessed on 31 July 2021).
- Global Change Data Lab. Our World in Data. Available online: https://ourworldindata.org/ (accessed on 31 July 2021).
- Ignacy, Ł. Available online: https://EncyklopediaPWN (accessed on 31 July 2021).
- UN. Iceland’s Sustainable Energy Story: A Model for the World? UN Chronicle. 2020. Available online: https://www.un.org/en/chronicle/article/icelands-sustainable-energy-story-model-world (accessed on 31 July 2021).
- Ministry of Industries and Innovation, Government of Iceland, Energy. Available online: https://www.government.is/topics/business-and-industry/energy/ (accessed on 31 July 2021).
- LED. Lighting Market Size, Share & Trends Analysis Report by End-Use (Residential, Commercial), by Product (Lamps, Luminaires), by Application (Indoor, Outdoor), by Region, and Segment Forecasts, 2021–2028; Fortune Business Insights: Maharashtra, India, 2021. [Google Scholar]
- Fischer, C. EU Ecodesign Regulation. In More as Only a Light Bulb Ban; EU-Oekodesign-Richtlinie. Mehr als ein Gluehbirnenverbot; Umweltmagazin, VDI Fachmedien GmbH & Co.: Düsseldorf, Germany, 2011. [Google Scholar]
- Fukasawa, T. Consumer Preference for Durability and Energy Efficiency: Welfare Analysis of Light Bulb Market. Available online: https://ssrn.com/abstract=3839998 (accessed on 9 September 2021).
- LED Light Bulb to Last More than 20 Years. Available online: https://www.bbc.com/news/technology-17992927 (accessed on 31 July 2021).
- Senkus, P. Zarządzanie i Dowodzenie z Wykorzystaniem Orientacji Procesowej; Wydawnictwo Difin: Warszawa, Poland, 2013. [Google Scholar]
- Economist. Fuel Cells Meet Big Business; Economist 07/24/99; The Economist Group: London, UK, 1999; pp. 59–60. [Google Scholar]
- Govinda, R. Demystifying the Costs of Electricity Generation Technologies; Policy Research Working Paper, No. 9303; World Bank: Washington, DC, USA, 2020. [Google Scholar]
- Ray, D. Lazard’s Levelized Cost of Energy Analysis—Version 13.0; Lazard: New York, NY, USA, 2019; p. 20. [Google Scholar]
- Smil, V. Energy Transitions: Global and National Perspectives; ABC-CLIO: Santa Barbara, CA, USA, 2016. [Google Scholar]
- Ritchie, H.; Roser, M. Energy, OurWorldInData.org. Available online: https://ourworldindata.org/energy (accessed on 31 July 2021).
- EU. Quarterly Report on European Electricity Markets with Focus on the Impact of High Carbon Prices in the Electricity Sector Market Observatory for Energy DG Energy; European Commission: Brussels, Belgium, 2021; Volume 14. [Google Scholar]
- McDonough, W.; Braungart, M. Cradle to Cradle: Remaking the Way We Make Things; North Point Press: New York, NY, USA, 2010. [Google Scholar]
- Boerema, N.; Morrison, G.; Taylor, R.; Rosengarten, G. High temperature solar thermal central-receiver billboard design. Sol. Energy 2013, 97, 356–368. [Google Scholar] [CrossRef]
- Law, E.W.; Prasad, A.A.; Kay, M.; Taylor, R.A. Direct normal irradiance forecasting and its application to concentrated solar thermal output forecasting—A review. Sol. Energy 2014, 108, 287–307. [Google Scholar] [CrossRef]
- Law, E.W.; Kay, M.; Taylor, R.A. Calculating the financial value of a concentrated solar thermal plant operated using direct normal irradiance forecasts. Sol. Energy 2016, 125, 267–281. [Google Scholar] [CrossRef] [Green Version]
- Fraunhofer Institute for Solar Energy Systems, ISE. Photovoltaics Report (PDF); Fraunhofer ISE: Freiburg, Germany, 2014. [Google Scholar]
- Sabillon, C.; Franco, J.F.; Rider, M.J.; Romero, R. Joint optimal operation of photovoltaic units and electric vehicles in residential networks with storage systems: A dynamic scheduling method. Int. J. Electr. Power Energy Syst. 2018, 103, 136–145. [Google Scholar] [CrossRef]
- Chung, J.; Shin, S.S.; Hwang, K.; Kim, G.; Kim, K.W.; Kim, W.; Ma, B.S.; Kim, Y.K.; Kim, T.S.; Seo, J. Record-efficiency flexible perovskite solar cell and module enabled by a porous-planar structure as an electron transport layer. Energy Environ. Sci. 2020, 13, 4854–4861. [Google Scholar] [CrossRef]
- Feldman, D.; Ramasamy, V.; Fu, R.; Ramdas, A.; Desai, J.; Margolis, R. US Solar Photovoltaic System and Energy Storage Cost Benchmark: Q1 2020; No. NREL/TP-6A20-77324; National Renewable Energy Lab. (NREL): Golden, CO, USA, 2021.
- Shah, S.A.A.; Valasai, G.D.; Memon, A.A.; Laghari, A.N.; Jalbani, N.B.; Strait, J.L. Techno-economic analysis of solar pv electricity supply to rural areas of Balochistan, Pakistan. Energies 2018, 11, 1777. [Google Scholar] [CrossRef] [Green Version]
- Xu, L.; Wang, Y.; Solangi, Y.A.; Zameer, H.; Shah, S.A.A. Off-grid solar PV power generation system in Sindh, Pakistan: A techno-economic feasibility analysis. Processes 2019, 7, 308. [Google Scholar] [CrossRef] [Green Version]
- Chen, P.Y.; Qi, J.; Klug, M.T.; Dang, X.; Hammond, P.T.; Belcher, A.M. Environmentally responsible fabrication of efficient perovskite solar cells from recycled car batteries. Energy Environ. Sci. 2014, 7, 3659–3665. [Google Scholar] [CrossRef]
- Malinkiewicz, O. Building on trust and vision. Nat. Mater. 2021, 20, 904. [Google Scholar] [CrossRef]
- Wojciechowski, K.; Forgács, D.; Rivera, T. Industrial opportunities and challenges for perovskite photovoltaic technology. Sol. RRL 2019, 3, 1900144. [Google Scholar] [CrossRef]
- The National Renewable Energy Laboratory. Concentrating Solar Power Projects. Available online: https://solarpaces.nrel.gov/ (accessed on 31 July 2021).
- Irena, I. Future of Wind: Deployment, Investment, Technology, Grid Integration and Socio-Economic Aspects; IRENA Innovation and Technology Center: Bonn, Germany, 2019. [Google Scholar]
- Doerffer, P.; Doerffer, K.; Ochrymiuk, T.; Telega, J. Variable Size Twin-Rotor Wind Turbine. Energies 2019, 12, 2543. [Google Scholar] [CrossRef] [Green Version]
- The National Renewable Energy Laboratory. Land Use by System Technology. Available online: https://www.nrel.gov/analysis/tech-size.html (accessed on 31 July 2021).
- BP, Great Britain. Statistical Review of World Energy. Available online: https://www.bp.com/en/global/corporate/energy-economics/statistical-review-of-world-energy.html (accessed on 31 July 2021).
- Maghanki, M.M.; Ghobadian, B.; Najafi, G.; Galogah, R.J. Micro combined heat and power (MCHP) technologies and applications. Renew. Sustain. Energy Rev. 2013, 28, 510–524. [Google Scholar] [CrossRef]
- Dye, S.T. Geoneutrinos and the radioactive power of the Earth. Rev. Geophys. 2012, 50. [Google Scholar] [CrossRef]
- REN21. Renewables 2020: Global Status Report; Chapter 01; Global Overview: Paris, France, 2020. [Google Scholar]
- Geothermal Energy Association. Geothermal Energy: International Market Update May. 2010. Available online: https://geothermal.org/sites/default/files/2021-02/GEA_International_Market_Report_2010.pdf (accessed on 31 July 2021).
- El Bassam, N.; Maegaard, P.; Schlichting, M. Distributed Renewable Energies for Off-Grid Communities: Strategies and Technologies toward Achieving Sustainability in Energy Generation and Supply; Elsevier: London, UK, 2013. [Google Scholar]
- Morrone, P.; Algieri, A. Integrated Geothermal Energy Systems for Small-Scale Geothermal atlas of Europe. Combined Heat and Power Production: Energy and Economic Investigation. Appl. Sci. 2020, 10, 6639. [Google Scholar] [CrossRef]
- Hurtig, E.; Cermak, V.; Haenel, R.; Zui, V. Geothermal Atlas of Europe; IAEA: Vienna, Austria, 1992. [Google Scholar]
- REN21 Renewable Now. Available online: https://www.ren21.net/ (accessed on 31 July 2021).
- Abdelshafy, A.M.; Jurasz, J.; Hassan, H.; Mohamed, A.M. Optimized energy management strategy for grid connected double storage (pumped storage-battery) system powered by renewable energy resources. Energy 2020, 192, 116615. [Google Scholar] [CrossRef]
- Witt, A.; Chalise, D.R.; Hadjerioua, B.; Manwaring, M.; Bishop, N. Development and Implications of a Predictive Cost Methodology for Modular Pumped Storage Hydropower (m-PSH) Projects in the United States; ORNL/TM-2016/590; Oak Ridge National Laboratory: Oak Ridge, TN, USA, 2016.
- Gençsü, I.; Whitley, S.; Roberts, L.; Beaton, C.; Chen, H.; Doukas, A.; Geddes, A.; Gerasimchuk, I.; Sanchez, L.; Suharsono, A. G20 Coal Subsidies (PDF); ODI: London, UK, 2019. [Google Scholar]
- Chang, S.; Zhuo, J.; Meng, S.; Qin, S.; Yao, Q. Clean coal technologies in China: Current status and future perspectives. Engineering 2016, 2, 447–459. [Google Scholar] [CrossRef]
- Guan, G. Clean coal technologies in Japan: A review. Chin. J. Chem. Eng. 2017, 25, 689–697. [Google Scholar] [CrossRef]
- Burton, E.A.; Upadhye, R.; Friedmann, S.J. Best Practices in Underground Coal Gasification; (No. LLNL-TR-225331); Lawrence Livermore National Lab. (LLNL): Livermore, CA, USA, 2017. [Google Scholar]
- Perkins, G. Underground coal gasification–Part II: Fundamental phenomena and modeling. Prog. Energy Combust. Sci. 2018, 67, 234–274. [Google Scholar] [CrossRef]
- Berlinguette, C.P.; Chiang, Y.M.; Munday, J.N.; Schenkel, T.; Fork, D.K.; Koningstein, R.; Trevithick, M.D. Revisiting the cold case of cold fusion. Nature 2019, 570, 45–51. [Google Scholar] [CrossRef]
- Pitkänen, M. Cold Fusion Again. Prespacetime J. 2016, 379-396, 379–396. [Google Scholar]
- Petrescu, F.I.; Calautit, J.K. About nano fusion and dynamic fusion. Am. J. Appl. Sci. 2016, 13, 261–266. [Google Scholar] [CrossRef] [Green Version]
- El Naschie, M.S. From fusion algebra to cold fusion or from pure reason to pragmatism. Open J. Philos. 2015, 5, 319. [Google Scholar] [CrossRef] [Green Version]
- Biofuels Explained Ethanol and Biomass-Based Diesel. Available online: https://www.eia.gov/energyexplained/index.php?page=biofuel_home (accessed on 31 July 2021).
- Paska, J. Wytwarzanie Rozproszone Energii Elektrycznej i Ciepła; Oficyna Wydawnicza Politechniki Warszawskiej: Warsaw, Poland, 2010. [Google Scholar]
- Szczerbowski, R.; Kornobis, D. The proposal of an energy mix in the context of changes in Poland’s energy policy. Polityka Energetyczna 2019, 22, 5–18. [Google Scholar] [CrossRef]
- Jurdziak, L. Czy grozi nam ubóstwo? Analiza potencjalnych skutków unijnej polityki walki z globalnym ociepleniem dla gospodarstw domowych w Polsce. Polityka Energetyczna 2012, 15, 23–50. [Google Scholar]
- Energii, F. Energy Transition in Poland Edition. 2020. Available online: http//www.forum-energii.eu (accessed on 31 July 2021).
- Pietrzak, M.B.; Igliński, B.; Kujawski, W.; Iwański, P. Energy transition in Poland—Assessment of the renewable energy sector. Energies 2021, 14, 2046. [Google Scholar] [CrossRef]
- Igliński, B. Badanie Sektora Energii Odnawialnej w Polsce–Potencjał Techniczny, Badania Ankietowe, Analiza SWOT, Analiza PEST. Available online: https://www.researchgate.net/publication/338740614_Badanie_sektora_energii_odnawialnej_w_Polsce_-potencjal_techniczny_badania_ankietowe_analiza_SWOT_analiza_PEST (accessed on 30 July 2021).
- Szczerbowski, R. Wyzwania Polskiego Sektora Wytwórczego do 2030 Roku. Available online: http://yadda.icm.edu.pl/yadda/element/bwmeta1.element.baztech-942bfb08-5d91-496a-a9ac-cccc305832ae (accessed on 31 July 2021).
- Szczerbowski, R. The forecast of Polish power production sector development by 2050–coal scenario. Polityka Energetyczna–Energy Policy J. 2019, 19, 5–18. [Google Scholar] [CrossRef]
- Szczerbowski, R. Strategia Zrównoważonego Rozwoju a Sektor Wytwarzania Energii w Polsce. Energetyka. Available online: https://cire.pl/filemanager/Zalczniki%20stron%20tekstowych/1f238adcf76fdc992b70b76917205c41e9b00e97ba4d041b6008c06f3ef940e2.pdf (accessed on 11 July 2021).
- Ceran, B.; Szczerbowski, R. Energy cost analysis by hybrid power generation system. In IOP Conference Series: Earth and Environmental Science; IOP Publishing: Poznan, Poland, 2019; Volume 214, p. 012001. [Google Scholar]
- Dyląg, A.; Kassenberg, A.; Szymalski, W. Energetyka Obywatelska w Polsce–Analiza Stanu i Rekomendacje do Rozwoju; Instytut na Rzecz Ekorozwoju: Warszawa, Poland, 2019. [Google Scholar]
- Woszczyński, M.; Stankiewicz, K. Analiza efektywności energetycznej i założenia techniczne rozbudowy instalacji fotowoltaicznych na dachach obiektów przemysłowych. In Innowacyjne I Przyjazne Dla Środowiska Techniki I Technologie Przeróbki Surowców Mineralnych; KOMEKO: Gliwice, Poland, 2021; p. 67. [Google Scholar]
- Dach, J. Biogaz w Polsce—Raport 2020; Biomass Media Group Sp. z o.o.S: Warsaw, Poland, 2020. [Google Scholar]
- Small Nuclear Power Reactors. Available online: https://www.world-nuclear.org/information-library/nuclear-fuel-cycle/nuclear-power-reactors/small-nuclear-power-reactors.aspx (accessed on 31 July 2021).
- Kapusta, K.; Stańczyk, K.; Wiatowski, M.; Chećko, J. Environmental aspects of a field-scale underground coal gasification trial in a shallow coal seam at the Experimental Mine Barbara in Poland. Fuel 2013, 113, 196–208. [Google Scholar] [CrossRef]
- Zhang, Y.; Jia, W.; Wang, R.; Guo, Y.; Guo, F.; Wu, J.; Dai, B. Investigation of the Characteristics of Catalysis Synergy during Co-Combustion for Coal Gasification Fine Slag with Bituminous Coal and Bamboo Residue. Catalysts 2021, 11, 1152. [Google Scholar] [CrossRef]
- Schilling, H.D.; Bonn, B.; Krauss, U. Coal Gasification; Graham & Trotman: London, UK, 1976. [Google Scholar]


| Weight | Rating | Score | ||
|---|---|---|---|---|
| Strengths | 1.00 | |||
| 1 | Strength 1 | 0.40 | 5 | 2.00 |
| 2 | Strength 2 | 0.30 | 4 | 1.20 |
| Total weighted score | 3.20 | |||
| Weaknesses | 1.00 | |||
| 1 | Weakness 1 | 0.30 | 5 | 1.50 |
| 2 | Weakness 2 | 0.30 | 5 | 1.50 |
| Total weighted score | 3.00 | |||
| Internal Factors Ratio (IFR) | 1.06 | |||
| Opportunities | 1.00 | |||
| 1 | Opportunity 1 | 0.60 | 5 | 3.00 |
| 2 | Opportunity 2 | 0.40 | 5 | 2.00 |
| Total weighted score | 5.00 | |||
| Threats | 1.00 | |||
| 1 | Threat 1 | 0.50 | 5 | 2.50 |
| 2 | Threat 2 | 0.30 | 5 | 1.50 |
| Total weighted score | 4.00 | |||
| External Factors Ratio (EFR) | 1.25 | |||
| No. | Source | Value | Solar PV Systems | CSP Systems | Wind Systems | Natural Gas Systems | ||
|---|---|---|---|---|---|---|---|---|
| Onshore | Offshore | Gas-CC | Gas-GT | |||||
| 1 | EIA | 1331.00 | 7191.00 | 1319.00 | 5446.00 | 1017.00 | 710.00 | |
| 2 | IEA | Min | 1005.00 | 3831.00 | 1287.00 | 3973.00 | 673.00 | 536.00 |
| Avg | 1877.50 | 6283.00 | 2252.00 | 5169.00 | 1028.00 | 768.50 | ||
| Max | 2750.00 | 8735.00 | 3217.00 | 6365.00 | 1383.00 | 1001.00 | ||
| 3 | IRENA | Min | 618.00 | 3704.00 | 1039.00 | 2677.00 | n.a. | n.a |
| Avg | 1706.00 | 5415.50 | 1760.50 | 4114.00 | n.a. | n.a | ||
| Max | 2794.00 | 7127.00 | 2482.00 | 5551.00 | n.a. | n.a | ||
| 4 | Lazard | Min | 900.00 | 6000.00 | 1100.00 | 2350.00 | 700.00 | 700.00 |
| Avg | 1000.00 | 7550.00 | 1300.00 | 2950.00 | 1000.00 | 825.00 | ||
| Max | 1100.00 | 9100.00 | 1500.00 | 3550.00 | 1300.00 | 950.00 | ||
| 5 | NREL | Min | 1142.00 | 6574.00 | 1678.00 | 3145.00 | 944.00 | 937.00 |
| Avg | 1142.00 | 6574.00 | 1678.00 | 4231.50 | 944.00 | 937.00 | ||
| Max | 1142.00 | 6574.00 | 1678.00 | 5318.00 | 944.00 | 937.00 | ||
| No. | Data Source | Value | Geothermal Systems | Hydropower Systems | Coal Systems | Nuclear Systems | Biomass Systems | |
| 1 | EIA | Min | 2680.00 | 2752.00 | 3661.00 | 6317.00 | 2831.00 | |
| 2 | IEA | Min | 1602.00 | 1282.00 | 1072.00 | 2805.00 | 630.00 | |
| Avg | 4355.00 | n.u. | 2181.00 | 4736.50 | 4964.00 | |||
| Max | 7108.00 | n.u. | 3290.00 | 6668.00 | 9298.00 | |||
| 3 | IRENA | Min | 2020.00 | 680.00 | n.a | n.a | 422.00 | |
| Avg | 4650.00 | 2409.00 | n.a | n.a | 4582.00 | |||
| Max | 7280.00 | 4138.00 | n.a | n.a | 8742.00 | |||
| 4 | Lazard | Min | 3950.00 | n.a. | 3000.00 | 6900.00 | n.a. | |
| Avg | 5275.00 | n.a. | 4600.00 | 3456.10 | n.a. | |||
| Max | 6600.00 | n.a. | 6200.00 | 12.20 | n.a. | |||
| 5 | NREL | Min | 4557.00 | 3974.00 | 3867.00 | 6460.00 | 3988.00 | |
| Avg | n.u. | 5696.00 | 4046.00 | 6460.00 | 4085.00 | |||
| Max | n.u. | 7418.00 | 4225.00 | 6460.00 | 4182.00 | |||
| Weight | Rating | Score | ||
|---|---|---|---|---|
| Strengths | 1.00 | |||
| 1 | Little diversification of the Polish energy sector | 0.40 | 5 | 2.00 |
| 2 | Polish energy sector is one of the largest in Europe | 0.30 | 4 | 1.20 |
| 3 | Sufficient number of potential clients | 0.20 | 5 | 1.00 |
| 4 | Research centers and universities are researching energy issues | 0.10 | 4 | 0.40 |
| Total weighted score | 4.60 | |||
| Weaknesses | 1.00 | |||
| 1 | Equipment to produce and to distribute energy is old | 0.30 | 5 | 1.50 |
| 2 | Polish power grids require general modernization | 0.30 | 5 | 1.50 |
| 3 | The Polish energy system is not ready to absorb energy from distributed sources on a larger scale | 0.20 | 5 | 1.00 |
| 4 | The sector is not currently self-sufficient | 0.10 | 4 | 0.40 |
| 5 | Power plants in Poland are not well distributed to cover demand needs | 0.10 | 4 | 0.40 |
| Total weighted score | 4.80 | |||
| Internal Factors Ratio (IFR) | 0.96 | |||
| Opportunities | 1.00 | |||
| 1 | Citizens of Poland are eagle to invest in the ecological distributed powerplants | 0.60 | 5 | 3.00 |
| 2 | When making buying decisions related to home appliances, consumers consider energy efficiency as one of the main factors | 0.40 | 5 | 2.00 |
| Total weighted score | 5.00 | |||
| Threats | 1.00 | |||
| 1 | Unstable domestic law | 0.50 | 5 | 2.50 |
| 2 | The most crucial power source is coal; the ban on coal would be a vital issue for Polish energy security | 0.30 | 5 | 1.50 |
| 3 | Small micro-sources at the level of one circuit, without appropriate technical solutions, may harm energy parameters | 0.20 | 5 | 1.00 |
| Total weighted score | 5.00 | |||
| External Factors Ratio (EFR) | 1.00 | |||
| Weight | Rating | Score | ||
|---|---|---|---|---|
| Strengths | 1.00 | |||
| 1 | Roi from 8–17% | 0.30 | 5 | 1.50 |
| 2 | Very low operating costs for the installation | 0.10 | 5 | 0.50 |
| 3 | Its use does not emit harmful gases (including CO2) | 0.10 | 5 | 0.50 |
| 4 | Very low maintenance and operating costs for the installation | 0.10 | 5 | 0.50 |
| 5 | Can be used in off-grid locations | 0.10 | 5 | 0.50 |
| 6 | Scalable efficiency in combination with other installations, e.g., heat pump | 0.10 | 4 | 0.40 |
| 7 | Relatively low failure rate of the solar installation | 0.10 | 4 | 0.40 |
| 8 | Ability to combine with energy storage systems | 0.10 | 3 | 0.30 |
| Total weighted score | 4.60 | |||
| Weaknesses | 1.00 | |||
| 1 | More energy is generated in spring–summer than autumn–winter | 0.50 | 5 | 2.50 |
| 2 | Energy from PV systems is produced only when the sun shines | 0.20 | 4 | 0.80 |
| 3 | Big initial costs of photovoltaic installations | 0.30 | 3 | 0.90 |
| Total weighted score | 4.20 | |||
| Internal Factors Ratio (IFR) | 1.10 | |||
| Opportunities | 1.00 | |||
| 1 | High social acceptance | 0.30 | 5 | 1.50 |
| 2 | Big potential of growth | 0.30 | 4 | 1.20 |
| 3 | Perovskite based solar cells are produced in Poland | 0.20 | 5 | 1.00 |
| 4 | Market is adopting new technologies very fast | 0.20 | 3 | 0.60 |
| Total weighted score | 4.30 | |||
| Threats | 1.00 | |||
| 1 | Unstable domestic law | 0.50 | 5 | 2.50 |
| 2 | Small micro-sources at the level of one circuit, without appropriate technical solutions, may have a negative impact on energy parameters | 0.30 | 5 | 1.50 |
| 3 | Bad condition of national grid | 0.20 | 5 | 1.00 |
| Total weighted score | 5.00 | |||
| External Factors Ratio (EFR) | 0.86 | |||
| Weight | Rating | Score | ||
|---|---|---|---|---|
| Strengths | 1.00 | |||
| 1 | Well known technology | 0.40 | 5 | 2.00 |
| 2 | Wind is a source of clean energy | 0.20 | 5 | 1.00 |
| 3 | Wind farm require less space than solar farms or hydroelectric generation | 0.20 | 3 | 0.60 |
| 4 | Availability of resource in Poland | 0.20 | 4 | 0.80 |
| Total weighted score | 4.40 | |||
| Weaknesses | 1.00 | |||
| 1 | The speed of wind is dependent on the metrological conditions | 0.30 | 5 | 1.50 |
| 2 | High initial investment costs in wind systems | 0.30 | 4 | 1.20 |
| 3 | Wind turbines could be harmful for migrating birds | 0.20 | 3 | 0.60 |
| 4 | The wind turbine blades are made of had to recycle material | 0.10 | 4 | 0.40 |
| 5 | Noise pollution is one of the setbacks of the wind technology | 0.10 | 3 | 0.30 |
| Total weighted score | 4.00 | |||
| Internal Factors Ratio (IFR) | 1.10 | |||
| Opportunities | 1.00 | |||
| 1 | Big potential of growth | 0.50 | 5 | 2.50 |
| 2 | Many producers of the systems are located in Poland | 0.30 | 4 | 1.20 |
| 3 | Research and development in the sector boost the efficiency of the wind systems | 0.20 | 4 | 0.80 |
| Total weighted score | 4.50 | |||
| Threats | 1.00 | |||
| 1 | Unstable domestic law, unfavorable for the wind systems | 0.40 | 5 | 2.00 |
| 2 | Bad condition of national grid | 0.40 | 4 | 1.60 |
| 3 | Low social acceptance | 0.20 | 3 | 0.60 |
| Total weighted score | 4.20 | |||
| External Factors Ratio (EFR) | 1.07 | |||
| Weight | Rating | Score | ||
|---|---|---|---|---|
| Strengths | 1.0 | |||
| 1 | Well known technology | 0.20 | 5 | 1.00 |
| 2 | Availability of resource | 0.20 | 5 | 1.00 |
| 3 | Easy and precise control of energy produced | 0.15 | 4 | 0.60 |
| 4 | Much lower operating costs than in conventional power plants | 0.15 | 4 | 0.60 |
| 5 | Means the access to a stable energy source (unlike, e.g., solar and wind energy electricity production is independent of weather and time) | 0.10 | 5 | 0.50 |
| 6 | Possibility of using energy locally or sending it to grid | 0.10 | 4 | 0.40 |
| 7 | Its use does not emit harmful gases (including CO2) | 0.10 | 4 | 0.40 |
| Total weighted score | 4.50 | |||
| Weaknesses | 5.00 | |||
| 1 | Construction of hydropower plants constitutes a serious interference with the natural environment | 0.20 | 4 | 0.80 |
| 2 | Inability to work during prolonged drought | 0.20 | 5 | 1.00 |
| 3 | The construction costs of this type of power plant are 2–3 times higher than the expenditure for the construction of conventional power plants | 0.20 | 3 | 0.60 |
| 4 | Reduction in reservoir capacity through sediment accumulation | 0.10 | 3 | 0.30 |
| 5 | Noise and pollution during construction | 0.10 | 4 | 0.40 |
| Total weighted score | 3.10 | |||
| Internal Factors Ratio (IFR) | 1.45 | |||
| Opportunities | 1.00 | |||
| 1 | Water reservoirs could be used for tourist and recreational purposes | 0.50 | 5 | 2.50 |
| 2 | Pumped storage plants could be widely used energy storage | 0.30 | 5 | 1.50 |
| 3 | New directions of owe development | 0.20 | 5 | 1.00 |
| Total weighted score | 5.00 | |||
| Threats | 1.00 | |||
| 1 | Unstable domestic law | 0.50 | 5 | 2.50 |
| 2 | May cause secondary effects in the form of barrage cracking and water disasters | 0.30 | 4 | 1.20 |
| 3 | Moderate social acceptance | 0.20 | 4 | 0.80 |
| 4 | Resistance of ecological groups (large hydroelectric plants) | 0.10 | 3 | 0.30 |
| 5 | Damming of water in reservoirs may lead to flooding of settlements and agricultural lands, which may result in the necessity of displacement of the population | 0.10 | 3 | 0.30 |
| Total weighted score | 5.10 | |||
| External Factors Ratio (EFR) | 0.98 | |||
| Weight | Rating | Score | ||
|---|---|---|---|---|
| Strengths | 1.00 | |||
| 1 | Well known technology | 050 | 5 | 2.50 |
| 2 | Availability of resource | 0.30 | 5 | 1.50 |
| 3 | Possibility of using energy locally or sending it to grid | 0.20 | 4 | 0.80 |
| Total weighted score | 4.80 | |||
| Weaknesses | 1.00 | |||
| 1 | Heat unused directly from the biogas is waste | 0.60 | 5 | 3.00 |
| 2 | Big initial costs of biogas and biomass systems | 0.40 | 4 | 1.60 |
| Total weighted score | 4.60 | |||
| Internal Factors Ratio (IFR) | 1.04 | |||
| Opportunities | 1.00 | |||
| 1 | High social acceptance | 0.30 | 5 | 1.50 |
| 2 | Combining high energy-intensive greenhouse cultivation could make the technology more efficient | 0.20 | 5 | 1.00 |
| 2 | Big potential of growth | 0.30 | 3 | 0.90 |
| 3 | Fast development of the technology | 0.20 | 4 | 0.80 |
| Total weighted score | 4.20 | |||
| Threats | 1.00 | |||
| 1 | Volatility in the prices of resources from agriculture | 0.50 | 3 | 1.50 |
| 2 | Unstable domestic law unfavorable for the biomass and biogas systems | 0.30 | 4 | 1.20 |
| 3 | No guarantee of stable feedstock supplies in agricultural biogas and biomass plants | 0.20 | 3 | 0.60 |
| Total weighted score | 3.30 | |||
| External Factors Ratio (EFR) | 1.27 | |||
Publisher’s Note: MDPI stays neutral with regard to jurisdictional claims in published maps and institutional affiliations. |
© 2021 by the authors. Licensee MDPI, Basel, Switzerland. This article is an open access article distributed under the terms and conditions of the Creative Commons Attribution (CC BY) license (https://creativecommons.org/licenses/by/4.0/).
Share and Cite
Senkus, P.; Glabiszewski, W.; Wysokińska-Senkus, A.; Cyfert, S.; Batko, R. The Potential of Ecological Distributed Energy Generation Systems, Situation, and Perspective for Poland. Energies 2021, 14, 7966. https://doi.org/10.3390/en14237966
Senkus P, Glabiszewski W, Wysokińska-Senkus A, Cyfert S, Batko R. The Potential of Ecological Distributed Energy Generation Systems, Situation, and Perspective for Poland. Energies. 2021; 14(23):7966. https://doi.org/10.3390/en14237966
Chicago/Turabian StyleSenkus, Piotr, Waldemar Glabiszewski, Aneta Wysokińska-Senkus, Szymon Cyfert, and Roman Batko. 2021. "The Potential of Ecological Distributed Energy Generation Systems, Situation, and Perspective for Poland" Energies 14, no. 23: 7966. https://doi.org/10.3390/en14237966