
Self-Assessment Adaptive Capacity Indicators of Health Risks from Air Pollution

 ,
,  ,
,  and
and
Abstract
:1. Introduction
2. Literature Review
3. Research Methodology
3.1. Validation of the APAC Indicators
3.2. Individual-Level APAC Index
4. Results and Discussion
4.1. Exploratory Factor Analysis of APAC Indicators
4.2. Confirmatory Factor Analysis of EFA-Validated Components and Indicators
4.3. Calculation of APAC Index
5. Conclusions and Recommendations
Supplementary Materials
Author Contributions
Funding
Institutional Review Board Statement
Informed Consent Statement
Data Availability Statement
Conflicts of Interest
References
- Brook, R.D.; Urch, B.; Dvonch, J.T.; Bard, R.L.; Speck, M.; Keeler, G.; Morishita, M.; Marsik, F.J.; Kamal, A.S.; Kaciroti, N.; et al. Insights into the mechanisms and mediators of the effects of air pollution exposure on blood pressure and vascular function in healthy humans. Hypertension 2009, 54, 659–667. [Google Scholar] [CrossRef] [PubMed]
- Nemmar, A.; Hoylaerts, M.F.; Hoet, P.H.; Vermylen, J.; Nemery, B. Size effect of intratracheally instilled particles on pulmonary inflammation and vascular thrombosis. Toxicol. Appl. Pharmacol. 2003, 186, 38–45. [Google Scholar] [CrossRef]
- Xu, X. Recent advances in studies of ozone pollution and impacts in China: A short review. Curr. Opin. Environ. Sci. Health 2020, 19, 100225. [Google Scholar] [CrossRef]
- Gamarra, A.R.; Lechón, Y.; Vivanco, M.G.; Garrido, J.L.; Martín, F.; Sánchez, E.; Theobald, M.R.; Gil, V.; Santiago, J.L. Benefit Analysis of the 1st Spaish Air Pollution Control Program on Health Impacts and Associated Externalities. Atmosphere 2021, 12, 32. [Google Scholar] [CrossRef]
- Kampa, M.; Castanas, E. Human health effects of air pollution. Environ. Pollut. 2008, 151, 362–367. [Google Scholar] [CrossRef]
- Manisalidis, I.; Stavropoulou, E.; Stavropoulos, A.; Bezirtzoglou, E. Environmental and health impacts of air pollution: A review. Front. Public Health 2020, 8, 14. [Google Scholar] [CrossRef] [Green Version]
- Neidell, M. Air quality warnings and outdoor activities: Evidence from Southern California using a regression discontinuity design. J. Epidemiol. Community Health 2010, 64, 921–926. [Google Scholar] [CrossRef]
- Janhäll, S. Review on urban vegetation and particle air pollution–Deposition and dispersion. Atmos. Environ. 2015, 105, 130–137. [Google Scholar] [CrossRef]
- Osseiran, N.; Chriscaden, K. Air Pollution Levels Rising in Many of the World’s Poorest Cities; WHO: Geneva, Switzerland, 2016. [Google Scholar]
- Block, M.L.; Calderón-Garcidueñas, L. Air pollution: Mechanisms of neuroinflammation and CNS disease. Trends Neurosci. 2009, 32, 506–516. [Google Scholar] [CrossRef] [Green Version]
- Saxena, R.; Srivastava, S.; Trivedi, D.; Anand, E.; Joshi, S.; Gupta, S.K. Impact of environmental pollution on the eye. Acta Ophthalmol. Scand. 2003, 81, 491–494. [Google Scholar] [CrossRef]
- Rocha, C.A.; Lima, J.L.R.; Mendonça, K.V.; Marques, E.V.; Zanella, M.E.; Ribeiro, J.P.; Bertoncini, B.V.; Castelo Branco, V.T.F.; Cavalcante, R.M. Health impact assessment of air pollution in the metropolitan region of Fortaleza, Ceará, Brazil. Atmos. Environ. 2020, 241, 117751. [Google Scholar] [CrossRef]
- Rahman, S.A.; Ismail, S.S.; Sahani, M.; Ramli, M.F.; Latif, M.T. A case crossover analysis of primary air pollutants association on acute respiratory infection (ARI) among children in urban region of Klang valley, Malaysia. Ann. Trop. Med. Public Health 2017, 10, 44. [Google Scholar]
- Nhung, N.T.T.; Schindler, C.; Dien, T.M.; Probst-Hensch, N.; Künzli, N. Association of ambient air pollution with lengths of hospital stay for hanoi children with acute lower-respiratory infection, 2007–2016. Environ. Pollut. 2019, 247, 752–762. [Google Scholar] [CrossRef] [PubMed]
- Perera, F.P. Multiple threats to child health from fossil fuel combustion: Impacts of air pollution and climate change. Environ. Health Perspect. 2017, 125, 141–148. [Google Scholar] [CrossRef]
- Guan, W.-J.; Zheng, X.-Y.; Chung, K.F.; Zhong, N.-S. Impact of air pollution on the burden of chronic respiratory diseases in China: Time for urgent action. Lancet 2016, 388, 1939–1951. [Google Scholar] [CrossRef]
- Jiang, X.-Q.; Mei, X.-D.; Feng, D. Air pollution and chronic airway diseases: What should people know and do? J. Thorac. Dis. 2016, 8, E31. [Google Scholar] [PubMed]
- Rush, B.; McDermid, R.C.; Celi, L.A.; Walley, K.R.; Russell, J.A.; Boyd, J.H. Association between chronic exposure to air pollution and mortality in the acute respiratory distress syndrome. Environ. Pollut. 2017, 224, 352–356. [Google Scholar] [CrossRef] [Green Version]
- Choi, J.; Oh, J.Y.; Lee, Y.S.; Min, K.H.; Hur, G.Y.; Lee, S.Y.; Kang, K.H.; Shim, J.J. Harmful impact of air pollution on severe acute exacerbation of chronic obstructive pulmonary disease: Particulate matter is hazardous. Int. J. Chronic Obstr. Pulm. Dis. 2018, 13, 1053. [Google Scholar] [CrossRef] [Green Version]
- Dabass, A.; Talbott, E.O.; Rager, J.R.; Marsh, G.M.; Venkat, A.; Holguin, F.; Sharma, R.K. Systemic inflammatory markers associated with cardiovascular disease and acute and chronic exposure to fine particulate matter air pollution (PM2.5) among US NHANES adults with metabolic syndrome. Environ. Res. 2018, 161, 485–491. [Google Scholar] [CrossRef]
- Shabbir, R.; Ahmad, S.S. Monitoring urban transport air pollution and energy demand in Rawalpindi and Islamabad using leap model. Energy 2010, 35, 2323–2332. [Google Scholar] [CrossRef]
- Raaschou-Nielsen, O.; Andersen, Z.J.; Beelen, R.; Samoli, E.; Stafoggia, M.; Weinmayr, G.; Hoffmann, B.; Fischer, P.; Nieuwenhuijsen, M.J.; Brunekreef, B. Air pollution and lung cancer incidence in 17 European cohorts: Prospective analyses from the European Study of Cohorts for Air Pollution Effects (ESCAPE). Lancet Oncol. 2013, 14, 813–822. [Google Scholar] [CrossRef]
- Poikolainen, J. Mosses, Epiphytic Lichens and Tree Bark as Biomonitors for Air Pollutants: Specifically for Heavy Metals in Regional Surveys. 2005. Available online: http://jultika.oulu.fi/files/isbn9514274792.pdf (accessed on 25 November 2021).
- Giles, L.V.; Barn, P.; Künzli, N.; Romieu, I.; Mittleman, M.A.; van Eeden, S.; Allen, R.; Carlsten, C.; Stieb, D.; Noonan, C. From good intentions to proven interventions: Effectiveness of actions to reduce the health impacts of air pollution. Environ. Health Perspect. 2011, 119, 29–36. [Google Scholar] [CrossRef] [Green Version]
- Séguin, J.; Berry, P.; Bouchet, V.; Clarke, K.-L.; Furgal, C.; Environmental, I.; MacIver, D. Human health in a changing climate: A Canadian assessment of vulnerabilities and adaptive capacity. Hum. Health A Chang. Clim. 2008, 1, 1–494. [Google Scholar]
- Kjellstrom, T.; Weaver, H.J. Climate change and health: Impacts, vulnerability, adaptation and mitigation. New South Wales Public Health Bull. 2009, 20, 5–9. [Google Scholar] [CrossRef] [Green Version]
- Bambrick, H.J.; Capon, A.G.; Barnett, G.B.; Beaty, R.M.; Burton, A.J. Climate change and health in the urban environment: Adaptation opportunities in Australian cities. Asia Pac. J. Public Health 2011, 23, 67S–79S. [Google Scholar] [CrossRef] [PubMed]
- Jiang, Y.; Xing, J.; Wang, S.; Chang, X.; Liu, S.; Shi, A.; Liu, B.; Sahu, S.K. Understand the local and regional contributions on air pollution from the view of human health impacts. Front. Environ. Sci. Eng. 2021, 15, 88. [Google Scholar] [CrossRef]
- Liu, H.; Ma, W.; Qian, J.; Cai, J.; Ye, X.; Li, J.; Wang, X. Effect of urbanization on the urban meteorology and air pollution in Hangzhou. J. Meteorol. Res. 2015, 29, 950–965. [Google Scholar] [CrossRef]
- Stevens, C.; Bell, J.; Brimblecombe, P.; Clark, C.; Dise, N.; Fowler, D.; Lovett, G.; Wolseley, P. The impact of air pollution on terrestrial managed and natural vegetation. Philos. Trans. R. Soc. A 2020, 378, 20190317. [Google Scholar] [CrossRef]
- Pařil, V.; Tóthová, D. Assessment of the burden on population due to transport-related air pollution: The Czech core motorway network. J. Clean. Prod. 2020, 275, 123111. [Google Scholar] [CrossRef]
- Wen, X.-J.; Balluz, L.; Mokdad, A. Association between media alerts of air quality index and change of outdoor activity among adult asthma in six states, BRFSS, 2005. J. Community Health 2009, 34, 40–46. [Google Scholar] [CrossRef]
- Guarnieri, M.; Balmes, J.R. Outdoor air pollution and asthma. Lancet 2014, 383, 1581–1592. [Google Scholar] [CrossRef] [Green Version]
- Janssen, N.A.; van Vliet, P.H.; Aarts, F.; Harssema, H.; Brunekreef, B. Assessment of exposure to traffic related air pollution of children attending schools near motorways. Atmos. Environ. 2001, 35, 3875–3884. [Google Scholar] [CrossRef]
- Schikowski, T.; Sugiri, D.; Ranft, U.; Gehring, U.; Heinrich, J.; Wichmann, H.-E.; Krämer, U. Long-term air pollution exposure and living close to busy roads are associated with COPD in women. Respir. Res. 2005, 6, 152. [Google Scholar] [CrossRef] [Green Version]
- Zhang, J.; Mu, Q. Air pollution and defensive expenditures: Evidence from particulate-filtering facemasks. J. Environ. Econ. Manag. 2018, 92, 517–536. [Google Scholar] [CrossRef]
- Liu, T.; He, G.; Lau, A. Avoidance behavior against air pollution: Evidence from online search indices for anti-PM 2.5 masks and air filters in Chinese cities. Environ. Econ. Policy Stud. 2018, 20, 325–363. [Google Scholar] [CrossRef]
- Elavsky, S.; Jandačková, V.; Knapová, L.; Vašendová, V.; Sebera, M.; Kaštovská, B.; Blaschová, D.; Kühnová, J.; Cimler, R.; Vilímek, D. Physical activity in an air-polluted environment: Behavioral, psychological and neuroimaging protocol for a prospective cohort study (Healthy Aging in Industrial Environment study–Program 4). BMC Public Health 2021, 21, 126. [Google Scholar] [CrossRef]
- Gelmetti, C. Skin cleansing in children. J. Eur. Acad. Dermatol. Venereol. 2001, 15, 12–15. [Google Scholar] [CrossRef]
- Krutmann, J.; Liu, W.; Li, L.; Pan, X.; Crawford, M.; Sore, G.; Seite, S. Pollution and skin: From epidemiological and mechanistic studies to clinical implications. J. Dermatol. Sci. 2014, 76, 163–168. [Google Scholar] [CrossRef] [PubMed]
- Tiwari, G. Urban transport priorities: Meeting the challenge of socio-economic diversity in cities, a case study of Delhi, India. Cities 2002, 19, 95–103. [Google Scholar] [CrossRef]
- Ravindra, K.; Wauters, E.; Tyagi, S.K.; Mor, S.; Van Grieken, R. Assessment of air quality after the implementation of compressed natural gas (CNG) as fuel in public transport in Delhi, India. Environ. Monit. Assess. 2006, 115, 405–417. [Google Scholar] [CrossRef] [Green Version]
- Goel, R.; Gani, S.; Guttikunda, S.K.; Wilson, D.; Tiwari, G. On-road PM2.5 pollution exposure in multiple transport microenvironments in Delhi. Atmos. Environ. 2015, 123, 129–138. [Google Scholar] [CrossRef]
- Jarjour, S.; Jerrett, M.; Westerdahl, D.; de Nazelle, A.; Hanning, C.; Daly, L.; Lipsitt, J.; Balmes, J. Cyclist route choice, traffic-related air pollution, and lung function: A scripted exposure study. Environ. Health 2013, 12, 14. [Google Scholar] [CrossRef] [Green Version]
- Mohan, D. Traffic safety and health in Indian cities. J. Transp. Infrastruct. 2002, 9, 79–94. [Google Scholar]
- Wagner, D.R.; Clark, N.W. Effects of ambient particulate matter on aerobic exercise performance. J. Exerc. Sci. Fit. 2018, 16, 12–15. [Google Scholar] [CrossRef]
- Vollaard, N.B.; Shearman, J.P.; Cooper, C.E. Exercise-induced oxidative stress. Sports Med. 2005, 35, 1045–1062. [Google Scholar] [CrossRef]
- Yavari, A.; Javadi, M.; Mirmiran, P.; Bahadoran, Z. Exercise-induced oxidative stress and dietary antioxidants. Asian J. Sports Med. 2015, 6. [Google Scholar] [CrossRef] [PubMed] [Green Version]
- Simioni, C.; Zauli, G.; Martelli, A.M.; Vitale, M.; Sacchetti, G.; Gonelli, A.; Neri, L.M. Oxidative stress: Role of physical exercise and antioxidant nutraceuticals in adulthood and aging. Oncotarget 2018, 9, 17181. [Google Scholar] [CrossRef] [Green Version]
- Gralton, J.; McLaws, M.-L. Protecting healthcare workers from pandemic influenza: N95 or surgical masks? Crit. Care Med. 2010, 38, 657–667. [Google Scholar] [CrossRef]
- Golshahi, L.; Telidetzki, K.; King, B.; Shaw, D.; Finlay, W.H. A pilot study on the use of geometrically accurate face models to replicate ex vivo N95 mask fit. Am. J. Infect. Control 2013, 41, 77–79. [Google Scholar] [CrossRef] [PubMed]
- Lim, E.; Seet, R.; Lee, K.H.; Wilder-Smith, E.; Chuah, B.; Ong, B. Headaches and the N95 face-mask amongst healthcare providers. Acta Neurol. Scand. 2006, 113, 199–202. [Google Scholar] [CrossRef]
- Qian, Y.; Willeke, K.; Grinshpun, S.A.; Donnelly, J.; Coffey, C.C. Performance of N95 respirators: Filtration efficiency for airborne microbial and inert particles. Am. Ind. Hyg. Assoc. J. 1998, 59, 128–132. [Google Scholar] [CrossRef] [PubMed]
- Roberge, R.J.; Coca, A.; Williams, W.J.; Palmiero, A.J.; Powell, J.B. Surgical mask placement over N95 filtering facepiece respirators: Physiological effects on healthcare workers. Respirology 2010, 15, 516–521. [Google Scholar] [CrossRef] [PubMed]
- An, J.; Wang, Y.; Li, X.; Sun, Y.; Shen, S. Relationship between surface UV radiation and air pollution in Beijing. Huan Jing Ke Xue Huanjing Kexue 2008, 29, 1053–1058. [Google Scholar]
- Hoseinzadeh, E.; Taha, P.; Wei, C.; Godini, H.; Ashraf, G.M.; Taghavi, M.; Miri, M. The impact of air pollutants, UV exposure and geographic location on vitamin D deficiency. Food Chem. Toxicol. 2018, 113, 241–254. [Google Scholar] [CrossRef]
- Zhang, Y.; Zheng, L.; Tuo, J.; Liu, Q.; Zhang, X.; Xu, Z.; Liu, S.; Sui, G. Analysis of PM2.5-induced cytotoxicity in human HaCaT cells based on a microfluidic system. Toxicol. Vitr. 2017, 43, 1–8. [Google Scholar] [CrossRef]
- Lecas, S.; Boursier, E.; Fitoussi, R.; Vié, K.; Momas, I.; Seta, N.; Achard, S. In vitro model adapted to the study of skin ageing induced by air pollution. Toxicol. Lett. 2016, 259, 60–68. [Google Scholar] [CrossRef]
- Jin, S.-P.; Li, Z.; Choi, E.K.; Lee, S.; Kim, Y.K.; Seo, E.Y.; Chung, J.H.; Cho, S. Urban particulate matter in air pollution penetrates into the barrier-disrupted skin and produces ROS-dependent cutaneous inflammatory response in vivo. J. Dermatol. Sci. 2018, 91, 175–183. [Google Scholar] [CrossRef]
- Burke, K.E. Mechanisms of aging and development—A new understanding of environmental damage to the skin and prevention with topical antioxidants. Mech. Ageing Dev. 2018, 172, 123–130. [Google Scholar] [CrossRef]
- Daniel, L.C.; Heckman, C.J.; Kloss, J.D.; Manne, S.L. Comparing alternative methods of measuring skin color and damage. Cancer Causes Control 2009, 20, 313–321. [Google Scholar] [CrossRef] [PubMed] [Green Version]
- Nielsen, J.B. Percutaneous penetration through slightly damaged skin. Arch. Dermatol. Res. 2005, 296, 560–567. [Google Scholar] [CrossRef]
- Liu, J.; Zhang, W. The influence of the environment and clothing on human exposure to ultraviolet light. PLoS ONE 2015, 10, e0124758. [Google Scholar]
- Marrot, L. Pollution and sun exposure: A deleterious synergy. mechanisms and opportunities for skin protection. Curr. Med. Chem. 2018, 25, 5469–5486. [Google Scholar] [CrossRef] [PubMed]
- Kelishadi, R.; Moeini, R.; Poursafa, P.; Farajian, S.; Yousefy, H.; Okhovat-Souraki, A.-A. Independent association between air pollutants and vitamin D deficiency in young children in Isfahan, Iran. Paediatr. Int. Child Health 2014, 34, 50–55. [Google Scholar] [CrossRef]
- Wang, Z.; Wu, T.; Zhao, X.; Cheng, S.; Dai, G.; Dai, W. Big Data Analysis of Weather Condition and Air Quality on Cosmetics Marketing. J. Inf. Technol. Appl. Manag. 2017, 24, 93–105. [Google Scholar]
- Péter, S.; Holguin, F.; Wood, L.G.; Clougherty, J.E.; Raederstorff, D.; Antal, M.; Weber, P.; Eggersdorfer, M. Nutritional solutions to reduce risks of negative health impacts of air pollution. Nutrients 2015, 7, 10398–10416. [Google Scholar] [CrossRef] [Green Version]
- Whyand, T.; Hurst, J.; Beckles, M.; Caplin, M. Pollution and respiratory disease: Can diet or supplements help? A review. Respir. Res. 2018, 19, 79. [Google Scholar] [CrossRef] [PubMed] [Green Version]
- Zhang, W. Nutrition Solutions to Counter Health Impact of Air Pollution: Sci-entific Evidence of Marine Omega-3 Fatty Acids and Vitamins Alleviating Some Harms of PM2.5. Int. J. Food Nutr. Sci. 2015, 2, 58–63. [Google Scholar]
- Tong, H. Dietary and pharmacological intervention to mitigate the cardiopulmonary effects of air pollution toxicity. Biochim. Et Biophys. Acta (Bba)-Gen. Subj. 2016, 1860, 2891–2898. [Google Scholar] [CrossRef] [PubMed]
- Fuentes, F.; Paredes-Gonzalez, X.; Kong, A.-N.T. Dietary glucosinolates sulforaphane, phenethyl isothiocyanate, indole-3-carbinol/3, 3′-diindolylmethane: Antioxidative stress/inflammation, Nrf2, epigenetics/epigenomics and in vivo cancer chemopreventive efficacy. Curr. Pharmacol. Rep. 2015, 1, 179–196. [Google Scholar] [CrossRef] [Green Version]
- Sram, R.J.; Binkova, B.; Rossner, P., Jr. Vitamin C for DNA damage prevention. Mutat. Res. Fundam. Mol. Mech. Mutagenesis 2012, 733, 39–49. [Google Scholar] [CrossRef] [PubMed]
- Packer, L. Protective role of vitamin E in biological systems. Am. J. Clin. Nutr. 1991, 53, 1050S–1055S. [Google Scholar] [CrossRef] [PubMed]
- Künzli, N.; Jerrett, M.; Mack, W.J.; Beckerman, B.; LaBree, L.; Gilliland, F.; Thomas, D.; Peters, J.; Hodis, H.N. Ambient air pollution and atherosclerosis in Los Angeles. Environ. Health Perspect. 2005, 113, 201–206. [Google Scholar] [CrossRef] [PubMed]
- Singh, R.; Sram, R.J.; Binkova, B.; Kalina, I.; Popov, T.A.; Georgieva, T.; Garte, S.; Taioli, E.; Farmer, P.B. The relationship between biomarkers of oxidative DNA damage, polycyclic aromatic hydrocarbon DNA adducts, antioxidant status and genetic susceptibility following exposure to environmental air pollution in humans. Mutat. Res. Fundam. Mol. Mech. Mutagenesis 2007, 620, 83–92. [Google Scholar] [CrossRef] [PubMed] [Green Version]
- Ren, C.; Park, S.K.; Vokonas, P.S.; Sparrow, D.; Wilker, E.; Baccarelli, A.; Suh, H.H.; Tucker, K.L.; Wright, R.O.; Schwartz, J. Air pollution and homocysteine: More evidence that oxidative stress-related genes modify effects of particulate air pollution. Epidemiology 2010, 21, 198. [Google Scholar] [CrossRef] [PubMed] [Green Version]
- Bourdrel, T.; Bind, M.-A.; Béjot, Y.; Morel, O.; Argacha, J.-F. Cardiovascular effects of air pollution. Arch. Cardiovasc. Dis. 2017, 110, 634–642. [Google Scholar] [CrossRef]
- El-Maddawy, Z.K.; El-Sayed, Y.S. Comparative analysis of the protective effects of curcumin and N-acetyl cysteine against paracetamol-induced hepatic, renal, and testicular toxicity in Wistar rats. Environ. Sci. Pollut. Res. 2018, 25, 3468–3479. [Google Scholar] [CrossRef]
- Bresnahan, B.W.; Dickie, M.; Gerking, S. Averting behavior and urban air pollution. Land Econ. 1997, 73, 340–357. [Google Scholar] [CrossRef]
- Wu, X.; Chen, S.; Guo, J.; Gao, G. Effect of air pollution on the stock yield of heavy pollution enterprises in China’s key control cities. J. Clean. Prod. 2018, 170, 399–406. [Google Scholar] [CrossRef]
- German, J.A.; Harper, M.B. Environmental control of allergic diseases. Am. Fam. Physician 2002, 66, 421. [Google Scholar]
- Wauters, A.; Esmaeilzadeh, F.; Bladt, S.; Beukinga, I.; Wijns, W.; Van De Borne, P.; Pradier, O.; Argacha, J.-F. Pro-thrombotic effect of exercise in a polluted environment: A P-selectin-and CD63-related platelet activation effect. Thromb. Haemost. 2015, 113, 118–124. [Google Scholar]
- Xu, J.; Gao, C.; Lee, J.K.W.; Zhao, J. PM2.5: A barrier to fitness and health promotion in China. J. Sport Health Sci. 2017, 6, 292. [Google Scholar] [CrossRef] [PubMed]
- Xie, J.; Jin, L.; He, T.; Chen, B.; Luo, X.; Feng, B.; Huang, W.; Li, J.; Fu, P.; Li, X. Bacteria and antibiotic resistance genes (ARGs) in PM2.5 from China: Implications for human exposure. Environ. Sci. Technol. 2018, 53, 963–972. [Google Scholar] [CrossRef] [PubMed]
- Viana, M.; Querol, X.; Götschi, T.; Alastuey, A.; Sunyer, J.; Forsberg, B.; Heinrich, J.; Norbäck, D.; Payo, F.; Maldonado, J. Source apportionment of ambient PM2.5 at five Spanish centres of the European community respiratory health survey (ECRHS II). Atmos. Environ. 2007, 41, 1395–1406. [Google Scholar] [CrossRef]
- Kožíšek, F. Health significance of drinking water calcium and magnesium. Environ. Res. Sect. 2003, 1, 219–227. [Google Scholar]
- Organisation, W.H.; Staff, WHO. Guidelines for Drinking-Water Quality; World Health Organization: Geneva, Switzerland, 2004; Volume 1, Available online: https://www.who.int/water_sanitation_health/dwq/GDWQ2004web.pdf (accessed on 25 November 2021).
- Wen, M.; Gu, D. Air pollution shortens life expectancy and health expectancy for older adults: The case of China. J. Gerontol. Ser. A Biomed. Sci. Med Sci. 2012, 67, 1219–1229. [Google Scholar] [CrossRef] [Green Version]
- Chu, H.-T.; Huang, C.-C.; Lian, Z.-H.; Tsai, J.J. A ubiquitous warning system for asthma-inducement. In Proceedings of the IEEE International Conference on Sensor Networks, Ubiquitous, and Trustworthy Computing (SUTC’06), Taichung, Taiwan, 5–7 June 2016; pp. 186–191. [Google Scholar]
- Olufemi, A.C.; Mji, A.; Mukhola, M.S. Assessment of secondary school students’ awareness, knowledge and attitudes to environmental pollution issues in the mining regions of South Africa: Implications for instruction and learning. Environ. Educ. Res. 2016, 22, 43–61. [Google Scholar] [CrossRef]
- Qian, X.; Xu, G.; Li, L.; Shen, Y.; He, T.; Liang, Y.; Yang, Z.; Zhou, W.W.; Xu, J. Knowledge and perceptions of air pollution in Ningbo, China. BMC Public Health 2016, 16, 1138. [Google Scholar] [CrossRef] [Green Version]
- Sudarmadi, S.; Suzuki, S.; Kawada, T.; Netti, H.; Soemantri, S.; Tugaswati, A.T. A survey of perception, knowledge, awareness, and attitude in regard to environmental problems in a sample of two different social groups in Jakarta, Indonesia. Environ. Dev. Sustain. 2001, 3, 169–183. [Google Scholar] [CrossRef]
- Evans, G.W.; Jacobs, S.V. Air pollution and human behavior. J. Soc. Issues 1981, 37, 95–125. [Google Scholar] [CrossRef]
- Bayraktar, E.; Tatoglu, E.; Zaim, S. An instrument for measuring the critical factors of TQM in Turkish higher education. Total Qual. Manag. 2008, 19, 551–574. [Google Scholar] [CrossRef]
- Ismail Salaheldin, S. Critical success factors for TQM implementation and their impact on performance of SMEs. Int. J. Product. Perform. Manag. 2009, 58, 215–237. [Google Scholar] [CrossRef]
- Thanvisitthpon, N.; Shrestha, S.; Pal, I.; Ninsawat, S.; Chaowiwat, W. Assessment of flood adaptive capacity of urban areas in Thailand. Environ. Impact Assess. Rev. 2020, 81, 106363. [Google Scholar] [CrossRef]
- Marcoulides, K.M.; Foldnes, N.; Grønneberg, S. Assessing model fit in structural equation modeling using appropriate test statistics. Struct. Equ. Modeling A Multidiscip. J. 2020, 27, 369–379. [Google Scholar] [CrossRef]
- Drezner, Z.; Turel, O.; Zerom, D. A modified Kolmogorov–Smirnov test for normality. Commun. Stat.-Simul. Comput. 2010, 39, 693–704. [Google Scholar] [CrossRef] [Green Version]
- Ahad, N.A.; Yin, T.S.; Othman, A.R.; Yaacob, C.R. Sensitivity of normality tests to non-normal data. Sains Malays. 2011, 40, 637–641. [Google Scholar]
- Öztuna, D.; Elhan, A.H.; Tüccar, E. Investigation of four different normality tests in terms of type 1 error rate and power under different distributions. Turk. J. Med Sci. 2006, 36, 171–176. [Google Scholar]
- Mishra, P.; Pandey, C.M.; Singh, U.; Gupta, A.; Sahu, C.; Keshri, A. Descriptive statistics and normality tests for statistical data. Ann. Card. Anaesth. 2019, 22, 67. [Google Scholar]
- Anagnostopoulos, F.; Niakas, D.; Tountas, Y. Comparison between exploratory factor-analytic and SEM-based approaches to constructing SF-36 summary scores. Qual. Life Res. 2009, 18, 53–63. [Google Scholar] [CrossRef]
- Marsh, H.W.; Morin, A.J.; Parker, P.D.; Kaur, G. Exploratory structural equation modeling: An integration of the best features of exploratory and confirmatory factor analysis. Annu. Rev. Clin. Psychol. 2014, 10, 85–110. [Google Scholar] [CrossRef] [Green Version]
- Suhr, D.D. Exploratory or Confirmatory Factor Analysis? Proceedings of the 31st Annual SAS? Users Group International Conference; SAS Institute Inc.: Cary, NC, USA, 2006. [Google Scholar]
- Kyriazos, T.A. Applied psychometrics: Sample size and sample power considerations in factor analysis (EFA, CFA) and SEM in general. Psychology 2018, 9, 2207. [Google Scholar] [CrossRef] [Green Version]
- Kim, J.-O.; Mueller, C.W. Factor Analysis: Statistical Methods and Practical Issues; Sage: Beverly Hills, CA, USA, 1978; Volume 14. [Google Scholar]
- Baumgartner, H.; Homburg, C. Applications of structural equation modeling in marketing and consumer research: A review. Int. J. Res. Mark. 1996, 13, 139–161. [Google Scholar] [CrossRef] [Green Version]
- Gatignon, H. Statistical Analysis of Management Data; 2003; Available online: https://www.researchgate.net/publication/266984069_Statistical_Analysis_of_Management_Data (accessed on 25 November 2021).
- Hooper, D.; Coughlan, J.; Mullen, M. Structural Equation Modelling: Guidelines for Determining Model Fit. 2008. Available online: https://arrow.tudublin.ie/buschmanart/2/ (accessed on 25 November 2021).
- Fornell, C.; Larcker, D.F. Evaluating structural equation models with unobservable variables and measurement error. J. Mark. Res. 1981, 39–50. [Google Scholar] [CrossRef]

| Indicator ID | Description | References |
|---|---|---|
| A1 | Avoid leaving place of residence without proper protection when AQI levels are too high (AQI > 101). | [34,35,36,37] |
| A2 | Wear an N95 mask or equivalent when engaging in outdoor activity and AQI levels are too high (AQI > 101). | [36,50,51,52,53,54] |
| A3 | Apply sunscreen products with PA+++ and SPF30 to protect against UVA and UVB. | [63,64,65,66] |
| A4 | Adopt diet regimens that lower oxidative stress. | [59,67,68,69,70,71,72,73,74,75,76,77,78] |
| A5 | Install indoor air filter systems certified by one of the following institutes: the British Allergy Foundation (BAF), the Association of Home Appliance Manufacturers (AHAM), and the European Centre for Allergy Research Foundation (ECARF). | https://www.allergyuk.org/ (accessed on 1 September 2021) https://www.ecarf.org/en/ (accessed on 1 September 2021) https://www.aham.org/ (accessed on 1 September 2021) |
| A6 | Exercise regularly to reduce oxidative stress. | [46,47,48,49] |
| A7 | Take a shower and change into new clothes upon returning to place of residence (following outdoor activity). | [39,40] |
| A8 | Take dietary supplements to reduce oxidative stress. | [59,67,68,69,70,71,72,73,74,75,76,77,78] |
| A9 | Avoid outdoor exercise and/or activities when AQI levels are too high (AQI > 101). | [7,32,79,80,81,82,83] |
| A10 | Stay hydrated by drinking clean water every 2–3 hours, and the recommended quantity is 1.5 liters/day (8–10 glasses) for adult. | [84,85,86,87] |
| A11 | Elderly individuals with preexisting health conditions should avoid exposure to air pollution. | [80,81,88,89] |
| A12 | Aware of the health impacts of air pollution and equip oneself with relevant knowledge to mitigate the impacts. | [90,91,92,93] |
| Air Quality Index Levels of Health Concern | Numerical Value | Explanation and Recommendations |
|---|---|---|
| Good | 0–50 | Air quality poses minimal or no serious health risk. |
| Moderate | 51–100 | Air quality is somewhat satisfactory. Sensitive individuals nevertheless should avoid outdoor activity due to possible respiratory symptoms. |
| Unhealthy for sensitive groups | 101–150 | Sensitive individuals are susceptible to irritations and respiratory disorders. |
| Unhealthy | 151–200 | Increased likelihood of effects on the heart and lungs among general public, and the health impacts are more severe in sensitive groups. |
| Very unhealthy | 201–300 | Sensitive individuals are likely to experience frequent fatigue. Sensitive individuals are advised to remain indoors and restrict activities. |
| Hazardous | 301–500 | Sensitive individuals are at high risk of serious health effects. Everyone is strongly advised to avoid exercise and remain indoors. |
| Individual-Level APAC Index | Individual-Level APAC Grade | Meaning |
|---|---|---|
| 81–100 | A+ | Excellent self-protection against air pollution, with minimal to no health risks given that the AQI levels are below 500 *. |
| 71–80 | A | Very good self-protection against air pollution, with minimal to no health risks given that the AQI levels are below 300. |
| 61–70 | B | Good self-protection against air pollution, with minimal to no health risks given that the AQI levels are below 200. |
| 51–60 | C | Adequate self-protection against air pollution, with minimal to no health risks given that the AQI levels are below 150. |
| 41–50 | D | Limited self-protection against air pollution, with minimal to no health risks given that the AQI levels are below 100. |
| 0–40 | F | No self-protection against air pollution. |
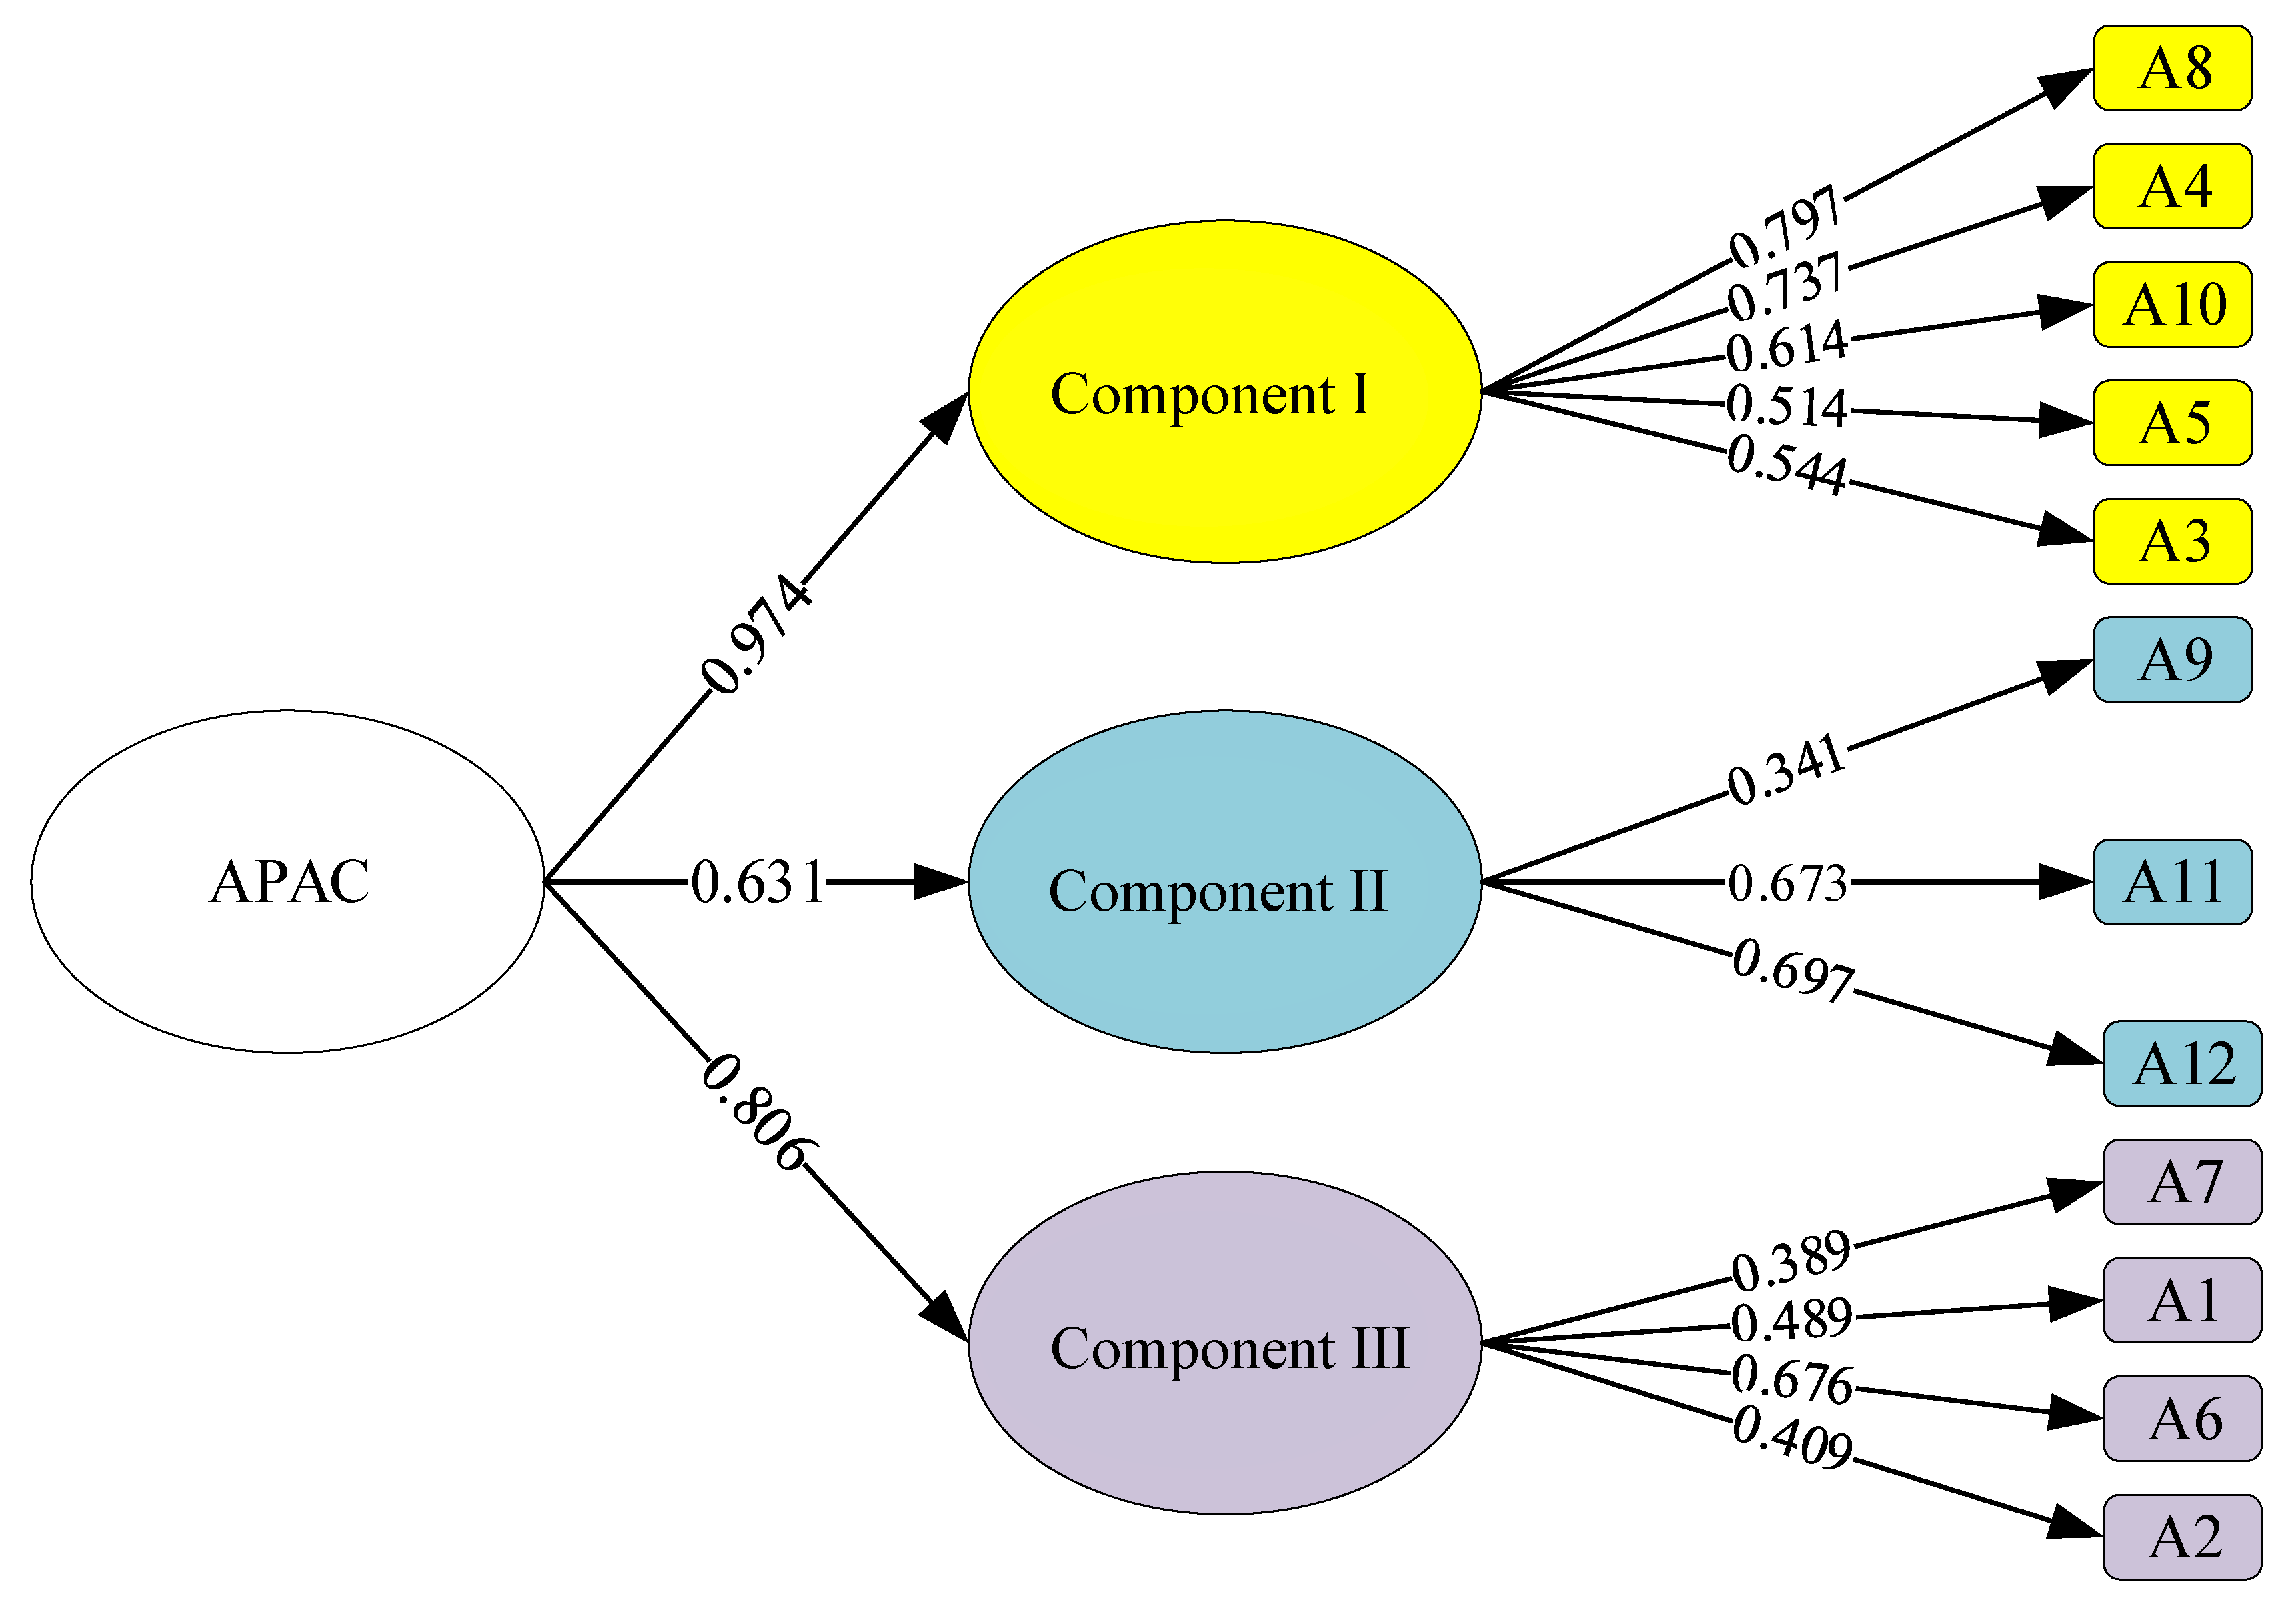
| Indicator ID | Indicator-Level Factor Loading (xi) | Component-Based Factor Weight Scores | ||
|---|---|---|---|---|
| Component I | Component II | Component III | ||
| A8 | 0.797 | 0.779 | ||
| A4 | 0.737 | 0.773 | ||
| A10 | 0.641 | 0.721 | ||
| A5 | 0.514 | 0.535 | ||
| A3 | 0.544 | 0.522 | ||
| A9 | 0.341 | 0.784 | ||
| A11 | 0.673 | 0.728 | ||
| A12 | 0.697 | 0.509 | ||
| A7 | 0.389 | 0.763 | ||
| A1 | 0.489 | 0.639 | ||
| A6 | 0.676 | 0.527 | ||
| A2 | 0.409 | 0.428 | ||
| Total Initial Eigenvalues | 3.834 | 1.378 | 1.107 | |
| % of Variance | 31.953 | 11.484 | 9.229 | |
| Component | APAC Indicators | Indictor-Level Reliability (R2) * | Validity of APAC Components | |
|---|---|---|---|---|
| Composite Reliability (CR) ** | Average variance Extracted (AVE) | |||
| Component I | 0.949 | 0.786 | ||
| (Component-level factor loading = 0.974) | A8 A4 A10 A5 A3 | 0.636 0.544 0.410 0.364 0.396 | ||
| Component II | 0.408 | 0.601 | ||
| (Component-level factor loading = 0.631) | A9 A11 A12 | 0.316 0.453 0.486 | ||
| Component III | 0.650 | 0.563 | ||
| (Component-level factor loading = 0.806) | A7 A1 A6 A2 | 0.352 0.339 0.456 0.367 | ||
| APAC Component | APAC Indicator | Indicator-Level Factor Loading | Normalized Indicator-Level Factor Loading (Equation (2)) | Weighted Average Score Based on Questionnaire II (Equation (1)) | ||
|---|---|---|---|---|---|---|
| Individual I | Individual II | Individual III | ||||
| Component I | A8 | 0.797 | 0.116 | 0.8 | 0.2 | 0.8 |
| A4 | 0.737 | 0.107 | 0.2 | 0.2 | 0.6 | |
| A10 | 0.614 | 0.089 | 0.8 | 0.4 | 0.8 | |
| A5 | 0.514 | 0.075 | 0.6 | 0.2 | 1.0 | |
| A3 | 0.544 | 0.079 | 0.6 | 0.4 | 0.6 | |
| Component II | A9 | 0.341 | 0.050 | 0.4 | 0.4 | 0.6 |
| A11 | 0.673 | 0.098 | 0.8 | 0.2 | 0.8 | |
| A12 | 0.697 | 0.101 | 0.6 | 0.2 | 1.0 | |
| Component III | A7 | 0.389 | 0.057 | 0.4 | 0.4 | 0.8 |
| A1 | 0.489 | 0.071 | 0.2 | 0.2 | 0.8 | |
| A6 | 0.676 | 0.098 | 0.2 | 0.4 | 0.8 | |
| A2 | 0.409 | 0.059 | 0.4 | 0.4 | 0.6 | |
| Individual-level APAC index (Equation (3)) | 51.7 | 28.6 | 77.6 | |||
| Individual-level APAC grade | C | D | B | |||
Publisher’s Note: MDPI stays neutral with regard to jurisdictional claims in published maps and institutional affiliations. |
© 2021 by the authors. Licensee MDPI, Basel, Switzerland. This article is an open access article distributed under the terms and conditions of the Creative Commons Attribution (CC BY) license (https://creativecommons.org/licenses/by/4.0/).
Share and Cite
Thanvisitthpon, N.; Rintra, J.; Sittiprapaporn, P.; Bumrungpert, A.; Trakulkongsmut, P. Self-Assessment Adaptive Capacity Indicators of Health Risks from Air Pollution. Sustainability 2021, 13, 13141. https://doi.org/10.3390/su132313141
Thanvisitthpon N, Rintra J, Sittiprapaporn P, Bumrungpert A, Trakulkongsmut P. Self-Assessment Adaptive Capacity Indicators of Health Risks from Air Pollution. Sustainability. 2021; 13(23):13141. https://doi.org/10.3390/su132313141
Chicago/Turabian StyleThanvisitthpon, Nawhath, Jarasphol Rintra, Phakkharawat Sittiprapaporn, Akkarach Bumrungpert, and Phaisit Trakulkongsmut. 2021. "Self-Assessment Adaptive Capacity Indicators of Health Risks from Air Pollution" Sustainability 13, no. 23: 13141. https://doi.org/10.3390/su132313141
APA StyleThanvisitthpon, N., Rintra, J., Sittiprapaporn, P., Bumrungpert, A., & Trakulkongsmut, P. (2021). Self-Assessment Adaptive Capacity Indicators of Health Risks from Air Pollution. Sustainability, 13(23), 13141. https://doi.org/10.3390/su132313141