Proceeding Paper

A Method Comparison Study between Open Source and Industrial Weather Stations †

by
Evmorfia P. Bataka
1,*,
Georgios Miliokas
2,
Nikolaos Katsoulas
2 and
Christos T. Nakas
1,3
1
Laboratory of Biometry, Department of Agriculture, Crop Production and Rural Environment, University of Thessaly, Fytokou St., 384 46 Volos, Greece
2
Laboratory of Agricultural Constructions–Greenhouses, Department of Agriculture, Crop Production and Rural Environment, University of Thessaly, Fytokou St., 384 46 Volos, Greece
3
University Institute of Clinical Chemistry, Inselspital, Bern University Hospital, University of Bern, 3010 Bern, Switzerland
*
Author to whom correspondence should be addressed.
Presented at the 13th EFITA International Conference, online, 25–26 May 2021.
Eng. Proc. 2021, 9(1), 8; https://doi.org/10.3390/engproc2021009008
Published: 19 November 2021
(This article belongs to the Proceedings of The 13th EFITA International Conference)

Abstract

:
Open-source devices are widespread and have been available to everyone over the past decade. The low cost of such devices boosts the creation of instruments for various applications such as smart farming, environmental monitoring, animal behavior monitoring, human health monitoring, etc. This research aims to use statistical methods to assess agreement and similarity in order to compare an open-source weather station that was constructed and programmed from scratch with an industrial weather station. The experiment took place in the experimental Greenhouses of the University of Thessaly, Velestino, Greece, for 7 consecutive days. The topology of the experiment consisted of 30 open-source weather stations and three industrials, creating three clusters with a ratio of 10 open-source to 1 industrial. The results revealed low to high agreement across the measurement range, with high variability, possibly due to factors that were not considered in the statistical model.

1. Introduction

The open-source philosophy [1] is applied in numerous areas of our society. The need for inexpensive and trustworthy devices in scientific and industrial applications fomented the hardware and software open-source community [2]. Τhe reliability of such devices is questioned since non-specialized individuals can produce devices expected to have certain specifications theoretically but fail to meet them in the field. Thus, a formal method should be applied, and the outcomes can be proof of the device’s effectiveness. The new device can be validated and assess its interchangeability compared to already established devices using appropriate statistical methods. Statistical methods to assess agreement and similarity are used extensively in medicine, applied chemistry [3,4] and other fields to compare approved and widely used devices or methods with experimental ones that might be either less expensive, less intrusive or even both [5]. The need for the application of this method in agriculture is vital since a great number of devices for environmental monitoring emerged during the past years [6,7]. Various comparison methods are used that are inappropriate and reveal misleading results, according to Altman et al. [8]. We constructed an inexpensive and user-friendly device for environmental monitoring and assessed its efficiency in field conditions. Then, we adapted existing statistical methods to assess agreement and similarity between our device and existing certified industrial ones to produce indices and graphs that are easily interpreted by individuals with no need for advanced knowledge in statistics.

2. Materials and Methods

2.1. Open-Source Weather Station

The open-source weather station constructed for this experiment uses a microcontroller and components listed in Table S1 (Supplementary Materials). It measures the air temperature every five minutes instantly. The device has the ability to store data in a private server provided by the Adafruit company, Adafruit IO [9], via WiFi. Figures S1 and S2 (Supplementary Materials) display the electronic parts and final product, respectively. The cost of the device is displayed in Table S2, which is around EUR 54 (2020 market prices). We programmed the microprocessor using Arduino IDE [10]. The libraries used are listed in Table S3 (Supplementary Materials). In Figure S3 (Supplementary Materials), the flowchart presents the sequence of the weather station’s functions.

2.2. Industrial Weather Station

The industrial weather station is a Thygro SDI-1 (Figure S4, Supplementary Materials) [11] and is equipped with air temperature, humidity and solar radiation sensor, solar panels and radiation shield. The temperature accuracy is ± 0.2   ° C , and the resolution is ± 0.015   ° C . The total cost is EUR 3000, while the service cost for remote monitoring is additional.

2.3. Experimental Design

The experiment took place in the experimental greenhouses, University of Thessaly, Greece. The topology consists of three industrial weather stations and 30 open-source, surrounding each industrial as shown in Figure S5. This configuration reduces the cost of the experiment substantially. The cultivation was tomato, and one of the industrial weather stations was located in chamber 1 and the rest in chamber 2. The duration of the experiment was 7 days.

2.4. Method Comparison Strategy

A method comparison study sets two important goals that we adapted in our research: According to Choudharry [12], the primary goal is to quantify the extent of agreement between two measurement methods and determine whether they have sufficient agreement so that we can use them ‘interchangeably’. The secondary goal is to compare important characteristics of the measurement methods such as biases, precision and sensitivities to find the sources of their disagreement. The latter comparison is set as the evaluation of similarity.
In our setting, the new method is the open-source weather station and the reference method is the industrial station. Indices and graphical illustrations aid the researcher in easily understanding and interpret the results with no need for advanced knowledge in statistics.
The official method comparison technique is the assessment of agreement and similarity using ad hoc statistical analysis [3,4]. Common practices used to compare two different methods/devices can be misleading or inappropriate. A short exposition is given in Table S4 (Supplementary Materials).
There are many indices and graphs used to interpret agreement between two methods or devices [13]. Each index has advantages and disadvantages, and a combination can be used for better understanding the results. The same applies for the graphical representations.
Choudharry et al. [12] proposed binormal and mixed effect models that produce indices by extracting the model’s parameters, useful graphs and indices for agreement, such as Concordance Correlation Coefficient (CCC), Total Deviation Index (TDI) and similarity indices, such as precision ratio, fixed bias and sensitivity. We followed this approach and also produced a similarity index, called fixed bias, which is the mean difference of the paired measurements of the devices.
The model used the method as the factor, which has two levels, the industrial as method 1 and the open source as method 2. Each pair of stations, which is the subject in our case, is the random factor. The model we adapted and the index formulas can be found in Table S5 (Supplementary Materials).
Our data are longitudinal since they are produced in 5-minute intervals. However, to avoid model complexity since the instances are too many, we modeled each occasion (5 min interval) separately for every day. Table S6 (Supplementary Materials) displays the number of occasions per day.

3. Results

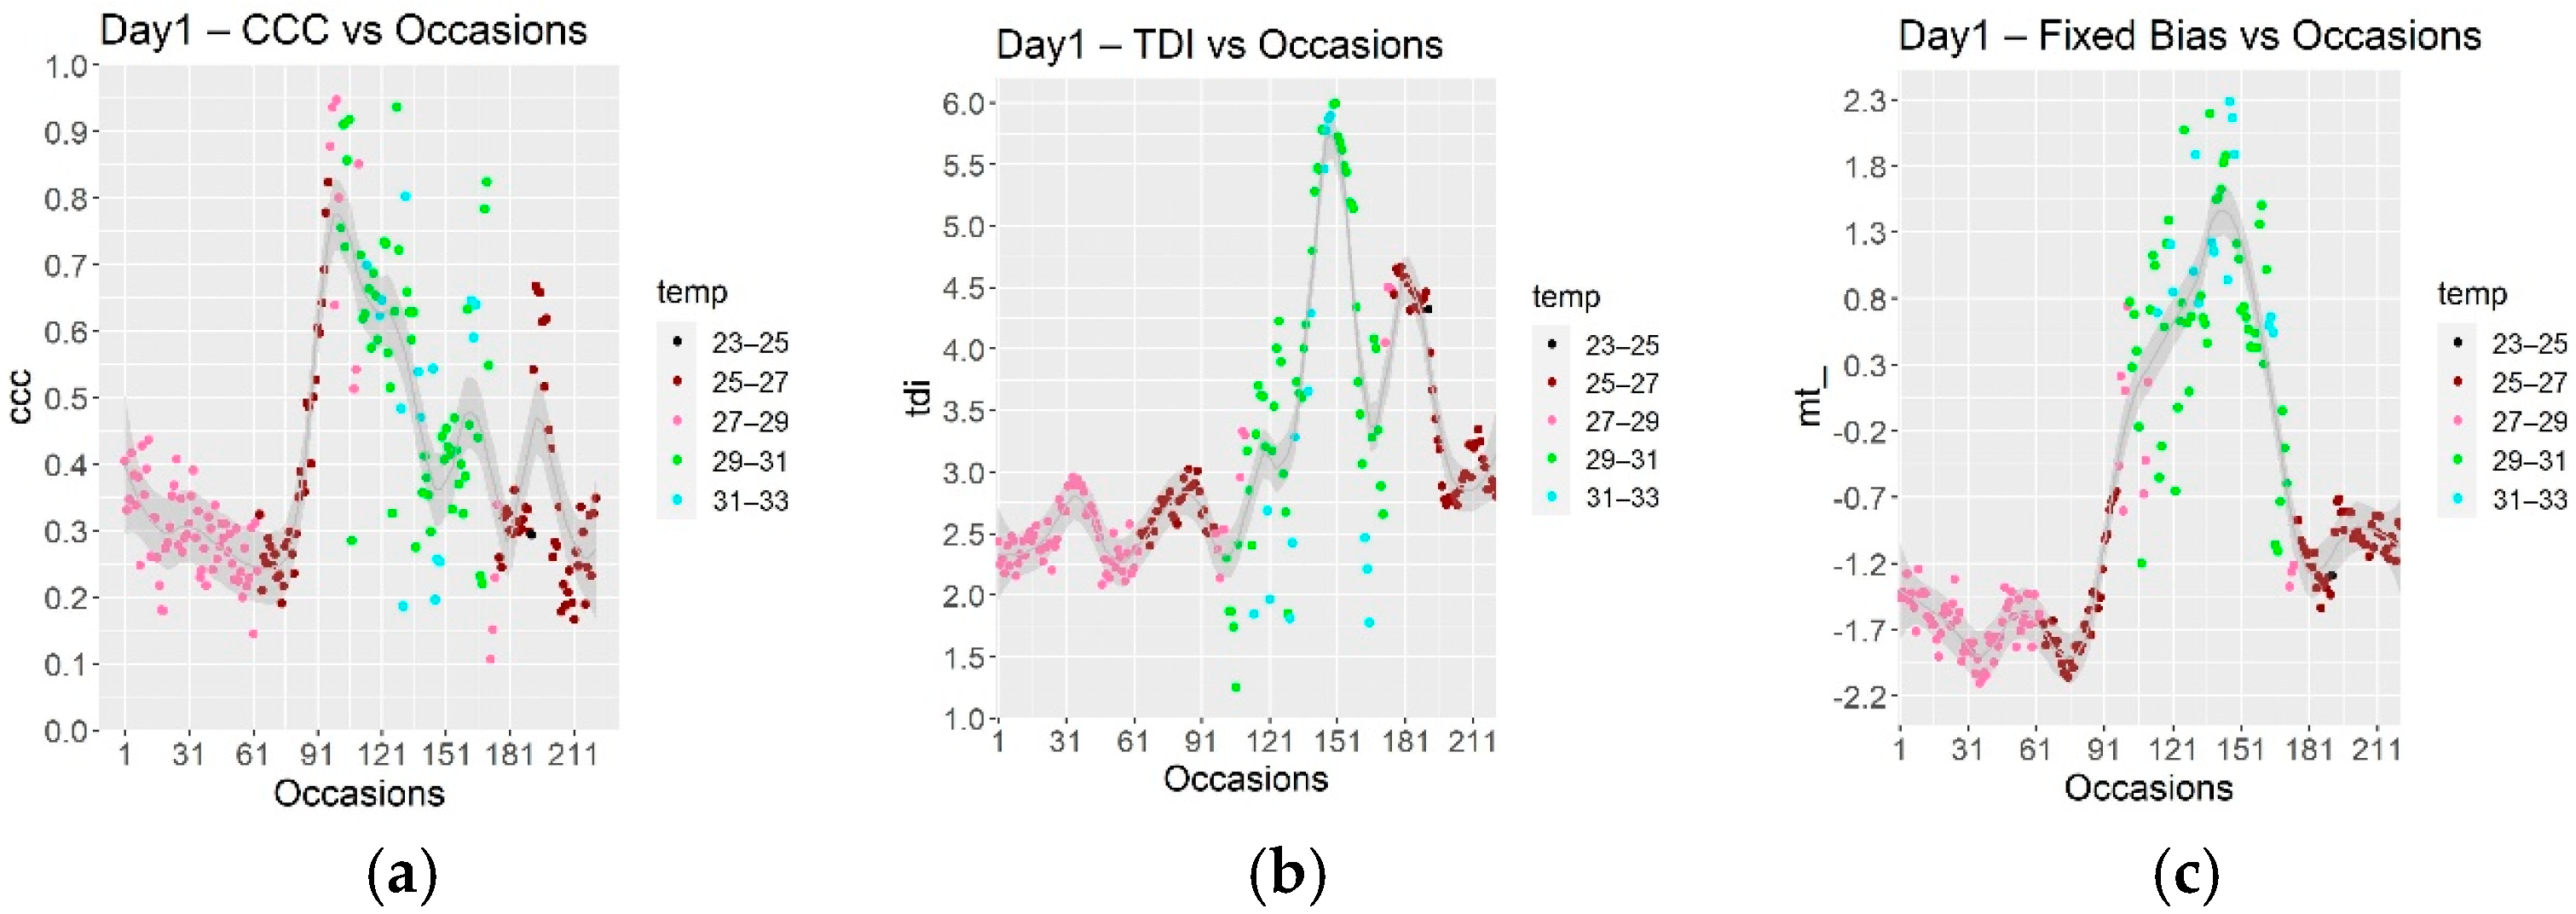
Visual Representation of the Results

The graphs produced for the visual representation of the data are the CCC vs. Occasion, the TDI vs. Occasion and the Fixed Bias vs. Occasion. Every graph has a common x-axis that corresponds to the occasions per day, and the points are color-coded for every pair based on pre-defined temperature categories. Only Day 1 is displayed below, and the rest can be found in the Supplementary Materials (Figures S6–S11).
For Day 1, the CCC vs. Occasions plot (Figure 1a) reveals low to high agreement for the whole temperature range due to the high variance of the index. The index is not consistent for the different temperature categories. The TDI vs. Occasions plot (Figure 1b) estimated that 90% of the absolute value of differences lies between 2.3 °C and 4.7 °C for temperatures lower than 27 °C and between 1.25 °C and around 6 °C for more than 27 °C. Temperatures more than 29 °C report higher variance than the others. The Fixed Bias vs. Occasions plot (Figure 1c) estimates −2.1 °C to 0.4 °C fixed bias for temperatures between 23 °C to 27 °C, −2.2 °C to around 0.75 °C fixed bias for temperatures between 27 °C and 29 °C and around −1.25 °C to 2.25 °C for the rest of the categories. The trend and the corresponding standard errors were estimated using a LOESS smoother.
Overall, from occasions 91 to 181, it seems that the variability is higher each day. This is probably due to the air humidity difference as shown in Figure S11. Thus, humidity is a possible factor that could explain the high variability on the indices.

4. Discussion

Our comparison study uses statistical methods to successfully assess agreement and similarity for open-source devices. We combine three useful indices and interpret them as complements. The analysis of the data revealed high to low agreement with increased variability for higher temperatures. The open-source weather station performance might be acceptable for specific applications, and the low production cost might encourage researchers to produce them. After examining our preliminary data, we conclude that there is a need for more research to reduce the variance of the indices across the temperatures. Specifically, adding other factors, such as air humidity, vegetation density or the location of each pair in the greenhouse, will certainly improve the model since there may be many confounding variables. Finally, including pooled data from the whole duration of the experiment and not only per day will reveal trends and will help retrieve hidden factors that affect the agreement.

Supplementary Materials

The following are available online at https://www.mdpi.com/article/10.3390/engproc2021009008/s1, Figure S1: Finalized PCB, Figure S2: The final product, Figure S3: Flowchart, Figure S4: Industrial Weather Station, Figure S5: The topology of the experiment, Figures S6–S11: Day 2 to Day 7 plots, Figure S12: Humidity for the greenhouse chambers, Table S1: Components List, Table S2: Cost, Table S3: Libraries, Table S4: Inadequate or misleading practices. Table S5: Model adapted for the analysis, Table S6: Number of occasions per day.

Author Contributions

Conceptualization, E.P.B. and C.T.N.; methodology, E.P.B. and C.T.N.; soft-ware, E.P.B. and C.T.N.; validation, E.P.B. and C.T.N.; formal analysis, E.P.B. and C.T.N.; investigation, E.P.B. and C.T.N.; resources, N.K.; data curation, E.P.B. and G.M.; writing—original draft preparation, E.P.B. and C.T.N.; writing—review and editing, E.P.B., C.T.N., G.M. and N.K.; visualization, E.P.B.; supervision, C.T.N.; project administration, C.T.N.; funding acquisition. All authors have read and agreed to the published version of the manuscript.

Funding

This research received no external funding.

Institutional Review Board Statement

Not applicable.

Informed Consent Statement

Not applicable.

Data Availability Statement

Data are contained within the article or Supplementary Material.

Conflicts of Interest

The authors declare no conflict of interest.

References

  1. Introduction to the Open-Source Philosophy and the Benefits of Sharing. Available online: https://www.academia.edu/44461841/Introduction_to_the_Open_Source_Philosophy_and_The_Benefits_of_Sharing (accessed on 20 March 2021).
  2. Community and Collaboration Open-Source Initiative. Available online: https://opensource.org/community (accessed on 19 April 2021).
  3. Tractenberg, R.E.; Jonklaas, J.; Soldin, S.J. Agreement of immunoassay and tandem mass spectrometry in the analysis of cortisol and free t4: Interpretation and implications for clinicians. Int. J. Anal. Chem. 2010, 2010, 234808. [Google Scholar] [CrossRef] [PubMed] [Green Version]
  4. Zaki, R.; Bulgiba, A.; Ismail, N.A. Testing the agreement of medical instruments: Overestimation of bias in the Bland-Altman analysis. Prev. Med. 2013, 57, 80–82. [Google Scholar] [CrossRef] [PubMed]
  5. Bataka, E.P.; Rodovitis, V.G.; Zarpas, K.D.; Papadopoulos, N.T.; Nakas, C.T. FruiTemp: Design, Implementation and Analysis for an Open-Source Temperature Logger Applied to Fruit Fly Host Experimentation. Appl. Sci. 2021, 11, 6003. [Google Scholar] [CrossRef]
  6. Fisher, D.K.; Fletcher, R.S.; Anapalli, S.S. Evolving Open-Source Technologies Offer Options for Remote Sensing and Monitoring in Agriculture. AIT 2010, 10, 1–10. [Google Scholar] [CrossRef] [Green Version]
  7. Martinez, J.; Egea, G.; Aguera, J.; Perez-Ruiz, M. A cost-effective canopy temperature measurement system for precision agriculture: A case study on sugar beet. Precis. Agric. 2017, 18, 95–110. [Google Scholar] [CrossRef]
  8. Altman, D.G.; Bland, J.M. Measurement in medicine: The analysis of method comparison studies. J. R. Stat. Soc. 1983, 32, 307–317. [Google Scholar] [CrossRef]
  9. Adafruit IO Basics. Available online: https://learn.adafruit.com/series/adafruit-io-basics (accessed on 1 February 2021).
  10. Arduino IDE. Available online: https://www.arduino.cc/en/software. (accessed on 25 July 2001).
  11. Thygro SDI-12 Temperature and Humidity Sensor. Available online: https://symmetron.gr/uploads/ThygroSDI-12Brochure_EN.pdf (accessed on 24 May 2021).
  12. Choudhary, P.K.; Nagaraja, H.N. Measuring Agreement, 1st ed.; Wiley: Hoboken, NJ, USA, 2017; pp. 1–251. [Google Scholar]
  13. Lin, L.; Hedayat, A.S.; Wu, W. Statistical Tools for Measuring Agreement, 1st ed.; Springer: New York, NY, USA, 2012; pp. 1–160. [Google Scholar]
Figure 1. (a) CCC vs. Occasions plot for Day 1 for every temperature range category. (b) TDI vs. Occasions plot for Day 1 for every temperature range category. (c) Fixed bias vs. Occasions for Day 1 for every temperature range category.
Engproc 09 00008 g001
Publisher’s Note: MDPI stays neutral with regard to jurisdictional claims in published maps and institutional affiliations.

