Article

Epistatic QTLsPlay a Major Role in Nitrogen Use Efficiency and Its Component Traits in Indian Spring Wheat

1
Division of Genetics, Indian Agricultural Research Institute, New Delhi 110012, India
2
Department of Plant Breeding and Genetics, Punjab Agricultural University, Ludhiana 141004, India
*
Author to whom correspondence should be addressed.
Agriculture 2021, 11(11), 1149; https://doi.org/10.3390/agriculture11111149
Submission received: 22 August 2021 / Revised: 21 September 2021 / Accepted: 4 October 2021 / Published: 16 November 2021
(This article belongs to the Section Genotype Evaluation and Breeding)

Abstract

:
Nitrogen use efficiency (NUE) in wheat may significantly reduce the excessive use of N fertilizers. However, being a quantitative trait, understanding its genetic basis is required for efficient wheat breeding. The present study was carried out to dissect the complex trait through the mapping of quantitative trait locus (QTLs) related to NUE component traits in Indian wheat. A linkage map was constructed using F2 population derived from two parents contrasting for nitrogen-responsive traits using simple sequence repeat (SSR) markers. Phenotyping for root dry weight, N uptake and utilization were carried out under a high nitrogen environment. Twenty-seven main effect QTLs for eight traits and 26 interaction QTLs for three traits were detected. The main effect QTLs explained a significant amount of phenotypic variance up to the extent of 11.18%. The QTLs were also found to have significant epistatic interactions governed by both additive and non-additive gene action. In particular, chromosome 2A harbours QTLs for many traits viz. SDW, RDW, TDW, R:S, %N, NUtE, and NUpE, including epistasis and interaction QTLs that were flanked by markers Xwmc728-Xwmc473 and Xwmc779-Xgwm249. Taken together, the genomic regions on 2A, 4A, and 7A were found to contain QTLs for a majority of the studied NUE traits that can be potentially exploited in future wheat breeding programmes.

1. Introduction

Wheat (Triticum aestivum L.) is an important source of energy, contributing mainly through carbohydrates and nutritional protein for both humans and livestock [1]; and the necessity to raise its production is unquestioned. Globally, around 765 MT of wheat is produced from the acreage of 220 Mha [2]. It is well-known that irrigation, semi-dwarf varieties, and increased nitrogen (N) fertilization were important factors for the increase in wheat yields during the 20th century [3]. Nitrogen (N) is one of the most essential macronutrients for grain quality and yield characters in cereals [4]. N is a key element of protein, nucleotide, and chlorophyll, hence the non-legume plants use 20–50 g of N to produce a kilogram of biomass [5]. N and soil water are the most constraining factor in wheat production in many parts of the world [6], and therefore, additional N inputs are required to optimize profitability and productivity. There has been an increasing trend in N fertilizer application globally, from 30 M tons in 1970 to about 100 M tons in 2010 and is further likely to reach up to 150 M tons/year by 2050 [7]. Although, processes like volatilization, runoff, denitrification, and leaching results in loss of a large proportion of the applied N (50–70%) from the plant-soil framework [8], still the adverse effects of fertilizer use can be seen including damage to the environment, a large carbon footprint, and depletion of non-renewable resources [9].
Currently, two key concerns are: (i) the declining rate of growth for crop yields, including wheat, and (ii) the overuse of fertilizer [10]. Further increase in applied N will not result in yield improvements, but will have serious environmental implications [11]. There is no parallelism between yield improvement and fertilizer use, as cereal grain yield increased by 250% [12] in the last fifty years against a 2800% increase for N fertilizer use in India [13]. Consequently, nutrient use efficiency ((NUE) more specifically), has declined rapidly, resulting in serious environmental problems. Currently, the worldwide recovery of N fertilizer in cereal systems is on an average low at ca. 17–50% (Faostat.com) (http://www.fao.org/faostat/en/#data, accessed on 20 July 2018). Higher values of N recovery at ca. 50–60% are reported in very few countries, for instance, for winter wheat in the UK [14].
To meet the projected demand for food with minimum footprints on the environment, improving NUE of cropping systems is essential. NUE is a term used to indicate the grain production per unit of available N in the soil [15]. In a broad sense, NUE is the total biomass per unit of N input (e.g., N supplied by fertilizers and/or residual N present in the soil). N uptake efficiency (NUpE) and N utilization efficiency (NUtE) are the two primary components of NUE. Theoretically, NUE can be enhanced by improving either NUpE or NUtE or both. This can be practically achieved by a better understanding of genetic regulation of N uptake, assimilation, recycling and remobilization in the different plant organs through different phases of plant growth under contrasting N supply [8,16].
There are many physiological studies that decipher the role of single or few enzymes, but failed to take complete account of variation available for NUE. Recent advances in quantitative genetics along with molecular markers may pave the way for a better understanding of genetic variation for complex traits. The NUE, is a complex trait governed by several genes and is largely influenced by the environment [17].To know the position, location, numbers, effects and interaction of loci controlling the traits, quantitative trait loci (QTL) mapping is the best way and can be used as one of the selection strategies. In several studies, QTLs for NUE and its component traits in wheat have been mapped under different agronomic conditions, including low N (LN) level/optimum N level/high N (HN) levels)in the field or under hydroponic culture or in pots [18,19,20,21,22,23,24,25,26,27,28,29,30,31,32]. Most of these studies have been done on winter wheat, and there is a lack of information on important genomic regions governing the NUE in Indian spring wheat germplasm.Moreover, the majority of these studies have focused on QTL analyses for agronomic traits or biochemical enzymes like GS and GDH involved in N assimilation as candidate genes under varying levels of N application in wheat [22,23,24,32].
Numerous QTL mapping studies were performed for agronomic traits in the past, largely ignoring the below-ground root traits [33]. Recent advancements in marker-assisted selection and phenomic facilities created for observing root traits enabled the breeder for desirable selection of root traits. The root is the vital organ for the efficient acquisition of nutrients and water from the soil. Therefore, understanding the genetic basis of root dry weight in response to HN availability could help the breeder for breeding wheat with root biomass desirable for nutrient acquisition in an HN environment. Several studies reported QTLs for root weight in wheat [20,28,34,35,36,37,38]. The most challenging task is to study root morphology in soil especially for QTL mapping where many genotypes have to be phenotyped with precision. Hydroponic condition ensures large-scale evaluation with minimum error and also enable good agreement between hydroponic data and pipe filled with soil for root and NUE traits [16]. Therefore, phenotyping the F2:3 materials under hydroponic conditions simulates field data or pipe filled with soil [16]. Root traits QTLs detected in hydroponics conditions have coincided with the report for nutrient uptake and yield components in wheat [19,35,39] in field trials. There are a few studies that involve the concerns of the epistatic interactions between co-localized QTLs. The present study was therefore carried out to dissect the complex trait through mapping of QTLs related to NUE and epistatic interaction for trait expression in Indian wheat.

2. Materials and Methods
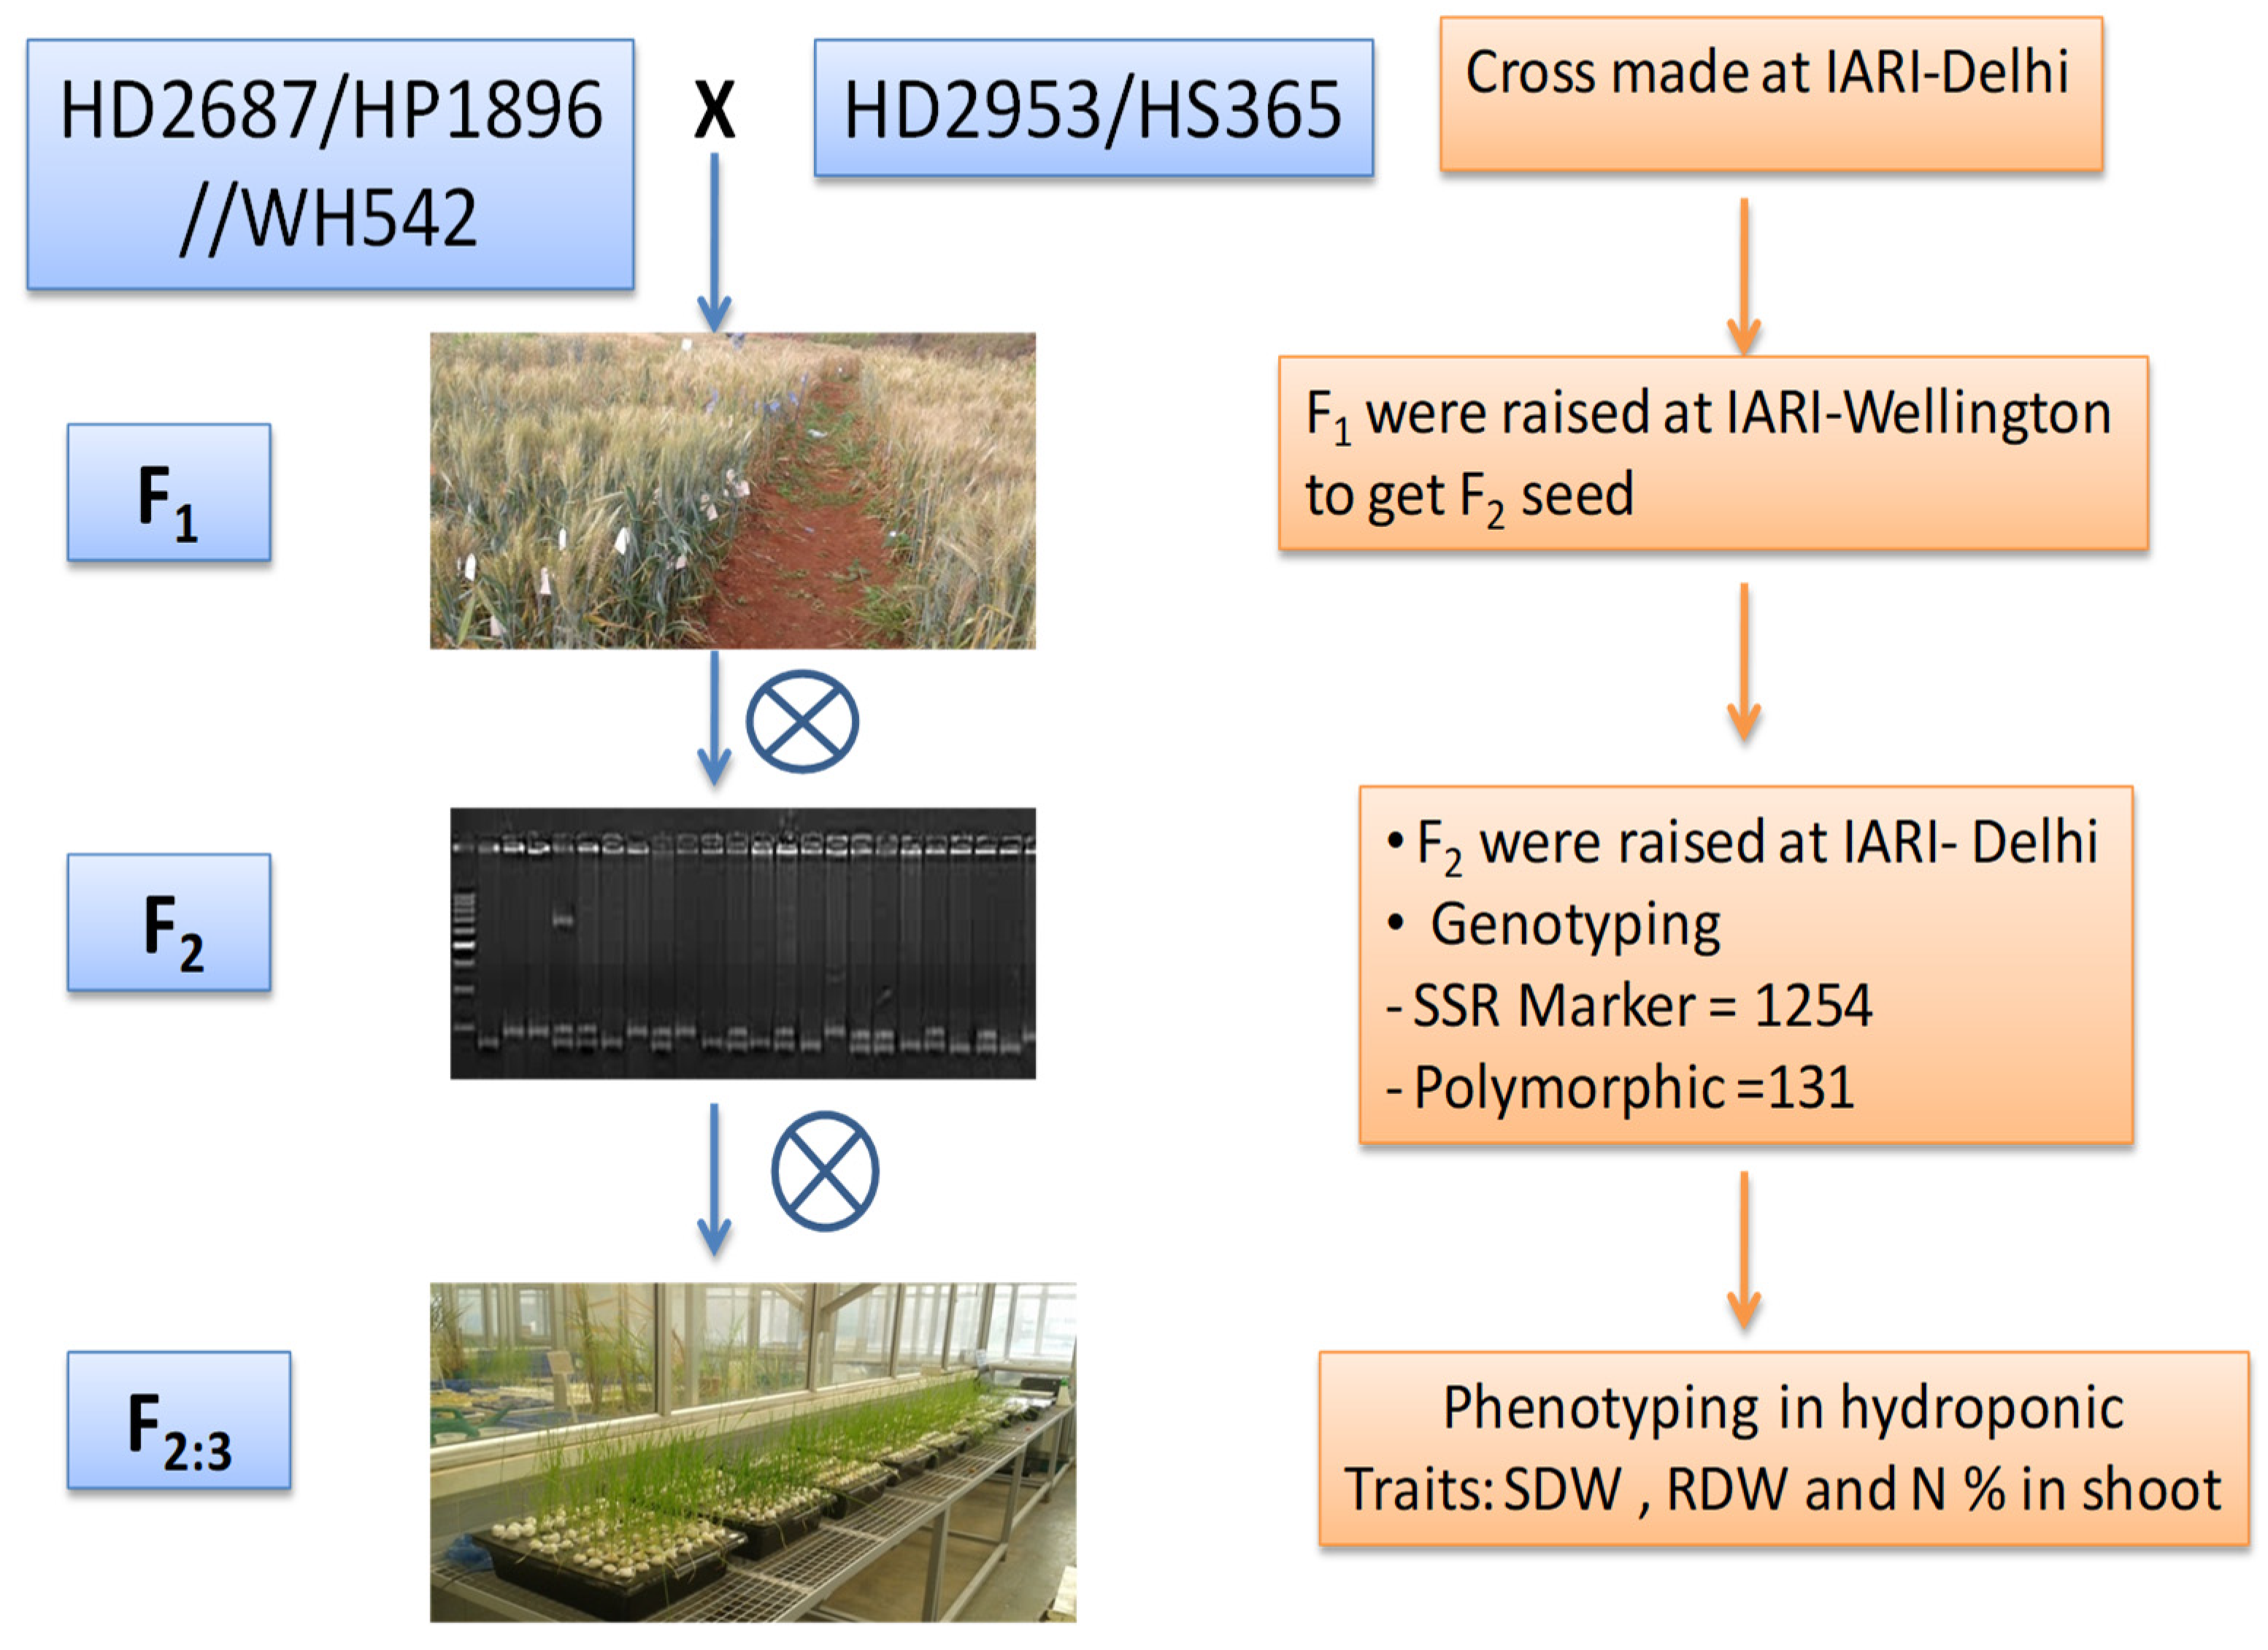
2.1. Plant Material

The mapping population for the present study comprised 187 F2 and F2:3 populations generated by crossing two contrasting germplasm lines for NUE, i.e., parent 1 (a derivative of three-way cross of (HD2687/HP1896)//WH542 × parent 2 (derived from the cross of HD2953/HS365). The parental lines showed variation for most of the component traits of NUE, and hence were used to generate the mapping population to identify a genomic location related to NUE–related traits. Parent 1 was N responsive, whereas parent 2 was N non-responsive genotype developed through conventional breeding techniques and had earlier been selected under conservation agriculture conditions [40]. The F2 population was used for genotyping with SSR markers and the F2 derived F3 (F2:3) families were used for phenotyping of NUE traits.

2.2. Genotyping

A hybridity test was carried out to confirm the trueness of F1 with SSR marker that was polymorphic between the parents. The F2 population obtained by advancing the single F1 seed (cross between two extreme N responsive genotypes, i.e., parent 1 and parent 2) were grown at the research farm of the Division of Genetics, IARI, New Delhi during rabi 2016–17. Fresh leaves were collected from 30 days old seedlings of individual F2 plants for DNA isolation following modified CTAB (Cetyl Tri Methyl Ammonium Bromide) given by Murray and Thompson [41]. Genotyping was carried out using SSR markers well distributed on the 21 chromosomes. Polymorphism study was carried out for a diverse set of SSR markers (Xgwm, Xwmc,Xbarc, Xgdm, Xcfd and Xcfa series) selected from published SSR maps [42,43,44,45,46]. A total of 1254 microsatellite markers, covering all chromosomes were selected for polymorphism between the parents (HD2687/HP1896)//WH542 and (HD2953/HS365). SSR markers were selected from each arm of individual chromosome spanning a distance of approximately 20 cM for parental polymorphism.The PCR reaction profile was: DNA denaturation at 95 °C for 5 min followed by 35 cycles of 94 °C for 1 min, annealing at 55, 58 or 60 °C for 1min (depending upon primer), extension at 72 °C for 1 min and finally 72 °C for a final extension of 10 min. The amplified products were resolved on 3.0% Metaphor agarose gel (Lonza, Rockland, ME, USA) stained with 0.1 mg/mL ethidium bromide, along with a 100 bp DNA size standard ladder and documented in a Gel Documentation System. The parent 1 ((HD2687/HP1896)//WH542) allele was designated as “2” whereas the parent 2 (HD2953/HS365) allele was scored as “0” whereas heterozygote individuals were scored as “1”. Missing bands were scored as ‘−1’.

2.3. Phenotyping of F2:3 Populations under Hydroponic Condition

All 187 F2:3 families were raised under the hydroponic system in temperature and photoperiod control condition that was maintained at the National Phytotron Facility at IARI, New Delhi, India. Twenty seeds of each of the 187 F2:3 families were taken to maintain the genetic identity of respective individual F2 plants. Temperature regime was maintained at 25/22 °C (day/night)with a light intensity of 300 µmol m−2 s−1 using cool fluorescent lamps in 10/14 h of dark and light timing using an automatic timer. High relative humidity of 65–70% [47] was maintained to ensure better growth.
Briefly, during rabi 2017–18 sterilization of uniform seeds of each plant of F2:3 with 1% sodium hypochlorite for 2 min, followed by thorough washing with distilled water was done and seeds were placed on towel paper for germination in a seed incubator. After germination, one-week-old seedlings were transferred to the ceramic lid holes on plastic boxes of 18 L capacity; holes of around 8 mm diameter were previously drilled on the lids. In each hole, five seedlings wrapped in cotton plug were placed in such a way that their roots remained immersed in hydroponic solutions of the tank. Thus, twenty seedlings of each F2:3 were immersed in 4 holes of a lid (five seedlings per hole). The pH of the solution was maintained to 6–6.5 by using 1 M HCl or 1 M KOH and was aerated by an aquarium air pump.
The nutrient solution used in the hydroponic system contained macronutrients: 0.4 mM NH4NO3, 10 mM KNO3, 2 mM CaNO3, 2 mM MgSO4, 0.1 mM KH2PO4, 1.5 mM CaCl2 and micronutrients: 0.1 mM Fe-EDTA, 12.5 µM H3BO3, 2 µM MnCl2, 3 µM ZnSO4, 0.5 µM CuSO4, 0.1 µM Na2MoO3, 0.1 µM NiSO4 and 25 µM KCl. The solution was used to create N non-limiting environments and was replaced every week to maintain a normal status of the nutrients. The experiment was terminated after 8 weeks on 60th days of growth under hydroponic conditions.
The plants were grown up to 60 days and harvested on the 60th day. Ten seedlings of two holes bulked and averaged constituted one replication and thus two replications per data point were generated for shoot dry weight (SDW), root dry weight (RDW) and N content in the shoot. Root and shoot portion was separated after harvest and were oven-dried at 60 °C for 4 days before measuring the dry weights (g). Schematic representation for QTL mapping is presented in Figure 1. The dry weights (g) (shoot and root) were measured using Microbalance. Shoot N% was estimated by Micro-Kjeldahl method. Root-shoot ratio (R:S) was recorded as the ratio of RDW to SDW and total dry weight (TDW), was measured as the sum of SDW and RDW. NUE and its component traits, i.e., NUpE (Nitrogen uptake efficiency) and NUtE (Nitrogen utilization efficiency) were calculated using the following three formulas [15].
Nitrogen   use   efficiency   ( NUE ) : Shoot   dry   weight   ( g ) N   supplied   in   gm   per   plant
Nitrogen   uptake   efficiency   ( NUpE ) : Total   N   in   gm   per   plant   ( gN ) N   supplied   in   gm   per   plant
Nitrogen   utilization   efficiency   ( NUtE ) : Shoot   dry   weight   ( g ) Total   N   in   gm   per   plant
where Total N in gm per plant (gN) = N% in shoot × Shoot dry weight (g).
Thus, NUE = NUpE   ×   NutE and N supply (g/plant) was measured as the ratio of total N supplied through N source by the total number of plants in a hydroponic tray.

2.4. Statistical Analysis

The means, standard deviations, standard errors, ranges, skewness, and W-Test of each measured morphological trait were calculated by using ICIM V 4.1.0.0 [48] and OpStat [49]. Skewness measured the amount and direction of skew (departure from horizontal symmetry) and W-test revealed the pattern of normal distribution in the population at p-value < 0.05. The correlation coefficients among different traits were analysed using R software.

2.5. Detection of Loci Linked with the Quantitative Traits

The genetic linkage map was constructed using data on scorable polymorphic markers using software ICIM V 4.1.0.0 [49]. The critical likelihood of odds ratio (LOD) of ≥3.0 was used to construct the linkage map. The Kosambi mapping function was used for the conversion of recombination fraction into the genetic distance. ICIM was used for the identification of additive, dominant and epistatic QTLs in ICIM v 4.1.0.0 with biparental (BIP) program. The walking speed chosen for all QTL analyses was 1 cM and the probability in stepwise regression was set at 0.0001 to detect QTL with additive and dominance effects (ICIM-ADD). For the detection of digenic epistatic QTL (ICIM-EPI), the probability in stepwise regression was set at 0.0001 and the scanning step was 5 cM. For each QTL, the position with the highest LOD score was taken as the most likely position of the QTL. Mean phenotypic values of each NUE trait were initially used for analysis to identify significant genetic markers associated with phenotypic traits. The identified QTL were classified as additive (A) (|d/a| < 0.2), partial dominance (PD) (0.2 < |d/a| <0.8), dominance (D) (0.8<|d/a|<1.2), and over dominance (OD) (|d/a|>1.2) as described by [50]. Nomenclature for the QTLs was designated based on the catalogue for gene symbols for wheat (http://wheat.pw.usda.gov/ggpages/wgc/98/, accessed on 20 April 2018). The small-effect QTLs were determined using genome wide composite interval mapping approach using gCIMsoftware Version 2.0 [51,52] (www.QTLgCIMapping.GUIversion2.0, accessed on 20 August 2021).

3. Results

3.1. Phenotypic Characterization of NUE and Related Traits in Two Parents and F2:3 Population

Phenotypic analysis of the parents and F2:3 populations revealed significant variation for all NUE related traits (Table 1). The mean value of each trait lies within the range of two parents except N%, where the higher mean value was observed in F2:3 population in comparison to the parents. The maximum and minimum value revealed that all traits showed transgressive segregation. Skewness and W-test for each trait revealed that the population followed a normal distribution with moderate skewness for some of the traits. Pearson’s correlation coefficient analysis between the NUE related traits among F2:3 genotypes are presented in Figure 2. All the traits were significantly correlated among themselves either in the positive or negative direction. R:S ratio had a significant negative correlation with all the traits except for NUtE. Correlation coefficients of NUtE are significant and negative with all the traits except the R:S ratio.

3.2. Construction of Genetic Map and Mapping of QTLs for NUE Related Traits

Out of 1254 microsatellite markers, 131 markers (10.5%) revealed polymorphism between the two parents. Out of these 131 polymorphic SSR markers, only 103 loci produced clear scorable bands and were used for genotyping in the F2 population (Table S1). For some of the SSR markers, more than one fragment of template DNA was amplified due to the allohexaploid nature. A total of 103 loci were used to construct a linkage map. Markers were unevenly distributed between linkage groups. The maximum number of markers were found on 7D with nine markers estimating a map length of 556.85 cM, while the lowest was on 4B with a map length 113.3 cM, followed by 6Dwith 174.4 cM and 6B with 223.06 cM having three markers each, respectively. Mean phenotypic data of eight NUE related traits and genotypic data of 103 SSR loci were used for QTL analysis. A total of 27 QTLs were detected on 14 chromosomes for the eight traits (Table 2). The LOD score of the identified QTLs varied from 3.03 to 7.94 (critical LOD score > 3.00). The phenotypic variance (R2) ranged from a minimum of 1.09% for QNUtE.iari-7D.1 to a maximum of 11.18% for QNUpE.iari-4A.
Two significant QTLs have been identified for SDW and/or NUE (LOD value > 3.00). The QSdw.iari-2A and QSdw.iari-7A explained 10.47% and 5.01% phenotypic variance, respectively. The QTLs detected for SDW and NUE were the same as NUE was a derived trait (based on a formula) from SDW. The degree of dominance ratio revealed that the over dominance effect was in preponderance over the additive effect for SDW and NUE expression for both the QTLs.Two QTLs were detected for RDW, TDW, N% in shoot and NUpE each. QRdw.iari-4A and QRdw.iari-7Aexplained the phenotypic variance of 5.82% and 8.23%, respectively. The QTLs for this trait behaved in dominance and over dominance fashion. TDW QTLs were mapped on 2A and 4D and over dominance gene action was observed for controlling the trait expression. N% in shoot QTLs (QN%.iari-4B and QN%.iari-7D) revealed over dominance in the QTLs expression.QTLs for NUpE were mapped on 2A and 4A and behave in over dominance manner for trait expression. Ten QTLs were detected for NUtE and seven QTLs for R:S, respectively. Ten QTLs for NUtE were mapped at 2A, 3A, 5A, 5B, 1D, 2D, 4D and 7D. These identified QTLs together accounted for 32.39% of phenotypic variation for NUtE and dominance and over dominance were observed in their trait expression. Seven QTLs were identified for R:S ratio belonging to 2A, 4A, 1B, 3B, 6B, and 2D that accounted for a total of 21.48% phenotypic variation.

3.3. Detection of Small-Effect QTLs

In addition to the major QTLs, the small-effect QTLs were determined using genome wide composite interval mapping approach (gCIM). There were a total of 27 QTLs reported for eight phenotypic traits (Table 3).Eight of these 27 QTLs were large-effect QTLs explaining more than 10% phenotypic variance whereas the remaining 19 QTLsappear to be minor effect QTLs detected for various traits. The minor QTLs explained phenotypic variance ranging from 2.39 (RDW) to 7.82 (R:S). Nine of the QTLs reported in gCIM (Table 3) were the same as reported in Table 2 by ICIM software.

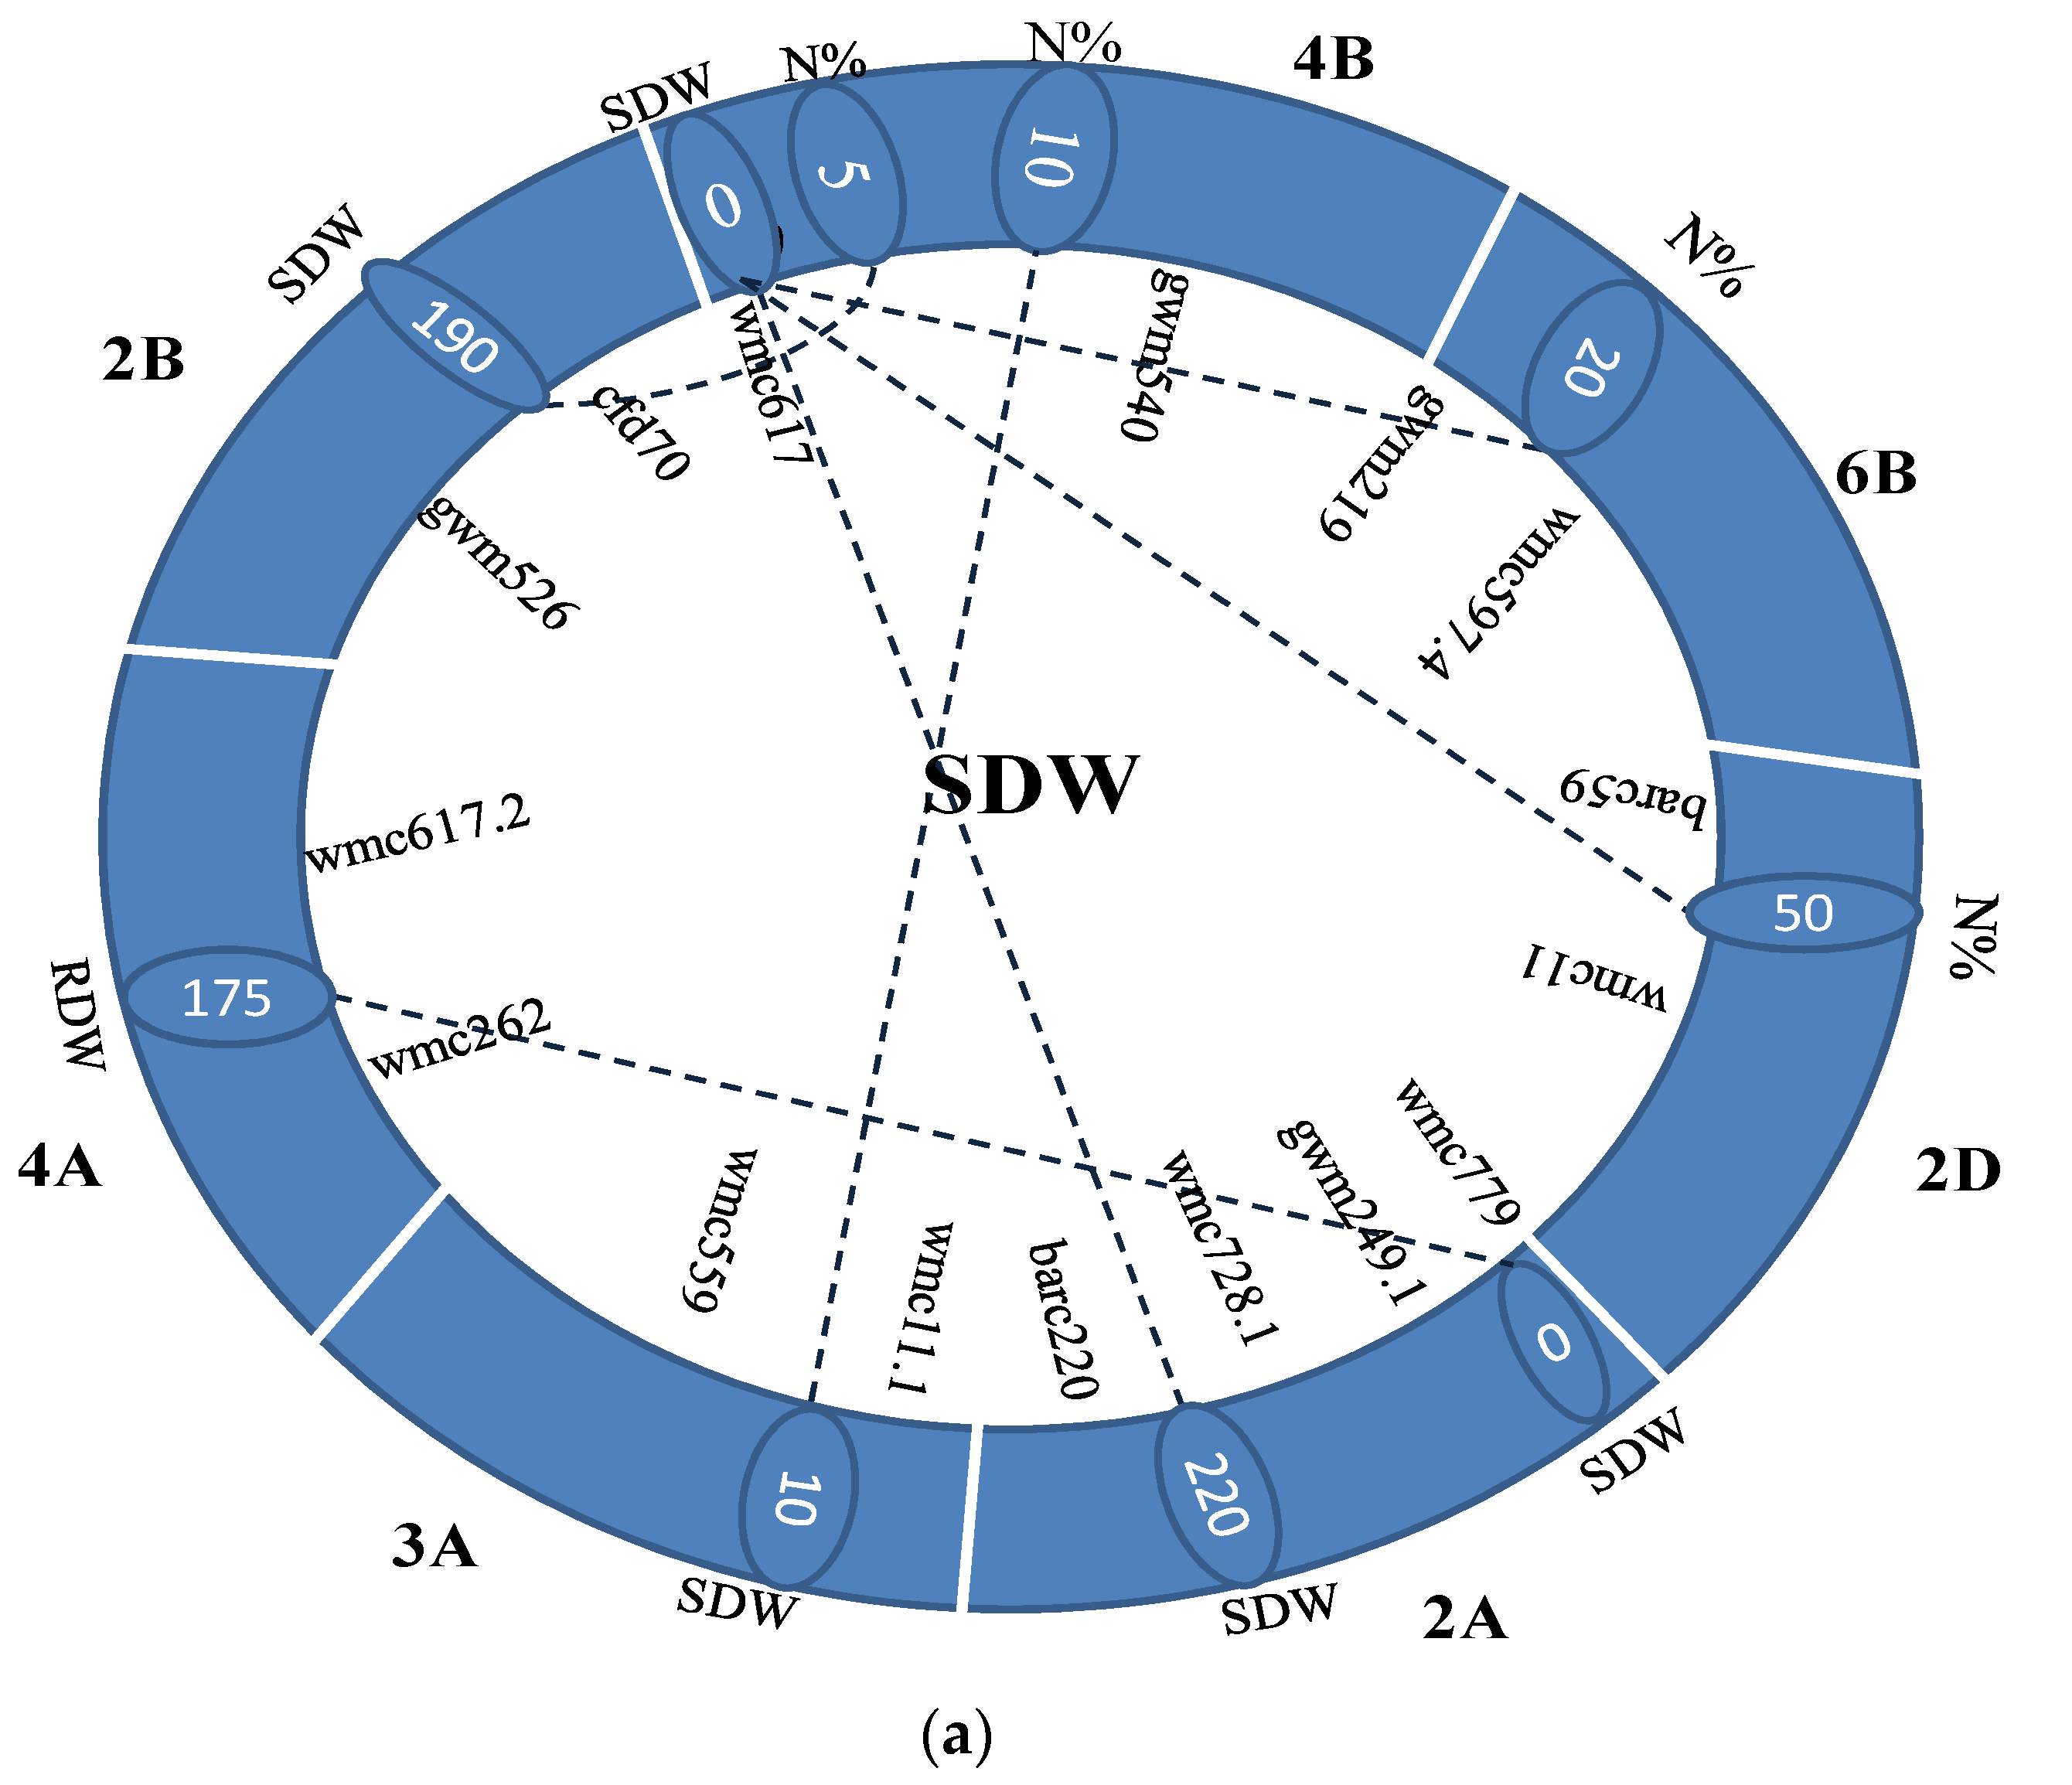
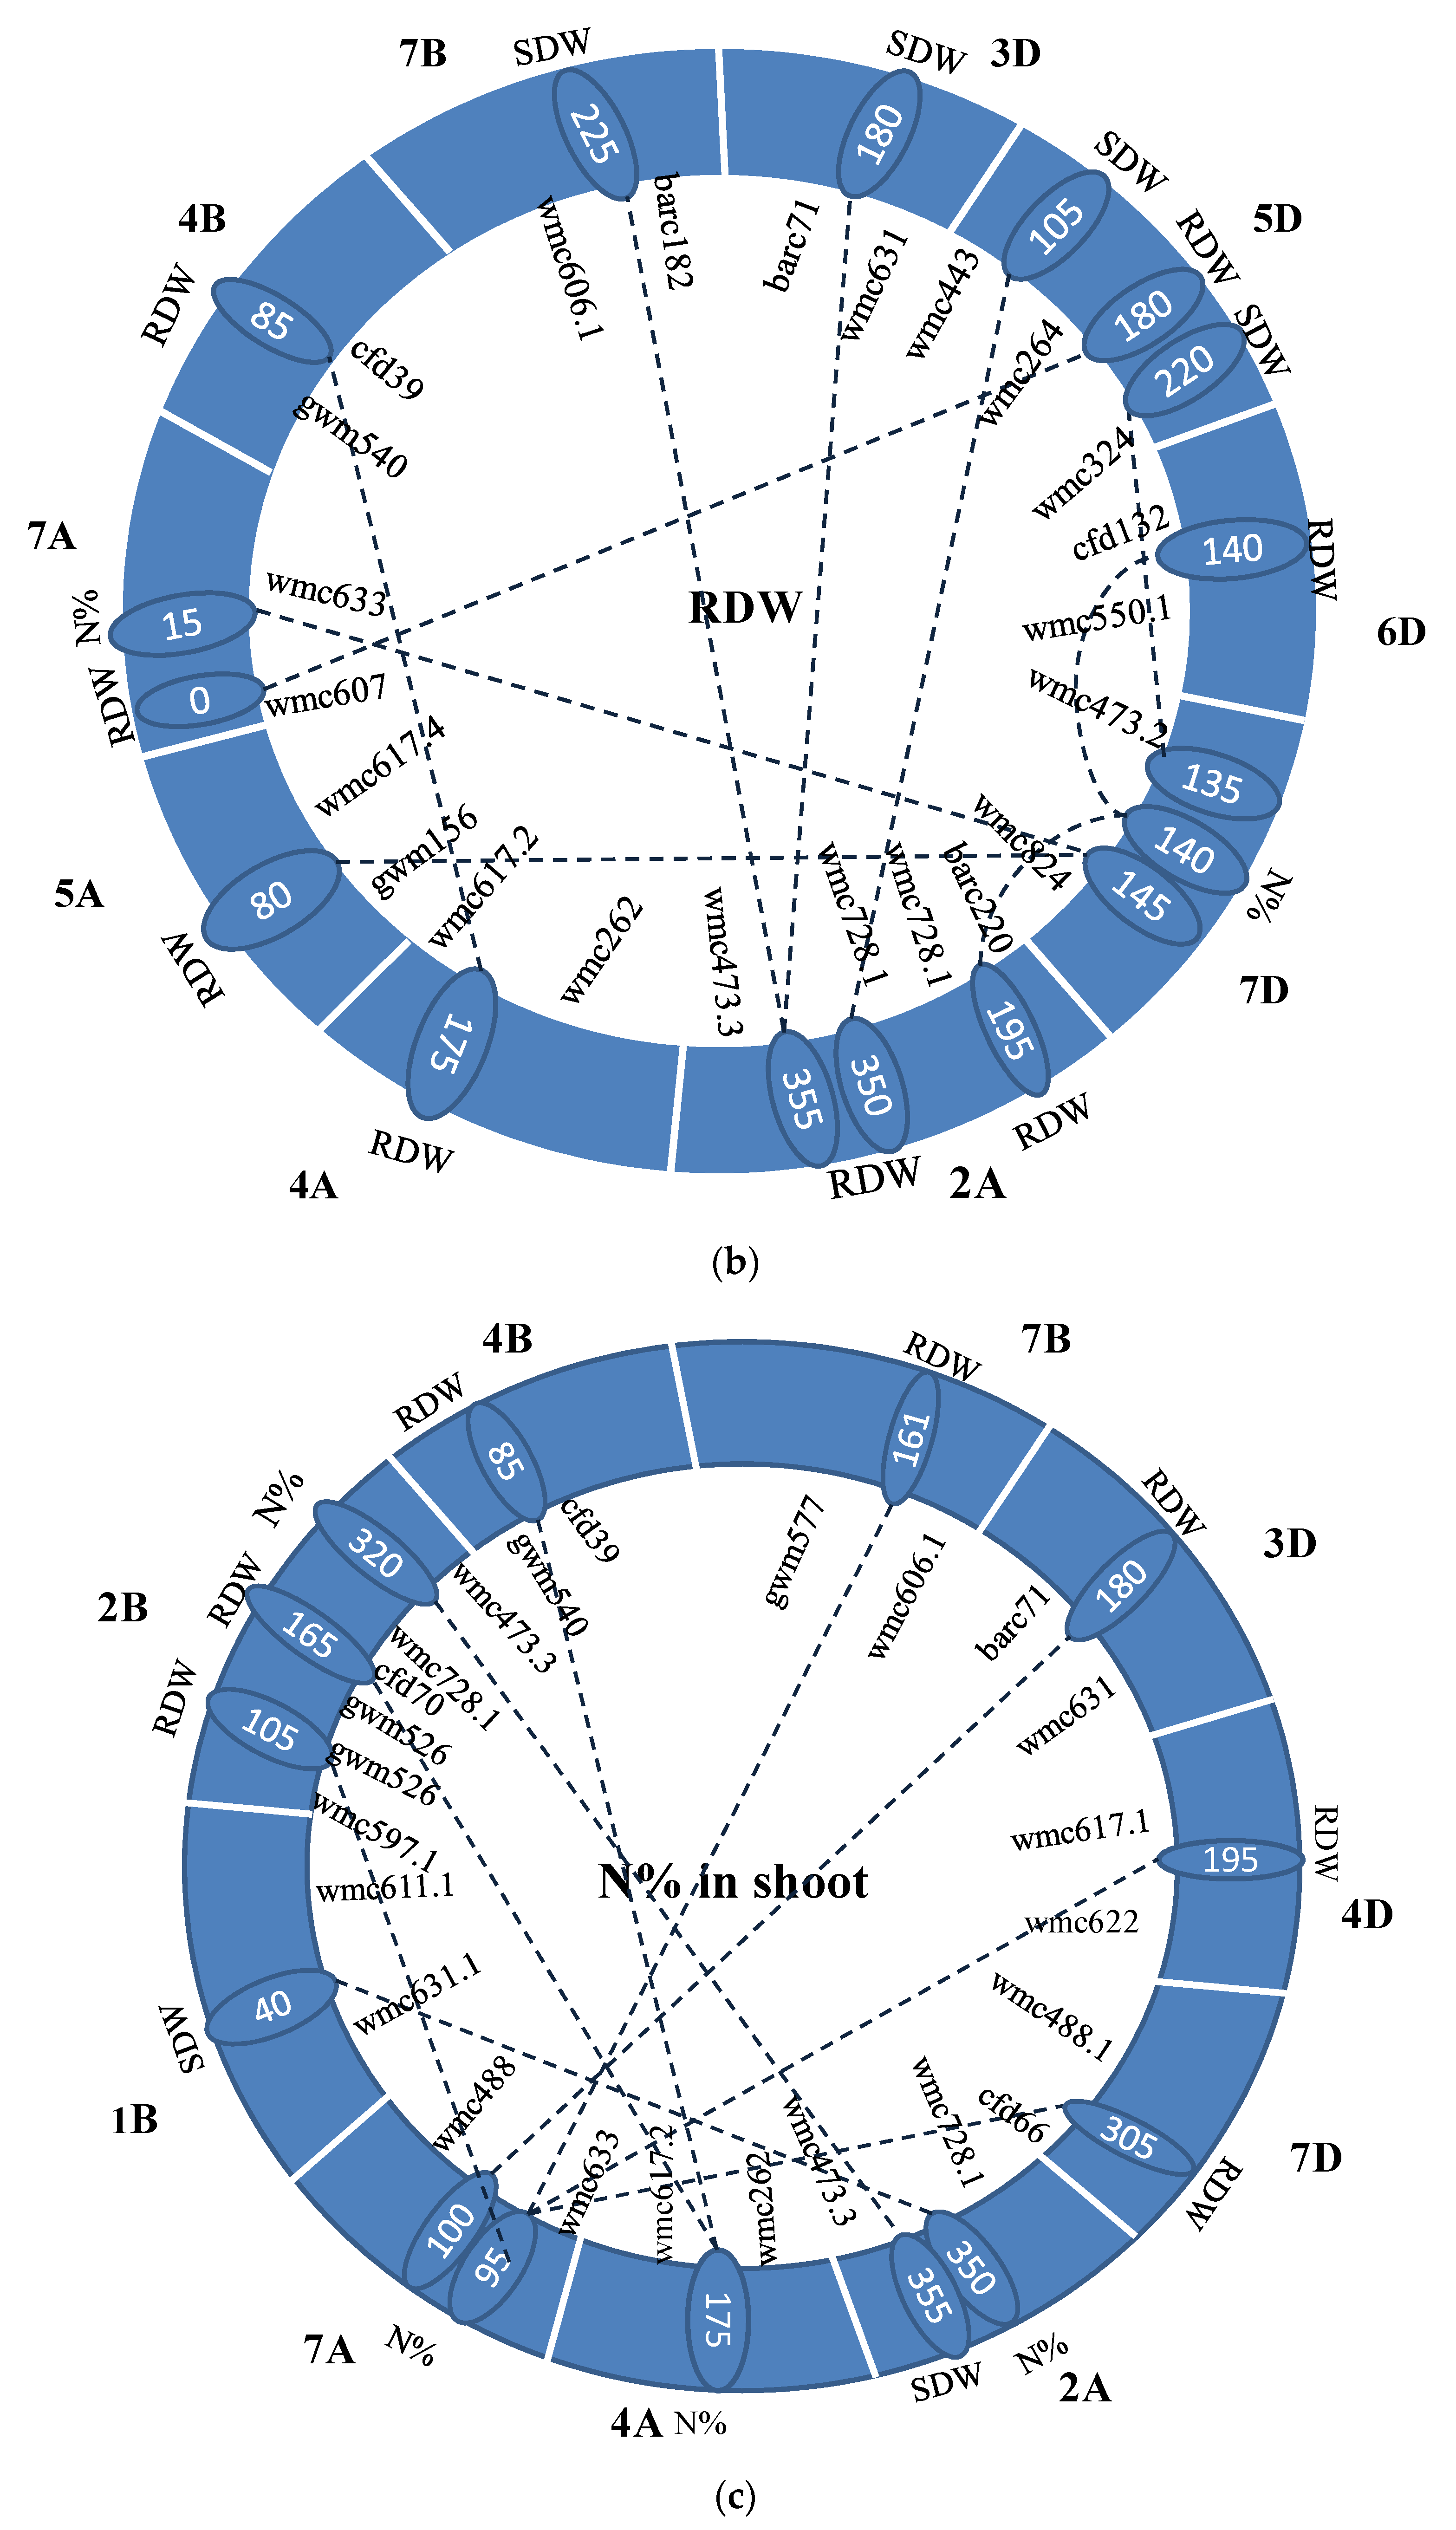
3.4. Identification of Epistasis QTLs

Epi-QTLs were detected for SDW, RDW and N% in the shoot. Twenty-one Epi-QTLs were identified for SDW and/or NUE, 56 QTLs for RDW and 46 QTLs for N% in the shoot (Table S2). Epi-QTLs for SDW revealed that the 21 QTLs contribute to 19.30% of the phenotypic variation. Out of 21 QTLs, only nine QTLs showed phenotypic variation (>1%) as in Table 4. Most of these QTLs (six) showed over dominance (OD) for trait expression. Similarly, for RDW, 56 QTLs explained the phenotypic variation of 30% whereas N% in shoot QTLs explained the phenotypic variation of 19.5%. There were no epi-QTLs that detected phenotypic variation >1% for RDW and N% in the shoot. Out of 14 chromosomes of interactive QTLs for SDW and/or NUE, most of them were observed on 2A, 7A and 4B chromosome (Table S2). The interaction among locus for expression of RDW was much complex than for the rest of the studied traits. The highest number of epistatic QTLs was found for RDW, which clearly shows the importance of epistasis for RDW to the genetic architecture of RDW in this population.
Out of 122 Epi QTLs detected for SDW, RDW and N% in the shoot, some of the QTLs lie within the QTL region detected by ICIM-ADD (Table 2), flanking marker having <5 cM distance from the QTLs (Table 5). Out of six QTLs for SDW, five QTLs of SDW were interacting with N% in the shoot and one QTL interacted with RDW (Table 5). Out of 11 interactive QTLs for RDW, five Epi-QTLs interacted with SDW, five QTLs with N% and one QTL with RDW itself. Similarly, for N% in the shoot, there were nine QTLs, out of which two interacted with SDW and the remaining seven QTLs interacted with RDW for their trait expression (Figure 3). Figure 3 is a schematic representation of interactive QTLs for SDW, RDW and N% in the shoot showing six interactive QTLs for SDW, 10 out of 11 for RDW and nine for N% in a representative way.

4. Discussion

The development of a linkage map depends on mapping the population and selection of parents for the identification of QTLs. The higher the parental diversity, the higher the number of recombinants in the population enabling high-resolution QTL mapping [53]. The parental lines used for generating the mapping population in the present study were contrasting not only for NUE, but also for most of the root biomass component traits, and hence were suitable to generate the mapping population.

4.1. Phenotypic Performance and Association Analysis among NUE Related Traits

The mean performance of the parental line revealed a significant difference for main component traits (SDW, RDW and N% in the shoot) and NUE derived traits (TDW, R:S, NUtE, NUpE, and NUE). Association of different traits with NUE revealed a significant correlation between RDW with NUpE and NUE confirming our earlier findings in wheat germplasm lines [16] and corroborated a similar association in mapping population as reported in wheat [28], rice [54] and wheat [19] under hydroponic conditions.
The root system is important for nutrients and water uptake in plants and the rate of nutrients and water absorption influencing the most physiological processes [55] emphasize its importance in NUE. Root architecture involving deeper distribution of rootsand the C available for root, fixed by photosynthesis determine the overall efficiency of the root system in taking up N which also maintains the activity of root [56]. Our earlier findings revealed that RDW was largely contributed by total root length (TRL), root surface area (RSA), root volume (RV) and shoot dry weight (SDW) under both HN and LN with more strong contribution under HN [40]. The study therefore clearly shows that to improve NUE in wheat under Indian conditions, direct selection for RDW can be highly rewarding by improving NUpE. Higher root weight leads to healthier aboveground biomass through better assimilation and C fixation and vice versa also [57]. The improved photosynthetic process through better exploration and uptake of water and nutrient by roots results in more assimilate production which is then shared by root and shoots. The benefit of selecting directly for root traits including TRL and RDW also improves water and/or nutrient uptake in wheat [58], upland rice [59] and maize [60].
The R:S has been used as an index for drought and nutrient resistance because larger-deep rooted systems are able to extract more water while relatively smaller shoots transpire less [61]. In order to extract nutrition, the plant naturally exhibits this quality by increasing the root tips and RV in the surface soil layer. We observed a negative association of R:S with NUE under HN, which revealed that under N non-limiting environments, the root is in the luxury stage and no more energy is required by the plant to extend the length of the root for the search of nutrients, and as a result, plants dissipate energy for higher shoot biomass through a high photosynthetic pathway. There was a negative association between NUE and NUpE with NUtE under HN. A similar result was reported in maize [62] and in wheat [63], which reported a negative association of NUE components with NUtE. The plausible explanation for this phenomenon could be that: (i) the activities of the enzymes, i.e., nitrate reductase (NR), nitrite reductase (NiR) and glutamine synthetase (GS), involved in the assimilation and remobilization of nutrient and N transporter protein present in the root express to different extents; and (ii) the N utilization is most pronounced at a low N environment [64], whereas the experiment was conducted in a N non-limiting environment. Additionally, the experiment was conducted till the flowering stage, and it is presumed that plants absorb N from the soil N pool, i.e., NUpE is active until anthesis, and after anthesis, the N taken up is converted into an economic product, and thus increases NUtE. Studies on genetic variability for these key enzymes available in spring wheat genotypes and their association with key growth regulatory genes like Vrn1 may throw further light on a negative association of NUtE with NUpE and NUE. NUtE is a derived trait from N% in shoot and showed an inverse relation with N%.

4.2. Identification of QTLs for NUE Related Traits

The QTL mapping methods have evolved over the years from single marker analysis to the multiple-QTL models. Precise mapping is essential for future use, and therefore, the ICIM method was used in the present study despite the fact that elimination of neither micro and macro environmental variability nor uncontrolled error can be fully addressed [65]. Genetic map length varies depending upon the mappingpopulation used. The hexaploid wheat genome in the case of an intraspecific population covers approximately 4000 cM [66]. This finding was confirmed by some studies, whereas other studies have produced maps covering <3500 cM) [44] and >5000 cM [67] for allohexaploid bread wheat. In the present study, we produced a molecular linkage map for wheat based on 103 SSR loci which were, however, raggedly distributed between linkage groups having the maximum number of markers (nine) on 7D with map length of 556.85 cM. Overall, these SSR loci were able to cover 5856.84 cM of the wheat genome. The uneven distribution of SSR markers resulted in gaps of more than 50 cM between two markers on certain chromosomes and hence an overestimation of the length of the total map. The recombination event happening in F2 might have also led to overestimation in comparison to studies carried in RIL populations.
For traits with low heritability, QTL mapping may use the average phenotypic values of F3 progeny derived from selfing of F2 plants in place of the F2 phenotype itself or may undergo joint analysis of F2 and all F3 progeny derived from the same F2 plant denoted by F (2:3). This enhances the power of QTL mapping, provided the size of each F3 family is sufficient large to represent the genotype value of F2 plant [68]. The 20 seeds per F2:3 family used in the present study represented an ideal number to perform QTL mapping in F2 population.
QTL seems a potent tool for genetic dissection of complex polygenic traits. We detected 27 QTLs for NUE-related traits located at 25 loci on 14 chromosomes. In the present study, the number of QTLs detected is ranged from 1 to 7 per chromosome and they are mostly clustered in one or two regions in each chromosome. The grouping of the QTLs reflects the same genetical mechanism underlying the expressions of the component traits. The strong correlations between several component traits, especially RDW and SDW, corroborate their similar genetic basis or pleiotropic effect. It remains unclear, however, whether the correlations are due to linkage or pleiotropy.
The morphological traits chosen in the present investigation such as SDW, RDW, N% in the shoot, R:S, NUpE, NUtE and NUE had been investigated under hydroponic conditions in earlier studies [19,28,54]. Although the genetic control of NUE traits is not clear, the results of marker interval analysis in our study suggest the polygenic control of SDW/NUE, with at least two putative loci involved. These two QTLs mapped to chromosome 2A and 7A, respectively. Similarly, RDW is regulated largely through two putative loci, mapped at 4A and 7A. As nitrogen uptake is associated with better root and shoot vigour, the traits TDW, R:S, and NUpE were also mapped on the same 2A chromosome. QTLs for RDW have also been mapped on the 4A chromosome by other workers [26,69]. RDW is the main component trait for NUpE, as the plant absorbs minerals and nutrients from soil media through roots. In addition, two putative QTLs for N% in the shoot mapped on chromosome 4B and 7D. Earlier, QTLs for N% in shoot have been mapped on the 4B chromosome [20]. The genomic region on chromosome 4B harbours loci controlling a number of important traits like seedling vigour, coleoptile length, and plant height suggesting that similar regions might be responsible for N% in the shoot. One of the major QTL for nitrogen-related traits in wheat has also been reported on chromosome 4B [27].
The amount of phenotypic variation explained by different QTLs varied from 1.09–11.18%. Maximum variance explaining QTLs were mapped to the region covering around 50 cM on chromosome 2A for traits NUE, NUpE and TDW. Seven QTLs identified for R:S on chromosome 2A, 4A, 1B, 3B, 6B, and 2D partially corroborate the earlier finding [70] on chromosome 1B, 3B, 2D for R:S. These QTLs clusters can be effectively exploited in MAS for improving NUE in wheat. Most of the QTLs detected in the present study were having a relatively smaller phenotypic effect, which is inconsistent with the findings of most of the studies on QTL [71]. Many component traits, enzymes and physiological processes involved in N uptake and utilization explain itself a smaller contribution of different genomic regions identified in the present study. However, the identification of a major QTL for NUE on chromosome 5A in wheat under high nitrogen [71] and its subsequent confirmation through cloning offer a new opportunity. They reported interaction of TaANR1, a wheat orthologue of Arabidopsis nitrate regulated 1(ANR1) with wheat vrn gene, TaVRN-A1 which, in turn, is linked to various traits such as the number of tiller and spikelet, leaf length, plant height, grain yield, N uptake and NUE [19,22,29,72]. In the present study, QTL has been reported at 5A chromosome for NUtE at LOD of 5.8. This remains to be studied in the future whether the identified QTL also colocalizes with the TaVRN-A1 region.
The gene effect identified for most of the traits along with the average degree of dominance indicates the preponderance of non-additive gene action, i.e., either dominance or over dominance gene action for most of the traits despite the importance of both in their inheritance. The inability of a large number of SSR loci (47 out of 103) to differentiate dominant homozygote with heterozygote might have led to a preponderance of non-additive gene action in F2. Contrasting results have been reported by other workers who detected both additive and non-additive effects on NUE [73,74] while the additive gene effect under LN environment and the non-additive gene effect under HN environment have been studied in maize [62]. In contrast, NUE has been believed to inherit in the additive fashion under a normal nitrogen environment and the non-additive fashion under a LN environment in rice [75] and wheat [76].
Chromosome 2A and 4A harbours genomic regions that may carry important genes for NUE traits. In this study, the QTL carrying regions on 2A and 4A had a number of genes including Lectin receptor kinase, ATP dependent helicases, transporters that could be candidate genes for NUE traits. Consistent with the findings in this study, previous QTL mapping studies of wheat in response to varying N application also indicated that chromosome 2A explained a high proportion of phenotypic variance. The candidate genes underlying such QTL region were reported to be Lectin domain containing receptor kinase, ABC transporter, DEAD-box ATP-dependent RNA helicase, etc. [77]. A transcription factor gene, TaNAC2 in wheat is associated with higher nitrate uptake rate, higher biomass production, grain yield, and harvest index under both high and low nitrogen [78]. TaNAC2 was involved in inducing the expression of GS2 and NRT genes leading to high NUE. Identification of 37 candidate genes for N and P nutrition in wheat that involves transcription factors and various transporters [79].The present study identified ascorbate transporter, phosphate transporter, MYB transcription factor, transcription activators in the QTL regions. Thus, the genetic regulatory mechanism of NUE involves complex interaction not only of major nitrogen metabolism genes but also those including transcription factors, transporters, etc.

4.3. Epistasis QTL Analysis

The epistatic variance effect is an important genetic variance component that alters the intensities of expression of quantitative traits [80,81]. Epistasis, the genetic component underlying complex quantitative traits, has been least explored and extensively studied in QTL analysis in most of the studies [82]. NUE is a complex trait and is the result of interaction among many component traits. Few studies involve the concerns of the epistatic interactions between co-localized QTLs, which describe no surety about the fact that accumulating the QTLs of interest in a single genotype would enhance NUE. However, by implementing appropriate statistical genomics approaches that consider the epistatic interactions also, QTLs associated with NUE can be more precisely detected under different N availability in the soil. Till now, there are few reports about understanding the genetic mechanism of NUE. In general, discovering epistasis effect is a harder task than observing a single QTL effect, except for additive × additive effect, which has about the same power as the dominance effect. SDW/NUE, RDW and N% in the shoot are the component traits for the present study. All 14 chromosomes involved in ICIM-ADD analysis were too involved in trait expression for SDW/NUE, but only 2A, 7A, and 4B were majorly involved in epistatic interactions. Chromosome 2A and 7A showed interaction among most of the traits including RDW and N% in a shoot. The linkage of this gene/QTL suggests a partly common genetic basis for NUE and some of its component traits. Although NUE was positively correlated with SDW, RDW and negatively correlated with R:S, QTL for SDW, NUE, and R:S were detected on 2A suggesting interactions among the loci controlling these traits.
Despite the complex nature of traits having epistasis interaction effects, the genetic advance can be assured by using suitable selection methods [83]. On the other hand, the actions of QTLs involved in epistatic interactions are intergenic, thus, epistatic QTLs may produce variable responses and adaptation to specific environments and ecosystems [81]. As for NUE improvement, since both additive and epistasis effects (additive X additive, additive X dominance, and dominance X dominance) play important role in the genetics of NUE, the selection of traits will be effective at early generation if governed by additive effects. According to [83], there is a loss of genetic response at a later generation if epistatic effects are ignored during selection at the early generation. However, the information regarding epistasis and its practical utility inbreeding is a complicated issue. The modelling study [83] revealed that under the situation where the epistasis effect is combined with an additive effect, selection based on additive x additive effect usually produced the extra response to selection compared with additive x dominance and dominance x dominance epistasis interaction. Thus, the application of the additive effect and additive x additive epistasis effect instead of additive x dominance and dominance x dominance epistasis interaction may have practical utilization for improving NUE in the breeding programme [84]. The breeding procedure for population improvements, such as recurrent selection or marker-assisted selection (MAS), may be useful to exploit the additive effect and additive × additive epistasis effect in spring wheat for NUE improvement. In the present study of QTLs mapping for NUE, genotyping was done in F2 and phenotyping was done at F2:3 for QTL analysis, and this may be one of the reasons for the relatively high number of QTL detected with over-dominance and dominance effect compared with an additive effect for SDW/NUE. In self-pollinated crops like wheat where only pure line varieties prevail in the production system, over-dominance and non-additive types of gene action are very difficult to exploit. However, increasing possibilities of hybrid development provide us an opportunity for exploitation of over-dominance. If over-dominance is because of linkage in the repulsion phase of the desirable alleles, then a population improvement programme like recurrent selection can be explored to release the hidden variability. Further fine mapping of identified genomic regions along with detailed studies on the interactive effect of QTLs of one trait with another trait may pave the way for simultaneous improvement of various traits involved in NUE.

5. Conclusions

The detection of QTLs for NUE and component traits in the present study provides many valuable clues for understanding the genetic basis of NUE. Interactions between loci of chromosome 2A and 7A resulted in the enhanced phenotypic expression of SDW/NUE traits. Chromosome 2A and 4A harbour genomic regions flanked by the markers, Xwmc728-Xwmc473 and Xwmc262-Xwmc617, respectively, for a number of traits related to NUE including SDW, TDW, R:S, NUtE, and NUpE, and hence can be used for molecular breeding in the future. The consistent occurrence of few QTLs identified in this study with those reported earlier on similar chromosomes for NUE related traits, for instance, 2A and 4A, suggests the presence of meta-QTL loci and confirmed the importance of such genomic regions. These QTL loci may improve the knowledge of the genetic determiners of NUE, allowing the development of wheat cultivars for sustainable agriculture. Since NUE is a complex trait with a high environmental effect, dissecting into different epistasis QTL and accordingly integrating into the breeding program might give desired results. The flanking markers can be further validated and used for marker-assisted selection in wheat improvement programs.

Supplementary Materials

The following are available online at https://www.mdpi.com/article/10.3390/agriculture11111149/s1, Table S1: List of SSR loci used in this study; Table S2: Epi-QTLs detected for SDW, RDW and N% in shoot in wheat.

Author Contributions

Conceptualization, R.Y.; Funding acquisition, R.Y.; Investigation, R.R.; Methodology, R.R.; R.Y.; N.K.B. and K.B.G.; Project administration, R.Y. and N.J.; Resources, R.R.; N.S.; M.K.; Software, R.R.; N.J. and N.S.; Supervision, R.Y. and N.J.; Writing—original draft, R.R.; Writing—review & editing, R.Y. and N.J. All authors have read and agreed to the published version of the manuscript.

Funding

This research received no external funding.

Institutional Review Board Statement

Not applicable.

Informed Consent Statement

Not applicable.

Acknowledgments

The first author acknowledges Indian Council of Agricultural Research—New Delhi, India for providing scholarship for Ph.D. at Indian Agricultural Research Institute, New Delhi under Netaji Subash ICAR international fellowship program; International Plant Nutrition Institute, Georgia, USA for honouring with IPNI Scholar Award and Indo-UK centre for the improvement of Nitrogen Use Efficiency in Wheat (INEW), Rothamsted Research, Harpenden, United Kingdom for sponsoring the training on genotyping and phenotyping on Nitrogen use efficiency at Rothamsted Research, University Bristol, University of Nottingham and John Inn Center, Norwich, United Kingdom.

Conflicts of Interest

The authors declare no conflict of interest.

References

  1. Shewry, P.R.; Hey, S.J. The contribution of wheat to human diet and health. Food Energy Secur. 2015, 4, 178–202. [Google Scholar] [CrossRef]
  2. Available online: http://www.fao.org/faostat/en/#data (accessed on 20 July 2020).
  3. Yadav, R.; Singh, S.S.; Jain, N.; Singh, G.P.; Prabhu, K.V. Wheat production in India: Technologies to face future challenges. J. Agric. Sci. 2010, 2, 164. [Google Scholar] [CrossRef] [Green Version]
  4. Marschner, P. Rhizosphere Biology. Marschner’s Mineral Nutrition of Higher Plants, 3rd ed.; Academic Press: Cambridge, MA, USA, 2012; pp. 369–388. [Google Scholar]
  5. Robertson, G.P.; Vitousek, P.M. Nitrogen in agriculture: Balancing the cost of an essential resource. Annu. Rev. Environ. Resour. 2009, 34, 97–125. [Google Scholar] [CrossRef] [Green Version]
  6. Campbell, C.A.; Zentner, R.P.; Selles, F.; McConkey, B.G.; Dyck, F.B. Nitrogen management for spring wheat grown annually on zero-tillage: Yields and nitrogen use efficiency. Agron. J. 1993, 85, 107–114. [Google Scholar] [CrossRef]
  7. Matson, P.A.; Naylor, R.; Ortiz-Monasterio, I. Integration of environmental, agronomic, and economic aspects of fertilizer management. Science 1998, 280, 112–115. [Google Scholar] [CrossRef] [PubMed] [Green Version]
  8. Ranjan, R.; Yadav, R. Targeting nitrogen use efficiency for sustained production of cereal crops. J. Plant Nutr. 2019, 42, 1086–1113. [Google Scholar] [CrossRef]
  9. Malyan, S.K.; Bhatia, A.; Kumar, A.; Gupta, D.K.; Singh, R.; Kumar, S.S.; Tomer, R.; Kumar, O.; Jain, N. Methane production, oxidation and mitigation: A mechanistic understanding and comprehensive evaluation of influencing factors. Sci. Total Environ. 2016, 572, 874–896. [Google Scholar] [CrossRef] [PubMed]
  10. Yadav, R.; Gaikwad, K.B.; Bhattacharyya, R. Breeding wheat for yield maximization under conservation agriculture. Indian J. Genet. Plant Breed. 2017, 77, 185–198. [Google Scholar] [CrossRef]
  11. Cassman, K.G.; Dobermann, A.; Walters, D.T.; Yang, H. Meeting cereal demand while protecting natural resources and improving environmental quality. Annu. Rev. Environ. Resour. 2003, 28, 315–358. [Google Scholar] [CrossRef] [Green Version]
  12. Ministry of Agriculture and Farmers Welfare, Government of India. 2019. Available online: https://eands.dacnet.nic.in/Advance_Estimate/4th%20Adv%20Estimates%202018-19%20Eng.pdf (accessed on 20 July 2020).
  13. Tewatia, R.K.; Chanda, T.K. Trends in fertilizer nitrogen production and consumption in India. In The Indian Nitrogen Assessment: Sources of Reactive Nitrogen, Environmental and Climate Effects, and Management Options and Policies; Elsevier: Amsterdam, The Netherlands, 2016. [Google Scholar]
  14. Sylvester-Bradley, R.; Stokes, D.T.; Scott, R.K.; Willington, V.B.A. A physiological analysis of the diminishing responses of winter wheat to applied nitrogen. Asp. Appl. Biol. 1990, 25, 289–300. [Google Scholar]
  15. Moll, R.H.; Kamprath, E.J.; Jackson, W.A. Analysis and interpretation of factors which contribute to the efficiency of nitrogen utilization. J. Agron. 1982, 74, 562–564. [Google Scholar] [CrossRef]
  16. Ranjan, R.; Yadav, R.; Kumar, A.; Mandal, S.N. Contributing traits for nitrogen use efficiency in selected wheat genotypes and corollary between screening methodologies. Acta Agric. Scand. Sect. B 2019, 69, 588–595. [Google Scholar] [CrossRef]
  17. Kant, S.; Bim, Y.M.; Rothstein, S.J. Understanding plant response to nitrogen limitation for the improvement of crop nitrogen use efficiency. J. Exp. Bot. 2010, 62, 1499–1509. [Google Scholar] [CrossRef] [Green Version]
  18. Quarrie, S.A.; Steed, A.; Calestani, C.; Semikhodskii, A.; Lebreton, C.; Chinoy, C.; Steele, D.; Pljevljakusić, D.; Waterman, E.; Weyen, J.; et al. A high-density genetic map of hexaploid wheat (Triticumaestivum L.) from the cross Chinese Spring× SQ1 and its use to compare QTLs for grain yield across a range of environments. Theor. Appl. Genet. 2005, 110, 865–880. [Google Scholar] [CrossRef]
  19. An, D.; Su, J.; Liu, Q.; Zhu, Y.; Tong, Y.; Li, J.; Jing, R.; Li, B.; Li, Z. Mapping QTLs for nitrogen uptake in relation to the early growth of wheat (Triticum aestivum L.). Plant Soil 2006, 284, 73–84. [Google Scholar] [CrossRef]
  20. Laperche, A.; Brancourt-Hulmel, M.; Heumez, E.; Gardet, O.; Le Gouis, J. Estimation of genetic parameters of a DH wheat population grown at different N stress levels characterized by probe genotypes. Theor. Appl. Genet. 2006, 112, 797–807. [Google Scholar] [CrossRef]
  21. Laperche, A.; Brancourt-Hulmel, M.; Heumez, E.; Gardet, O.; Hanocq, E.; Devienne-Barret, F.; Le Gouis, J. Using genotype× nitrogen interaction variables to evaluate the QTL involved in wheat tolerance to nitrogen constraints. Theor. Appl. Genet. 2007, 115, 399–415. [Google Scholar] [CrossRef] [PubMed]
  22. Habash, D.Z.; Bernard, S.; Schondelmaier, J.; Weyen, J.; Quarrie, S.A. The genetics of nitrogen use in hexaploid wheat: N utilization, development and yield. Theor. Appl. Genet. 2007, 114, 403–419. [Google Scholar] [CrossRef] [PubMed]
  23. Le Gouis, J.; Fontaine, J.X.; Laperche, A.; Heumez, E.; Devienne-Barret, F.; Brancourt-Hulmel, M.; Dubois, F.; Hirel, B. Genetic analysis of wheat nitrogen use efficiency: Coincidence between QTL for agronomical and physiological traits. In Proceedings of the 11th International Wheat Genetics Symposium, Brisbane, Australia, 24–29 August 2008; pp. 916–918. [Google Scholar]
  24. Fontaine, J.X.; Ravel, C.; Pageau, K.; Heumez, E.; Dubois, F.; Hirel, B.; Le Gouis, J. A quantitative genetic study for elucidating the contribution of glutamine synthetase, glutamate dehydrogenase and other nitrogen-related physiological traits to the agronomic performance of common wheat. Theor. Appl. Genet. 2009, 119, 645–662. [Google Scholar] [CrossRef] [PubMed]
  25. García-Suárez, J.; Röder, M.; Díaz de León, J. Identification of QTLs and associated molecular markers of agronomic traits in wheat (Triticum aestivum L.) under two conditions of nitrogen fertilization. Cereal Res. Commun. 2010, 38, 459–470. [Google Scholar] [CrossRef]
  26. Guo, Y.; Kong, F.M.; Xu, Y.F.; Zhao, Y.; Liang, X.; Wang, Y.Y.; An, D.G.; Li, S.S. QTL mapping for seedling traits in wheat grown under varying concentrations of N., P and K nutrients. Theor. Appl. Genet. 2012, 124, 851–865. [Google Scholar] [CrossRef] [PubMed]
  27. Xu, Y.; Wang, R.; Tong, Y.; Zhao, H.; Xie, Q.; Liu, D.; Zhang, A.; Li, B.; Xu, H.; An, D. Mapping QTLs for yield and N-related traits in wheat: Influence of nitrogen and phosphorus fertilization on QTL expression. Theor. Appl. Genet. 2014, 127, 59–72. [Google Scholar] [CrossRef]
  28. Ren, Y.; Qian, Y.; Xu, Y.; Zou, C.; Liu, D.; Zhao, X.; Zhang, A.; Tong, Y. Characterization of QTLs for root traits of wheat grown under different nitrogen and phosphorus supply levels. Front. Plant Sci. 2017, 8, 2096. [Google Scholar] [CrossRef] [PubMed] [Green Version]
  29. Deng, Z.; Cui, Y.; Han, Q.; Fang, W.; Li, J.; Tian, J. Discovery of consistent QTLs of wheat spike-related traits under nitrogen treatment at different development stages. Front. Plant Sci. 2017, 8, 2120. [Google Scholar] [CrossRef] [PubMed] [Green Version]
  30. Monostori, I.; Szira, F.; Tondelli, A.; Arendas, T.; Gierczik, K.; Cattivelli, L.; Galiba, G.; Vagujfalvi, A. Genome-wide association study and genetic diversity analysis on nitrogen use efficiency in a Central European winter wheat (Triticum aestivum L.) collection. PLoS ONE 2017, 12, e0189265. [Google Scholar] [CrossRef]
  31. Zhang, M.; Gao, M.; Zheng, H.; Yuan, Y.; Zhou, X.; Guo, Y.; Zhang, G.; Zhao, Y.; Kong, F.; An, Y.; et al. QTL mapping for nitrogen use efficiency and agronomic traits at the seedling and maturity stages in wheat. Mol. Breed. 2019, 39, 71. [Google Scholar] [CrossRef]
  32. Brasier, K.; Ward, B.; Smith, J.; Seago, J.; Oakes, J.; Balota, M.; Davis, P.; Fountain, M.; Brown-Guedira, G.; Sneller, C.; et al. Identification of quantitative trait loci associated with nitrogen use efficiency in winter wheat. PLoS ONE 2020, 15, e0228775. [Google Scholar] [CrossRef] [PubMed]
  33. Waines, J.G.; Ehdaie, B. Domestication and crop physiology: Roots of green-revolution wheat. Ann. Bot. 2007, 100, 991–998. [Google Scholar] [CrossRef] [Green Version]
  34. Sanguineti, M.C.; Li, S.; Maccaferri, M.; Corneti, S.; Rotondo, F.; Chiari, T.; Tuberosa, R. Genetic dissection of seminal root architecture in elite durum wheat germplasm. Ann. Appl. Biol. 2007, 151, 291–305. [Google Scholar] [CrossRef]
  35. Canè, M.A.; Maccaferri, M.; Nazemi, G.; Salvi, S.; Francia, R.; Colalongo, C.; Tuberosa, R. Association mapping for root architectural traits in durum wheat seedlings as related to agronomic performance. Mol. Breed. 2014, 34, 1629–1645. [Google Scholar] [CrossRef] [PubMed] [Green Version]
  36. Atkinson, J.A.; Wingen, L.U.; Griffiths, M.; Pound, M.P.; Gaju, O.; Foulkes, M.J.; Le Gouis, J.; Griffiths, S.; Bennett, M.J.; King, J.; et al. Phenotyping pipeline reveals major seedling root growth QTL in hexaploid wheat. J. Exp. Bot. 2015, 66, 2283–2292. [Google Scholar] [CrossRef] [PubMed] [Green Version]
  37. Maccaferri, M.; El-Feki, W.; Nazemi, G.; Salvi, S.; Canè, M.A.; Colalongo, M.C.; Stefanelli, S.; Tuberosa, R. Prioritizing quantitative trait loci for root system architecture in tetraploid wheat. J. Exp. Bot. 2016, 67, 1161–1178. [Google Scholar] [CrossRef] [PubMed]
  38. Iannucci, A.; Marone, D.; Russo, M.A.; De Vita, P.; Miullo, V.; Ferragonio, P.; Blanco, A.; Gadaleta, A.; Mastrangelo, A.M. Mapping QTL for Root and shoot morphological traits in a durum wheat × T. dicoccum segregating population at seedling stage. Int. J. Genom. 2017. [Google Scholar] [CrossRef] [PubMed] [Green Version]
  39. Horn, R.; Wingen, L.U.; Snape, J.W.; Dolan, L. Mapping of quantitative trait loci for root hair length in wheat identifies loci that co-locate with loci for yield components. J. Exp. Bot. 2016, 67, 4535–4543. [Google Scholar] [CrossRef] [Green Version]
  40. Ranjan, R.; Yadav, R.; Gaikwad, K.; Kumar, M.; Kumar, N.; Babu, P.; Pandey, R.; Joshi, A.K. Genetic variability for root traits and its role in adaptation under conservation agriculture in spring wheat. Indian J. Genet. Plant Breed. 2021, 81, 24–33. [Google Scholar] [CrossRef]
  41. Murray, M.G.; Thompson, W.F. Rapid isolation of high molecular weight plant DNA. Nucleic Acids Res. 1980, 8, 4321–4326. [Google Scholar] [CrossRef] [Green Version]
  42. Somers, D.J.; Isaac, P.; Edwards, K. A high-density microsatellite consensus map for bread wheat (Triticum aestivum L.). Theor. Appl. Genet. 2004, 109, 1105–1114. [Google Scholar] [CrossRef]
  43. Song, Q.J.; Shi, J.R.; Singh, S.; Fickus, E.W.; Costa, J.M.; Lewis, J.; Gill, B.S.; Ward, R.; Cregan, P.B. Development and mapping of microsatellite (SSR) markers in wheat. Theor. Appl. Genet. 2005, 110, 550–560. [Google Scholar] [CrossRef]
  44. Röder, M.S.; Korzun, V.; Wendehake, K.; Plaschke, J.; Tixier, M.H.; Leroy, P.; Ganal, M.W. A microsatellite map of wheat. Genetics 1998, 149, 2007–2023. [Google Scholar] [CrossRef]
  45. Pestsova, E.; Ganal, M.W.; Röder, M.S. Isolation and mapping of microsatellite markers specific for the D genome of bread wheat. Genome 2000, 43, 689–697. [Google Scholar] [CrossRef]
  46. Gupta, P.K.; Balyan, H.; Edwards, K.; Isaac, P.; Korzun, V.; Gautier, M.F.; Joudrier, P.; Schlatter, A.; Dubcovsky, J.; De la Pena, R.; et al. Genetic mapping of 66 new microsatellite (SSR) loci in bread wheat. Theor. Appl. Genet. 2002, 105, 413–422. [Google Scholar] [CrossRef] [PubMed] [Green Version]
  47. Ayalew, H.; Ma, X.; Yan, G. Screening wheat (Triticum spp.) genotypes for root length under contrasting water regimes: Potential sources of variability for drought resistance breeding. J. Agron. Crop Sci. 2015, 201, 189–194. [Google Scholar] [CrossRef]
  48. Meng, L.; Li, H.; Zhang, L.; Wang, J. QTL IciMapping: Integrated software for genetic linkage map construction and quantitative trait locus mapping in biparental populations. Crop J. 2015, 3, 269–283. [Google Scholar] [CrossRef] [Green Version]
  49. Sheoran, O.P.; Tonk, D.S.; Kaushik, L.S.; Hasija, R.C.; Pannu, R.S. Statistical Software Package for Agricultural Research Workers: Recent Advances in Information Theory; Hooda, D.S., Hasija, R.C., Eds.; Department of Mathematics Statistics, CCS HAU: Hisar, India, 1998; pp. 139–143. [Google Scholar]
  50. Zhang, X.; Sun, C.; Zhang, Z.; Dai, Z.; Chen, Y.; Yuan, X.; Yuan, Z.; Tang, W.; Li, L.; Hu, Z. Genetic dissection of main and epistatic effects of QTL based on augmented triple test cross design. PLoS ONE 2017, 12, e018905. [Google Scholar] [CrossRef] [PubMed] [Green Version]
  51. Wen, Y.-J.; Zhang, Y.-W.; Zhang, J.; Feng, J.-Y.; Dunwell, J.M.; Zhang, Y.-M. An efficient multi-locus mixed model framework for the detection of small and linked QTLs in F2. Brief. Bioinform. 2019, 20, 1913–1924. [Google Scholar] [CrossRef]
  52. Zhang, Y.-W.; Wen, Y.-J.; Dunwell, J.M.; Zhang, Y.-M. QTL.gCIMapping.GUI v2.0: An R software for detecting small-effect and linked QTLs for quantitative traits in bi-parental segregation populations. Comput. Struct. Biotechnol. J. 2020, 18, 59–65. [Google Scholar] [CrossRef] [PubMed]
  53. Xu, Y.; Li, P.; Yang, Z.; Xu, C. Genetic mapping of quantitative trait loci in crops. Crop J. 2017, 5, 175–184. [Google Scholar] [CrossRef] [Green Version]
  54. Nguyen, H.T.T.; Dang, D.T.; Van Pham, C.; Bertin, P. QTL mapping for nitrogen use efficiency and related physiological and agronomical traits during the vegetative phase in rice under hydroponics. Euphytica 2016, 212, 473–500. [Google Scholar] [CrossRef]
  55. Hodge, A.; Berta, G.; Doussan, C.; Merchan, F.; Crespi, M. Plant rootgrowth, architecture and function. Plant Soil 2009, 321, 153–187. [Google Scholar] [CrossRef]
  56. Foulkes, M.J.; Hawkesford, M.; Barraclough, P.B.; Holdsworth, M.J. Identifying traits to improve the nitrogen economy of wheat: Recent advances and future prospects. Field Crops Res. 2009, 114, 329–342. [Google Scholar] [CrossRef]
  57. McPhee, K. Variation for seedling root architecture in the core collection of pea germplasm. Crop Sci. 2005, 45, 1758–1763. [Google Scholar] [CrossRef]
  58. Hurd, E.A. Root study of three wheat varieties and their resistance to drought and damage by soil cracking. Can. J. Plant Sci. 1964, 44, 240–248. [Google Scholar] [CrossRef]
  59. Price, A.H.; Steele, K.A.; Moore, B.J.; Jones, R.G.W. Upland rice grown in soil-filled chambers and exposed to contrasting water-deficit regimes: II. Mapping quantitative trait loci for root morphology and distribution. Field Crops Res. 2002, 76, 25–43. [Google Scholar] [CrossRef]
  60. Lynch, J.P. Roots of the second green revolution. Aust. J. Bot. 2007, 55, 493–512. [Google Scholar] [CrossRef]
  61. Srividya, A.; Ramanarao, P.V.; Sridhar, S.; Jayaprada, M.; Anuradha, G.; Srilakshmi, B.; Reddy, H.K.; Hariprasad, A.S.; Siddiq, E.A.; Vemireddy, L.R. Molecular mapping of QTLs for drought related traits at seedling stage under PEG induced stress conditions in rice. Am. J. Plant Sci. 2011, 2, 190. [Google Scholar] [CrossRef] [Green Version]
  62. Gallais, A.; Hirel, B. An approach to the genetics of nitrogen use efficiency in maize. J. Exp. Bot. 2004, 55, 295–306. [Google Scholar] [CrossRef] [PubMed] [Green Version]
  63. Hitz, K. Breeding for Nitrogen Use Efficiency in Soft Red Winter Wheat. Master’s Thesis, University of Kentucky, Lexington, KY, USA, 2015. [Google Scholar]
  64. DoVale, J.C.; DeLima, R.O.; Fritsche-Neto, R. Breeding for nitrogen use efficiency. In Plant Breeding for Abiotic Stress Tolerance; Springer: Berlin/Heidelberg, Germany, 2012; pp. 53–65. [Google Scholar] [CrossRef]
  65. Kearsey, M.J.; Pooni, H.S. Genotype by environment interaction. In The Genetical Analysis of Quantitative Traits; Springer: New York, NY, USA, 1996; pp. 241–265. [Google Scholar]
  66. Sourdille, P.; Singh, S.; Cadalen, T.; Brown-Guedira, G.L.; Gay, G.; Qi, L.; Gill, B.S.; Dufour, P.; Murigneux, A.; Bernard, M. Microsatellite-based deletion bin system for the establishment of genetic-physical map relationships in wheat (Triticum aestivum L.). Funct. Integr. Genom. 2004, 4, 12–25. [Google Scholar] [CrossRef] [PubMed]
  67. Cui, F.; Fan, X.; Zhao, C.; Zhang, W.; Chen, M.; Ji, J.; Li, J. A novel genetic map of wheat: Utility for mapping QTL for yield under different nitrogen treatments. BMC Genet. 2014, 15, 57. [Google Scholar] [CrossRef] [Green Version]
  68. Zhang, Y.M.; Xu, S. Mapping Quantitative Trait Loci in F2 Incorporating Phenotypes of F3 Progeny. Genetics 2004, 166, 1981–1993. [Google Scholar] [CrossRef]
  69. Sun, J.J.; Guo, Y.; Zhang, G.Z.; Gao, M.G.; Zhang, G.H.; Kong, F.M.; Zhao, Y.; Li, S.S. QTL mapping for seedling traits under different nitrogen forms in wheat. Euphytica 2013, 191, 319–331. [Google Scholar] [CrossRef]
  70. Lynch, M.; Walsh, B. Genetics and Analysis of Quantitative Traits; Sinauer Associates, Inc.: Sunderland, MA, USA, 1998; pp. 535–557. [Google Scholar]
  71. Lei, L.; Li, G.; Zhang, H.; Powers, C.; Fang, T.; Chen, Y.; Wang, S.; Zhu, X.; Carver, B.F.; Yan, L. Nitrogen use efficiency is regulated by interacting proteins relevant to development in wheat. Plant Biotechnol. J. 2018, 16, 1214–1226. [Google Scholar] [CrossRef] [PubMed] [Green Version]
  72. Quraishi, U.M.; Abrouk, M.; Murat, F.; Pont, C.; Foucrier, S.; Desmaizieres, G.; Confolent, C.; Riviere, N.; Charmet, G.; Paux, E.; et al. Cross-genome map based dissection of a nitrogen use efficiency orthometa QTL in bread wheat unravels concerted cereal genome evolution. Plant J. 2011, 65, 745–756. [Google Scholar] [CrossRef] [PubMed]
  73. Fang, P.; Tao, Q.N.; Wu, P. QTLs underlying rice root to uptake NH4-N and NO3-N and rice N use efficiency at seedling stage. Plant Nutr. Fert. Sci. 2001, 7, 159–165. [Google Scholar]
  74. Ranjan, R.; Yadav, R. Genetics analysis of nitrogen use efficiency component traits under nitrogen-limiting environment. Cereal Res. Commun. 2020, 48, 431–439. [Google Scholar] [CrossRef]
  75. Piao, Z.; Han, L.; Koh, H.; Zhang, J.; Lu, J.; Li, P. Analysis of combining the ability of dry weight and nitrogen use efficiency in rice. Zhong Guo Shui Dao Ke Xue 2005, 19, 527–532. [Google Scholar]
  76. Hao, X.; Dong, Z.D.; Li, Y.; Cui, D.Q. Genetic model of nitrogen concentrations and nitrogen utilization efficiency of wheat in different water and nitrogen environment. J. Triticeae Crops 2006, 4, 103–106. [Google Scholar]
  77. Xiong, H.; Guo, H.; Zhou, C.; Guo, X.; Xie, Y.; Zhao, L.; Gu, J.; Zhao, S.; Ding, Y.; Liu, L. A combined association mapping and t-test analysis of SNP loci and candidate genes involving in resistance to low nitrogen traits by a wheat mutant population. PLoS ONE 2009, 14, e0211492. [Google Scholar] [CrossRef]
  78. He, X.; Qu, B.; Li, W.; Zhao, X.; Teng, W.; Ma, W.; Ren, Y.; Li, B.; Li, Z.; Tong, Y. The nitrate-inducible NAC transcription factor TaNAC2-5A controls nitrate response and increases wheat yield. Plant Physiol. 2015, 169, 1991–2005. [Google Scholar] [CrossRef] [Green Version]
  79. Kumar, A.; Sharma, M.; Kumar, S.; Tyagi, P.; Wani, S.H.; Gajula, M.N.V.P.; Singh, K.P. Functional and structural insightsinto candidate genes associated with nitrogen and phosphorus nutrition in wheat (Triticum aestivum L.). Int. J. Biolmacromol. 2018, 118, 76–91. [Google Scholar] [CrossRef]
  80. Xu, Y.; Crouch, J.H. Marker-assisted selection in plant breeding: From publications to practice. Crop Sci. 2008, 48, 391–407. [Google Scholar] [CrossRef] [Green Version]
  81. Li, Z.K.; Jiang, X.L.; Peng, T.; Shi, C.L.; Han, S.X.; Tian, B.; Zhu, Z.L.; Tian, J.C. Mapping quantitative trait loci with additive effects and additive × additive epistatic interactions for biomass yield, grain yield, and straw yield using a doubled haploid population of wheat (Triticumaestivum L.). Genet. Mol. Res. 2014, 13, 1412–1424. [Google Scholar] [CrossRef] [PubMed]
  82. Carlborg, Ö.; Haley, C.S. Epistasis: Too often neglected in complex trait studies? Nat. Rev. Genet. 2004, 5, 618. [Google Scholar] [CrossRef] [PubMed]
  83. Liu, P.; Zhu, J.; Lou, X.; Lu, Y. A method for marker-assisted selection based on QTLs with epistatic effects. Genetica 2003, 119, 75–86. [Google Scholar] [CrossRef] [PubMed]
  84. Ding, J.Q.; Ma, J.L.; Zhang, C.R.; Dong, H.F.; Xi, Z.Y.; Xia, Z.L.; Wu, J.Y. QTL mapping for test weight by using F2:3 population in maize. J. Genet. 2011, 90, 75–80. [Google Scholar] [CrossRef] [PubMed]
Figure 1. Schematic representation of phenotyping and genotyping for QTL mapping.
Agriculture 11 01149 g001
Figure 2. Correlation coefficients among the traits in F2:3 population. DW: Shoot dry weight (g); RDW: Root dry weight (g); TDW: Total dry weight (g); R:S: Root: Shoot; N%: Nitrogen % in shoot; NUpE: Nitrogen uptake efficiency; NUtE: Nitrogen utilization efficiency; NUE: Nitrogen use efficiency. Positive correlations displayed in blue and negative correlations in red colour. The Colour intensity and size of a circle are proportional to correlation coefficient.
Agriculture 11 01149 g002
Figure 3. Schematic representation of interactive QTLs detected among traits (SDW, RDW and N% in the shoot) by inclusive composite interval mapping. (a) Chromosomes depicting interaction of SDW with other traits. (b) Chromosomes depicting interaction of RDW with other traits. (c) Chromosomes depicting interaction of N% in shoot with other traits.SDW: Shoot dry weight (g); RDW: Root dry weight (g); N%: Nitrogen % in shoot.
Agriculture 11 01149 g003aAgriculture 11 01149 g003b
Table 1. Performance and analysis of NUE related traits in F2:3 population and parents.
TraitsParentF2:3
P1P2MeanVarianceSEMinimumMaximumSkewnessW-Testp-Value
SDW0.9700.5750.6540.0480.0160.2981.7881.0710.9650.0001
RDW0.1440.0700.0760.0010.0020.0330.1760.7890.9720.0008
TDW1.1150.6450.7290.050.0160.3441.8520.9690.9690.0004
R:S0.1480.1210.1280.0040.0050.0360.3841.2920.9470.0000
N%2.4931.9332.570.2510.0371.0654.6920.4750.9900.2677
gN0.0240.0110.01700.0010.0040.0490.8780.9660.0002
NUpE1.0520.4830.7420.0970.0230.1922.1230.8680.9670.0002
NUtE40.1051.7340.6092.50.70321.31193.9380.410.9860.0783
NUE42.182528.4191.10.69812.95777.7251.070.9650.0001
SDW: Shoot dry weight (g); RDW: Root dry weight (g); TDW: Total dry weight (g); R:S: Root:Shoot; N%: Nitrogen % in shoot; gN: Gram Nitrogen in shoot (g), NUpE: Nitrogen uptake efficiency; NUtE: Nitrogen utilization efficiency; NUE: Nitrogen use efficiency.
Table 2. List of QTLs identified by inclusive composite interval mapping in F2:3 population for NUE traits.
SchemeQTLPositionLt MarkerRt MarkerLODPVE (%)A (a)D (d)d/aLt CIRt CI
SDW
1QSdw.iari-2A353wmc728.1wmc473.33.6510.470.0070.16121.5334.5358
2QSdw.iari-7A0wmc607wmc6333.155.010.0510.0681.3014.5
RDW
1QRdw.iari-4A180wmc262wmc617.24.545.82−0.00080.02431.1166.5190
2QRdw.iari-7A94wmc633wmc4883.528.23−0.016−0.0191.1581.5107.5
TDW
1QTdw.iari-2A358wmc728.1wmc473.34.0410.64−0.00040.138347334.5358
2QTdw.iari-4D254wmc617.1wmc6223.258.6−0.0110.13312232.5254
R:S
1QR:S.iari-2A.141wmc779gwm249.14.62.92−0.058−0.0550.94526.557.5
2QR:S.iari-2A.2292wmc728.1wmc473.34.393.520.058−0.0591.02269.5319.5
3QR: S.iari-4A36wmc597.3cfa20263.662.90.051−0.0521.0125.545.5
4QR: S.iari-1B50wmc631.1wmc611.13.262.950.052−0.0621.230.567.5
5QR: S.iari-3B234wmc527.1wmc754.13.162.98−0.049−0.0661.3222.5245.5
6QR:S.iari-6B70gwm219wmc597.43.73.150.05−0.0641.244.589.5
7QR:S.iari-2D322gwm261wmc5033.13.06−0.051−0.0581.12300.5343.5
N%
1QN%.iari-4B4wmc617gwm5404.649.87−0.0680.3835.6013.5
2QN%.iari-7D139wmc473.2wmc8244.0510.81−0.0140.40528132.5150.5
NUpE
1QNUpE.iari-2A358wmc728.1wmc473.35.5210.96−0.0070.2228.5343.5358
2QNUpE.iari-4A185wmc262wmc617.23.4411.18−0.0010.219219.9171.5190
NUtE
1QNUtE.iari-2A.136wmc779gwm249.17.943.68−14.714−14.3620.925.550.5
2QNUtE.iari-2A.2311wmc728.1wmc473.35.823.82−13.129−13.6761.03292.5323.5
3QNUtE.iari-3A381wmc527wmc264.16.293.813.336−14.0321.05368.5389.5
4QNUtE.iari-5A138wmc617.4gwm1865.873.7613.95−13.1960.94130.5145.5
5QNUtE.iari-5B31wmc75wmc6166.423.813.268−13.3491.0621.541.5
6QNUtE.iari-1D40cfa2129.2wmc6093.031.21−4.359−4.5971.0523.559.5
7QNUtE.iari-2D322gwm261wmc5036.633.7614.163−14.5871.02301.5333.5
8QNUtE.iari-4D144wmc473wmc617.16.323.6814.02−13.6920.97135.5152.5
9QNUtE.iari-7D.1138wmc473.2wmc8243.41.09−0.512−7.25614.21132.5150.5
10QNUtE.iari-7D.2251wmc824wmc488.17.73.7914.062−13.9910.99239.5262.5
NUE
1QNUE.iari-2A353wmc728.1wmc473.33.6510.470.3247.03121.6334.5358
2QNUE.iari-7A0wmc607wmc6333.155.012.2382.9631.3014.5
|d/a| ratio as additive (A) (|d/a| < 0.2), partial dominance (PD) (0.2 ≤ |d/a| < 0.8), dominance (D) (0.8 ≤ |d/a| < 1.2), and over dominance (OD) (|d/a| ≥ 1.2).
Table 3. List of QTLs identified using gCIM software for small-effect QTLs in F2:3 population for NUE traits.
TraitChrPosition (cM)LODLeft_MarkerRight_MarkerPVE (%)
SDW18254.753.3wmc617wmc6223.71
SDW211456.7wmc473-2wmc8246.64
RDW7196.925.2wmc606wmc6062.40
RDW17855.0cfd152barc715.41
TDW181208.0wmc473wmc617-17.40
TDW182504.1wmc617-1wmc6225.81
R:S211506.2wmc473-2wmc8247.82
N%6155.4wmc617-3wmc2562.65
N%82154.6wmc597cfa21472.24
N%101007.7barc77gwm247-15.76
N%13605.0gwm219wmc597-43.20
N%16208.5barc59wmc114.59
NUpE11204.0wmc617gwm5403.83
NUpE18254.753.0wmc622wmc6222.66
NUtE6158.3wmc617-3wmc2567.82
NUtE82204.0wmc597cfa21473.29
NUtE121556.0barc59-1wmc728-26.06
NUE18254.753.2wmc622wmc6223.57
NUE211456.3wmc473-2wmc8246.19
Table 4. Estimated digenic epistatic QTL detected for SDW/NUE by inclusive composite interval mapping.
TraitChr 1Pos1Flanking MarkerChr2Pos2Flanking MarkerLODR2(%)A1D1A2D2AAADDADDDd
SDW1A125wmc611-wmc550.22A250wmc728.1-wmc473.35.681.440.20−0.310.08−0.360.24−0.17−0.110.64OD
SDW2A10wmc779-gwm249.12A265wmc728.1-wmc473.37.201.56−0.37−0.230.13−0.29−0.250.54−0.280.10D
SDW2A330wmc728.1-wmc473.33A185gwm247-wmc5505.551.77−0.310.09−0.30−0.310.310.340.380.14D
SDW6A125wmc754-gwm1697A10wmc607-wmc6336.181.06−0.17−0.190.15−0.13−0.080.30−0.110.34OD
SDW7A80wmc633-wmc4887A250wmc606-wmc646.15.521.380.11−0.24−0.05−0.12−0.29−0.11−0.010.38OD
SDW2A235wmc728.1-wmc473.31B320wmc728-cfa2129.18.231.510.24−0.19−0.12−0.38−0.30−0.380.020.03A
SDW7A10wmc607-wmc6334B295wmc754.1-wmc597.25.051.070.15−0.19−0.18−0.19−0.08−0.110.240.42OD
SDW2A325wmc728.1-wmc473.37D325wmc488.1-cfd665.581.630.31−0.070.30−0.270.31−0.30−0.350.45OD
SDW7A70wmc633-wmc4887D500wmc646-cfd315.311.290.10−0.24−0.03−0.10−0.26−0.120.000.36OD
QTLs mentioned in the table are those having R2 value > 1% where R2 is phenotypic variance explained; total Epi–QTLs detected were 19 having R2 range from 0.53% to 1.77%. Chr: Chromosome where QTL detected, Pos: Position of QTL, A: Additive effect, D: Dominance effect, AA: Additive X Additive, AD: Additive X Dominance, DA: Dominance X Additive, DD: Dominance X Dominance; Dd: Degree of dominance.
Table 5. Interactive QTLs detected between traits by inclusive composite interval mapping.
TraitChr1Pos1Flanking MarkerTrai *Chr2Pos2Flanking MarkerLODR2 (%)AAADDADD
SDW2A220barc220-wmc728.1N%4B0wmc617-gwm5406.240.650.21−0.13−0.120.21
SDW2B190gwm526-cfd70N%4B5wmc617-gwm5405.210.67−0.200.02−0.090.24
SDW3A10wmc11.1-wmc559N%4B10wmc 617-gwm5406.240.82−0.230.08−0.040.38
SDW4B0wmc 617-gwm540N%6B20gwm219-wmc597.45.100.620.15−0.200.000.02
SDW4B0wmc 617-gwm540N%2D50barc59-wmc115.640.71−0.20−0.070.020.20
SDW2A0wmc779-gwm249.1RDW4A175wmc262-wmc617.25.370.53−0.230.22−0.240.11
RDW2A355wmc728.1-wmc473.3SDW7B225wmc606.1-barc1827.780.430.01−0.040.00−0.04
RDW2A355wmc728.1-wmc473.3SDW3D180barc71-wmc6318.210.49−0.030.00−0.010.04
RDW2A350wmc728.1-wmc473.3SDW5D105wmc443-wmc2647.960.56−0.030.01−0.02−0.01
RDW7A0wmc607-wmc633SDW5D180wmc264-wmc3246.000.320.000.010.020.03
RDW2A195barc220-wmc728.1SDW2A350wmc728.1-wmc473.310.110.52−0.03−0.010.010.04
RDW5D220wmc264-wmc324N%7D135wmc473.2-wmc8246.400.280.020.010.020.02
RDW2A195barc220-wmc728.1N%7D140wmc473.2-wmc8249.860.51−0.03−0.010.010.04
RDW6D140cfd132-wmc550.1N%7D140wmc473.2-wmc8247.880.530.030.010.000.05
RDW5A80gwm156-wmc617.4N%7D145wmc473.2-wmc8249.310.61−0.01−0.010.040.05
RDW7A15wmc607-wmc633N%7D145wmc473.2-wmc8248.210.480.020.020.020.03
RDW4A175wmc262-wmc617.2RDW4B85gwm540-cfd395.140.640.010.010.00-0.02
N%2B320wmc728.1-wmc473.3SDW2A355wmc728.1-wmc473.310.930.39−0.20−0.860.51−0.01
N%2A350wmc728.1-wmc473.3SDW1B40wmc631.1-wmc611.111.430.43−0.780.48−0.20−0.13
N%7A100wmc633-wmc488RDW2B105wmc597.1-gwm5268.960.420.65−0.64−0.080.22
N%4A175wmc262-wmc617.2RDW2B165gwm526-cfd709.570.36−0.68-0.150.550.13
N%4A175wmc262-wmc617.2RDW4B85gwm540-cfd399.720.40−0.67−0.230.49−0.20
N%7A95wmc633-wmc488RDW7B165gwm577-wmc606.110.040.410.05−0.72−0.64−0.19
N%7A100wmc633-wmc488RDW3D180barc71-wmc63111.970.410.09−0.72−0.600.21
N%7A95wmc633-wmc488RDW4D195wmc617.1-wmc62212.900.420.64−0.70−0.06−0.04
N%7A95wmc633-wmc488RDW7D305wmc488.1-cfd6613.350.470.56−1.03−0.020.31
* QTL detected (<5 cM marker interval) for trait by ICIM-ADD.
Publisher’s Note: MDPI stays neutral with regard to jurisdictional claims in published maps and institutional affiliations.

