Satisfaction of E-Learners with Electronic Learning Service Quality Using the SERVQUAL Model


Abstract
:1. Introduction
- (1)
- Examine the impact of the SERVQUAL instruments on perceived e-learning quality
- (2)
- Assess the relationship of learning content with perceived e-learning quality, and
- (3)
- Investigate the impact of overall e-learning quality on students’ satisfaction in the context of Bangladesh.
2. Literature Review
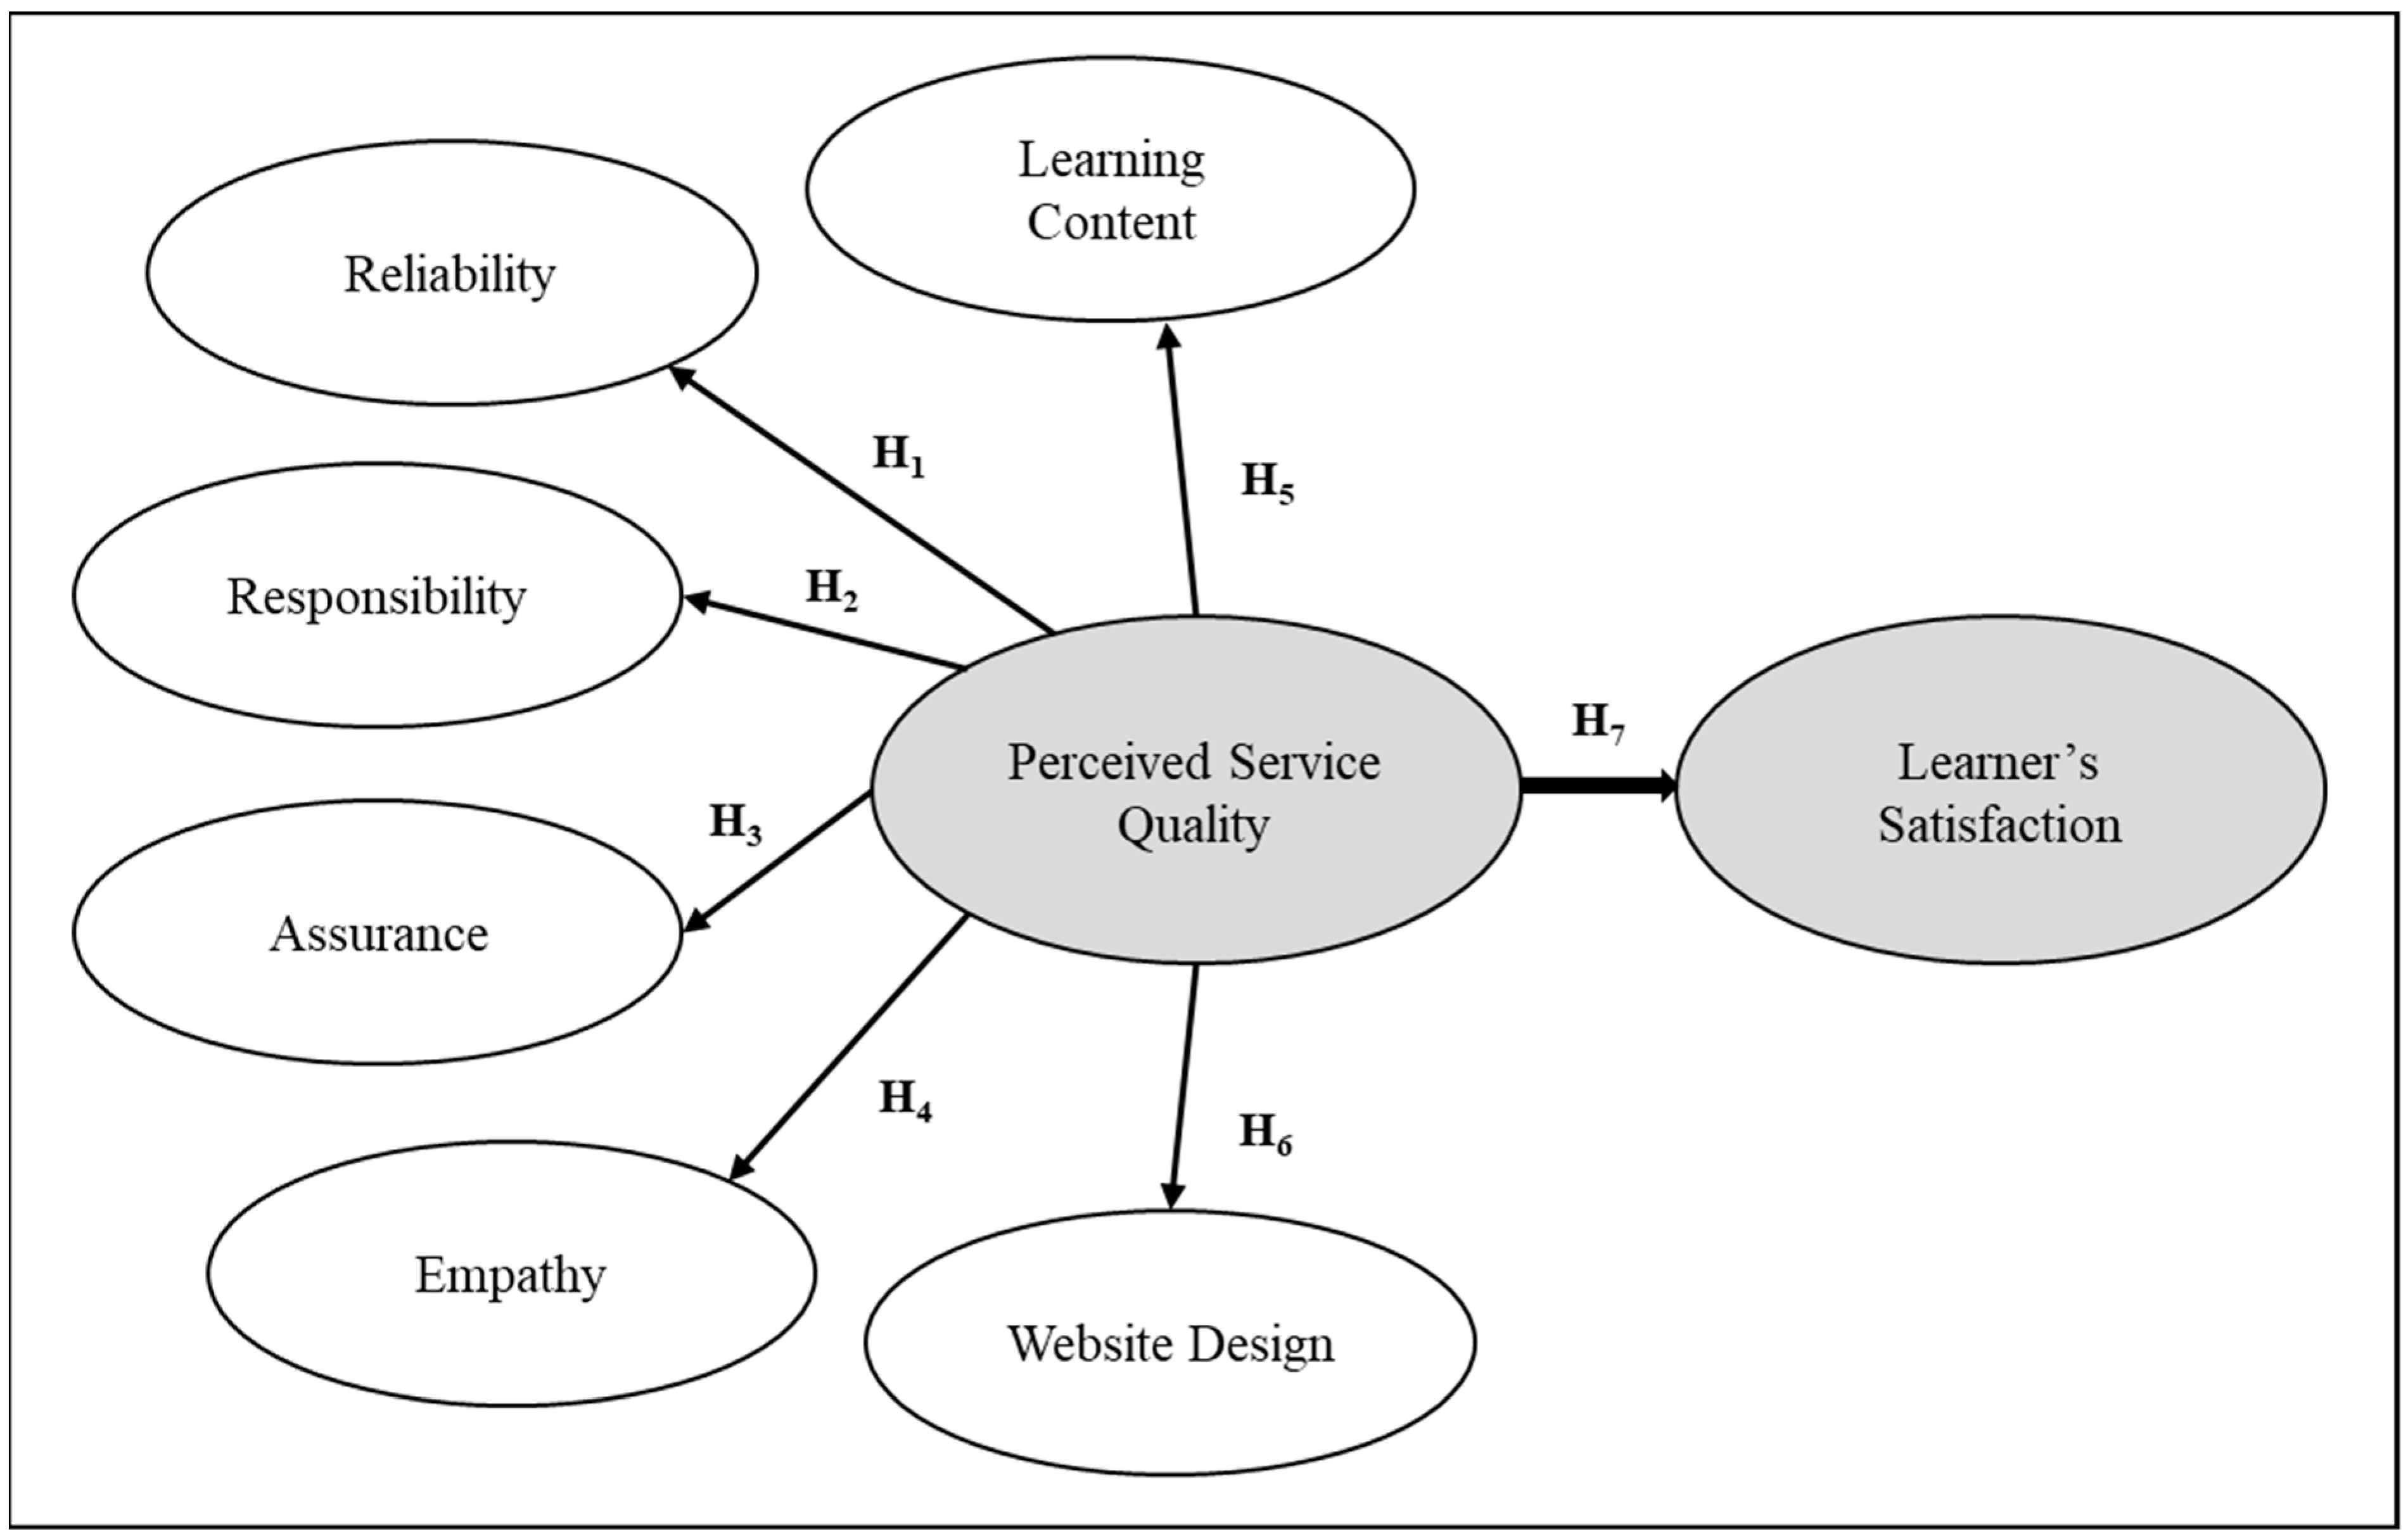
3. Conceptual Modeling and Hypothesis Development
3.1. Reliability
3.2. Responsiveness
3.3. Assurance
3.4. Empathy
3.5. Learning Content
3.6. Website Design
3.7. Perceived E-Learning Quality and Satisfaction
4. Methodology
4.1. Data Collection Process
4.2. Measurement Model
4.3. Structural Equation Modeling and Hypothesis Testing
5. Discussion
6. Managerial Implications
7. Conclusions
Author Contributions
Funding
Institutional Review Board Statement
Informed Consent Statement
Data Availability Statement
Conflicts of Interest
References
- Tsai, C.; Shen, P.; Chiang, Y. The application of mobile technology in e-learning and online education environments: A review of publications in SSCI-indexed journals from 2003 to 2012. Int. J. Enterp. Inf. Syst. 2013, 9, 85–98. [Google Scholar] [CrossRef]
- Wu, B. Identifying the influential factors of knowledge sharing in e-learning 2.0 systems. Int. J. Enterp. Inf. Syst. 2016, 12, 85–102. [Google Scholar] [CrossRef] [Green Version]
- Agarwal, S.; Kaushik, J.S. Student’s perception of online learning during COVID pandemic. Indian J. Pediatrics 2020, 87, 554. [Google Scholar] [CrossRef]
- Agung AS, N.; Surtikanti, M.W.; Surtikanti, M.W. Students’ Perception of Online Learning during COVID-19 Pandemic: A Case Study on the English Students of STKIP PamaneTalino. SOSHUM J. Sos. Dan Hum. 2020, 10, 225–235. [Google Scholar] [CrossRef]
- Xue, E.; Li, J.; Xu, L. Online education action for defeating COVID-19 in China: An analysis of the system, mechanism and mode. Educ. Philos. Theory 2020, 1–13. [Google Scholar] [CrossRef]
- Mishra, L.; Gupta, T.; Shree, A. Online teaching-learning in higher education during lockdown period of COVID-19 pandemic. Int. J. Educ. Res. Open 2020, 1, 100012. [Google Scholar] [CrossRef]
- Rahman, M.S.; Peeri, N.C.; Shrestha, N.; Zaki, R.; Haque, U.; Ab Hamid, S.H. Defending against the Novel Coronavirus (COVID-19) Outbreak: How Can the Internet of Things (IoT) Help to Save the World? Health Policy Technol. 2020, 9, 136–138. [Google Scholar] [CrossRef] [PubMed]
- Chin, A.; Simon, G.L.; Anthamatten, P.; Kelsey, K.C.; Crawford, B.R.; Weaver, A.J. Pandemics and the future of human-landscape interactions. Anthropocene 2020, 31, 100256. [Google Scholar] [CrossRef]
- Khan, M.A.; Nabi, M.K.; Khojah, M.; Tahir, M. Students’ Perception towards E-Learning during COVID-19 Pandemic in India: An Empirical Study. Sustainability 2021, 13, 57. [Google Scholar] [CrossRef]
- Parvej, I.; Tabassum, M.; Mannan, S.E.; Ahmed, F. Online Education during COVID-19 in Bangladesh: University Teachers’ Perspective. Aquademia 2021, 5, ep21005. [Google Scholar] [CrossRef]
- Khan, M.M.; Rahman, S.M.T.; Islam, S.T.A. Online Education System in Bangladesh during COVID-19 Pandemic. Creat. Educ. 2021, 12, 441–452. [Google Scholar] [CrossRef]
- Fazlollahtabar, H.; Muhammadzadeh, A. A knowledge-based user interface to optimize curriculum utility in an e-learning system. Int. J. Enterp. Inf. Syst. 2012, 8, 34–53. [Google Scholar] [CrossRef] [Green Version]
- Mystakidis, S.; Berki, E.; Valtanen, J.-P. The Patras Blended Strategy Model for Deep and Meaningful Learning in Quality Life-Long Distance Education. Electron. J. E-Learn. 2019, 17, 66–78. [Google Scholar] [CrossRef] [Green Version]
- Ito, M.; Martin, C.; Pfister, R.C.; Rafalow, M.H.; Salen, K.; Wortman, A. Affinity Online: How Connection and Shared Interest Fuel Learning; NYU Press: New York, NY, USA, 2018; Volume 2, ISBN 1479888907. [Google Scholar]
- Gress, C.L.; Fior, M.; Hadwin, A.F.; Winne, P.H. Measurement and assessment in computer supported collaborative learning. Comput. Hum. Behav. 2010, 26, 806–814. [Google Scholar] [CrossRef]
- Barrett, A.M.; Chawla-Duggan, R.; Lowe, J.; Nikel, J.; Ukpo, E. The Concept of Quality in Education: A Review of the ‘International’ Literature on the Concept of Quality in Education; EdQual: Bristol, UK, 2006; Volume 3, pp. 1–9. [Google Scholar]
- Stodnick, M.; Rogers, P. Using SERVQUAL to measure the quality of the classroom experience. Decis. Sci. J. Innov. Educ. 2008, 6, 115–133. [Google Scholar] [CrossRef]
- Lee, W.J. Online support service quality, online learning acceptance, and student satisfaction. Internet High. Educ. 2010, 13, 227–283. [Google Scholar] [CrossRef]
- Zeithaml, V.A.; Parasuraman, A.; Berry, L.L. Delivering Quality Service; Free Press: New York, NY, USA, 2010. [Google Scholar]
- Taylor, S.A.; Baker, T.L. An Assessment of the Relationship between Service Quality and Customer Satisfaction in Formation of Consumers’ Purchase Intentions. J. Retail. 1994, 70, 163–178. [Google Scholar] [CrossRef]
- Parasuraman, A.; Zeithaml, V.A.; Berry, L.L. SERVQUAL: A Multiple-Item Scale for Measuring Customer Expectations of Service. J. Retail. 1988, 64, 12–40. [Google Scholar]
- Parasuraman, A.; Zeithaml, V.A.; Berry, L.L. A conceptual model of service quality and its implications for future research. J. Mark. 1985, 49, 41–50. [Google Scholar] [CrossRef]
- Berry, L.L.; Zeithaml, V.A.; Parasuraman, A. Quality counts in services too. Bus. Horiz. 1985, 28, 44–52. [Google Scholar] [CrossRef]
- Choudhury, K. Evaluating customer-perceived service quality in business management education in India: A study in topsis modeling. Asia Pac. J. Mark. Logist. 2015, 27, 208–225. [Google Scholar] [CrossRef]
- Gefen, D. Customer Loyalty in E-Commerce. J. Assoc. Inf. Syst. 2002, 3, 27–51. [Google Scholar] [CrossRef]
- Barnes, S.J.; Vidgen, R.T. An Integrative Approach to the Assessment of E-Commerce Quality. J. Electron. Commer. Res. 2002, 3, 114–127. [Google Scholar]
- Wolfinbarger, M.; Gilly, M.C. eTailQ: Dimensionalizing, Measuring, and Predicting etail Quality. J. Retail. 2003, 79, 183–198. [Google Scholar] [CrossRef]
- Parasuraman, A.; Zeithaml, V.A.; Malhotra, A. E-S-Qual: A multiple-item scale for assessing electronic service quality. J. Serv. Res. 2005, 7, 213–233. [Google Scholar] [CrossRef]
- Han, S.; Baek, S. Antecedents and consequences of service quality in online banking: An application of the SERVQUAL instrument. Adv. Consum. Res. 2004, 31, 208–214. [Google Scholar]
- Yang, Z.; Jun, M.; Peterson, R.T. Measuring customer perceived online service quality: Scale development and managerial implications. Int. J. Oper. Prod. Manag. 2004, 24, 1149–1174. [Google Scholar] [CrossRef] [Green Version]
- Lin, H.F. The impact of website quality dimensions on customer satisfaction in the B2C e-commerce context. Total Qual. Manag. 2007, 18, 363–378. [Google Scholar] [CrossRef]
- Wang, Y.S.; Wang, H.Y.; Shee, D.Y. Measuring e-learning systems success in an organizational context: Scale development and validation. Comput. Hum. Behav. 2007, 23, 1792–1808. [Google Scholar] [CrossRef]
- DeLone, W.H.; McLean, E.R. The DeLone and McLean model of information systems success: A ten-year update. J. Manag. Inf. Syst. 2003, 19, 9–30. [Google Scholar]
- Li, X.; Hess, T.J.; Valacich, J.S. Why do we trust new technology? A study of initial trust formation with organizational information systems. J. Strateg. Inf. Syst. 2008, 17, 39–71. [Google Scholar] [CrossRef]
- Ehlers, U.D. Quality in e-learning from a learner’s perspective. Eur. J. Open Distance E-Learn. 2004, 9, 45141. [Google Scholar] [CrossRef]
- Yang, Z.; Liu, Q. Research and development of web-based virtual online classroom. Comput. Educ. 2007, 48, 171–184. [Google Scholar] [CrossRef]
- Udo, G.J.; Bagchi, K.K.; Kirs, P.J. Using SERVQUAL to assess the quality of e-learning experience. Comput. Hum. Behav. 2011, 27, 1272–1283. [Google Scholar] [CrossRef]
- Iverson, K.; Colky, D. Scenario-based E-learning design. Perform. Improv. 2004, 43, 16–22. [Google Scholar] [CrossRef]
- Uppal, M.A.; Ali, S.; Gulliver, S.R. Factors determining e-learning service quality. Br. J. Educ. Technol. 2017, 49, 412–426. [Google Scholar] [CrossRef]
- Martinez-Arguelles, M.; Batalla-Busquets, J. Perceived service quality and student loyalty in an online university. Int. Rev. Res. Open Distrib. Learn. 2016, 17, 264–279. [Google Scholar] [CrossRef] [Green Version]
- Sohail, M.S.; Hasan, M. Students’ perceptions of service quality in Saudi universities: The SERVPERF model. Learn. Teach. High. Educ. Gulf Perspect. 2021, 17, 54–66. [Google Scholar] [CrossRef]
- Al-Rahmi, W.M.; Othman, M.S.; MI Yusuf, L.M. Exploring the Factors that Affect Student Satisfaction through Using E-Learning in Malaysian Higher Education Institutions. Mediterr. J. Soc. Sci. 2021, 6, 299–310. [Google Scholar] [CrossRef]
- Pham, L.; Limbu, B.Y.; Bui, K.T.; Nguyen, T.H.; Pham, T.H. Does e-learning service quality influence e-learning student satisfaction and loyalty? Evidence from Vietnam. Int. J. Educ. Technol. High. Educ. 2019, 16, 7. [Google Scholar] [CrossRef] [Green Version]
- Wang, M.I.; Sheih, C.J. The Relationship between Service Quality and Customer Satisfaction: The Example of CJCU. J. Inf. Optim. Sci. 2006, 27, 193–209. [Google Scholar] [CrossRef]
- Ham, L.; Hayduk, S. Gaining Competitive Advantages in Higher Education: Analyzing the Gap between Expectations and Perceptions of Service Quality. Int. J. Value-Based Manag. 2003, 16, 223–242. [Google Scholar] [CrossRef]
- Petruzzellis, L.; D’Uggento, A.; Romanazzi, S. Student satisfaction and quality for services in Italian universities. Manag. Serv. Qual. 2006, 16, 349–364. [Google Scholar] [CrossRef] [Green Version]
- Zeithaml, V.A.; Bitner, J. Mary Service Marketing, 2nd ed.; Tata McGraw-Hill Publishing Company Limited: New Delhi, India, 2000. [Google Scholar]
- Semeijn, J.; Van Riel, A.C.R.; Van Birgelen, M.J.H.; Streukens, S. E-service and offline fulfillment: How e-loyalty is created. Manag. Serv. Qual. 2005, 15, 182–194. [Google Scholar] [CrossRef]
- Zhu, F.X.; Wymer, W.; Chen, I. IT-Based Services and Service Quality in Consumer Banking. Int. J. Serv. Ind. Manag. 2002, 13, 69–90. [Google Scholar] [CrossRef]
- Lee, G.; Lin, H. Customer perceptions of e-service quality in online shopping. Int. J. Retail Distrib. Manag. 2005, 33, 161–176. [Google Scholar] [CrossRef]
- Yang, Z. Consumer Perceptions of Service Quality in Internet-Based Electronic Commerce. In Proceedings of the 30th EMAC Conference, Bergen, Norway, 8–11 May 2001. [Google Scholar]
- Wang, M. Assessment of E-service Quality via E-satisfaction in E-commerce Globalization. 2003. Available online: https://www.is.cityu.edu.hk/resrch/ejisdc/vol11/v11c10.pdf (accessed on 20 April 2019).
- Vaz, A.; Mansori, S. Malaysian Private Education Quality: Application of SERVQUAL Model. Int. Educ. Stud. 2013, 6, 164–170. [Google Scholar] [CrossRef]
- Cai, S.; Jun, M. Internet users’ perceptions of online service quality: A comparison of online buyers and information searchers. Manag. Serv. Qual. 2003, 13, 504–519. [Google Scholar] [CrossRef]
- Jun, M.; Yang, Z.; Kim, D. Customers’ perceptions of online retailing service quality and their satisfaction. Int. J. Qual. Reliab. Manag. 2004, 21, 817–840. [Google Scholar] [CrossRef] [Green Version]
- Long, M.; McMellon, C. Exploring the determinants of retail service quality on the Internet. J. Serv. Mark. 2004, 18, 78–90. [Google Scholar] [CrossRef]
- Zeithaml, V.A.; Berry, L.L.; Parasuraman, A. The behavioral consequences of service quality. J. Mark. 1996, 60, 31–46. [Google Scholar] [CrossRef]
- Kassim, N.; Abdullah, N.A. The effect of perceived service quality dimensions on customer satisfaction, trust, and loyalty in e-commerce settings: A cross cultural analysis. Asia Pac. J. Mark. Logist. 2010, 22, 351–371. [Google Scholar] [CrossRef]
- Real, J.C.; Leal, A.; Roldán, J.L. Determinants of Organisational Learning in the generation of technological distinctive competencies. Int. J. Technol. Manag. 2006, 35, 284–307. [Google Scholar] [CrossRef]
- Reisetter, M.; LaPointe, L.; Korcuska, J. The impact of altered realties: Implications of online delivery for learners’ interactions, expectations, and learning skills. Int. J. E-Learn. 2007, 6, 55–80. [Google Scholar]
- Swedish National Agency for Higher Education. E-learning Quality Aspects and Criteria for Evaluation of e-Learning in Higher Education. Available online: https://www.diva-portal.org/smash/get/diva2:283764/FULLTEXT01.pdf (accessed on 14 October 2020).
- Teo, C.B.; Gay, R.K.L. A knowledge-driven model to personalize e-learning. J. Educ. Resour. Comput. 2006, 6, 3. [Google Scholar] [CrossRef]
- Kumar, P.; Saxena, C.; Baber, H. Learner-content interaction in e-learning the moderating role of perceived harm of COVID-19 in assessing the satisfaction of learners. Smart Learn. Environ. 2021, 8, 5. [Google Scholar] [CrossRef]
- Liaw, S.S. Investigating students’ perceived satisfaction, behavioral intention, and effectiveness of e-learning: A case study of the blackboard system. Comput. Educ. 2008, 51, 864–873. [Google Scholar] [CrossRef]
- Liu, S.H.; Liao, H.-L.; Pratt, J.A. Impact of media richness and flow on e-learning technology acceptance. Comput. Educ. 2009, 52, 599–607. [Google Scholar] [CrossRef]
- Cao, M.; Zhang, Q.; Seydel, J. B2C e-commerce web site quality: An empirical examination. Ind. Manag. Data Syst. 2005, 105, 645–661. [Google Scholar] [CrossRef]
- Koernig, S.K. E-scapes: The electronic physical environment and service tangibility. Psychol. Mark. 2003, 20, 157–167. [Google Scholar] [CrossRef]
- Saxena, C.; Baber, H.; Kumar, P. Examining the moderating effect of perceived benefits of maintaining social distance on e-learning quality during COVID-19 pandemic. J. Educ. Technol. Syst. 2020, 49, 532–554. [Google Scholar] [CrossRef]
- Oliver, R.L. Satisfaction: A Behavioral Perspective on the Consumer; ME Sharpe Inc.: Armonk, NY, USA, 2009. [Google Scholar]
- Rust, R.T.; Zahorik, A.J. Customer Satisfaction, Customer Retention, and Market Share. J. Retail. 1993, 69, 193–215. [Google Scholar] [CrossRef]
- Oliver, R.L. Satisfaction: A Behavioral Perspective on the Consumer; McGraw-Hill: New York, NY, USA, 2010. [Google Scholar]
- Sharifi, S.S.; Esfidani, M.R. The impacts of relationship marketing on cognitive dissonance, satisfaction, and loyalty: The mediating role of trust and cognitive dissonance. Int. J. Retail Distrib. Manag. 2014, 42, 553–575. [Google Scholar] [CrossRef]
- Fullerton, G.; Taylor, S. Dissatisfaction and violation: Two distinct consequences of the wait experience. J. Serv. Theory Pract. 2015, 25, 31–50. [Google Scholar] [CrossRef]
- Carlson, J.; O’Cass, A. Developing a framework for understanding e-service quality, its antecedents, consequences, and mediators. Manag. Serv. Qual. 2015, 21, 264–286. [Google Scholar] [CrossRef]
- Bekele, T. Motivation and Satisfaction in Internet-Supported Learning Environments: A Review 2011. Educ. Technol. Soc. 2010, 13, 116–127. [Google Scholar]
- Soffer, T.; Nackmias, R. Effectiveness of learning in online academic courses compared with face-to-face courses in higher education. J. Comput. Assist. Learn. 2018, 34, 534–543. [Google Scholar] [CrossRef]
- Mystakidis, S. Deep and Meaningful Learning. Encyclopedia 2021, 1, 988–997. [Google Scholar] [CrossRef]
- Al-Rahmi, M.W.; Allias, N.; Othman, S.M.; Alzahrani, I.A.; Alfarraj, O.; Saged, A.A.; Rahman, A.H.N.A. Use of e-learning by university students in Malaysian higher educational institutions: A case in University Teknologi Malaysia. IEEE Access 2018, 6, 14268–14276. [Google Scholar] [CrossRef]
- Biswas, P.; Debnath, A.K. Worldwide scenario of unplanned transition to e-learning in the time of covid-19 and students’ perception: A review. Mukt Shabd J. 2020, 9, 2038–2043. [Google Scholar]
- Baber, H. Determinants of students’ perceived learning outcome and satisfaction in online learning during the pandemic of COVID-19. J. Educ. E-Learn. Res. 2020, 7, 285–292. [Google Scholar] [CrossRef]
- Zalat, M.M.; Hamed, M.S.; Bolbol, S.A. The experiences, challenges, and acceptance of e-learning as a tool for teaching during the COVID-19 pandemic among university medical staff. PLoS ONE 2021, 16, e0248758. [Google Scholar] [CrossRef]
- Hair, J., Jr.; Sarstedt, M.; Hopkins, L.; Kuppelwieser, G.V. Partial least squares structural equation modeling (PLS-SEM) An emerging tool in business research. Eur. Bus. Rev. 2016, 26, 106–121. [Google Scholar] [CrossRef]
- Bagozzi, R.P.; Yi, Y. On the evaluation of structural equation models. J. Acad. Mark. Sci. 1988, 16, 74–94. [Google Scholar] [CrossRef]
- Hair, J.F.; Black, W.C.; Babin, B.J.; Anderson, R.E. Multivariate Data Analysis, 7th ed.; Prentice Hall: Hoboken, NJ, USA, 2010. [Google Scholar]
- Chen, T.; Peng, L.; Yin, X.; Rong, J.; Yang, J.; Cong, G. Analysis of user satisfaction with online education platforms in China during the COVID-19 pandemic. Healthcare 2010, 8, 200. [Google Scholar] [CrossRef] [PubMed]
- Kline, R.B. Principles and Practice of Structural Equation Modelling, 2nd ed.; The Guilford Press: New York, NY, USA, 2005. [Google Scholar]
- Hwang, D.; Min, H. Identifying the drivers of enterprise resource planning and assessing its impacts on supply chain performances. Ind. Manag. Data Syst. 2015, 115, 541–569. [Google Scholar] [CrossRef]
- Browne, M.W.; Cudeck, R. Alternative Ways of Assessing Model Fit. In Testing Structural Equation Models; Bollen, K.A., Long, J.S., Eds.; Sage: Newbury Park, CA, USA, 1993; pp. 136–162. [Google Scholar]
- Hooper, D.; Coughlan, J.; Mullen, M.R. Structural equation modelling: Guidelines for determining model fit. J. Bus. Res. Methods. 2008, 6, 53–60. [Google Scholar]
- Balakrishnan, N.; Barmalzan, G.; Haidari, A. Multivariate stochastic comparisons of multivariate mixture models and their applications. J. Multivar. Anal. 2016, 145, 37–43. [Google Scholar] [CrossRef]
- Akdere, M.; Top, M.; Tekingündüz, S. Examining patient perceptions of service quality in Turkish hospitals: The SERVPERF model. Total Qual. Manag. Bus. Excell. 2020, 31, 342–352. [Google Scholar] [CrossRef]
- Olorunniwo, F.; Hsu, M.K.; Udo, G. Service Quality, Customer Satisfaction and Behavioral Intentions in the Service Factory. J. Serv. Mark. 2006, 20, 59–72. [Google Scholar] [CrossRef]
- Lee, B.C.; Yoon, J.O.; Lee, I. Learners’ acceptance of e-learning in South Korea: Theories and results. Comput. Educ. 2009, 53, 1320–1329. [Google Scholar] [CrossRef]
- Goh, F.C.; Leong, M.C.; Kasmin, K.; Hii, K.P.; Tan, K.O. Students’ experiences, learning outcomes and satisfaction in e-learning. J. E-Learn. Knowl. Soc. 2017, 13, 117–128. [Google Scholar]
- Mukhtar, K.; Javed, K.; Arooj, M.; Sethi, A. Advantages, Limitations and Recommendations for online learning during COVID-19 pandemic era. Pak. J. Med. Sci. 2020, 36, S27–S31. [Google Scholar] [CrossRef]
- Gopal, R.; Singh, V.; Aggarwal, A. Impact of Online Classes on the Satisfaction and Performance of Students during the Pandemic Period of COVID 19. Educ. Inf. Technol. 2021, 26, 6923–6947. [Google Scholar] [CrossRef] [PubMed]
- Ossiannilsson, E.; Williams, K.; Camilleri, A.F.; Brown, M. Quality Models in Online and Open Education around the Globe: State of the Art and Recommendations; International Council for Open and Distance Education: Oslo, Norway, 2015. [Google Scholar]
- Vlachopoulos, D. Assuring Quality in E-Learning Course Design: The Roadmap. Int. Rev. Res. Open Distrib. Learn. 2016, 17, 183–205. [Google Scholar] [CrossRef] [Green Version]


| Constructs | Classification | Frequency | Percentage |
|---|---|---|---|
| Gender | Male | 509 | 56.87 |
| Female | 386 | 43.13 | |
| Age | 19–20 | 12 | 1.34 |
| 21–22 | 639 | 71.40 | |
| 23–24 | 179 | 20.00 | |
| 25–26 | 65 | 7.37 | |
| Level of study | Undergraduate | 676 | 75.53 |
| Postgraduate | 219 | 24.47 | |
| Discipline/Program Background | BBA (Honors) | 238 | 26.59 |
| BSc. Sciences | 195 | 21.79 | |
| BSS Arts | 177 | 19.78 | |
| MBA | 147 | 16.42 | |
| BSS Arts | 86 | 9.60 | |
| MSc. Sciences | 52 | 5.81 | |
| Course types | Live class | 240 | 26.82 |
| Recorded class | 199 | 22.23 | |
| Both | 456 | 50.94 | |
| Frequency of use online class (Daily) | Below 1 h | 154 | 17.21 |
| 1–3 h | 396 | 44.13 | |
| 3–5 h | 312 | 34.86 | |
| 5–7 h | 33 | 3.68 | |
| more than 7 h | 0 | 0 |
| Constructs | Items | Standardized Factor Loadings | C.R | AVE |
|---|---|---|---|---|
| Reliability [39,68] | Re1: Provide accurate information | 0.859 | 0.853 | 0.659 |
| Re2: Correct performances | 0.814 | |||
| Re3: Fulfill promises | 0.760 | |||
| Responsiveness [39,68] | Rs1: Prompt service | 0.853 | 0.825 | 0.613 |
| Rs2: Willingness to solve problem fast | 0.774 | |||
| Rs3: Responses according to user’s need | 0.717 | |||
| Assurance [39,68] | As1: Instructors are knowledgeable in their field | 0.860 | 0.841 | 0.640 |
| As2: Provide secure transaction facilities | 0.788 | |||
| As3: I feel confident in e-learning services | 0.748 | |||
| Empathy [39,68] | Em1: Institutions are genuinely concerned about students | 0.830 | 0.836 | 0.631 |
| Em2: Institutions are caring for the individual needs of students | 0.775 | |||
| Em3: Instructors motivate and encourage students | 0.777 | |||
| Learning content [63,85] | LC2: Learning content is well-structured | 0.941 | 0.903 | 0.758 |
| LC2: Learning materials are up-to-date | 0.873 | |||
| LC3: Sufficient learning material available | 0.791 | |||
| Website design [39,63] | WD1: Provides relevant information | 0.892 | 0.889 | 0.546 |
| WD2: Easy to use | 0.882 | |||
| WD3: Speed of completing transaction | 0.782 | |||
| WD4: Attractive and well designed | 0.672 | |||
| Perceived quality [85] | PQ1: The e-learning services is very contemporary | 0.875 | 0.821 | 0.610 |
| PQ2: The quality of the instructors is good | 0.836 | |||
| PQ3: The overall quality of e-learning services is excellent | 0.605 | |||
| Satisfaction [79] | Sa1: I am satisfied with the e-learning services | 0.980 | 0.864 | 0.684 |
| Sa2: I will recommend e-learning services to others | 0.771 | |||
| Sa3: My enrollment decision is right | 0.706 |
| Re | Rs | As | Em | LC | WD | PQ | Sa | |
|---|---|---|---|---|---|---|---|---|
| Re | 0.780 | |||||||
| Rs | 0.726 | 0.783 | ||||||
| As | 0.696 | 0.698 | 0.845 | |||||
| Em | 0.690 | 0.626 | 0.786 | 0.827 | ||||
| LC | 0.688 | 0.612 | 0.682 | 0.783 | 0.824 | |||
| WD | 0.666 | 0.568 | 0.648 | 0.634 | 0.698 | 0.835 | ||
| PQ | 0.655 | 0.547 | 0.599 | 0.627 | 0.664 | 0.715 | 0.782 | |
| Sa | 0.643 | 0.491 | 0.505 | 0.596 | 0.642 | 0.692 | 0.698 | 0.904 |
| Index | Value | Threshold Level | References |
|---|---|---|---|
| CMIN | 392.17 | [79,83,84,85,90] | |
| DF | 197 | ||
| CMIN/DF | 2.388 | 1 to 3 | |
| RMR | 0.067 | <0.08 | |
| GFI | 0.956 | >0.9 | |
| AGFI | 0.980 | >0.9 | |
| NFI | 0.908 | >0.9 | |
| CFI | 0.927 | >0.9 | |
| RMSEA | 0.043 | <0.06 | |
| P close | 0.067 | >0.05 |
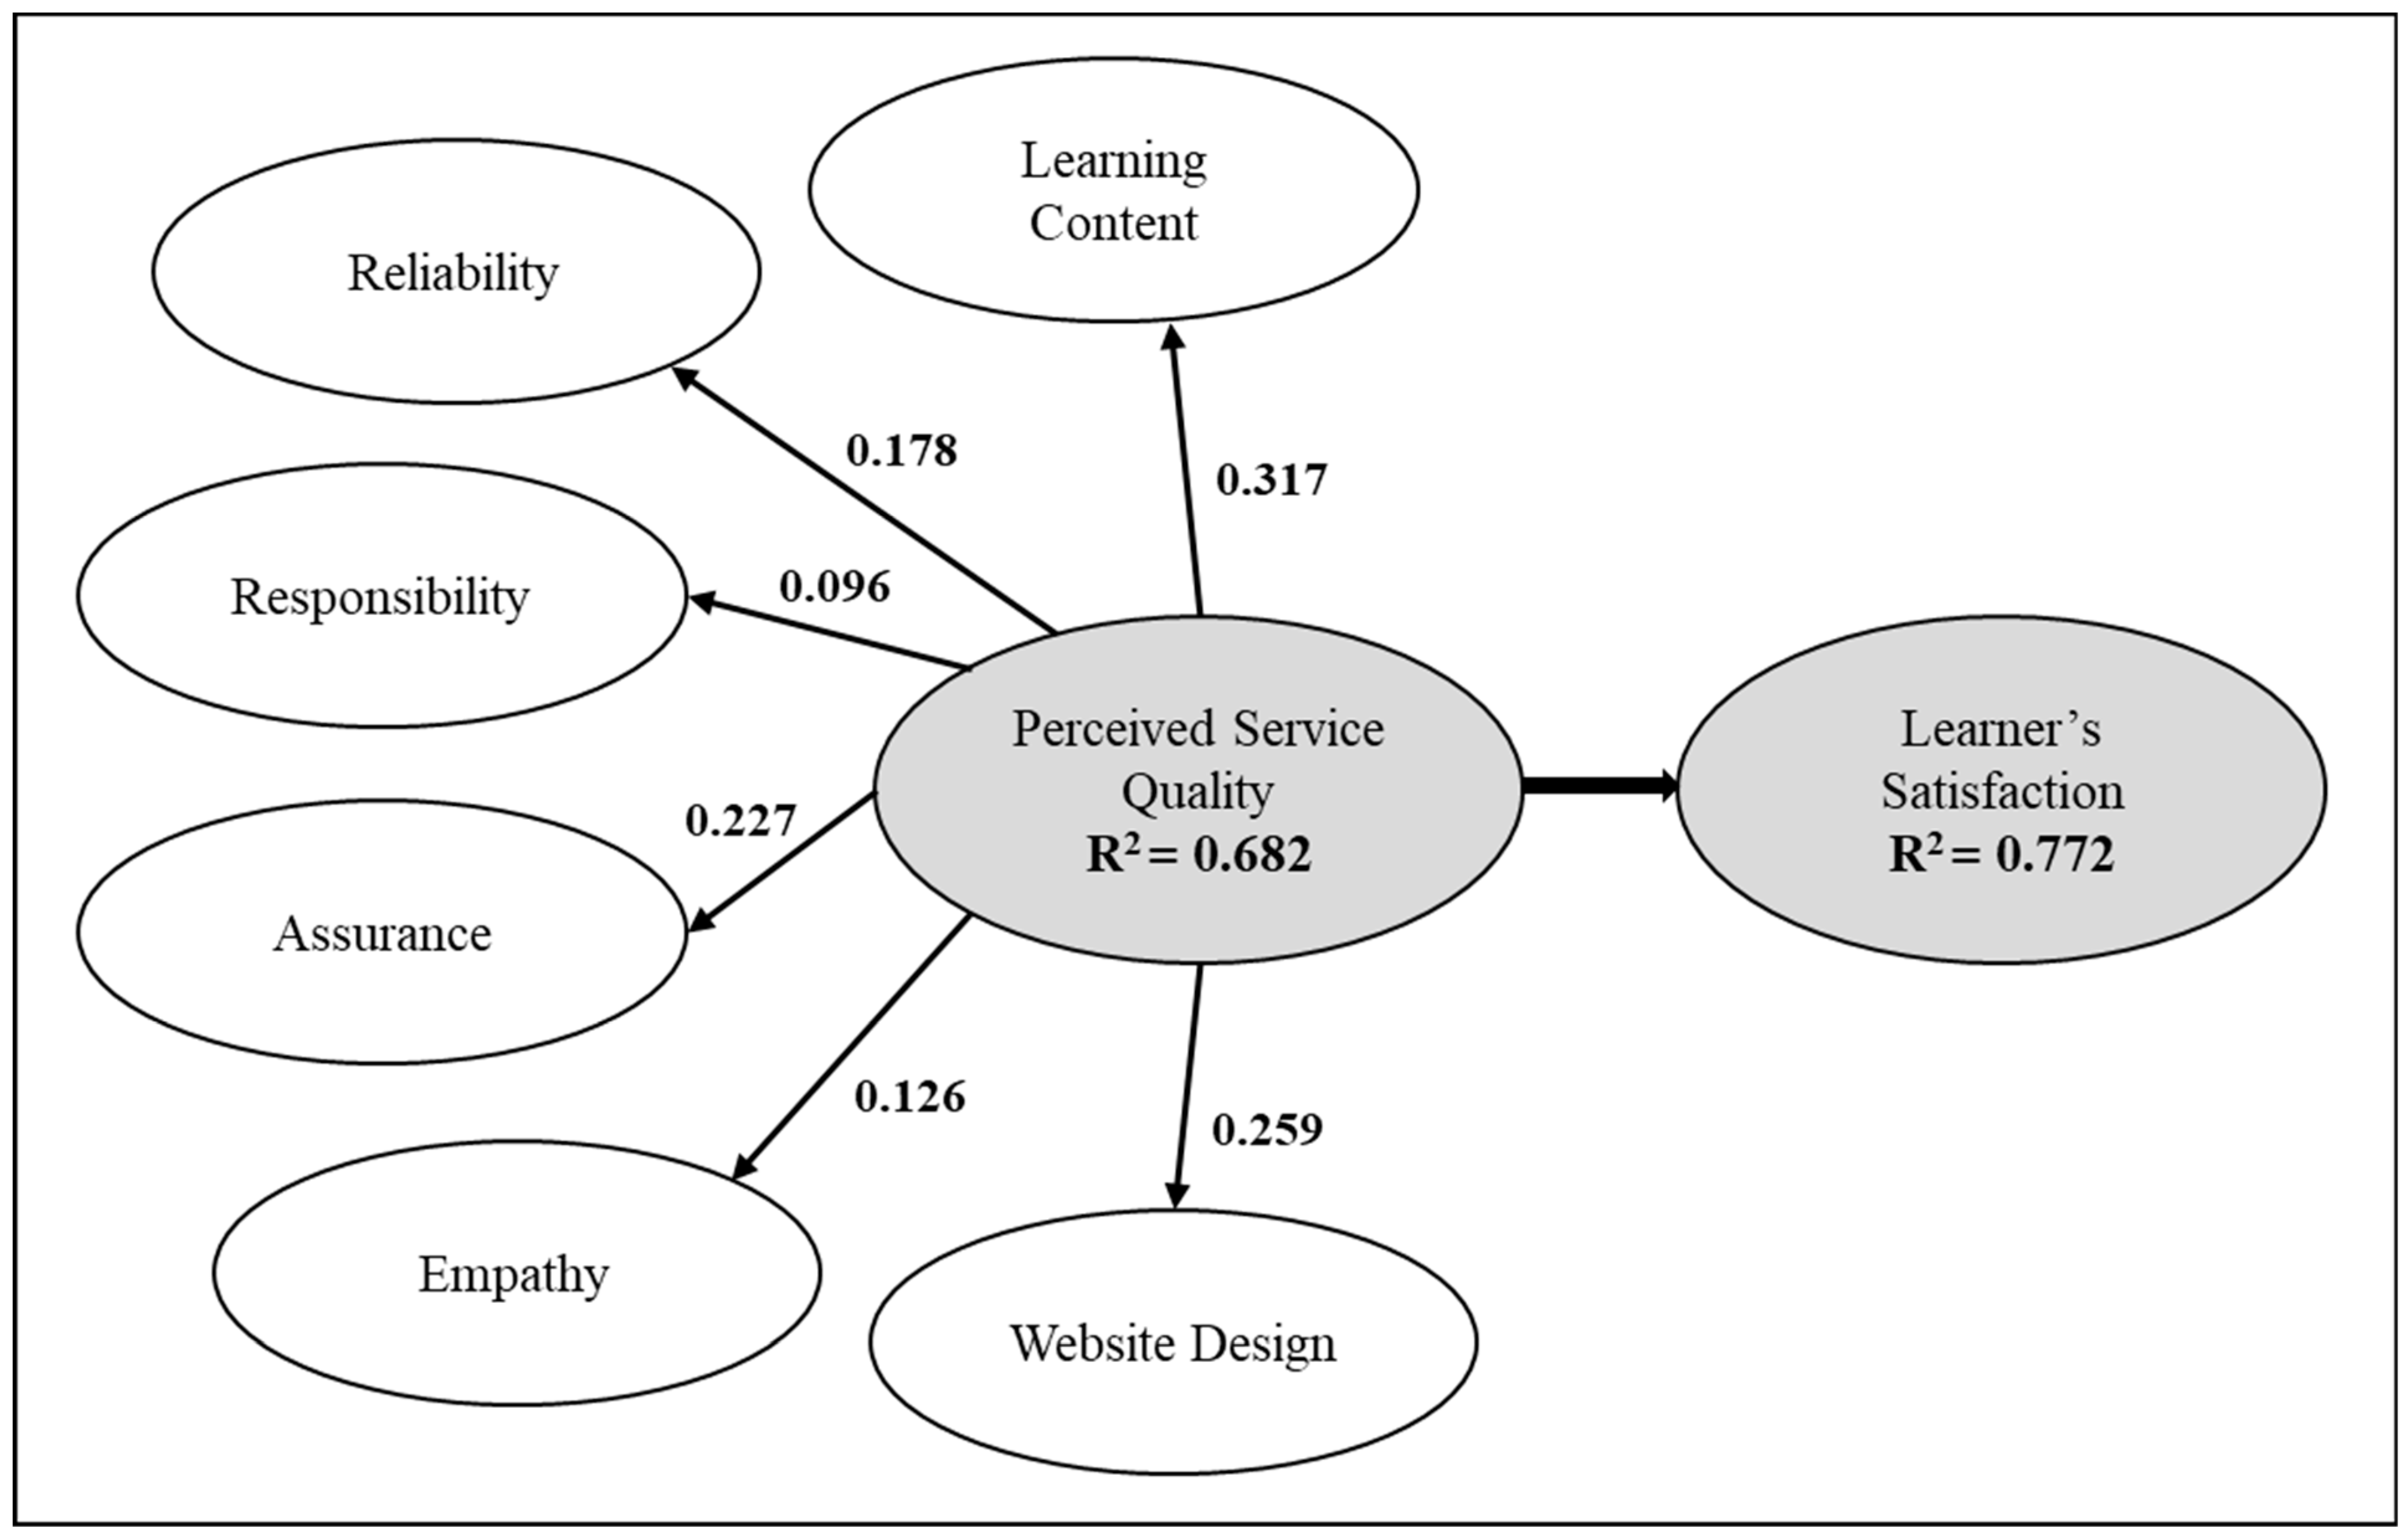
| Hypothesis | Estimate | S.E | C.R | p-Value | Decision | |
|---|---|---|---|---|---|---|
| H1 | Perceived Quality←Reliability | 0.178 | 0.057 | 2.756 | 0.005 | Supported |
| H2 | Perceived Quality←Responsibility | 0.096 | 0.042 | 0.978 | 0.75 | Not supported |
| H3 | Perceived Quality←Assurance | 0.227 | 0.062 | 3.156 | *** | Supported |
| H4 | Perceived Quality←Empathy | 0.126 | 0.051 | 2.145 | 0.010 | Supported |
| H5 | Perceived Quality←Learning Content | 0.317 | 0.069 | 5.069 | *** | Supported |
| H6 | Perceived Quality←Website Design | 0.259 | 0.063 | 3.876 | *** | Supported |
| H7 | User’s Satisfaction←PerceivedQuality | 0.587 | 0.065 | 4.076 | *** | Supported |
Publisher’s Note: MDPI stays neutral with regard to jurisdictional claims in published maps and institutional affiliations. |
© 2021 by the authors. Licensee MDPI, Basel, Switzerland. This article is an open access article distributed under the terms and conditions of the Creative Commons Attribution (CC BY) license (https://creativecommons.org/licenses/by/4.0/).
Share and Cite
Sumi, R.S.; Kabir, G. Satisfaction of E-Learners with Electronic Learning Service Quality Using the SERVQUAL Model. J. Open Innov. Technol. Mark. Complex. 2021, 7, 227. https://doi.org/10.3390/joitmc7040227
Sumi RS, Kabir G. Satisfaction of E-Learners with Electronic Learning Service Quality Using the SERVQUAL Model. Journal of Open Innovation: Technology, Market, and Complexity. 2021; 7(4):227. https://doi.org/10.3390/joitmc7040227
Chicago/Turabian StyleSumi, Razia Sultana, and Golam Kabir. 2021. "Satisfaction of E-Learners with Electronic Learning Service Quality Using the SERVQUAL Model" Journal of Open Innovation: Technology, Market, and Complexity 7, no. 4: 227. https://doi.org/10.3390/joitmc7040227
APA StyleSumi, R. S., & Kabir, G. (2021). Satisfaction of E-Learners with Electronic Learning Service Quality Using the SERVQUAL Model. Journal of Open Innovation: Technology, Market, and Complexity, 7(4), 227. https://doi.org/10.3390/joitmc7040227