1. Introduction
The reform and opening-up policy changes in China since 1978 were a pragmatic approach to alleviate poverty and efficiently address some challenges facing China during the subsequent stages of economic development [
1,
2]. As a result, the cumulative personal wealth of Chinese individuals grew from nearly zero in 1947 at a modest rate for several years, and then more recently at a rapidly accelerating pace since the opening up in the 1980s, to an astronomical amount by 2020 [
3,
4]. The concept of sustaining economic growth indefinitely is a complex topic among leading economists [
5,
6], but the need for sustained economic stability as a part of the broader landscape of sustainability is well established [
7,
8]. This is especially true in the case of individual investors in China, where the sheer immensity of the combined assets could potentially have a disruptive influence on the regional or global economy [
9].
Financial markets are critical to economic development [
10], and in particular, for developing markets regardless of size [
11]. For economic growth to be sustained, it is necessary to have established and active financial markets supported by a banking investing system [
12], the characteristics of which can be influenced by domestic culture [
13] as well as governmental policies [
14,
15]. During the recent period of growth, the amount of wealth that was saved was considerable, but for many reasons, largely historical and cultural [
16], there was little interest in how to save or invest personal wealth [
17,
18,
19].
Less than a century ago, news and information in China traveled primarily by word of mouth, taking weeks or even months to travel from one city to another. Telecommunications technology developed rapidly in China among most Chinese individuals, including lower-income and rural users [
20] who had never used a wired telephone but are presently fully engaged in the online experience via their smartphones [
20]. Specifically, and primarily through the use of the WeChat application for nearly every aspect of their lives—including personal and business communications, messages, news, articles, services, payments, funds transfers, investments, in brief, everything—China is among the most connected of any country [
21,
22], including, specifically, information, advice, and guidance about investing [
23].
As Chinese individuals have gained more access and more ways to acquire different kinds of market information, they have become more likely to increase the diversity of personal investments. There have been some difficulties in setting up new financial service institutions and industries at the accelerated rate necessary to support the rapid economic development, as well as the ensuing increased level of interest in investing [
23]. As a result of the lack of a mature financial market for investors, gambling on unregulated high-risk investments became somewhat common in the 1990s. This brief era of unfettered “investing” has become a part of the common culture of Chinese investors and was depicted in a popular Hong Kong movie released in 1994, called “Shanghai Fever”. Fortunately, with policy changes resulting in the opening up of financial markets, and with the examples of mature economic markets, China’s securities and investment institutions have developed rapidly [
24] with some expected results with regard to increased productivity and growth [
25]. With some notable restrictions, financial markets in China have been operating similarly to the global securities markets for over two decades. The regulatory landscape for banking and financial institutions in China continues to evolve steadily, more rapidly than in markets with more established financial markets [
26,
27]. Much of the investment in China is related to the real estate market, and while the market itself is loosely regulated, real estate as security on personal and commercial loans is controlled [
28,
29]. Restrictions in the financial services sector can influence investor institutional investor behavior more directly than that of individual investors, particularly when the investments, or the underlying assets, are international in nature [
30,
31]. Restrictions are varied both in purpose and applicability but include international movement of financial assets and instruments [
30], exchange rates and relatively fluid endorsement, tolerance, or sanction of foreign investments [
32,
33].
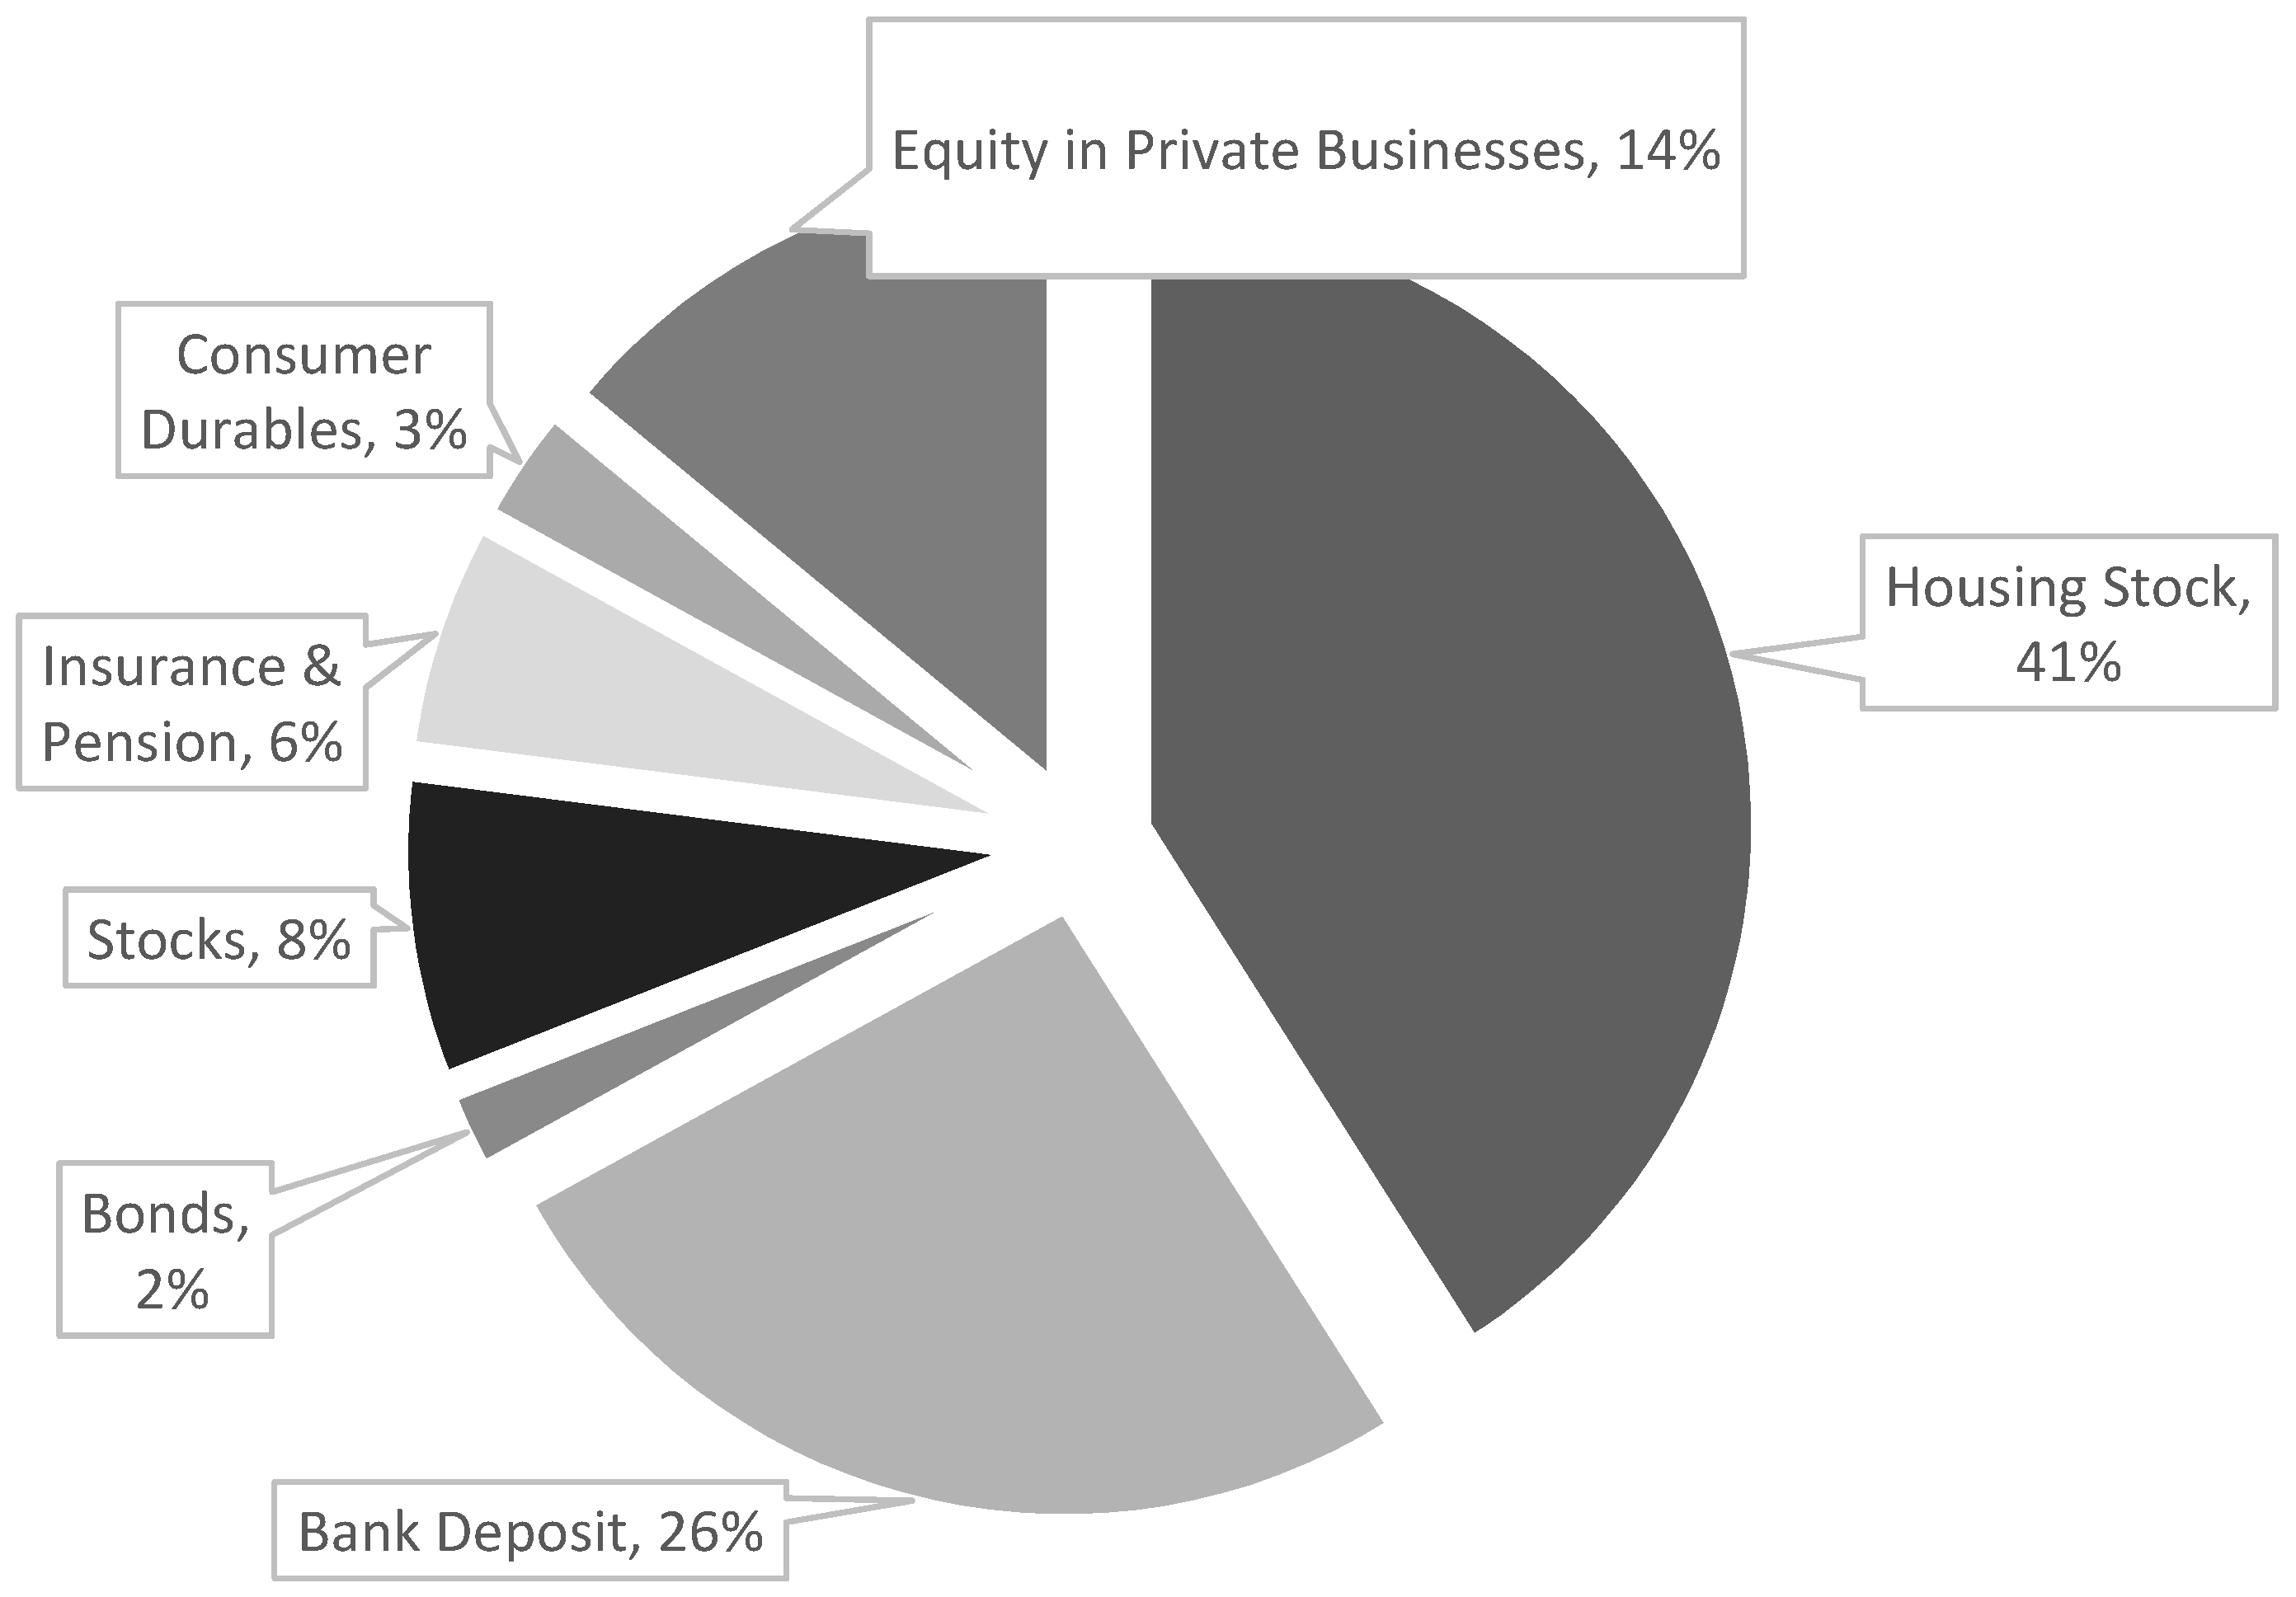
Figure 1 shows that as recently as 2019, real estate assets, at 41% of all assets, are still the most popular way for Chinese individuals to invest their personal wealth and savings. This is because China has used a unique way of changing real estate into a country’s sustainable development [
34]. Most Chinese individuals think of real estate, specifically housing, as the best way to preserve and grow their personal wealth [
35]. Bank deposits at 26% of savings are also a traditional avenue of investment and play a significant role in asset allocation [
36]. China’s privately held corporations at 14% are a relatively new concept, but many of them go bankrupt within five years [
37]. Notably, new companies are formed at a steady rate. Securities divided into stocks (8%) and bonds (2%) captured a combined 10% of Chinese assets, and consumer durables such as collections and luxuries have about 3% of the total value [
38]. The rest are insurance and pension funds (7%) [
39].
For the foreseeable future, wealth will continue to accumulate in China, and how that wealth will be invested will be an important part of the global economic development and economy, bringing tremendous potential influence to the rest of the world, hence informing the decision-making process of how that wealth will be invested in the topic of this study.
2. Literature Review
There appears to be little in the existing literature that specifically focuses on the perspective of the influence of market information acquisition on asset allocation and market investment in China, either directly or indirectly. This research seeks to address that gap and will focus on how access to information will influence the asset allocation and value investment behaviors that individuals employ as they seek to maintain and grow their asset value. During the process of allocating assets to investment, access to market information can play an important role. This research will discuss the following aspects of this topic.
2.1. Market Information Acquisition
As individual investors develop their personal investment strategy, several factors influence their decisions, among them being market information. While individual investors typically have limited expertise, training, and knowledge in investing, the aggregation of dispersed information may make a considerable contribution to their decision-making process. For individual investors in China, there are various ways to acquire market information, including internet search engine(s), institutional databases, professional websites, exhibitions, other investors either personally known or online, market exploration, conferences, and forums. Actual market information is raw data that financial services companies typically gather, process, and sell, or provide it to their clientele [
40].
2.2. Asset Allocation
Asset allocation is a generally defined term for indicating the allocation of assets in an investment portfolio among the several “major” asset classes [
41,
42,
43]. The case for new venture-based economic development is compelling, especially in the presence of any institutionalized support. However, investment in entrepreneurial activity that is likely to take place on a personal or informal level is considered to be speculative in nature and is not always well documented [
44]. In China, the types of asset allocation include corporations, futures, stocks, venture investments, funds, real estate, gold, bonds, foreign currency exchange, bank deposits, various types of insurance, trusts, collections (various valuables and precious metals, gems, etc.), and pension funds. The main assets chosen by individual Chinese investors are real estate, bank deposits, and financial instruments [
45].
2.3. Motivations for Trading
The motivational profile of investors can be viewed from a risk tolerance perspective [
46]. Evidence in the existing literature suggests a variety of factors may influence risk tolerance, including occupation [
47], gender [
48,
49], and age [
50,
51]. The relationship between risk tolerance and education is weaker to formal education, but better substantiated regarding risk mitigation more prevalent in those with specialized knowledge of investing [
52,
53]. As supported by the prevalent views on risk tolerance in investing, the level of risk, generally, and the subsequent asset allocation can be separated into three types of investment in a spectrum, with value investment on the risk-averse end, rational, or informed speculation, and gambling, or uninformed asset allocation with results that are purely chance. There are three fundamental concepts that characterize value investment: attitude, safe margin, and inner value [
54]. Value investing is considered to be a conservative approach to asset allocation [
55] and expectation of returns. While there is a relationship between investment turnover, liquidity, and returns [
56], most assets allocated to stock markets are considered investments. Investment is unlike and distinct from gambling, while speculation and gambling have some similarities and conceptually, from an empirical perspective, are related. Investors, speculators, and gamblers have similar characteristics, including motivational and cognitive aspects. There are some common personality attributes between the three as well, and in particular, there is a strong overlap for gambling and speculation behaviors [
57].
2.4. Risks and Returns
On the basis of their different methods of market information acquisition, investors will choose different ways to allocate their assets on the risk spectrum, with higher risks and returns on one end of the spectrum, and lower risk and lower potential return on the other end of the spectrum [
58]. An analysis of rational speculation usually presumes that there is a dampening of the fluctuations caused by “noise” traders [
59].
Under the classic asset allocation method, when electing to invest in a particular asset class or segment, investors would typically have two objectives in mind. Firstly, to improve the return, or expected return of the overall portfolio, and secondly to improve the resilience to market fluctuations through diversification of the portfolio [
60]. The link between risk and return is widely accepted; however, other variables may play a role in achieving the best balance of risk/return [
61]. Additionally, complexity and familiarity of an investment class plays a role in the allocation as the correlation between perceived risk, and historical risk has been found to be much lower when the investors perceived the investments they found to be more difficult to assess, as riskier, a perspective that was likely driven by familiarity bias [
62,
63].
2.5. China, Globalization, and Investor Age
At the macro level, China continues to play a major role in foreign direct investment (FDI), which in turn is critical to the economic development in Africa [
64]. However, FDI is administrated at the national level and therefore affords little direct opportunities for individual investors. At the same time, domestic economic development has been partly a result of non-transactional cooperation with other nations including Russia [
65]. However, this study focuses on investment opportunities present to individual investors in China. As a result of the rapid development since the economic opening up of China, investors have very different perspectives on asset investment allocation depending upon their age. Investors with a relatively small difference in age may have had dramatically different experiences with regard to property ownership and investing. As a result of this, age will play a major role in the factors that influence the Chinese with regards to how they allocate their assets; conducting different kinds of investment; and their ability to acquire, evaluate, and assimilate new ideas regarding asset allocation. As this has happened relatively rapidly, their investment behaviors have also changed, along with their behavior towards spending and saving.
For this study, investor age was assigned into groups by generation, as indicated in
Table 1. Age is a continuum, making the common description of generations X, Y, and Z, and Boomers, etc., somewhat approximate but generally considered to be approximately 20–25 years in duration [
66]. While historians and researchers have used differing dates and names to define the cohorts, there exists a fundamental consensus in the existing literature accepting the age groups defined by the Pew Research Center, as shown in
Table 1 [
67,
68].
The validity of using the cohorts is based on existing literature that argues that these groups will tend to share much of the same general values, behaviors, and attitudes [
69,
70].
In China, and elsewhere, those below 18 years of age, for example, will very rarely have an income. In China, their savings are often gifts or traditional New Year’s gifts in the form of red envelopes and are usually held by their parents [
71]. Some in that age group may have the ability to make purchases or consume, but most of them will not, and they are rarely familiar with the concept of investment [
72,
73].
Generation Z in China, typically aged 7–26, are often students, are frequently unmarried, and often do not have a stable income, and many, at least those for whom investing is a possibility, are relatively well educated [
74]. This demographic tends to spend their discretionary funds on fashion consumer goods or entertainment [
75,
76]. It is this group that is at the center of the rapidly increasing wealth of China’s development and whose concepts about consumption and investment are changing [
77].
The Millennial generation, Generation Y, typically aged 25–40, expect to see their income trending upwards with age [
78]. This group tends to have a strong investment interest; they have a demand for information and are familiar with how to access information online [
79]. The market and investment-related information that they have access to plays an important role in shaping their investment strategies, and although they may have several ways to allocate their assets, the results have become a pattern of mimicking their parents with a combination of traditional conservative investments such as cash of gold, as well as high-risk speculative, bordering on gambling, investment decisions [
73,
79].
Generation X, typically aged 41-56, many of whom are preparing for retirement, may perceive that the pressure to earn and to grow their wealth is decreasing [
80], and although they may take risks, they tend to find an equilibrium between value investment and rational speculation [
73,
81].
The Baby Boomer generation, typically those over the age of 56, may find their children are independent and they typically pay more attention to their health than on growing their fortunes [
82,
83]. They tend to avoid high risks associated with certain types of investments and trend towards conservative investments [
84]. They also may be in a situation where they are depleting their savings whether on recreation and travel or on living expenses [
79,
81].
In modern China, the asset allocation policy plays an important role in an investment fund’s returns over time. The relationship between active management and policy asset allocation’s contribution to the return variation among funds is not evident [
85], but it is likely that the government leadership may prefer state assets to remain in the control of the state, allowing influence over the performance of some of the country’s largest corporations [
86,
87]. Nevertheless, Chinese investors have options for investment in other markets. As a result of globalization and global business, more Chinese have had exposure to western banking and financial services, and as a consequence, they may choose to allocate their assets globally to the extent possible. While there are controls on currency exchange and international transfer, there are investment options including foreign exchange, foreign direct investment, and an account on the Hong Kong Stock Exchange. Foreign investment in the Chinese stock market is also limited but possible through transference markets located in Hong Kong or other international financial centers [
36,
39,
87].
Through these and other ways, including FDI abroad [
88], China’s economic influence continues to increase worldwide [
89], being presently the second-largest economy and the largest exporter [
90]. Some sources report that China is, or will soon become, the world’s largest economy [
91,
92].
3. Theoretical Framework and Hypothesis
According to the literature review, it is apparent that market information acquisition plays an important role in the process of investing, and that environmental scanning is the general process of market information acquisition [
93]. It also seems that there is a gap in the existing literature in the area where the relationship between asset allocation/value investment and market information acquisition is not clear. This research aims to explore the relationship between them.
Research question (RQ): What is the relationship between market information acquisition and asset allocation/value investment?
According to the existing body of knowledge examined above, there are possible correlations that are worthy of closer examination and from which the three hypotheses below are derived:
Regarding market information acquisition and asset allocation, they are tightly related, and in general, individuals with less knowledge will opt for the default allocation more often than individuals with more knowledge. Thus, plan design, especially the selection of plan defaults, and the need to improve the financial literacy of participants are very important [
94].
Hypothesis 1 (H1). The increasing amount of market information acquired by China’s investors will result in the allocation of assets into expanded categories.
Hypothesis 2 (H2). The increasing amount of market information acquired by China’s investors will result in the allocation of assets into less conservative investments.
Market information acquisition and value investment are tightly related. As a firm is allowed to collect information, there will be a tendency to devote an increasing amount of time to information gathering before decision making, and when uncertainty increases, the firm may find it preferable to delay investment decisions and collect more information [
95]. As asset value increases, so does the desire for market information and the perceived value of that information.
Hypothesis 3 (H3). Chinese investors who have more assets allocated to lower risk investments will increase the amount of resources (time and money) spent on information acquisition.
4. Methodology
This study combined the results of analyses from a series of interviews with the quantitative analyses of anonymized data from a financial services institution to test the hypotheses and derive findings.
4.1. Instrumentation Design
A pilot study based on open-ended interviews and discussions was undertaken to distinguish the highest frequency of responses for each of the proposed questions for the research survey. A previous study indicated that investment decisions appeared to be made on the basis of investor-centered factors, such as personal preference, previous investment experience, and personal biases [
96]. The pilot study used to formulate the survey instrument included interviews with subjects in the following categories. Thirty Chinese individuals (15 males, and 15 females) divided into three age categories: 18–25 millenniums, 26–40 younger adults, and 41–60 older adults. Each category was composed of 5 males and 5 females. All subjects self-reported as using at least one method to invest their financial assets. The interview questions were translated into Chinese (Mandarin), and the responses were subsequently translated into English. The accuracy of both translations was tested by a consensus of four bilingual U.S.-educated Chinese university faculty. On the basis of the frequency of responses to the questionnaire, we identified the questions and possible responses as appropriate.
4.2. Instrumentation
The following questions used in the interview are based on the previous pilot study of the same topic. Demographic data such as gender, age, region, education, location, income, and total assets were gathered. For the question on market information acquisition, five alternatives were measured as the factors of market information acquisition: (1) attention about market information, (2) average time to retrieve market information, (3) access to market information, (4) most frequent access to market information, and (5) the good news (bull) or the bad news (bear).
There are various ways to retrieve market information. The information could be primary data, such as results from an interview or survey, or it could be secondary data, such as an income statement or other financial report from a listed or private corporation, or even comments in an investment forum [
97]. Some market information has a longer life span, and some may be more accurate or relevant [
98]. For effective market information to be selected, acquired, and used, establishing information acquisition networks in the target markets is an especially important part of the information acquisition process [
99]. For the survey questions used to gather data on asset allocation, six alternatives were provided to measure the factor of asset allocation: (1) different categories of assets, (2) main assets invested by subjects, (3) the percentage of the main assets, (4) total investment time, (5) average time to operate assets by a cash flow period, and (6) global asset allocation.
In addition to domestic asset allocation, some investors prefer to allocate their assets worldwide, and a Global Portfolio Allocation Scoring System (GPASS) for determining an appropriate allocation for individual investors is presented [
41]. Generally, for investments, investors will have at least one operation from the following three: long-term strategic asset allocation, tactical asset allocation as market portfolio forecasting, and some agile action options that vary according to the dynamic market conditions and allow dynamic asset allocation/reallocation [
100].
Due to the linkage between assets and investments, three alternatives were provided to measure the factor of value investment for the question on value investment: (1) radical or conservative investors, (2) average annual profit earned by value investment, and (3) the influence of investments by market fluctuation. For example, when an IPO releases news, the results may result in a move of stock prices, creating a window of opportunity for a select group of people to act on the information. Some value investments are not relevant for a certain profile of investor, as either the investor opinions about value investment are beyond the range of risk tolerance and safe margin, or the market information does not fit into their investing circumstances.
4.3. Data Collection
Excluding the pilot study, four data sets were analyzed in this study. As indicated in
Table 2, the data used had different properties in terms of source, anonymity, type, and confidentiality (anonymized for this study).
Four categories of data were collected. Data I (D I): Anonymized statistics of clients’ data provided by a financial services firm in a securities company (confidential). Some details of this data are attached in the appendices, and because the data refer to confidential business information, the name of the institution and any identifying information or specific ID information, numbers, or name was hidden. The data provided by one of the top securities companies in China included data on 564 investors.
Data II (D II): Statistics and data from a WeChat account provided by a securities company (confidential). The details of this data are included in the appendices, and because the data refer to confidential business information, the name of the institution was hidden. The data included was from the statistics of a WeChat public account controlled by one of the top security companies in China. There were 40,875 people subscribed to the WeChat channel.
Data III (D III): The results of an online survey on household asset allocation in China. The information was published in 2019 and is in the public domain. The platform used to conduct the survey and was
www.wjx.cn (accessed on 3 October 2021), a well-known website for researchers conducting online surveys and for testing instrument designs. Sixty-one people participated in the survey.
Data IV (D IV): Investors’ market information acquisition research report [
101]. A survey report belonging to Panorama Network Co. LTD. (ID:518010), a firm listed on the Shanghai Stock Exchange, was used. Various survey reports and analyses focusing on the acquirement of market information and other factors are included in the report, parts of which were analyzed for this study. The report includes 499 listed companies (304 in Shanghai and 195 in Shenzhen), as well as information on 2763 investors (682 from Shanghai and 2081 in Shenzhen) who had replied to the survey and valid results.
5. Results
The results and analyses sections were divided into the following parts: reports on market information, asset allocation, and value investment, and, separately, the correlation analyses between them. All figures, tables, and other data were from the sources indicated, with only the format layout changed for clarity and to ensure anonymity.
5.1. Market Information Acquisition
For D II “Statistics of a WeChat public account” and D IV “Investors’ market information acquisition research report”, 43,638 registered users were included in the analyses. Of 40,875 subscribers, there were 21,820 (53.38%) male and 19,051 (46.61%) female subscribers utilizing this information channel, with four subscribers not including any gender information. There were 18,199 (44.52%) subscribers aged 18–25, 11,813 (28.90%) subscribers aged 26–35, 6185 (15.13%) subscribers aged 36–45, 4029 (9.86%) subscribers aged 46–60, and only 649 (1.59%) subscribers aged below 18 or over 60. There were two subscribers with ages remaining unknown.
D II is the statistical data of a WeChat public account from a medium-sized securities company. On the account, the firm releases news and messages about investments every trading day. Many investors subscribed to the account for the purpose of acquiring useful securities trading-related information on which, presumably at least in part, to base their asset allocation decisions. It appears that males comprised a slight majority of the subscribers, which is expected considering the circumstances in China, and the male majority was slightly in the majority of age ranges, making the interest in market information nearly equal by gender. However, age did influence the results—millenniums aged 18–25 were the majority of subscribers, and the number of people decreased in the progressively advancing age ranges. There were only 2% of subscribers below 18 or above 60, which validates the trends identified in the literature review “China and Globalization” section. Compared with people in older age ranges, particularly older than 25 years of age, the millenniums are more likely to use more recently developed media types and mobile devices to acquire information [
102]. According to D IV, the investors’ market information acquisition research report from which
Table 3 is derived, 2763 investors participated in the research. The number of responses included in the analysis varies slightly due to invalid or incomplete responses. The results and analyses for investors’ attention, access, and expenses are indicated separately.
We used a formula to convert the Likert scale when “A” means “most important” and “E” means “least important”. S = 2 × A + 1 × B + 0 × C + (−1) × D + (−2) × E. If the result is positive, it indicates that people have positive preferences about the item, vice versa, and the range of scores is from 200 to minus 200.
Table 3 shows investors’ interest in specific market information. The subjects reported that the semiannual and annual reports (score 146.07) was the most important factor for market information. The general financial report ranked next (score 125.89), and major shareholders’ condition (score 124.95) and important events (score 117.5) were also strongly considered by investors. Operation situation (score 64.07) was found to be of medium importance, while executives, managers, and employees were rated as slightly important (score 29.19).
Table 4 indicates investors’ access to market information. Websites (official website score 96.99/other website score 75.61) were the most frequent tools investors used, while magazines and newspapers (score 62.73) were also ranked as moderately frequently used tools. Software (score 25.85) and TV broadcast (score 18.55) were rated as slightly frequently or occasionally used tools used by investors. Rated as seldom used were securities companies (score −88.06), and direct inquiries to firms rated the lowest (score −119.69).
Table 5 shows investors’ expenses during the process of acquiring market information. They spend some money on the access of websites (score 70.38), and a small portion of investors will choose to allocate some part of their budget for acquiring news by magazine and newspaper (score −0.64) and software (score −31.51), with phone communication scoring lower (−48.08).
From
Table 3,
Table 4 and
Table 5, it can be seen that Chinese individuals prefer to use websites and online databases to access and research companies’ annual reports, financial reports, and important shareholder information. The average amount of attention paid to market information for Chinese investors was found to be 4.01 on the basis of an identified scale where 3.40–4.19 was rated as important, 3.10 (range 2.60–3.39, normal), and expense was 2.97 (range 2.60–3.39, normal).
5.2. Asset Allocation and Value Investment
D III: Household asset allocation in China, from which
Table 4 is derived, is based on the report summarizing the survey results from
www.wjx.cn (accessed on 3 October 2021). Sixty-one subjects successfully completed the survey.
The annual income of Chinese households: the original data had an extra category named “Above 1 Million”, but as none of the 61 subjects reported earning that much money, the category was not included. The results showed that 29% of Chinese individuals had an annual income below RMB 100,000, most Chinese (44%) had an annual income between 100,000 and 200,000, a quarter of Chinese individuals reported an annual income between 200,000 and 500,000, and only a few Chinese individuals reported earning more than a half-million annually.
The total assets of Chinese households indicated that one-third of households had less than RMB 1 million in total assets; 39% of households had total assets between 1 million and 3 million, 13% of households had 3 to 5 million; and the remainder, 15%, had more than RMB 5 million in assets.
Table 6 shows the asset allocation of the Chinese population. We used a formula: X = A (10–30% part) × 1 + B (30–70%) × 2 + C (>70%) × 3 to calculate which investment tool Chinese individuals use the most for asset allocation. The score of real estate was the most important (X = 1.15), and deposit (X = 0.74) was also used commonly by Chinese individuals; stock (X = 0.41) and investment products (X = 0.31) were the secondary choices for some investors; bond (X = 0.07), fund (X = 0.07), and other investments (X = 0.08) were chosen by a few people.
The majority of Chinese households have about 2 million RMB in assets, and they earn about 10% of their total assets annually. Most of them have a balanced portfolio considering both risks and returns during investment. As indicated in the literature review, real estate remains the biggest source of wealth for the Chinese, and bank deposits are the easiest way for Chinese to invest regardless of knowledge and age [
103]. Nevertheless, stocks and investment products are becoming more prevalent in recent years.
Table 7 summarizes D I. As personal confidential data, D I includes all investors’ trading records from an anonymous high-level financial manager. There were 564 people as manager’s clients, but only 347 investors had at least one trading record during a fiscal year. All clients had a sum of up to RMB 39.08 million in assets; their daily market value in a rolling year was 51.57 million, and trade volume was 1.855 billion.
Most investors’ risk preference was found to be steady (53.55%) and positive (43.26%), and only a few investors were in the conservative (0.53%), cautious (1.60%), and radical (1.06%) risk preference categories. Interestingly, investors either were new (less than half year = 83.16%) in the market or had already been investing over the years (more than five years = 10.82%). Of knowledgeable investors, only 4.79% chose to trade exclusively, while the remaining 95.11% had a variety of investment types in their investment portfolio.
5.3. Analysis
D I and D IV are statistical data from investors. The respondents of D II and D I were from a self-selected pool of Chinese individuals with online access. By comparing the data from the two categories with the results gathered in the previous pilot study, we were able to conduct the following analysis. In D I, Chinese investors bought various kinds of securities, and for each method of investment, the assets are separated into different commercial areas across the first, second, and third industries. In D IV, Chinese households were more likely to put the majority of their personal wealth in bank deposits and real estate. Comparing to D I and D III, the former group acquired more market information through a wider variety of sources and media, and their asset allocation portfolio had more kinds of investment products. Supported by the previous study, experienced investors had more assets and were more likely to acquire a greater variety of market information. Moreover, when general Chinese individuals are compared with Chinese investors, the latter were found to have more money to invest and were more concerned with the dynamic changing of the market, more frequently.
The preference of risk in
Table 5 is similar to preference risk in D I, with the major risk preferences being either “steady” or “positive”; thus, there was no significant relationship between market information acquisition and investment behavior. Hypothesis 2 was rejected. The main tested data were D I, where Cronbach’s α was 0.678, almost reaching the well-trusted level of 0.7. Therefore, the evidence shows the overall data were reliable and worth subjecting to further analyses.
Table 8 shows the correlations between market information acquisition and asset allocation by completing a correlation analysis of D I and D IV (R
2, 0.82); thus, the evidence indicates that the number of categories of asset allocation portfolios was very strongly positively related to the amount of market information acquired. Hypothesis I was supported. The correlation between the number of assets and market information acquisition was found by conducting a correlation analysis of D I, D III, and D IV. The
p-value = 1.72 E−33 < 0.001, indicating that the difference was significant, and Pearson’s r = 0.478, lying in the section of (0.40, 0.59); therefore, the evidence shows that the amount of assets had a moderate positive correlation with market information acquisition. Hypothesis 3 was supported. Regarding the number or type of statistical data and suitable calculations, there was no evidence readily available from which to derive the correlation between market information acquisition and annual interest profit.
6. Discussion
Economic sustainability is founded on the presence of established, recognized, regulated, and stable financial institutions. While these institutions are presently in place in China, they are relatively newly established, which, combined with cultural and social factors, influenced by economic uncertainty prior to the opening up of the Chinese economy to foreign commercial activity, has resulted in limited acceptance by individual investors, without whom the stability of the financial system remains in question. The relevance of the findings is largely founded on the premise that the investment behaviors of individual investors in China could have a far-reaching and potentially disruptive effect on the economy of China, and by extension, regional or global economic markets.
The extent to which individual investors perceive the stability of the financial instructions will influence the economic sustainability and growth of the Chinese economy.
The findings suggest some correlations that lead to the following conclusions.
Chinese individuals are unlikely to accept more risk, regardless of the amount of market information acquisition that takes place. On the basis of the results and conclusions above, we are able to note the following implications. Most Chinese investors are aware and cognizant that the securities market in China entails a risk according to the legal disclaimer, “Stock investments are subject to market risks, be cautious while entering the market”, which seems to be interpreted not as a disclaimer but rather as a statement of fact.
Chinese investors with more assets will acquire more market information. As the amount of assets in a portfolio increases, the market information acquisition activity increases; this could be explained by the increased level of risk/benefit resulting in a higher motivational level on the part of the investors.
Chinese individuals will expand and diversify the types of investments in their asset allocation portfolio as they increase their acquisition of market information. For Chinese investors, the amount of market information acquisition has a positive relationship with asset allocation and value investment. Investors with less wealth are less likely to try to attain more wealth through investment, while those with more wealth are more likely to focus on acquiring useful market information and to expand the categories of investment types.
It should also be noted that investors with less assets to invest could benefit from increasing their attention to market information acquisition in order to better understand and mitigate risk and achieve a balance of risk–return in their investment strategies.
There is no evidence in this study that shows a correlation between market information acquisition and annual asset growth. While this was outside the scope of this study, it is hoped that these findings can provide part of a foundation on which to build further related research in an attempt to identify strategies for increasing asset growth.
The evidence suggests that individual Chinese investors will, over time, avail themselves of more information related to investment types and are likely to gravitate towards more investment classes offered within more formalized established financial institutions. This would in turn result in greater stability within the investment system and ultimately result in a more sustainable economic development landscape.
The role and response of the financial institutions within an economy the breadth and depth of that of China is an immensely complicated topic. While there is a growing body of literature on this and related topics, the rapidly changing situation, both from economic growth and evolving regulatory actions, result in a need for more research on the topics of both investor behavior and how investment activity can impact the stability and sustainability of the Chinese economic system.
7. Conclusions
Especially in light of the current turmoil of lack of liquidity and potentially catastrophic failure of some mega investment funds in China, the need for investor activity in the financial markets and institutions has never been more important than it is at the present time [
11]. A high level of activity at the individual investor level is necessary to sustain economic growth, and that activity can only be driven through the creation and propagation of a financial market where individual investors feel confident, informed, and empowered. Only through these means will investors migrate their assets from the less structured and regulated investment options into those investment opportunities are considered appropriate, as indicated through government policy support. Towards that end, the implications of this research can be useful to those that develop fiscal, economic, and financial services policy, as well as to financial service organizations and individual investors.
8. Limitations and Future Research
Although the result was supported by considerable data, there were some deficiencies in the way the data were categorized. The research combined four databases from the concepts of the market information acquisition, asset allocation, and value investment separately, and each data set came from a different institution, platform, or database that resulted in the possibility of a lack of harmonization among the factors. Firstly, the data may not have represented the same profile within the population. Although the goal was to have a general representation of all Chinese individuals, the sample profile might vary due to different research orientations of the data sources, thus reducing the generalizability of the findings. Secondly, even though the research data came from the same year, making the results correct within a wide range, the dynamic nature of asset allocation and investing could result in changing circumstances day by day, in which case, the result would be influenced by events at the time; some seasonal and cyclical factors may also cause errors. Thirdly, the sample volume changed depending on the different data: the smallest questionnaire had 61 subjects, while the WeChat public account data had 40,875 subscribers.
With the limitations above, the following research methods/topics are suggested for further exploration in subsequent research. A single survey combining the same information included in this study, on acquiring new information, as to how subjects allocate their assets and what kind of investment methods they choose would validate while strengthening and clarifying this study. Research while the nation’s economic condition is in a dynamic balance with little fluctuation would yield more consistent and reliable results. While market conditions are not ever stable, this could be mitigated through collection of the within a relatively brief time frame. Increasing the sample size is of course always desirable, but more than size, increasing the variability, from different regions of China; different age groups; different socio-economic status; urban vs. rural residents; and tracking occupation would all serve to increase the generalizability of the findings.
Probably due to the limited availability of data, there is limited literature exploring the correlation between market information acquisition and asset value growth and how ultimately the investment activity of individual investors in China can affect the sustainability of the economic growth that is the touchstone of the present day Chinese economic landscape. These are relevant and interesting areas for further research.


