
Correlations between Salivary Immuno-Biochemical Markers and HbA1c in Type 2 Diabetes Subjects before and after Dental Extraction

 ,
,  , ,
, , 
Abstract
1. Introduction
2. Materials and Methods
2.1. Study Group
2.2. Saliva Sampling
2.3. Statistical Analysis
3. Results
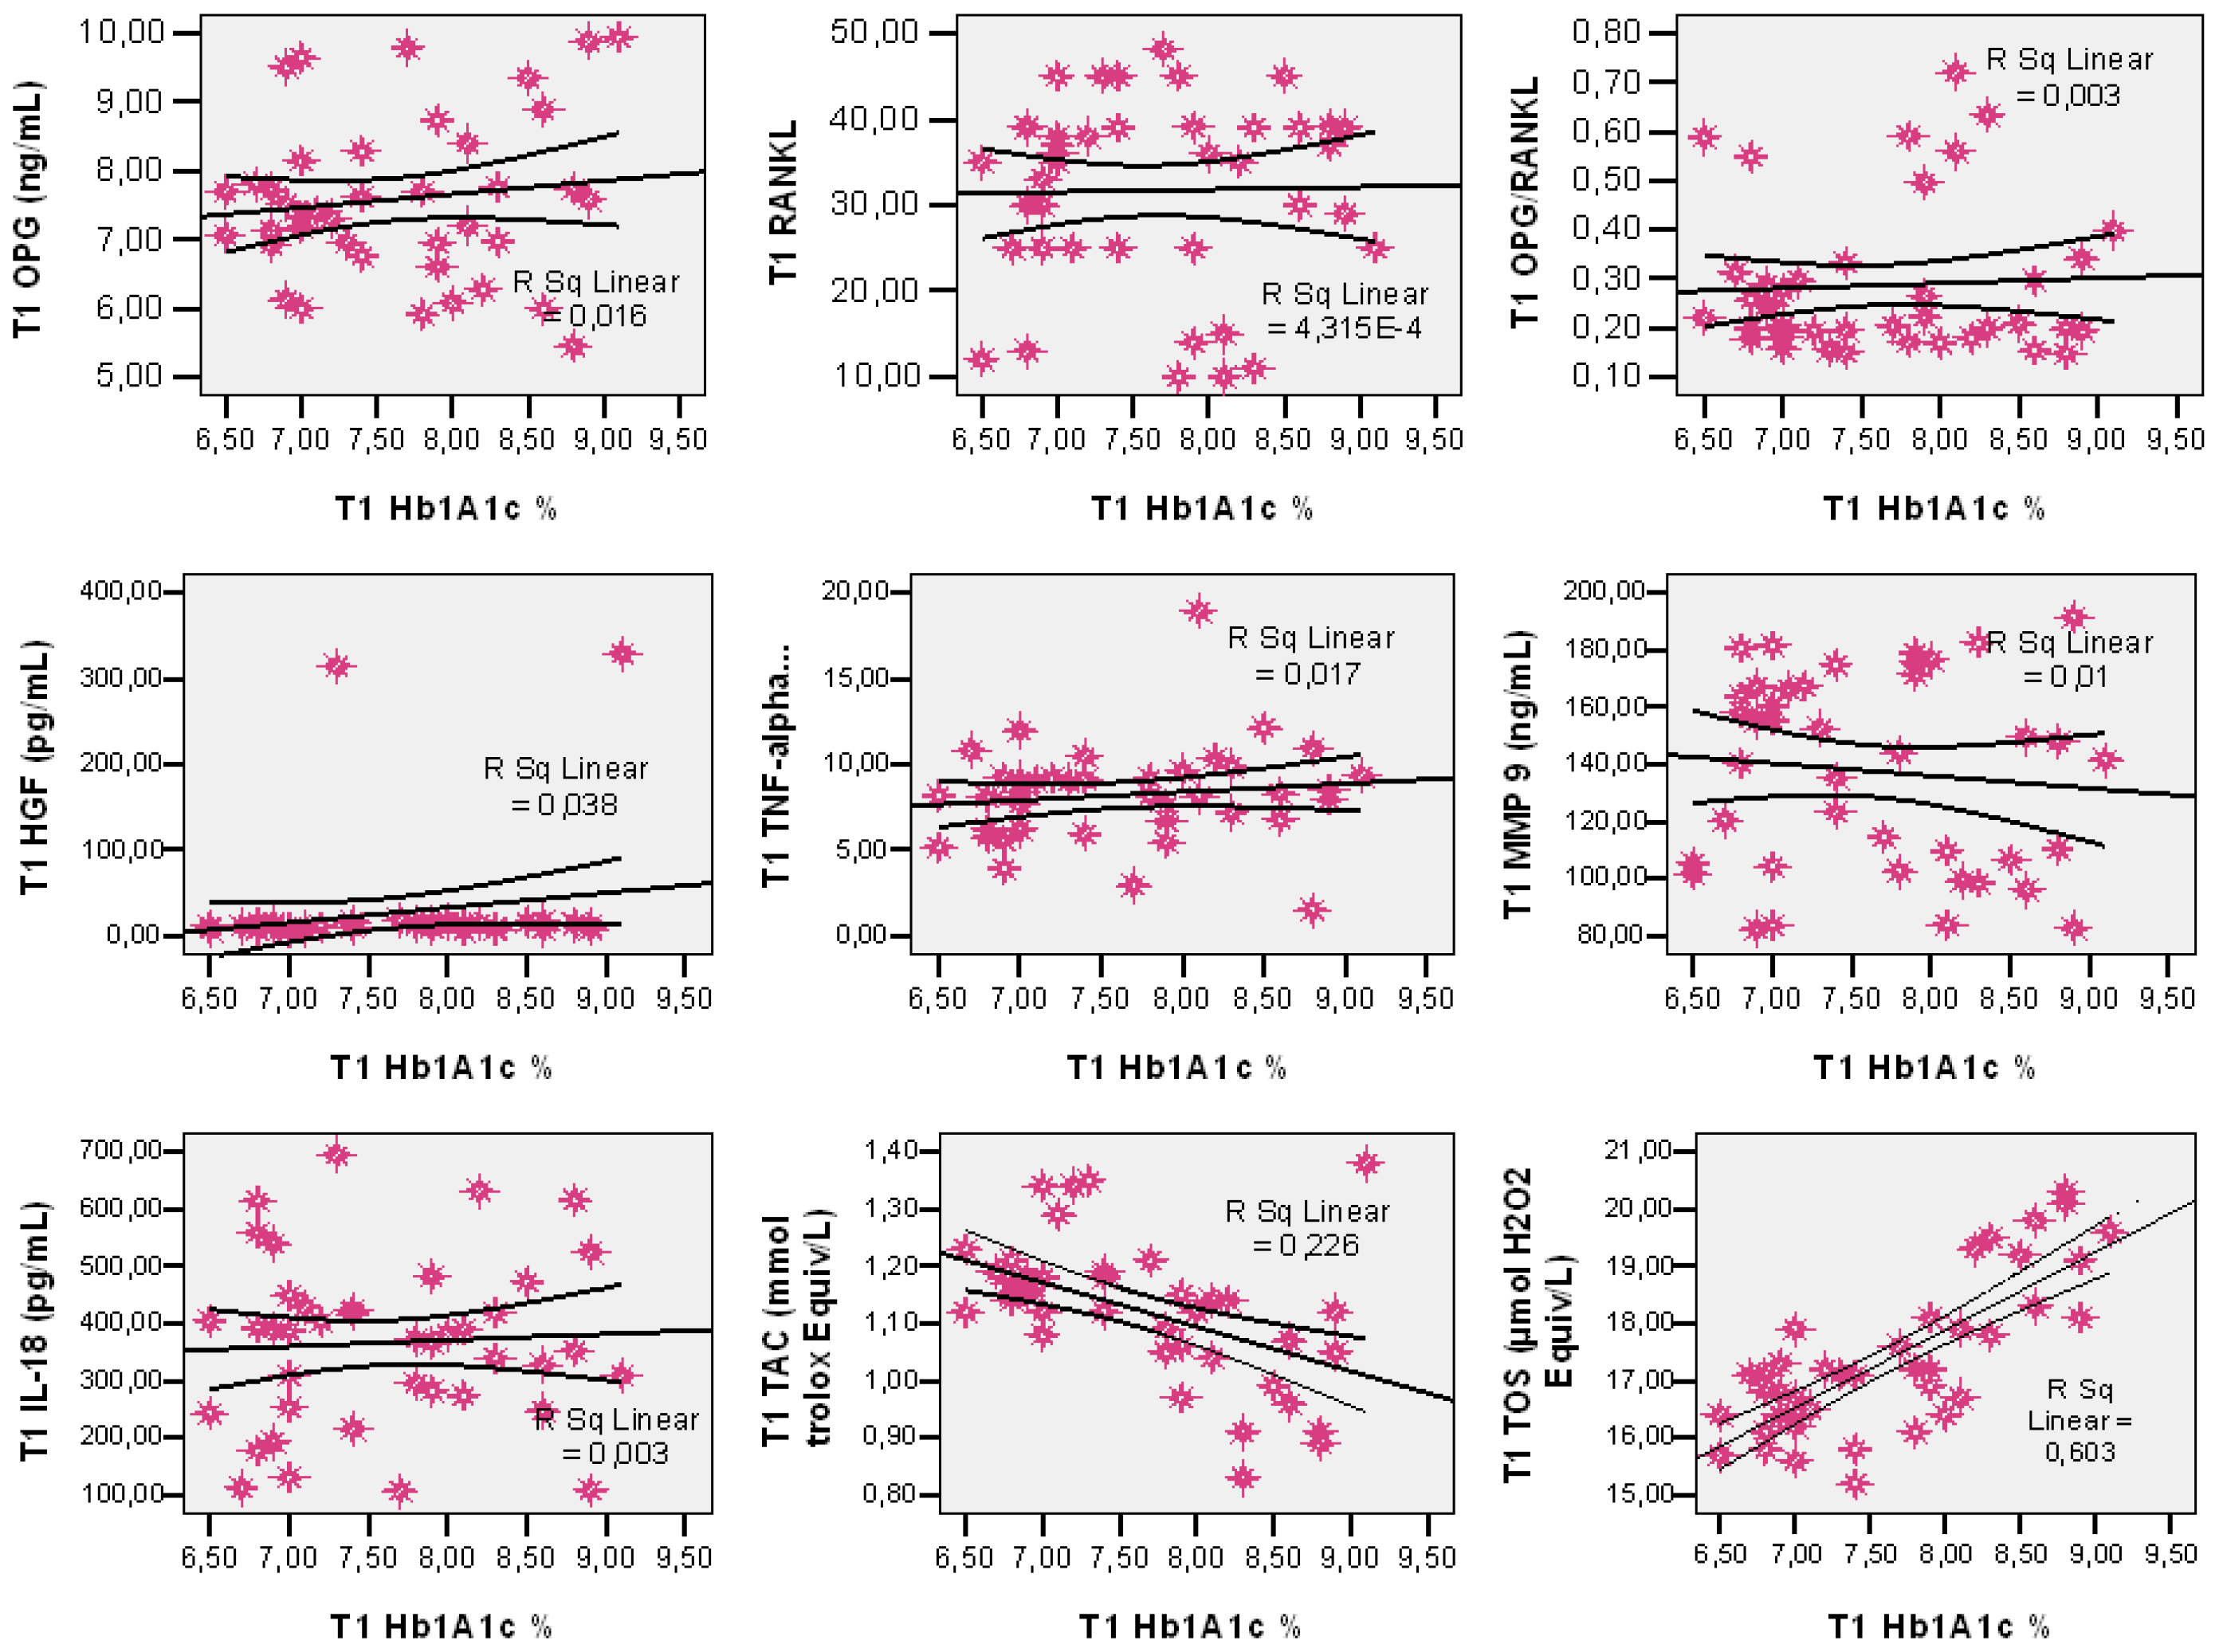
Salivary Markers
- -
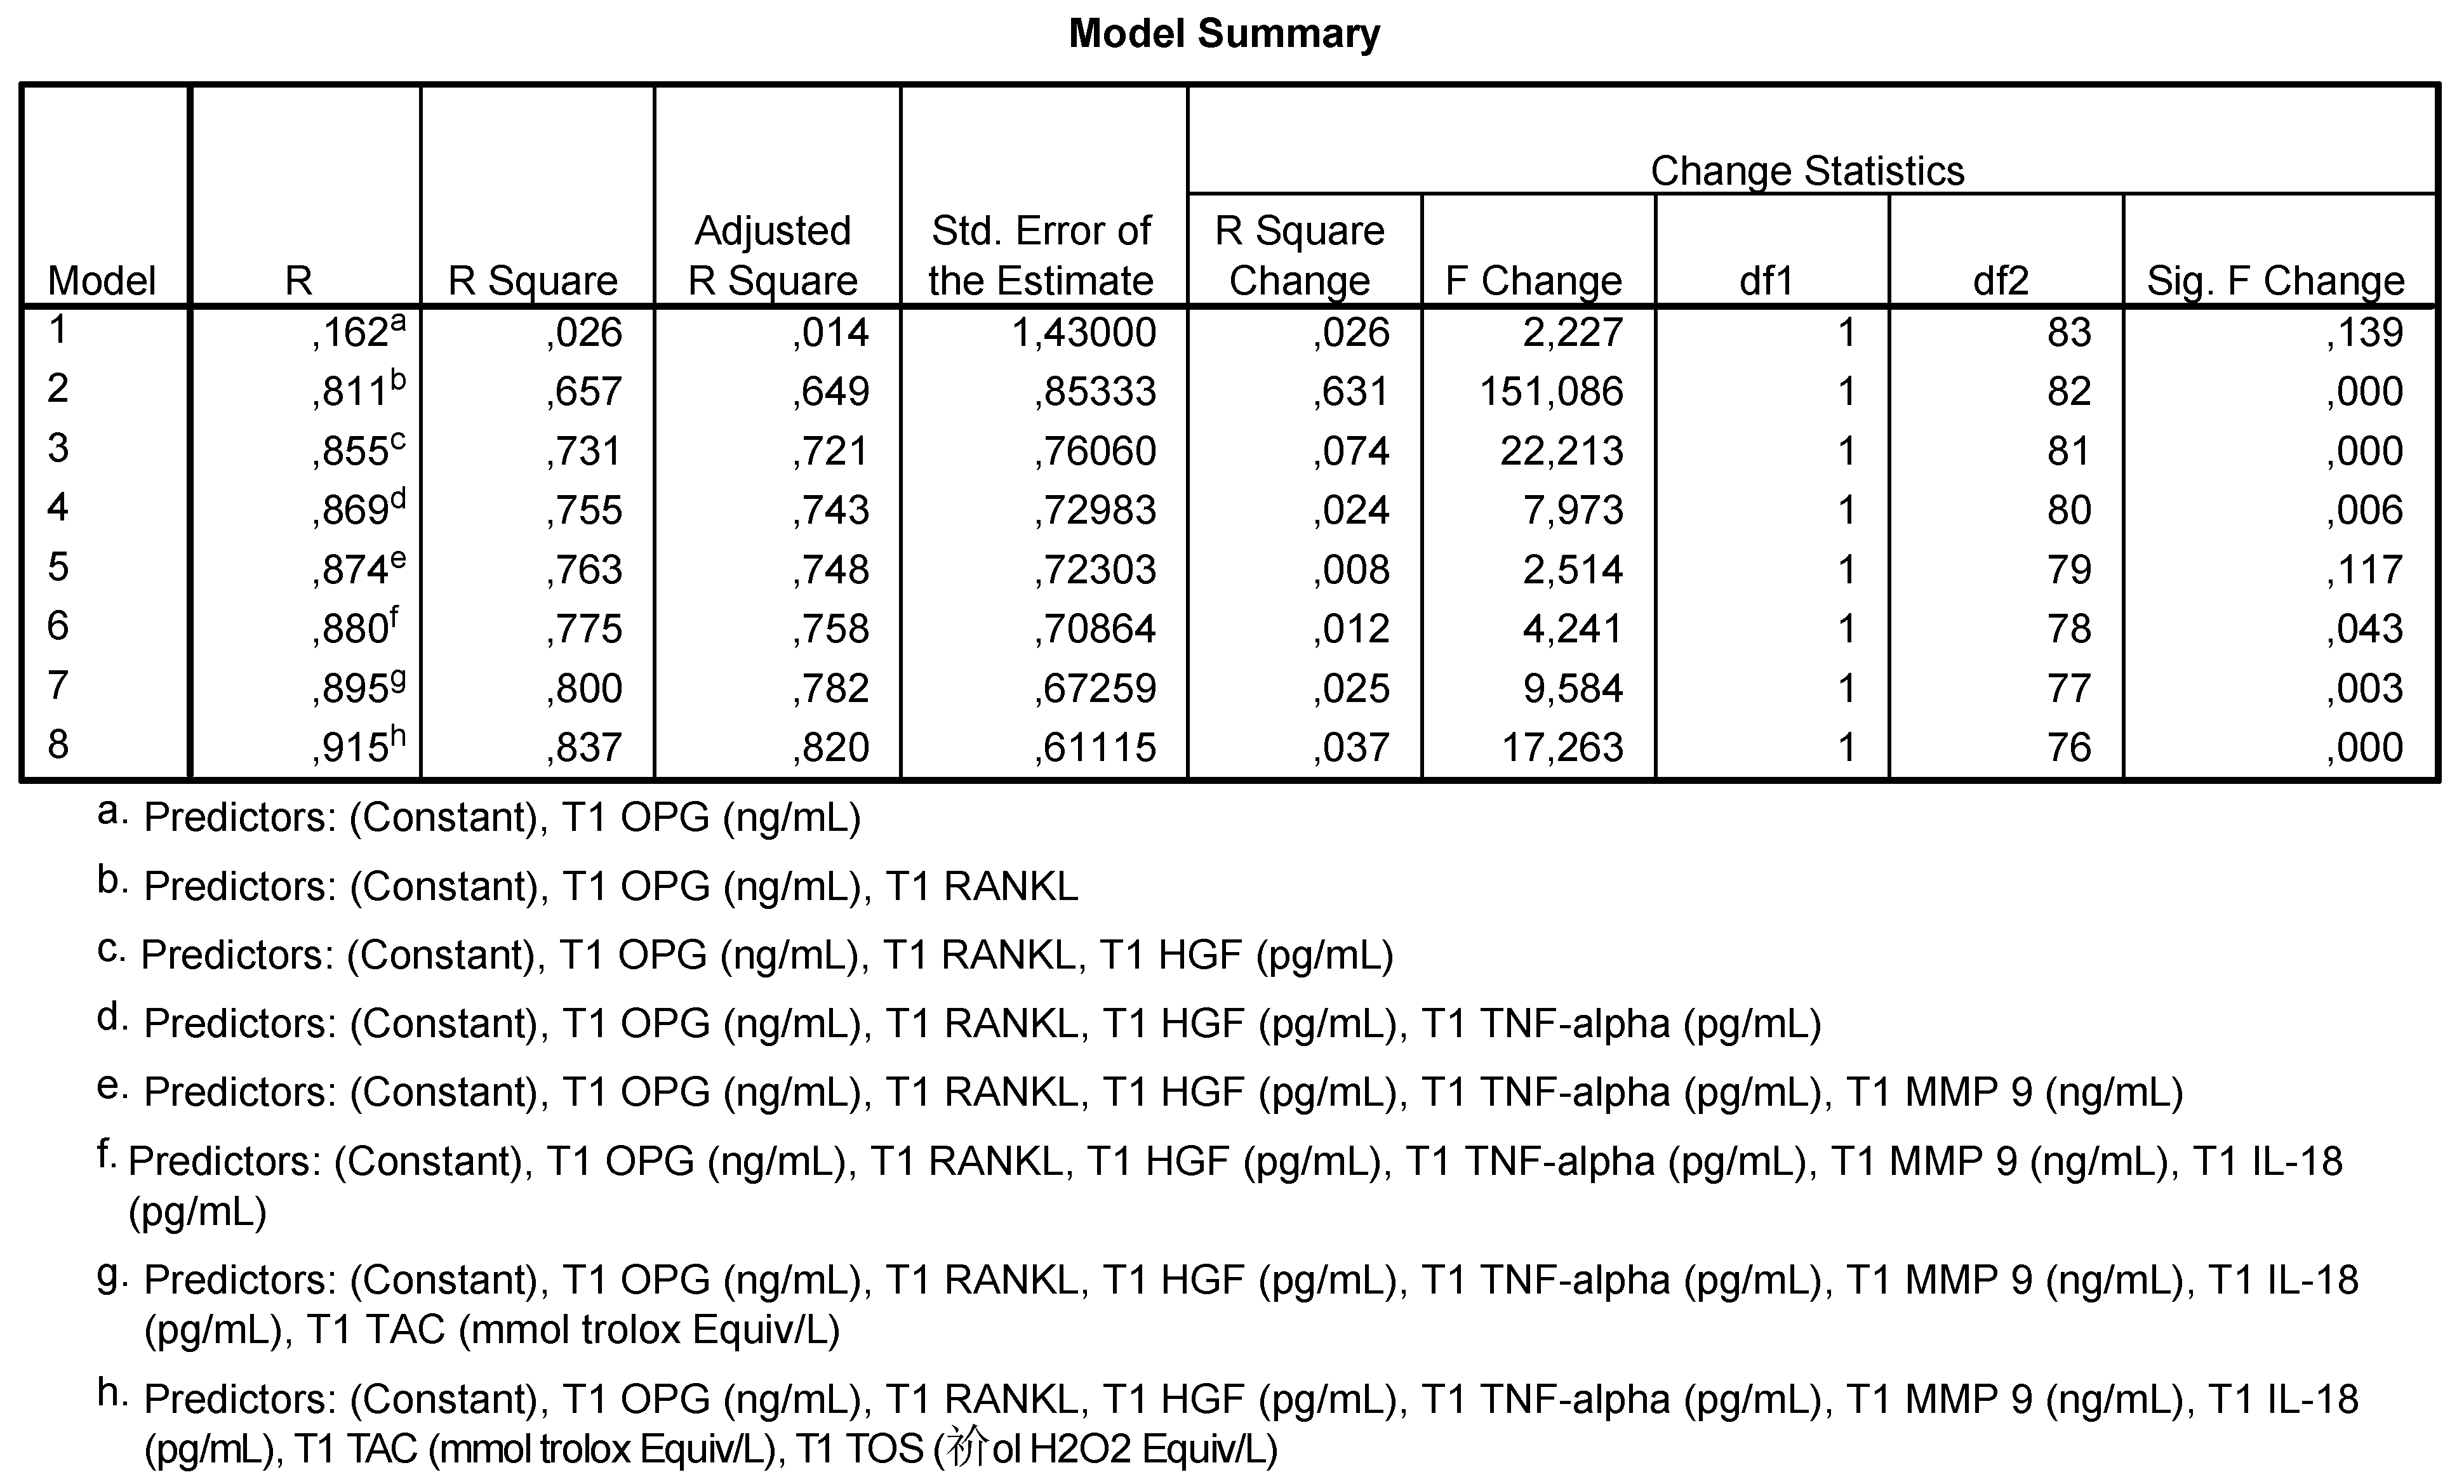
- Model 2 shows that 65.7% of the HbA1c values are correlated to OPG and RANKL levels;
- -
- Model 3 shows that 73.1% of HbA1c values are correlated to OPG, RANKL and HGF levels;
- -
- Model 4 shows that 75.5% of HbA1c values are correlated to OPG, RANKL, HGF and TNF-α levels;
- -
- Model 5 shows that 77.5% of HbA1c values are correlated to the levels of OPG, RANKL, HGF, TNF-α, MMP-9 and IL-18;
- -
- Model 6 shows that 80% of HbA1c values are correlated to the levels of OPG, RANKL, HGF, TNF-α, MMP-9, IL-18 and TAC;
- -
- Model h shows that 83.7% of HbA1c are correlated to the levels of all analyzed salivary markers.
4. Discussion
5. Conclusions
Author Contributions
Funding
Institutional Review Board Statement
Informed Consent Statement
Data Availability Statement
Acknowledgments
Conflicts of Interest
References
- Araújo, M.G.; da Silva, J.C.; de Mendonça, A.F.; Lindhe, J. Ridge alterations following grafting of fresh extraction sockets in man. A randomized clinical trial. Clin. Oral Implant. Res. 2015, 26, 407–412. [Google Scholar] [CrossRef]
- Chappuis, V.; Araújo, M.G.; Buser, D. Clinical relevance of dimensional bone and soft tissue alterations post-extraction in esthetic sites. Periodontol. 2000 2017, 73, 73–83. [Google Scholar] [CrossRef]
- Micha, R.; Peñalvo, J.L.; Cudhea, F.; Imamura, F.; Rehm, C.D.; Mozaffarian, D. Association between dietary factors and mortality from heart disease, stroke, and type 2 diabetes in the United States. JAMA 2017, 317, 912–924. [Google Scholar] [CrossRef] [PubMed]
- Ziukaite, L.; Slot, D.E.; Van der Weijden, F.A. Prevalence of diabetes mellitus in people clinically diagnosed with periodontitis: A systematic review and meta-analysis of epidemiologic studies. J. Clin. Periodontol. 2018, 45, 650–662. [Google Scholar] [CrossRef] [PubMed]
- Wong, S.; Chin, K.Y.; Suhaimi, F.; Ahmad, F.; Ima-Nirwana, S. The relationship between metabolic syndrome and osteoporosis: A review. Nutrients 2016, 8, 347. [Google Scholar] [CrossRef] [PubMed]
- Rastogi, V.; Kalra, P.; Gowda, M.V. Relationship between Salivary Alpha-2 Macroglobulin and HbA1c among Patients with Type-2 Diabetes Mellitus: A Cross-sectional Study. Indian J. Endocrinol. Metab. 2019, 23, 184. [Google Scholar] [CrossRef] [PubMed]
- Bascones-Martinez, A.; Gonzalez-Febles, J.; Sanz-Esporrin, J. Diabetes and periodontal disease. Review of the literature. Am. J. Dent. 2014, 27, 63–67. [Google Scholar] [CrossRef] [PubMed]
- Yasuda, H. Discovery of the RANKL/RANK/OPG system. J. Bone Metab. 2021, 3, 1–10. [Google Scholar]
- Contaldo, M.; Itro, A.; Lajolo, C.; Gioco, G.; Inchingolo, F.; Serpico, R. Overview on Osteoporosis, Periodontitis and Oral Dysbiosis: The Emerging Role of Oral Microbiota. Appl. Sci. 2020, 10, 6000. [Google Scholar] [CrossRef]
- Imamura, R.; Matsumoto, K. Hepatocyte growth factor in physiology and infectious diseases. Cytokine 2017, 98, 97–106. [Google Scholar] [CrossRef]
- Liu, C.; Feng, X.; Li, Q.; Wang, Y.; Li, Q.; Hua, M. Adiponectin, TNF-α and inflammatory cytokines and risk of type 2 diabetes: A systematic review and meta-analysis. Cytokine 2016, 86, 100–109. [Google Scholar] [CrossRef] [PubMed]
- Ghallab, N.A.; Shaker, O.G. Serum and salivary levels of chemerin and MMP-9 in oral squamous cell carcinoma and oral premalignant lesions. Clin. Oral Investig. 2017, 21, 937–947. [Google Scholar] [CrossRef]
- Vincent, R.R.; Appukuttan, D.; Victor, D.J.; Balasundaram, A. Oxidative stress in chronic periodontitis patients with type II diabetes mellitus. Eur. J. Dent. 2018, 12, 225–231. [Google Scholar] [CrossRef]
- Di Domenico, M.; Pinto, F.; Quagliuolo, L.; Contaldo, M.; Settembre, G.; Romano, A.; Coppola, M.; Ferati, K.; Bexheti-Ferati, A.; Sciarra, A.; et al. The role of oxidative stress and hormones in controlling obesity. Front. Endocrinol 2019, 10, 540. [Google Scholar] [CrossRef] [PubMed]
- Chapple, I.L.; Matthews, J.B. The role of reactive oxygen and antioxidant species in periodontal tissue destruction. Periodontol. 2000 2007, 43, 160–232. [Google Scholar] [CrossRef] [PubMed]
- Erel, O. A new automated colorimetric method for measuring total oxidant status. Clin. Biochem. 2005, 38, 1103–1111. [Google Scholar] [CrossRef]
- Valentini, A.; Cianfarani, M.A.; Federici, M.; Tarantino, U.; Bertoli, A. Osteoprotegerin in diabetic osteopathy. Nutr. Metab. Cardiovasc. Dis. 2020, 30, 55. [Google Scholar] [CrossRef]
- Duarte, P.M.; Neto, J.B.; Casati, M.Z.; Sallum, E.A.; NocitiJr, F.H. Diabetes modulates gene expression in the gingival tissues of patients with chronic periodontitis. Oral Dis. 2007, 13, 594–599. [Google Scholar] [CrossRef] [PubMed]
- Badiger, A.B.; Gowda, T.M.; Chandra, K.; Mehta, D.S. Bilateral interrelationship of diabetes and periodontium. Curr. Diabetes Rev. 2019, 15, 357–362. [Google Scholar] [CrossRef] [PubMed]
- Muratsu, J.; Iwabayashi, M.; Sanada, F.; Taniyama, Y.; Otsu, R.; Rakugi, H.; Morishita, R. Hepatocyte growth factor prevented high-fat diet-induced obesity and improved insulin resistance in mice. Sci. Rep. 2017, 7, 1–7. [Google Scholar] [CrossRef]
- Zayet, G.K. Serum Hepatocytes growth factor in acute and chronic Kidney diseasepatients and its relation to disease activity. J. Adv. Pharm. Res. 2018, 8, 75. [Google Scholar]
- Oliveira, A.G.; Araújo, T.G.; Carvalho, B.D.; Rocha, G.Z.; Santos, A.; Saad, M.J. The role of hepatocyte growth factor (HGF) in insulin resistance and diabetes. Front. Endocrinol. 2018, 9, 503. [Google Scholar] [CrossRef] [PubMed]
- Derosa, G.; Catena, G.; Gaudio, G.; D’Angelo, A.; Maffioli, P. Adipose tissue dysfunction and metabolic disorders: Is it possible to predict who will develop type 2 diabetes mellitus? Role of markers in the progression of diabetes in obese patients (The RESISTIN trial). Cytokine 2020, 127, 154947. [Google Scholar] [CrossRef]
- Tangvarasittichai, S.; Pongthaisong, S.; Tangvarasittichai, O. Tumor necrosis factor-A, interleukin-6, C-reactive protein levels and insulin resistance associated with type 2 diabetes in abdominal obesity women. Indian J. Clin. Biochem. 2016, 31, 68–74. [Google Scholar] [CrossRef] [PubMed]
- Agho, E.T.; Owotade, F.J.; Kolawole, B.A.; Oyetola, E.O.; Adedeji, T.A. Salivary inflammatory biomarkers and glycated haemoglobin among patients with type 2 diabetic mellitus. BMC Oral Health 2021, 21, 1–8. [Google Scholar] [CrossRef] [PubMed]
- Gomes, A.M.; Douglas-de-Oliveira, D.W.; Ferreira, S.D.; Silva, T.A.; Cota, L.O.; Costa, F.O. Periodontal disease, peri-implant disease and levels of salivary biomarkers IL-1β, IL-10, RANK, OPG, MMP-2, TGF-β and TNF-α: Follow-up over 5 years. J. Appl. Oral Sci. 2019, 27. [Google Scholar] [CrossRef]
- Babiuch, K.; Kuśnierz-Cabala, B.; Kęsek, B.; Okoń, K.; Darczuk, D.; Chomyszyn-Gajewska, M. Evaluation of proinflammatory, NF-kappaB dependent cytokines: IL-1α, IL-6, IL-8, and TNF-α in tissue specimens and saliva of patients with oral squamous cell carcinoma and oral potentially malignant disorders. J. Clin. Med. 2020, 9, 867. [Google Scholar] [CrossRef]
- Ramírez-Amador, V.; Zambrano, J.G.; Anaya-Saavedra, G.; Zentella-Dehesa, A.; Irigoyen-Camacho, E.; Meráz-Cruz, N.; Ponce de León-Rosales, S. TNF as marker of oral candidiasis, HSV infection, and mucositis onset during chemotherapy in leukemia patients. Oral Dis. 2017, 23, 941–948. [Google Scholar] [CrossRef]
- Ni, Y.; Ni, L.; Zhuge, F.; Xu, L.; Fu, Z.; Ota, T. Adipose tissue macrophage phenotypes and characteristics: The key to insulin resistance in obesity and metabolic disorders. Obesity 2020, 28, 225–234. [Google Scholar] [CrossRef]
- Wu, W.C.; Lee, W.J.; Lee, T.H.; Chen, S.C.; Chen, C.Y. Do different bariatric surgical procedures influence plasma levels of matrix metalloproteinase-2,-7, and-9 among patients with type 2 diabetes mellitus? World J. Diabetes 2020, 11, 252. [Google Scholar] [CrossRef] [PubMed]
- Zayani, Y.; El Golli, N.; Zidi, W.; Guizani, I.; Boussairi, S.; Aloui, S.; Ayadi, I.; Ftouhi, B.; Feki, M.; Romdhane, N.B.; et al. Inflammations mediators and circulating levels of matrix metalloproteinases: Biomarkers of diabetes in Tunisians metabolic syndrome patients. Cytokine 2016, 86, 47–52. [Google Scholar] [CrossRef] [PubMed]
- Yu, A.P.; Tam, B.T.; Yau, W.Y.; Chan, K.S.; Yu, S.S.; Chung, T.L.; Siu, P.M. Association of endothelin-1 and matrix metallopeptidase-9 with metabolic syndrome in middle-aged and older adults. Diabetol. Metab. Syndr. 2015, 7, 111. [Google Scholar] [CrossRef] [PubMed][Green Version]
- Thorand, B.; Kolb, H.; Baumert, J.; Koenig, W.; Chambless, L.; Meisinger, C.; Illig, T.; Martin, S.; Herder, C. Elevated levels of interleukin-18 predict the development of type 2 diabetes: Results from the MONICA/KORA Augsburg Study, 1984–2002. Diabetes 2005, 54, 2932–2938. [Google Scholar] [CrossRef]
- Mahajani, M.J.; Jadhao, V.A.; Wankhade, P.S.; Samson, E.; Acharya, V.D.; Tekale, P.D. Effect of periodontal therapy on crevicular fluid interleukin-18 level in periodontal health and disease in Central Maharashtra (India) Population. J. Contemp. Dent. Pract. 2017, 18, 1085–1089. [Google Scholar] [CrossRef] [PubMed]
- Sadeghabadi, Z.A.; Abbasalipourkabir, R.; Mohseni, R.; Ziamajidi, N. Investigation of oxidative stress markers and antioxidant enzymes activity in newly diagnosed type 2 diabetes patients and healthy subjects, association with IL-6 level. J. Diabetes Metab. Disord. 2019, 18, 437–443. [Google Scholar] [CrossRef] [PubMed]
- Celec, P. Oxidative stress and antioxidants in the diagnosis and therapy of periodontitis. Front. Physiol. 2017, 8, 1055. [Google Scholar]
- Ahmadi-Motamayel, F.; Goodarzi, M.T.; Jamshidi, Z.; Kebriaei, R. Evaluation of salivary and serum antioxidant and oxidative stress statuses in patients with chronic periodontitis: A case-control study. Front. Physiol. 2017, 8, 189. [Google Scholar] [CrossRef]
- Khan, S.N.; Kumar, S.; Iqbal, S.; Joy, M.T.; Ramaprabha, G. Oxidative stress, antioxidants, and periodontitis: How are they linked. Int. J. Oral Care Res. 2018, 6, 107–112. [Google Scholar]
- Ambati, M.; Rani, K.R.; Reddy, P.V.; Suryaprasanna, J.; Dasari, R.; Gireddy, H. Evaluation of oxidative stress in chronic periodontitis patients following systemic antioxidant supplementation: A clinical and biochemical study. J. Nat. Sci. Biol. Med. 2017, 8, 99. [Google Scholar] [CrossRef]
- Chen, M.; Cai, W.; Zhao, S.; Shi, L.; Chen, Y.; Li, X.; Sun, X.; Mao, Y.; He, B.; Hou, Y.; et al. Oxidative stress-related biomarkers in saliva and gingival crevicular fluid associated with chronic periodontitis: A systematic review and meta-analysis. J. Clin. Periodontol. 2019, 46, 608–622. [Google Scholar] [CrossRef]
- Ghallab, N.A. Diagnostic potential and future directions of biomarkers in gingival crevicular fluid and saliva of periodontal diseases: Review of the current evidence. Arch. Oral Biol. 2018, 87, 115–124. [Google Scholar] [CrossRef] [PubMed]
- Anton, D.M.; Martu, M.A.; Maris, M.; Maftei, G.A.; Sufaru, I.G.; Tatarciuc, D.; Luchian, I.; Ioanid, N.; Martu, S. Study on the Effects of Melatonin on Glycemic Control and Periodontal Parameters in Patients with Type II Diabetes Mellitus and Periodontal Disease. Medicina 2021, 57, 140. [Google Scholar] [CrossRef] [PubMed]
- Fathi, S.; Borzouei, S.; Goodarzi, M.T.; Poorolajal, J.; Ahmadi-Motamayel, F. Evaluation of salivary antioxidants and oxidative stress markers in type 2 diabetes mellitus: A retrospective cohort study. Endocrine Metab. Immune Disord. 2020, 20, 584–590. [Google Scholar] [CrossRef]
- Toczewska, J.; Maciejczyk, M.; Konopka, T.; Zalewska, A. Total Oxidant and Antioxidant Capacity of Gingival Crevicular Fluid and Saliva in Patients with Periodontitis: Review and Clinical Study. Antioxidants 2020, 9, 450. [Google Scholar] [CrossRef]
- Patini, R. Personalized Dentistry: Approaching a New Way for Diagnosis and Treatment of Oral Diseases. J. Pers. Med. 2020, 10, 35. [Google Scholar] [CrossRef] [PubMed]
- Khader, Y.S.; Al Habashneh, R.; Al Malalheh, M.; Bataineh, A. The effect of full-mouth tooth extraction on glycemic control among patients with type 2 diabetes requiring extraction of all remaining teeth: A randomized clinical trial. J. Periodontal. Res. 2010, 45, 741–747. [Google Scholar] [CrossRef]
- Sundar, C.; Ramalingam, S.; Mohan, V.; Pradeepa, R.; Ramakrishnan, M.J. Periodontal therapy as an adjunctive modality for HbA1c reduction in type-2 diabetic patients. J. Educ. Health Promot. 2018, 7, 152. [Google Scholar]
- Hong, I.; Pae, H.C.; Song, Y.W.; Cha, J.K.; Lee, J.S.; Paik, J.W.; Choi, S.H. Oral Fluid Biomarkers for Diagnosing Gingivitis in Human: A Cross-Sectional Study. J. Clin. Med. 2020, 9, 1720. [Google Scholar] [CrossRef]
- Gursoy, U.K.; Könönen, E.; Pussinen, P.J.; Tervahartiala, T.; Hyvärinen, K.; Suominen, A.L.; Uitto, V.J.; Paju, S.; Sorsa, T. Use of host-and bacteria-derived salivary markers in detection of periodontitis: A cumulative approach. Dis. Markers 2011, 30, 299–305. [Google Scholar] [CrossRef] [PubMed]


| Parameters | All Cases (n = 86) | Control Group (n = 45) | Diabetes Mellitus Group (n = 41) | p-Value |
|---|---|---|---|---|
| Age (years), mean ± SD | 52.60 ± 12.65 | 51.02 ± 13.56 | 54.34 ± 11.50 | 0.226 (a) |
| (min–max) | (28–78) | (28–78) | (34–78) | |
| Gender | 0.814 (b) | |||
| Male n(%) | 41 (47.7%) | 22 (48.9%) | 19 (46.3%) | |
| Female n(%) | 45 (52.3%) | 23 (51.1%) | 22 (53.7%) | |
| Area | 0.782 (b) | |||
| Urban | 49 (57.0%) | 25 (55.6%) | 24 (58.5%) | |
| Rural | 37 (43.0%) | 20 (44.4%) | 17 (41.5%) | |
| HbA1c (%), mean ± SD | 4.43 ± 1.65 | 5.01 ± 0.43 | 7.98 ± 0.91 | 0.001 (a) |
| (min–max) | (4.20–9.70) | (4.20–5.80) | (6.70–9.70) | |
| Cause of extraction | 0.019 (c) | |||
| Root rest (carious disease/Periapical lesion) | 26 (30.2%) | 13 (28.9%) | 13 (31.7%) | |
| Periodontal disease | 41 (47.7%) | 18 (40.0%) | 23 (56.1%) | |
| Dental inclusion | 19 (22.1%) | 14 (31.1%) | 5 (12.2%) |
| Parameters | Lot C | Lot DM | |||
|---|---|---|---|---|---|
| T0 | T1 | T0 | T1 | ||
| OPG | Mean | 2.08 | 6.73 | 3.79 (**) | 7.58 (*) |
| Std. Dev. | 1.36 | 2.49 | 0.84 | 1.17 | |
| Paired-Samples t-test (p-values) | 0.001 | 0.001 | |||
| Skewness test | 0.446 | 0.452 | −0.699 | 0.463 | |
| RANKL | Mean | 8.02 | 3.02 | 36.70 (**) | 31.70 (**) |
| Std. Dev. | 2.86 | 2.80 | 10.93 | 10.92 | |
| Paired-Samples t-test (p-values) | 0.001 | 0.045 | |||
| Skewness test | 1.376 | 1.376 | −0.704 | −0.704 | |
| OPG/ RANKL | Mean | 0.29 | 5.47 | 0.12 (**) | 0.29 (**) |
| Std. Dev. | 0.23 | 0.06 | 6.12 | 0.15 | |
| Paired-Samples t-test (p-values) | 0.001 | 0.001 | |||
| Skewness test | 0.833 | 1.610 | 1.938 | 1.465 | |
| HGF | Mean | 211.76 | 874.94 | 13.29 (**) | 26.38 (**) |
| Std. Dev. | 106.24 | 332.29 | 12.10 | 27.78 | |
| Paired-Samples t-test (p-values) | 0.001 | 0.181 | |||
| Skewness test | 0.924 | 1.004 | 5.204 | 4.332 | |
| TNF-α | Mean | 4.81 | 4.57 | 9.69 (**) | 8.28 (**) |
| Std. Dev. | 2.10 | 2.12 | 2.97 | 2.82 | |
| Paired-Samples t-test (p-values) | 0.616 | 0.001 | |||
| Skewness test | 0.021 | 0.442 | 0.168 | 0.901 | |
| MMP-9 | Mean | 91.40 | 70.78 | 160.90 (**) | 137.63 (**) |
| Std. Dev. | 44.82 | 36.88 | 37.21 | 33.90 | |
| Paired-Samples t-test (p-values) | 0.001 | 0.001 | |||
| Skewness test | 0.605 | 0.695 | 1.040 | −0.185 | |
| IL-18 | Mean | 223.36 | 147.23 | 480.25 (**) | 366.57 (**) |
| Std. Dev. | 76.95 | 42.41 | 190.17 | 146.33 | |
| Paired-Samples t-test (p-values) | 0.001 | 0.001 | |||
| Skewness test | 0.110 | 0.456 | −0.117 | 0.151 | |
| TOS | Mean | 15.40 | 13.51 | 18.92 (**) | 17.38 (**) |
| Std. Dev. | 2.62 | 2.16 | 1.75 | 1.33 | |
| Paired-Samples t-test (p-values) | 0.001 | 0.001 | |||
| Skewness test | −0.268 | −0.017 | 0.915 | 0.672 | |
| TAC | Mean | 0.83 | 1.12 | 0.73 (**) | 1.12 (ns) |
| Std. Dev. | 0.19 | 0.13 | 0.11 | 0.12 | |
| Paired-Samples t-test (p-values) | 0.001 | 0.001 | |||
| Skewness test | 0.645 | −0.151 | 0.739 | −0.163 | |
| HbA1c | Mean | 5.01 | 5.00 | 7.98 (**) | 7.62 (**) |
| Std. Dev. | 0.43 | 0.29 | 0.91 | 0.76 | |
| Paired-Samples t-test (p-values) | 0.697 | 0.050 | |||
| Skewness test | 0.121 | −0.404 | 0.351 | 0.340 | |
| % normal values | 91.1 | 100.0 | - | - | |
| % prediabetes | 8.9 | - | - | - | |
| % DM | - | - | 100.0 | 100.0 | |
| % uncontrolled DM | - | - | 22.0 | 2.4 | |
| Salivary Parameters | Cut off | Se | Sp | AUC | Std. Error | p | Confidence Interval 95% |
|---|---|---|---|---|---|---|---|
| OPG (ng/mL) | 2.77 | 84.6% | 65.9% | 0.833 | 0.044 | 0.001 | 0.747–0.920 |
| RANKL | 15 | 99.0% | 97.6% | 0.999 | 0.001 | 0.001 | 0.996–1.002 |
| OPG/RANKL | - | - | - | 0.204 | 0.052 | 0.001 | 0.103–0.305 |
| HGF (pg/mL) | - | - | - | 0.001 | 0.001 | 0.001 | 0.001–0.003 |
| TNF-α (pg/mL) | 6.02 | 92.5% | 65.9% | 0.907 | 0.032 | 0.001 | 0.844–0.969 |
| MMP-9 (ng/mL) | 120 | 92.3% | 80.5% | 0.899 | 0.037 | 0.001 | 0.826–0.972 |
| IL-18 (pg/mL) | 198 | 92.3% | 54.0% | 0.901 | 0.039 | 0.001 | 0.825–0.977 |
| TAC (mmol trolox Equiv/L) | - | - | - | 0.339 | 0.061 | 0.013 | 0.219–0.458 |
| TOS (µmol H2O2 Equiv/L) | 17.5 | 87.2% | 75.6% | 0.876 | 0.039 | 0.001 | 0.800–0.951 |
Publisher’s Note: MDPI stays neutral with regard to jurisdictional claims in published maps and institutional affiliations. |
© 2021 by the authors. Licensee MDPI, Basel, Switzerland. This article is an open access article distributed under the terms and conditions of the Creative Commons Attribution (CC BY) license (https://creativecommons.org/licenses/by/4.0/).
Share and Cite
Maftei, G.-A.; Martu, M.-A.; Martu, M.-C.; Popescu, D.; Surlin, P.; Tatarciuc, D.; Popa, C.; Foia, L.-G. Correlations between Salivary Immuno-Biochemical Markers and HbA1c in Type 2 Diabetes Subjects before and after Dental Extraction. Antioxidants 2021, 10, 1741. https://doi.org/10.3390/antiox10111741
Maftei G-A, Martu M-A, Martu M-C, Popescu D, Surlin P, Tatarciuc D, Popa C, Foia L-G. Correlations between Salivary Immuno-Biochemical Markers and HbA1c in Type 2 Diabetes Subjects before and after Dental Extraction. Antioxidants. 2021; 10(11):1741. https://doi.org/10.3390/antiox10111741
Chicago/Turabian StyleMaftei, George-Alexandru, Maria-Alexandra Martu, Marius-Cristian Martu, Dora Popescu, Petra Surlin, Diana Tatarciuc, Cristina Popa, and Liliana-Georgeta Foia. 2021. "Correlations between Salivary Immuno-Biochemical Markers and HbA1c in Type 2 Diabetes Subjects before and after Dental Extraction" Antioxidants 10, no. 11: 1741. https://doi.org/10.3390/antiox10111741
APA StyleMaftei, G.-A., Martu, M.-A., Martu, M.-C., Popescu, D., Surlin, P., Tatarciuc, D., Popa, C., & Foia, L.-G. (2021). Correlations between Salivary Immuno-Biochemical Markers and HbA1c in Type 2 Diabetes Subjects before and after Dental Extraction. Antioxidants, 10(11), 1741. https://doi.org/10.3390/antiox10111741