1. Introduction
After the cell culture medium is treated with low temperature plasma (LTP) jet (atmospheric pressure plasma jet, APPJ) [
1] for a period of time, the ions, electrons, neutral particles (atoms, gas molecules, etc.), ultraviolet rays, RONS and other substances react with the culture medium [
2] and produce plasma-activated medium (PAM). PAM can increase the level of oxidative stress in cells and thus promote or inhibit the proliferation of cells. Related studies have shown that short-term PAM treatment can promote the proliferation of fibroblasts [
3], induce osteoblast differentiation [
4], inhibit over 20 kinds of cancer cells cultured in vitro [
5], including melanoma cells [
6], prostate cancer cells [
7], glioma cells [
8], lymphoma cells [
9], and liver cancer cells [
10]. The main mechanisms of action include inducing apoptosis and necrosis of tumor cells, inhibiting proliferation signaling pathway, damaging DNA structure, and affecting migration and adhesion of tumor cells [
11]. Studies have also shown that under the same treatment mode and time, when LTP simultaneously treats normal cells and tumor cells, it inhibits the activity of tumor cells, but significantly reduces the invasion, metastasis and adhesion of tumor cells, and has no obvious damage to normal cells [
12,
13]. What’s more, PAM can be kept stable for several days under low temperature (−80 °C), dark and sealed storage, and the concentration of active ingredients remains unchanged [
14].
Angiogenesis [
15] refers to the process of growing new capillaries from existing blood vessels, which is an indispensable link in physiological phenomena such as growth and development, inflammatory response, wound healing, and also an important process of tumor development and progression of angioproliferative diseases. Angiogenesis is a complex and highly regulated process mediated by the expressions of a series of closely regulated pro-angiogenic and anti-angiogenic factors and their receptors on various vascular components (such as endothelial cells, pericellular cells) and stromal components [
16]. Studies have shown that in the early stage of tumor growth, when the tumor diameter is less than 1 mm, there is no angiogenesis, and nutrients are mainly absorbed by diffuse oxygen supply. However, when the tumor volume increases to 2–3 mm
3, tumor cells are induced by hypoxia or oncogenes, angiogenesis factors are activated [
17], and the angiogenesis process is initiated. Tumor angiogenesis process is chaotic and endothelial structure is incomplete. New blood vessels supply oxygen and nutrients necessary for tumor proliferation, which provide necessary conditions for tumor proliferation, growth, metastasis and diffusion [
18]. Therefore, angiogenesis is considered one of the indicators of tumor invasion, metastasis and poor clinical prognosis [
19,
20].
Hypoxia conditions, specific and non-specific acting factors, and some cytokines, chemokines, active oxygen and active nitrogen substances can affect the formation of neovascularization [
16]. As a product of cellular aerobic metabolism [
21], RONS are an indispensable and important factor in the regulation of angiogenesis. As an intracellular signaling molecule, low-concentration reactive oxygen species (ROS) that does not exceed the level of cellular oxidative stress, can participate in the regulation of cell proliferation, promote cell migration and differentiation, stimulate the expression of VEGF in endothelial cells [
22], effectively promote tissue regeneration, and increase the number of generated blood vessels [
23]. In contrast, a large number of RONS-mediated chain reactions have a strong damaging effect, damaging intracellular lipids and protein macromolecules, causing endothelial cell apoptosis, and inhibiting angiogenesis. LTP, as a diverse supplier of RONS, has a significant impact on angiogenesis. Domestic and foreign scholars have selected different plasma discharge devices to study the direct effects of different cellular angiogenesis. For example, pinhole spark discharge (PHD) plasma treatment could increase the content of NO in porcine aortic endothelial cells [
24]. Various RONS such as ·OH, NO and H
2O
2 resulting from DBD plasma treatment were the main cause of endothelial cell proliferation and migration and could accelerate wound healing [
25]. Miller V, et al. [
26] used microsecond pulsed DBD plasma to generate RONS on the surface of the treated material to stimulate the production of VEGF-A, MMP-9 and chemokine CXCL-1 in mice, thereby inducing angiogenesis of the mouse aortic ring in vitro without damage to the mouse body surface. Kim DW, et al. [
27] found that plasma effect could penetrate the wound surface, induce angiogenesis around the wound surface, and promote wound healing. Thi MHN, et al. [
28] used non-thermal N
2/Ar microplasma to increase the total RONS concentration in the treated tissue lysis fluid and shorten the healing time of mouse burn wounds, suggesting that RONS could affect the process of angiogenesis and epithelization.
So far, the effects of PAM prepared by APPJ on cell angiogenesis have not been reported, and the specific effects and exact mechanism of PAM on angiogenesis need to be further studied. We selected HUVECs (passage 5) as the research model to explore the effects of PAM on angiogenesis and the related mechanism, hoping to lay a theoretical foundation for the application of PAM in promoting wound healing and inhibiting tumor angiogenesis. First, MTT assay and cell cycle assay were performed to determine the effects of PAM on HUVECs viability. Second, the effects of PAM on angiogenesis and cell migration and adhesion were detected with angiogenesis experiment, cell migration experiment and cell adhesion experiment. Next, the concentrations of VEGF and bFGF secreted by HUVECs in the supernatant were determined with ELISA. The relative expression of VEGFR-2 and phosphorylation of MEK were determined with Western blotting. Finally, the content of RONS in cells incubated with PAM was determined.
2. Materials and Methods
2.1. Generation of LTP and Preparation of PAM
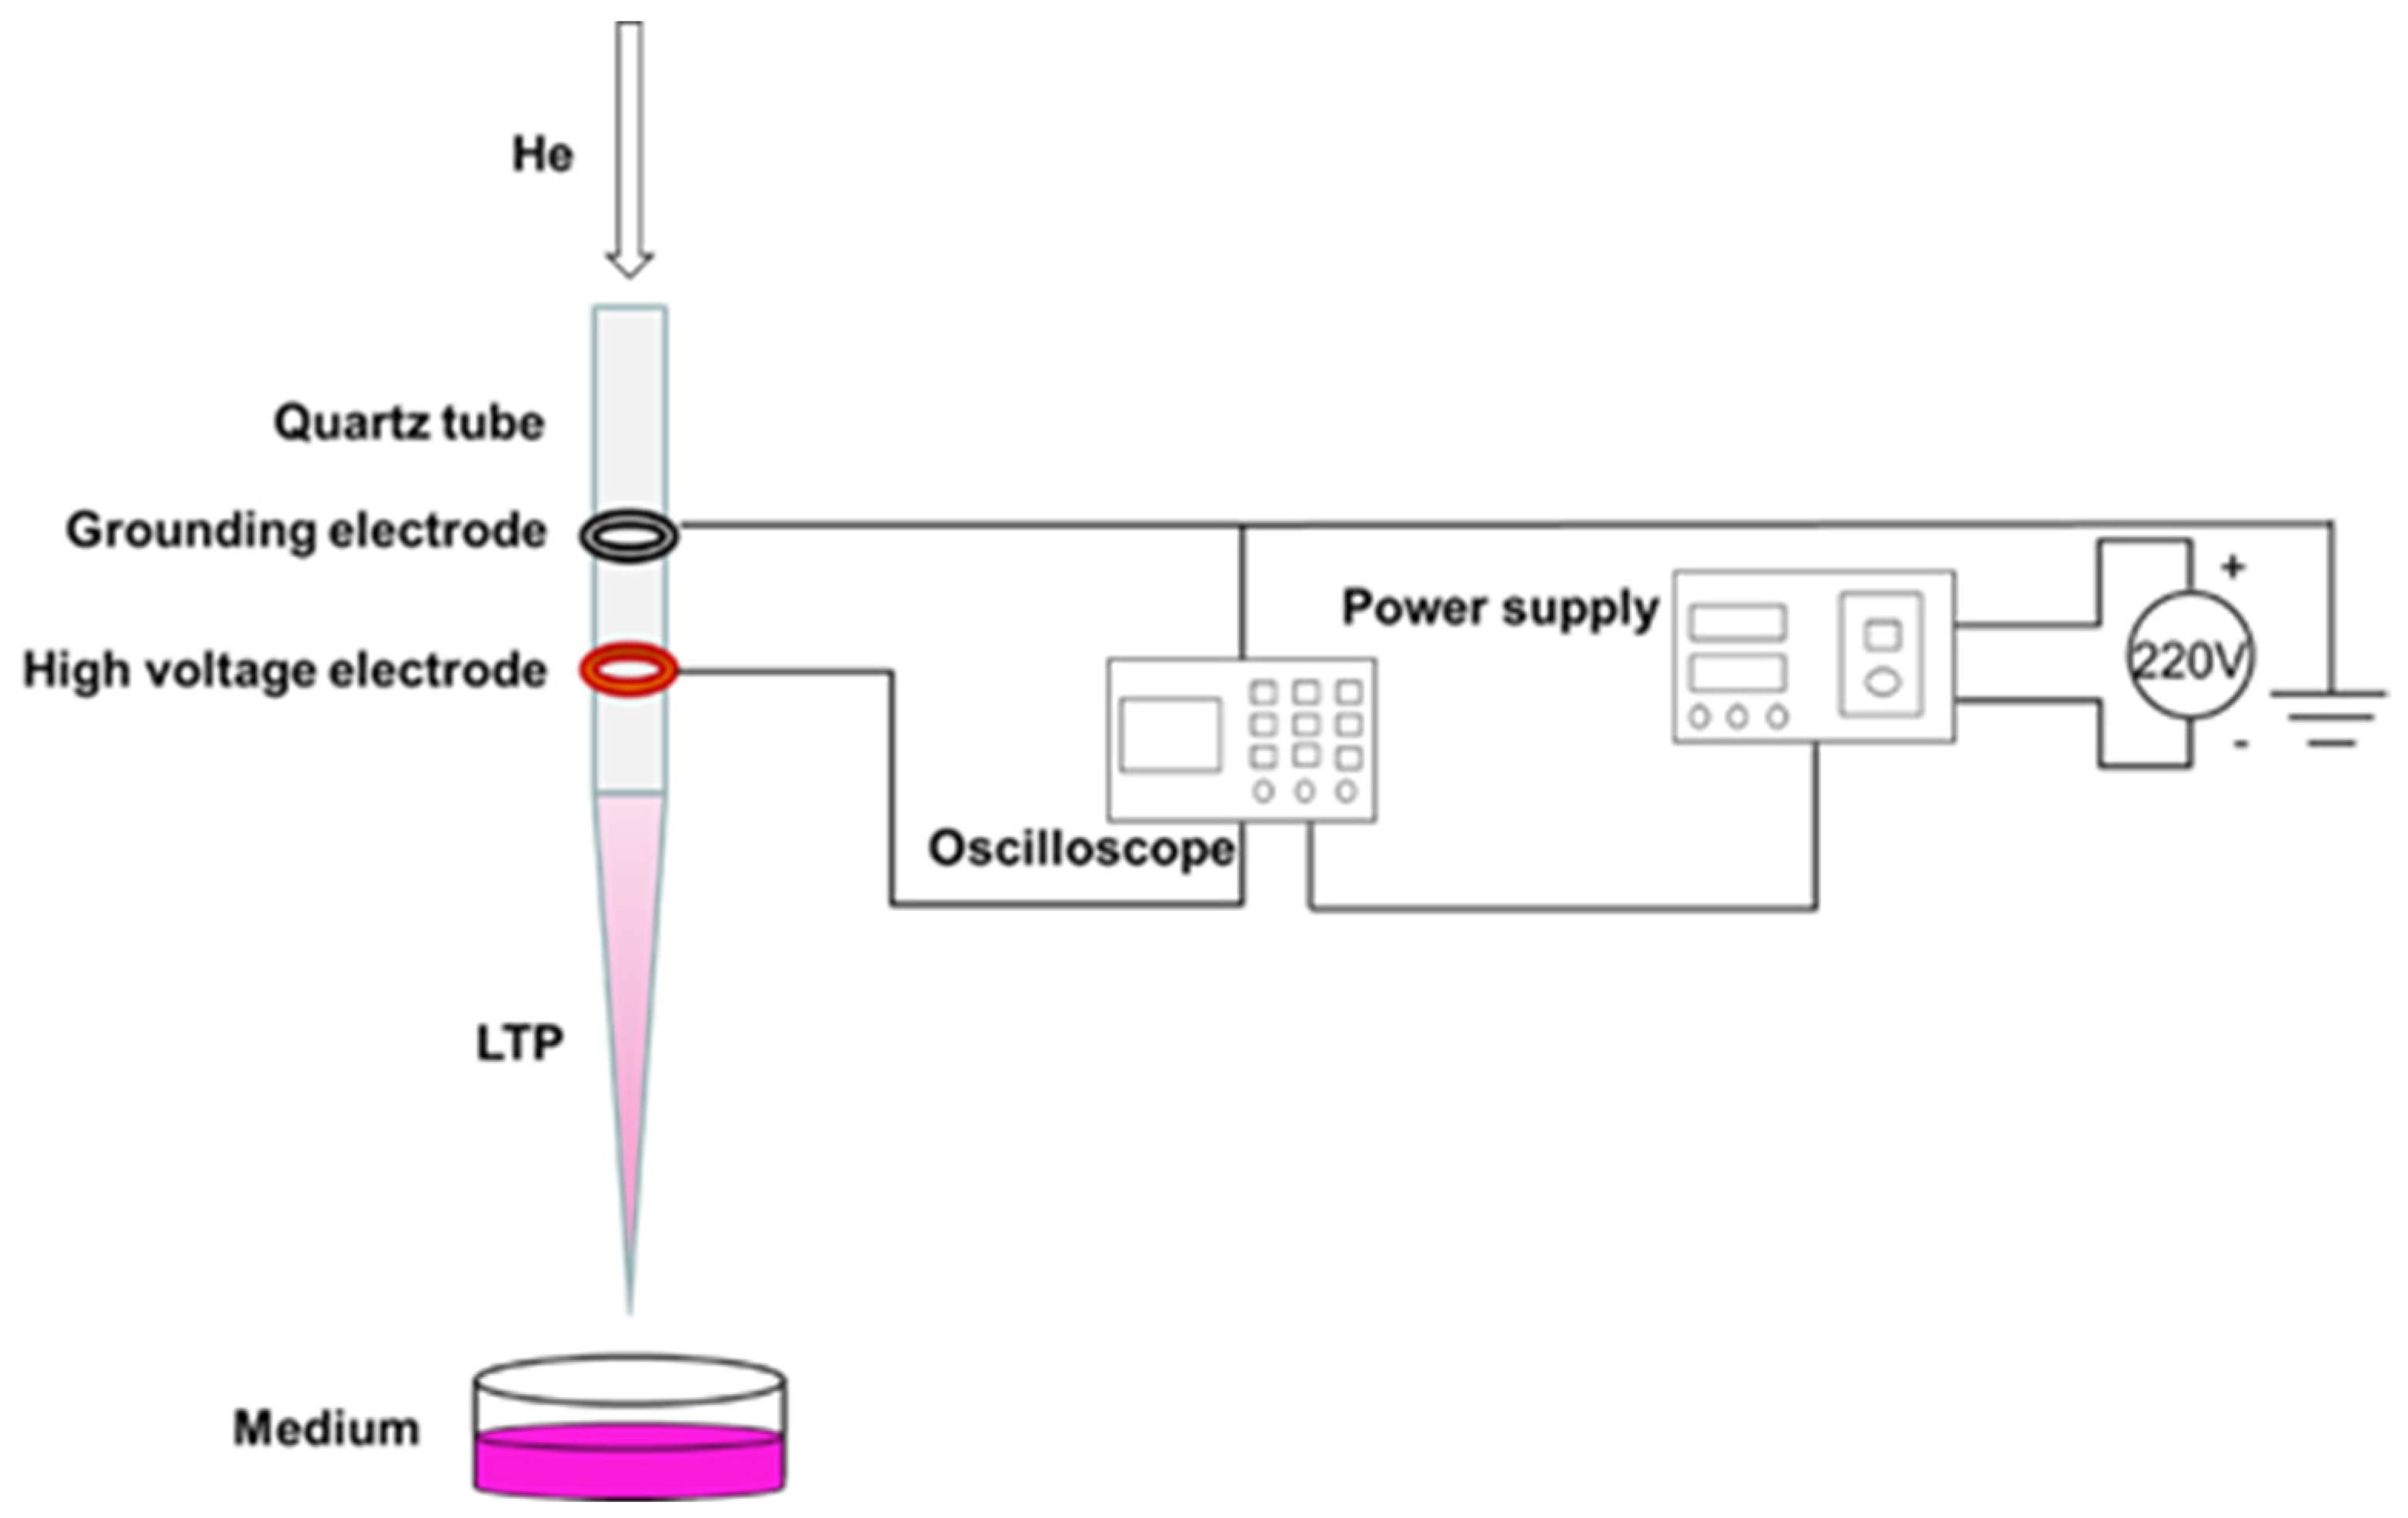
In this experiment, the coaxial double-ring electrode structure was used to produce APPJ (
Figure 1). The hollow quartz glass was made into a hollow tubular structure (inner diameter 2.0 mm, outer diameter 4.0 mm) for blowing air flow. Copper skin with width of 10.0 mm and thickness of 0.5 mm was made into a high voltage electrode and convolved with an electric electrode on the jet pipe. The distance between them was 20.0 mm, and the lower edge of the high voltage electrode was 10.0 mm from the pipe mouth. The working gas was high purity helium, the discharge waveform was sine wave, the discharge frequency was fixed at 39.5 kHz, and the distance from the bottom edge of the quartz glass tube to the surface of the culture medium was 25.0 mm. A pipette was used to extract 1 mL of culture medium into a sterile 24-well plate, and the LTP discharge device was turned on to adjust the gas flow rate to 1.0 L/min and the peak voltage to 10.0 kV. When the discharge was relatively stable, the 24-well plate containing cell culture medium was placed under the jet tube and timing was started. In this study, we mainly investigated the effects of PAM on the angiogenesis of HUVECs. As a decrease of PAM-induced cell viability could reduce the abilities of angiogenesis, the treatment time and group were set as 0 s (control group), 15 s, 30 s, 45 s, 60 s and 75 s according to the results of the pre-experiment.
2.2. Culture and Treatment of HUVECs
Human umbilical vein endothelial cells (HUVECs) were donated by the Cancer Institute of Medical Science Center of Xi’an Jiaotong University. 10% fetal bovine serum (Biological Industries, Kibbutz Beit-Haemek, Israel) with 1% penicillin (100 U/mL)-streptomycin (100 μg/mL) mixed solution (Gibco, Waltham, MA, USA) was cultured in DMEM/F12 culture medium (Procell, Wuhan, China), and placed in an incubator at constant temperature with 5% CO2 and saturated humidity at 37 °C. When the bottom of the flask was covered with cells, the passage was carried out.
The cells were digested with 0.25% trypsin (Gibco, Waltham, MA, USA) for passage at the ratio of 1:3, and the solution was changed on the second day after passage. Cells in logarithmic growth phase and in good growth state were selected for subsequent experiments. HUVECs in logarithmic growth phase were digested and collected, and the cell density was adjusted to 2 × 10⁴ cells/mL. The cells were inoculated in a sterile 24-well plate with 1 mL cell suspension per well. The number of cells in each well was 2 × 10⁴. After the cells were attached to the wall, they were cultured with 0 s (control group without PAM), 15 s, 30 s, 45 s, 60 s and 75 s-PAM for 24 h.
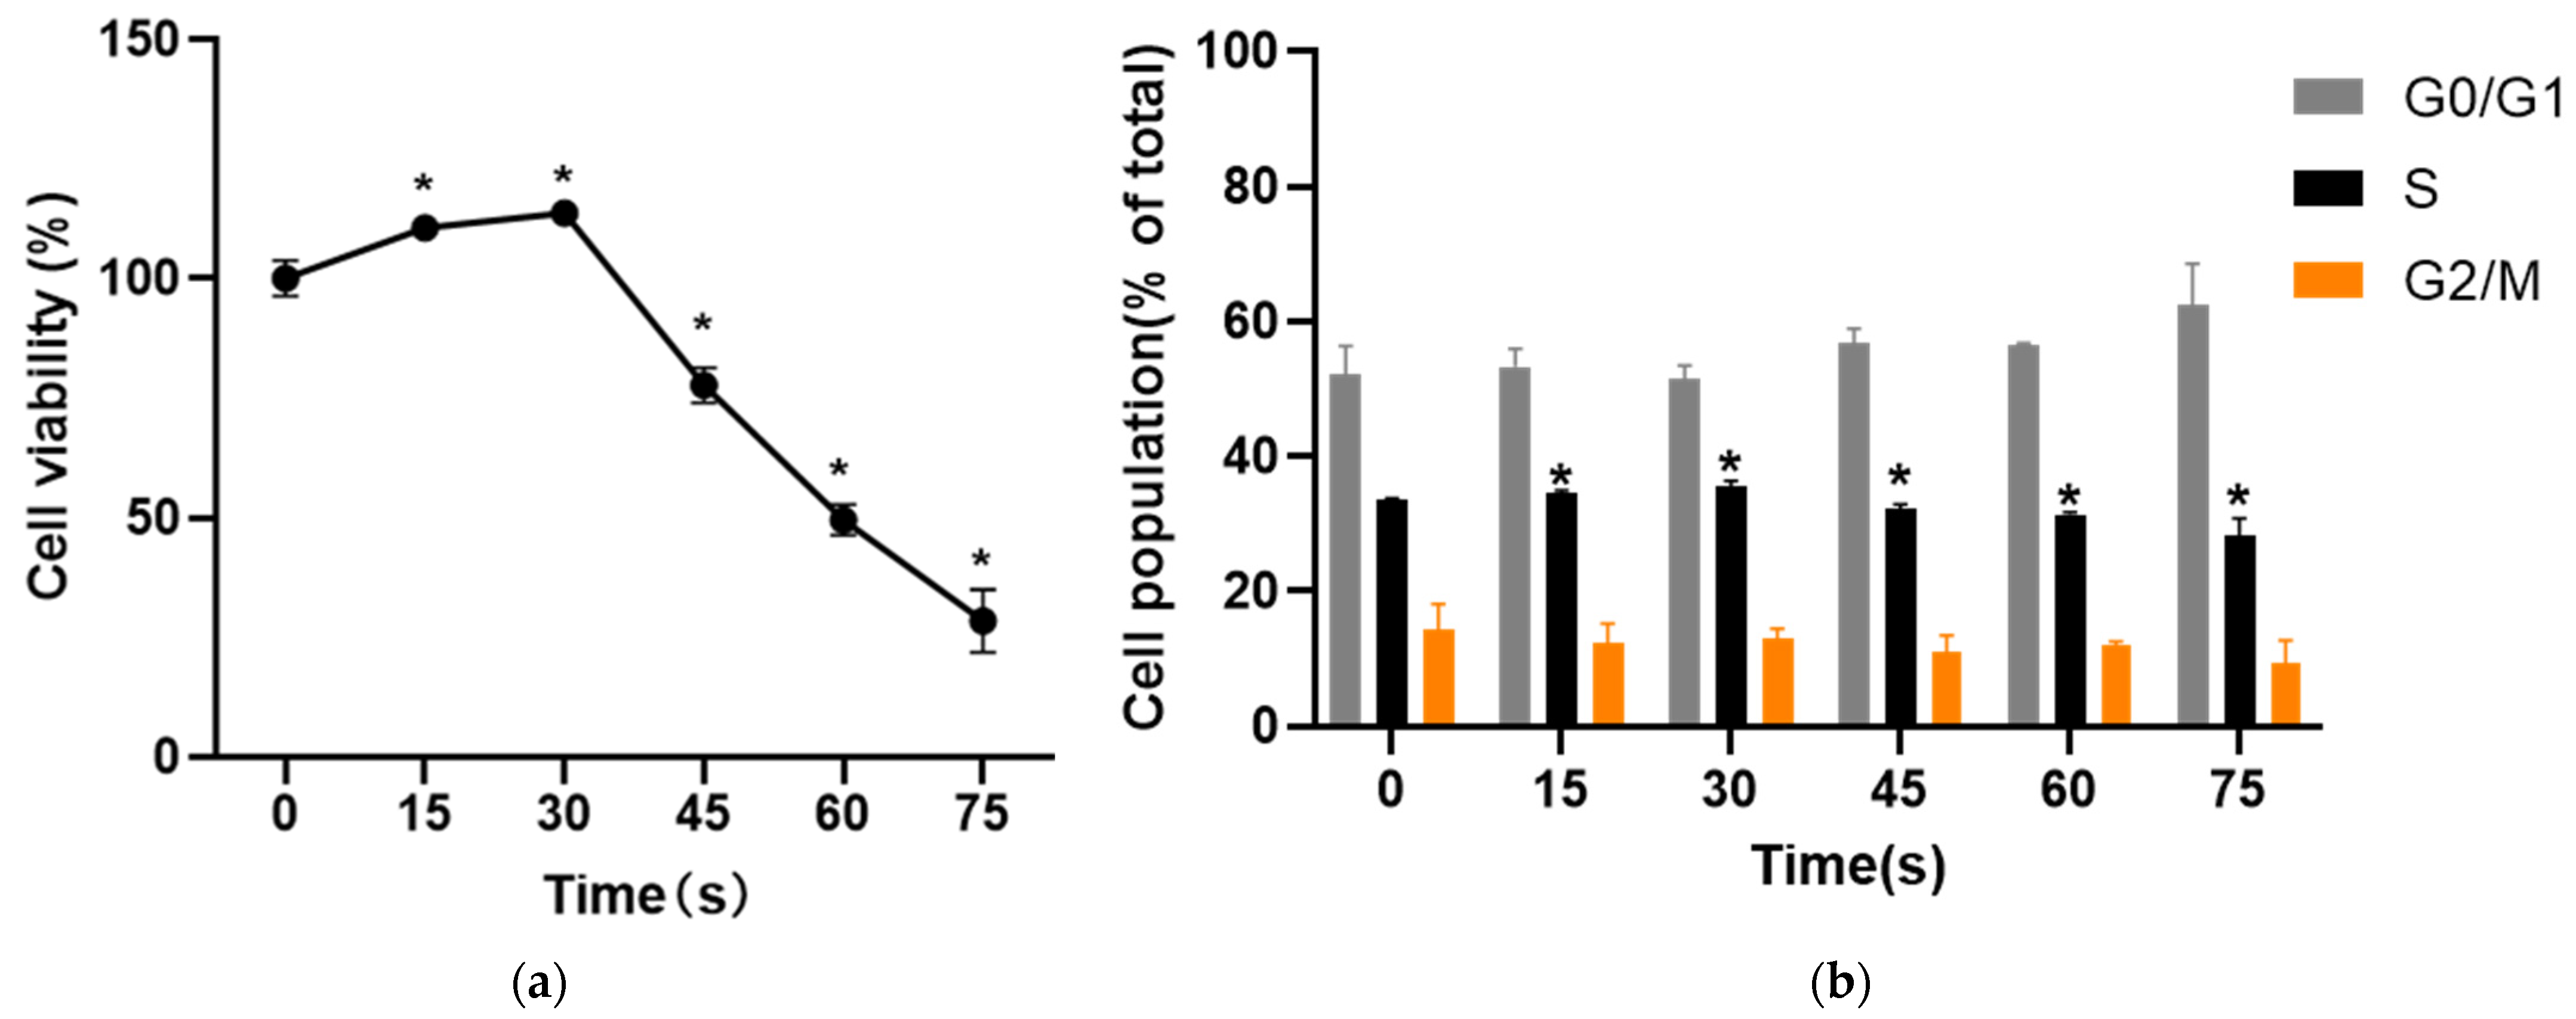
2.3. Detection of Cell Viability
After the cells were digested with trypsinase, they were suspended and inoculated in a 96-well plate overnight. After the PAM was obtained by LTP treatment for different time, the cells were cultured with PAM for 24 h. The old culture medium was discarded 4 h before the cessation of culture, and 20 μL 5 mg/mL of 3-(4,5-dimethylthiazole-2)-2,5-diphenyl tetrazolium bromide] (MTT, Solarbio, Beijing, China) was added in the dark. After incubation in the incubator for 4 h, the liquid in the hole was gently sucked out with a syringe. After that,150 μL of DMSO [dimethyl sulfoxide, Solarbio, Beijing, China)] was added to each well, and the plate was placed in a microplate analyzer and shaken for 5 min to fully dissolve the crystals. The wavelength was set at 490 nm. The optical density (OD) value was obtained and the cell viability was calculated indirectly. Each group was set with 3 parallel holes, and the results were statistically analyzed. The formula was:
2.4. Detection of Cell Cycle
After trypsin digested the cells treated with PAM for 24 h, the cells were centrifuged, the supernatant was carefully absorbed and about 1 mL of precooled PBS was added in an ice bath. The cells were resuspended, centrifuged, and washed repeatedly for 3 times. 4 mL of 95% ethanol precooled in an ice bath was taken as low-speed vortex oscillation cell suspension, fixed and centrifuged, and 5 mL of PBS precooled in an ice bath was added to re-suspend the cells twice. The supernatant was sucked out and the bottom of the centrifuge tube was gently struck to disperse the cells appropriately. 0.5 mL of PI staining solution (KeyGEN, Nanjing, Jiangsu, China) was added to each tube of cell samples, and the cells were suspended slowly and fully. After 30 min in a warm bath at 37 °C in the dark, the cells were stored in an ice bath in the dark. Within 24 h after staining, red fluorescence was detected with flow cytometry at an excitation wavelength of 488 nm. Light scattering was also detected. Modfit software was used to analyze the cell DNA content and light scattering analysis, and the data were analyzed.
2.5. Detection of Angiogenesis
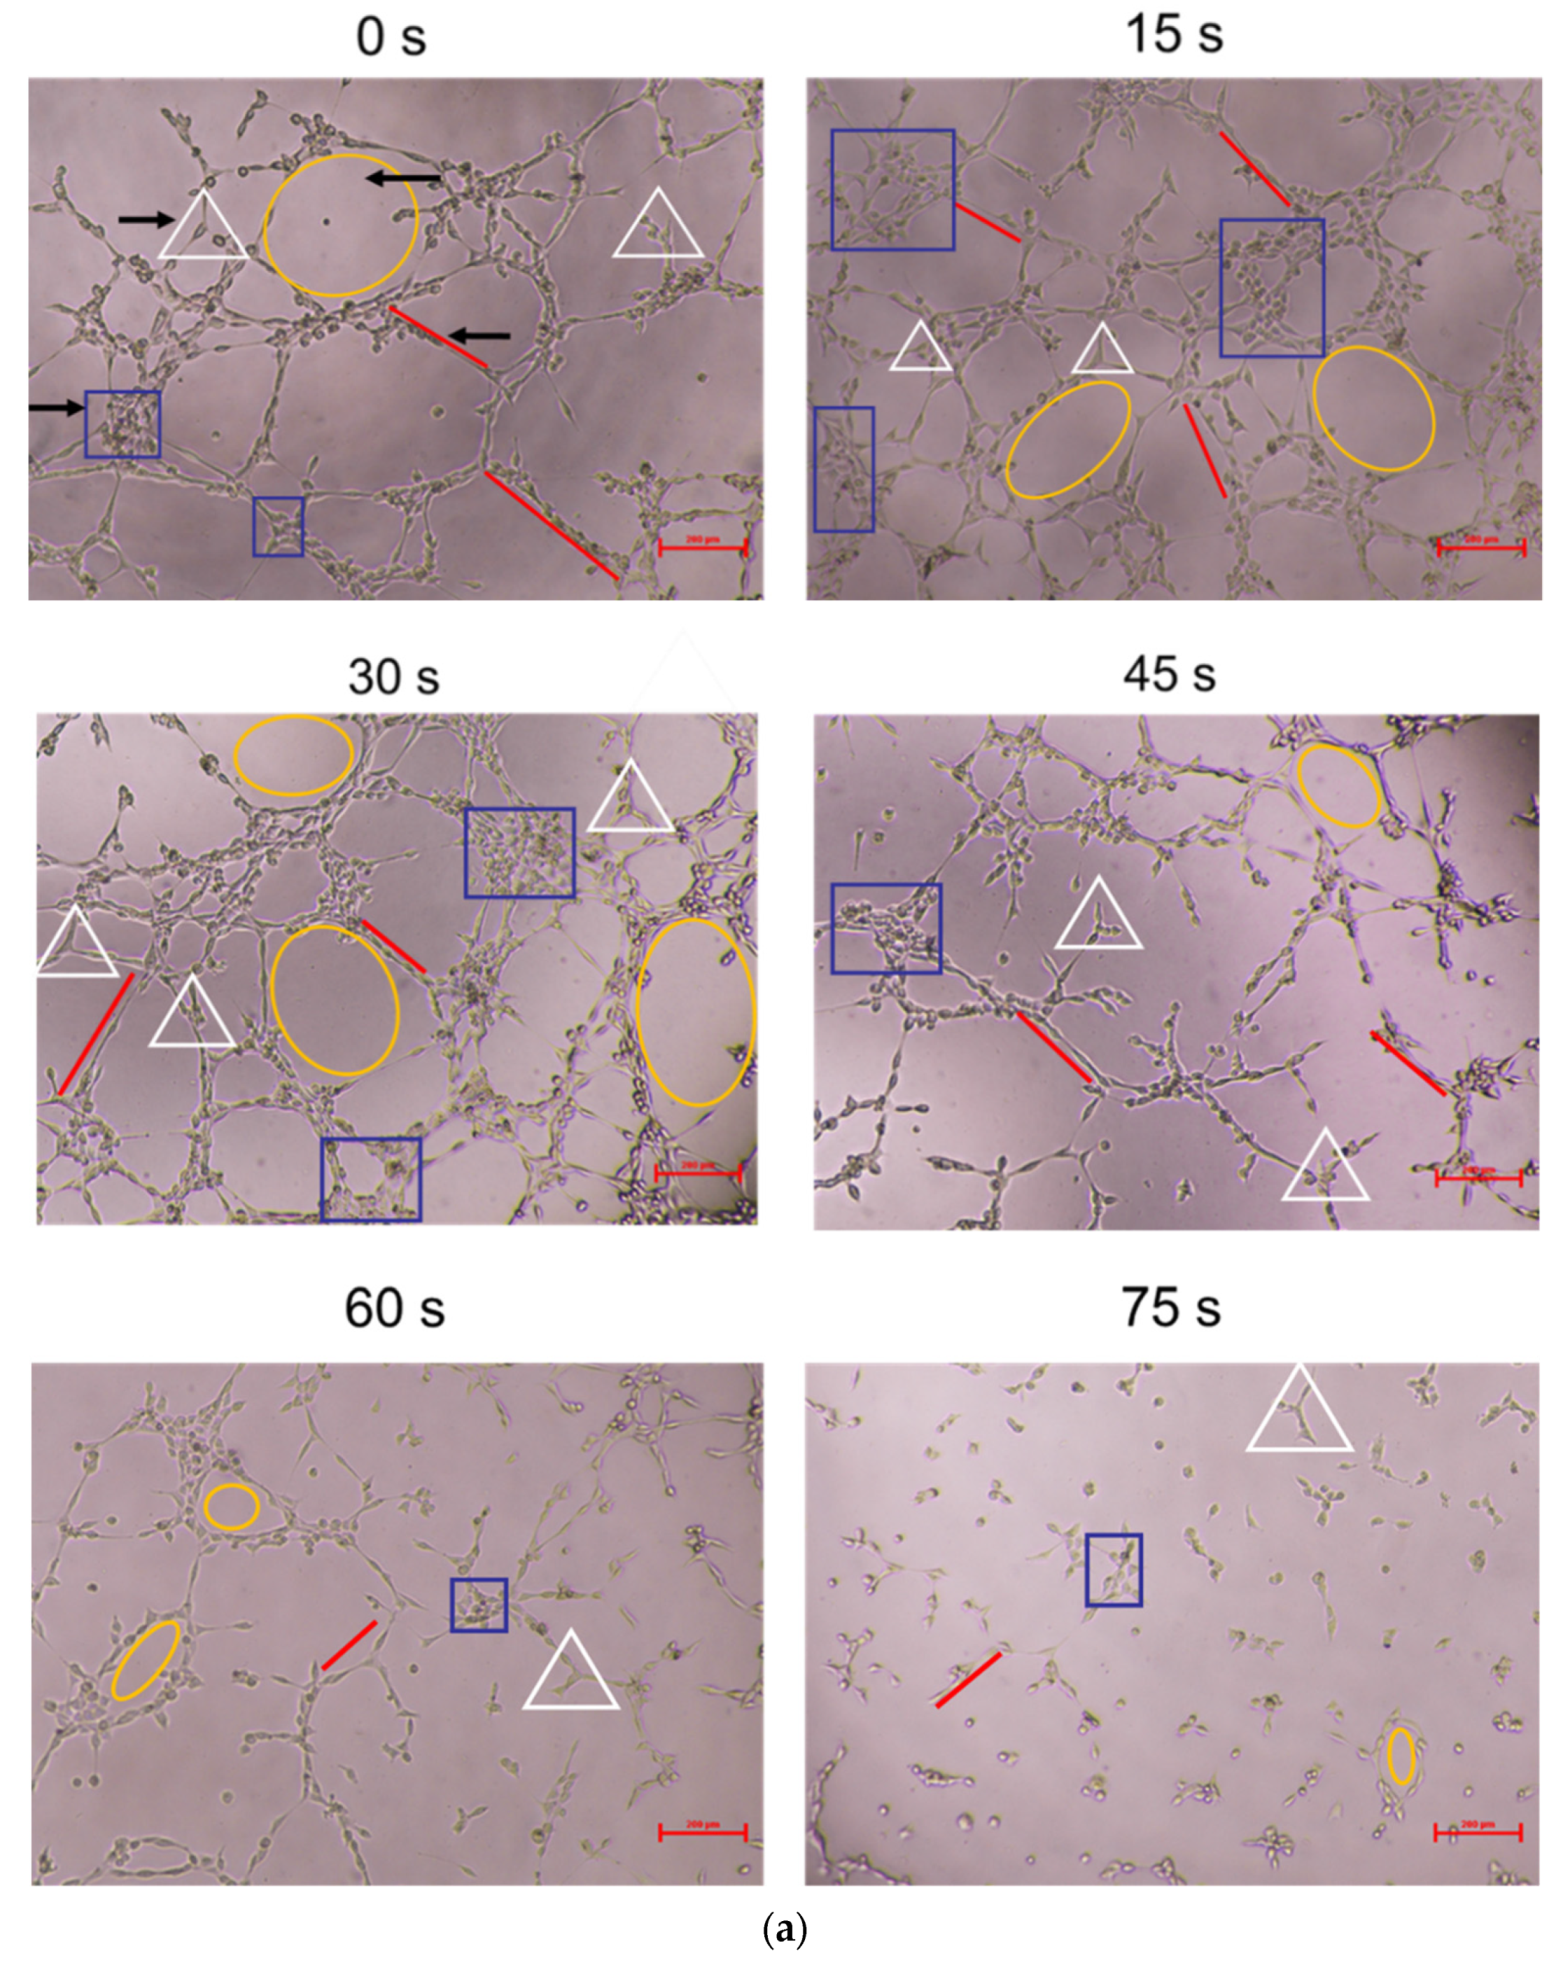
In order to investigate the effects of PAM on the angiogenesis of HUVECs, we conducted in vitro matrigel angiogenesis experiment, which was relatively simple, easy to control, easy to quantify, and could well simulate the process of angiogenesis in vivo. Firstly, 60 μL matrix glue (Matrigel, Corning, NY, USA) was added to each well of a pre-cooled 96-well plate (Corning, NY, USA) mixed with serum-free basal medium at 1:1, and incubated in an incubator at 37 °C for 30 min. After the matrix glue solidified, the cells in logarithmic growth phase were digested and collected. In the control group, fresh complete culture medium was added to resuscitate the cells to a cell density of 4 × 10⁵ cells/mL, while in the other groups, the cells were resuspended with PAM for 15 s, 30 s, 45 s, 60 s, and 75 s to a cell density of 4 × 10⁵ cells/mL. The solidified 96-well plate was taken out and 50 μL cell suspension mixed with fresh complete culture medium or PAM was added to each well. After static settlement for a while, when all cells sank on the substrate surface glue, the plate was put into the incubator again. At 2 h, 4 h, 6 h, 8 h, 10 h, the images were collected, and the ImageJ software was used to record and analyze the number of nodes, junctions, blood vessels, number of vessels, and length of major vessels.
2.6. Detection of Cell Migration
In this study, scratch healing test and single-layer penetration experiment were used to detect the cell migration of PAM-treated HUVECs.
2.6.1. Scratch Healing Test
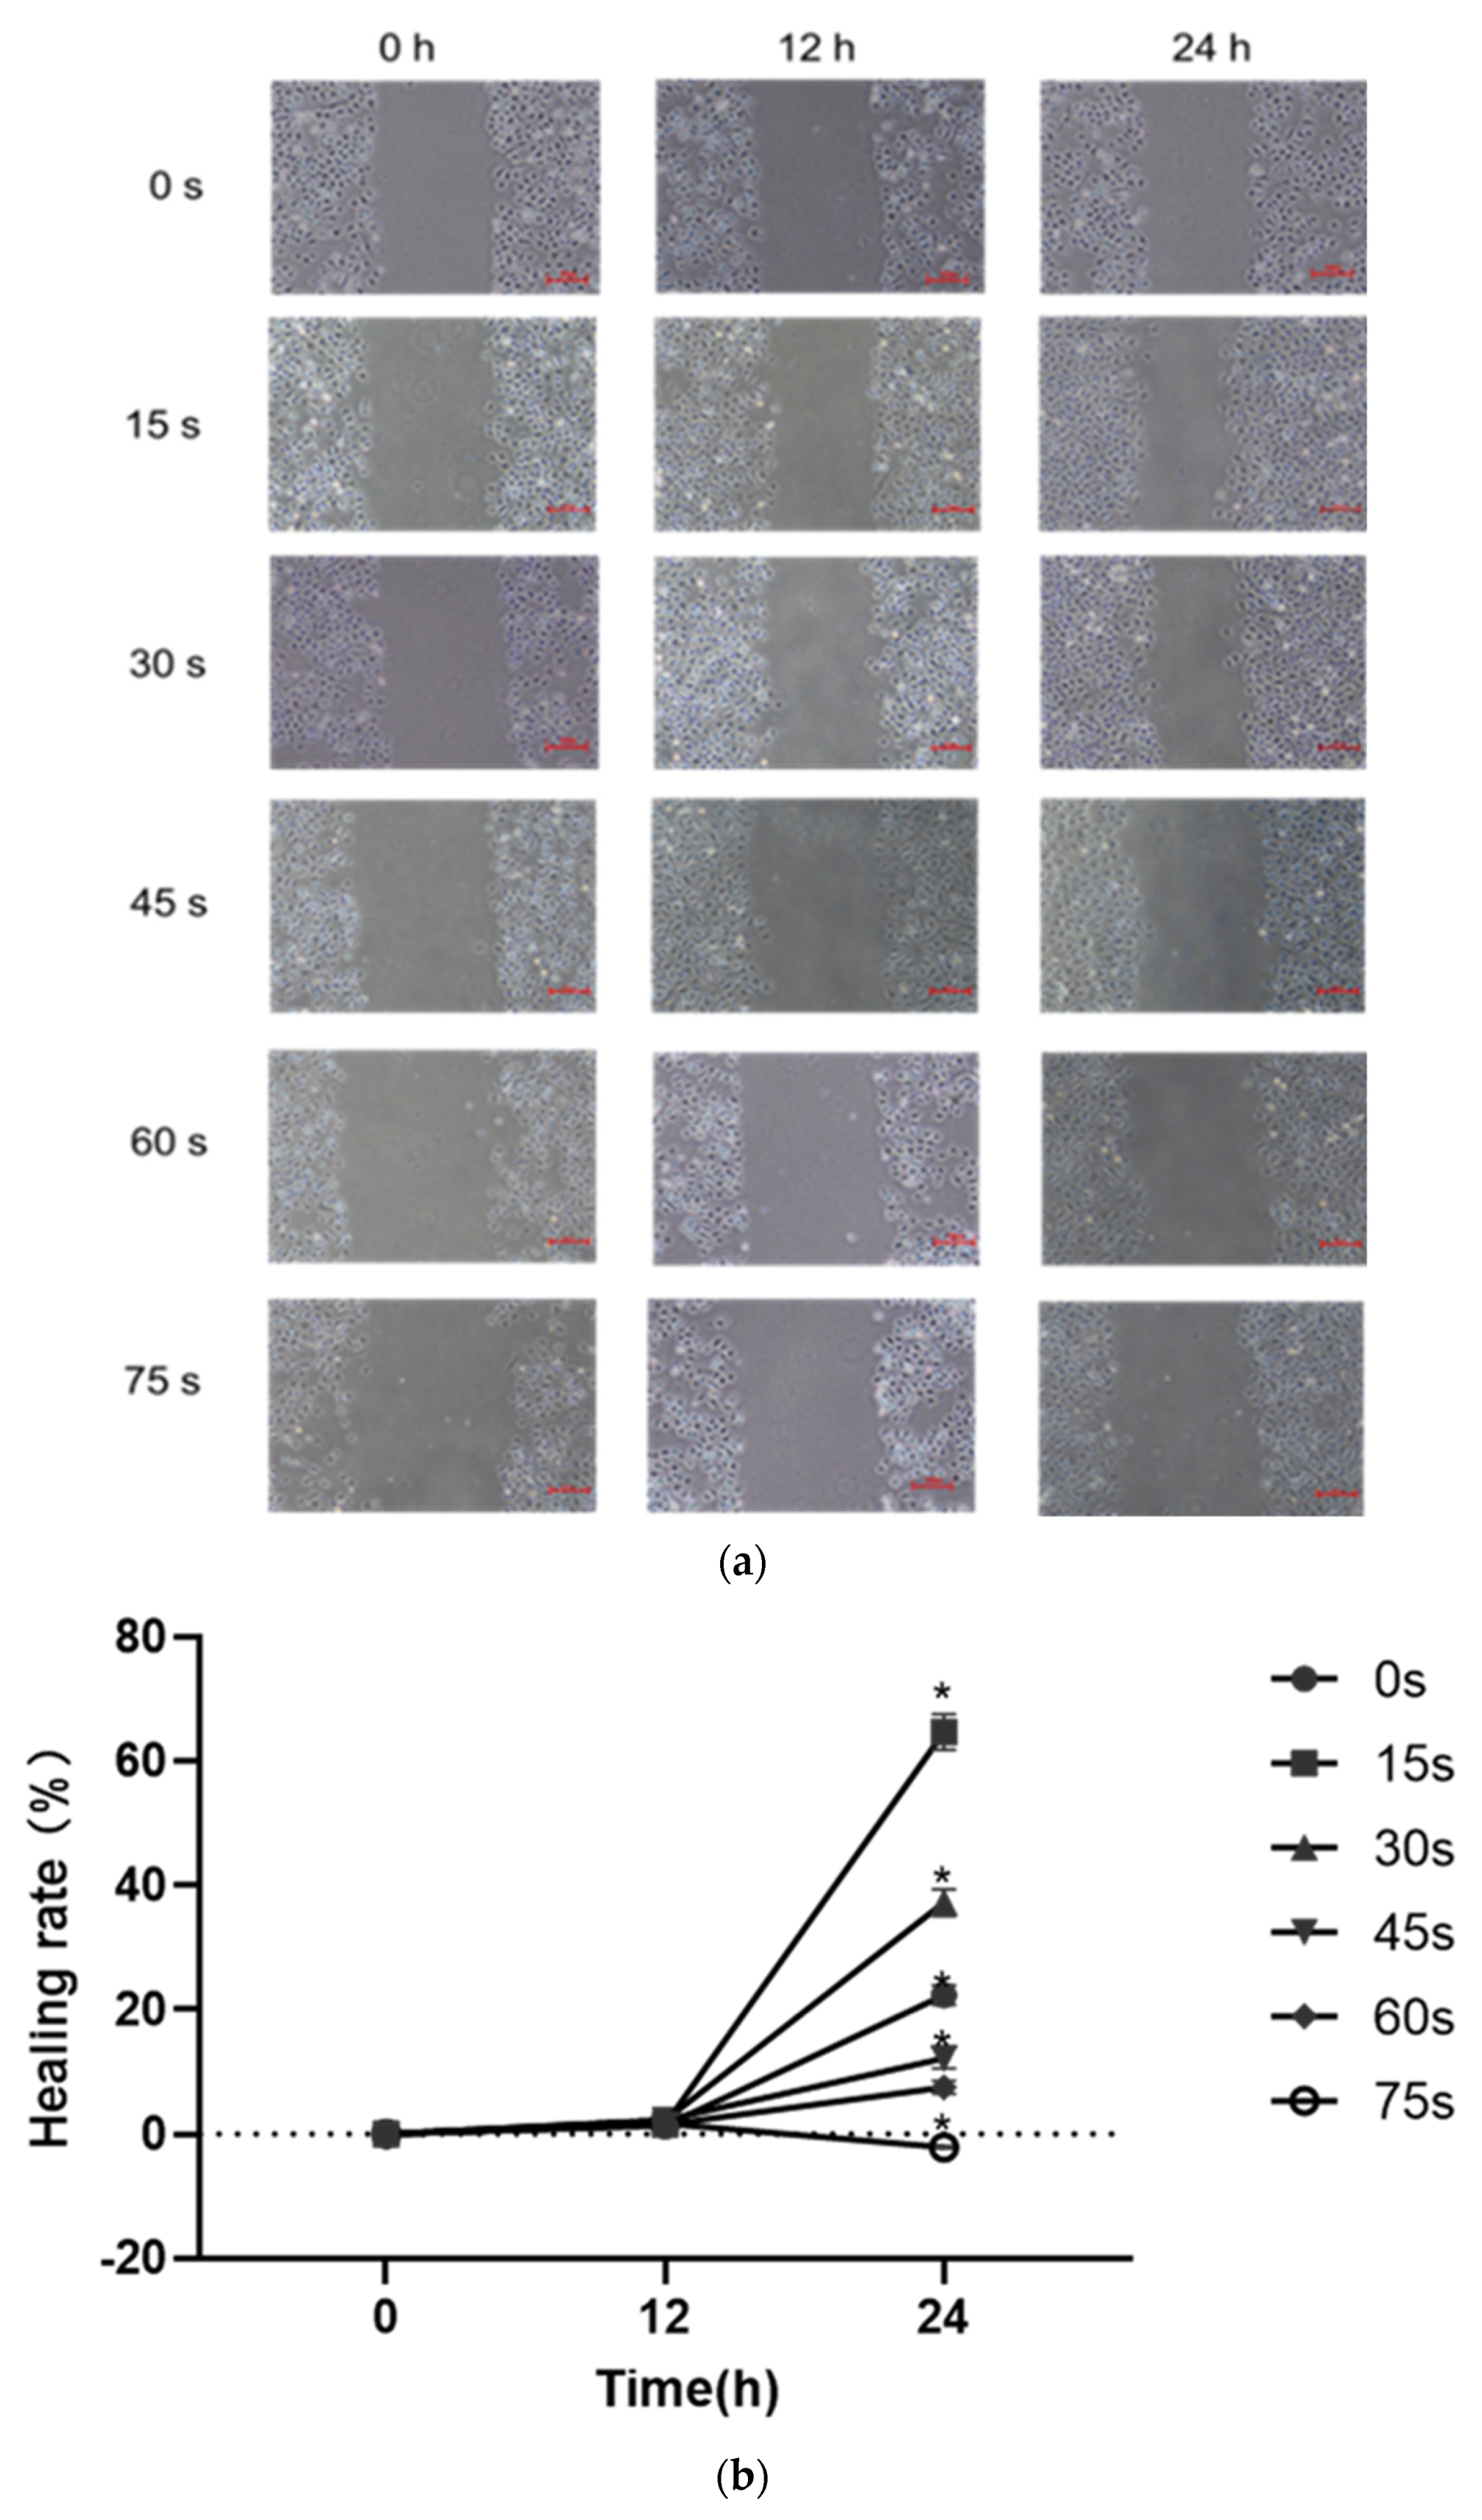
HUVECs were collected, and the cell density was adjusted to 2.5 × 10⁵ cells/mL. 2 mL cell suspension was added to each well in a 6-well plate (Corning, NY, USA), so that the number of cells in each well was about 5 × 10⁵ cells/mL. Before the cells were planked, horizontal lines were drawn evenly on the back of the 6-well plate with a marker. After the cells were planked, the plate was placed in an incubator at 37 °C for cultivation. When the cells adhered and the convergence reached 100%, the old culture medium was discarded, a ruler and 10 μL sterile spear head were used to scratch behind the 6-well plate. After the marking, the scratched area was gently washed 3 times with PBS buffer, so that there were no suspended cells in the hole. PAM containing 1% low serum was added, the scratch condition was recorded and the observation position was marked for the first time. The culture was placed in the incubator, and photos were taken at 6 h, 12 h and 24 h, respectively. The ImageJ software was used to measure the pixels of the scratch area to compare the cell scratch healing rate quantitatively for statistical analysis.
2.6.2. Single-Layer Penetration Experiment
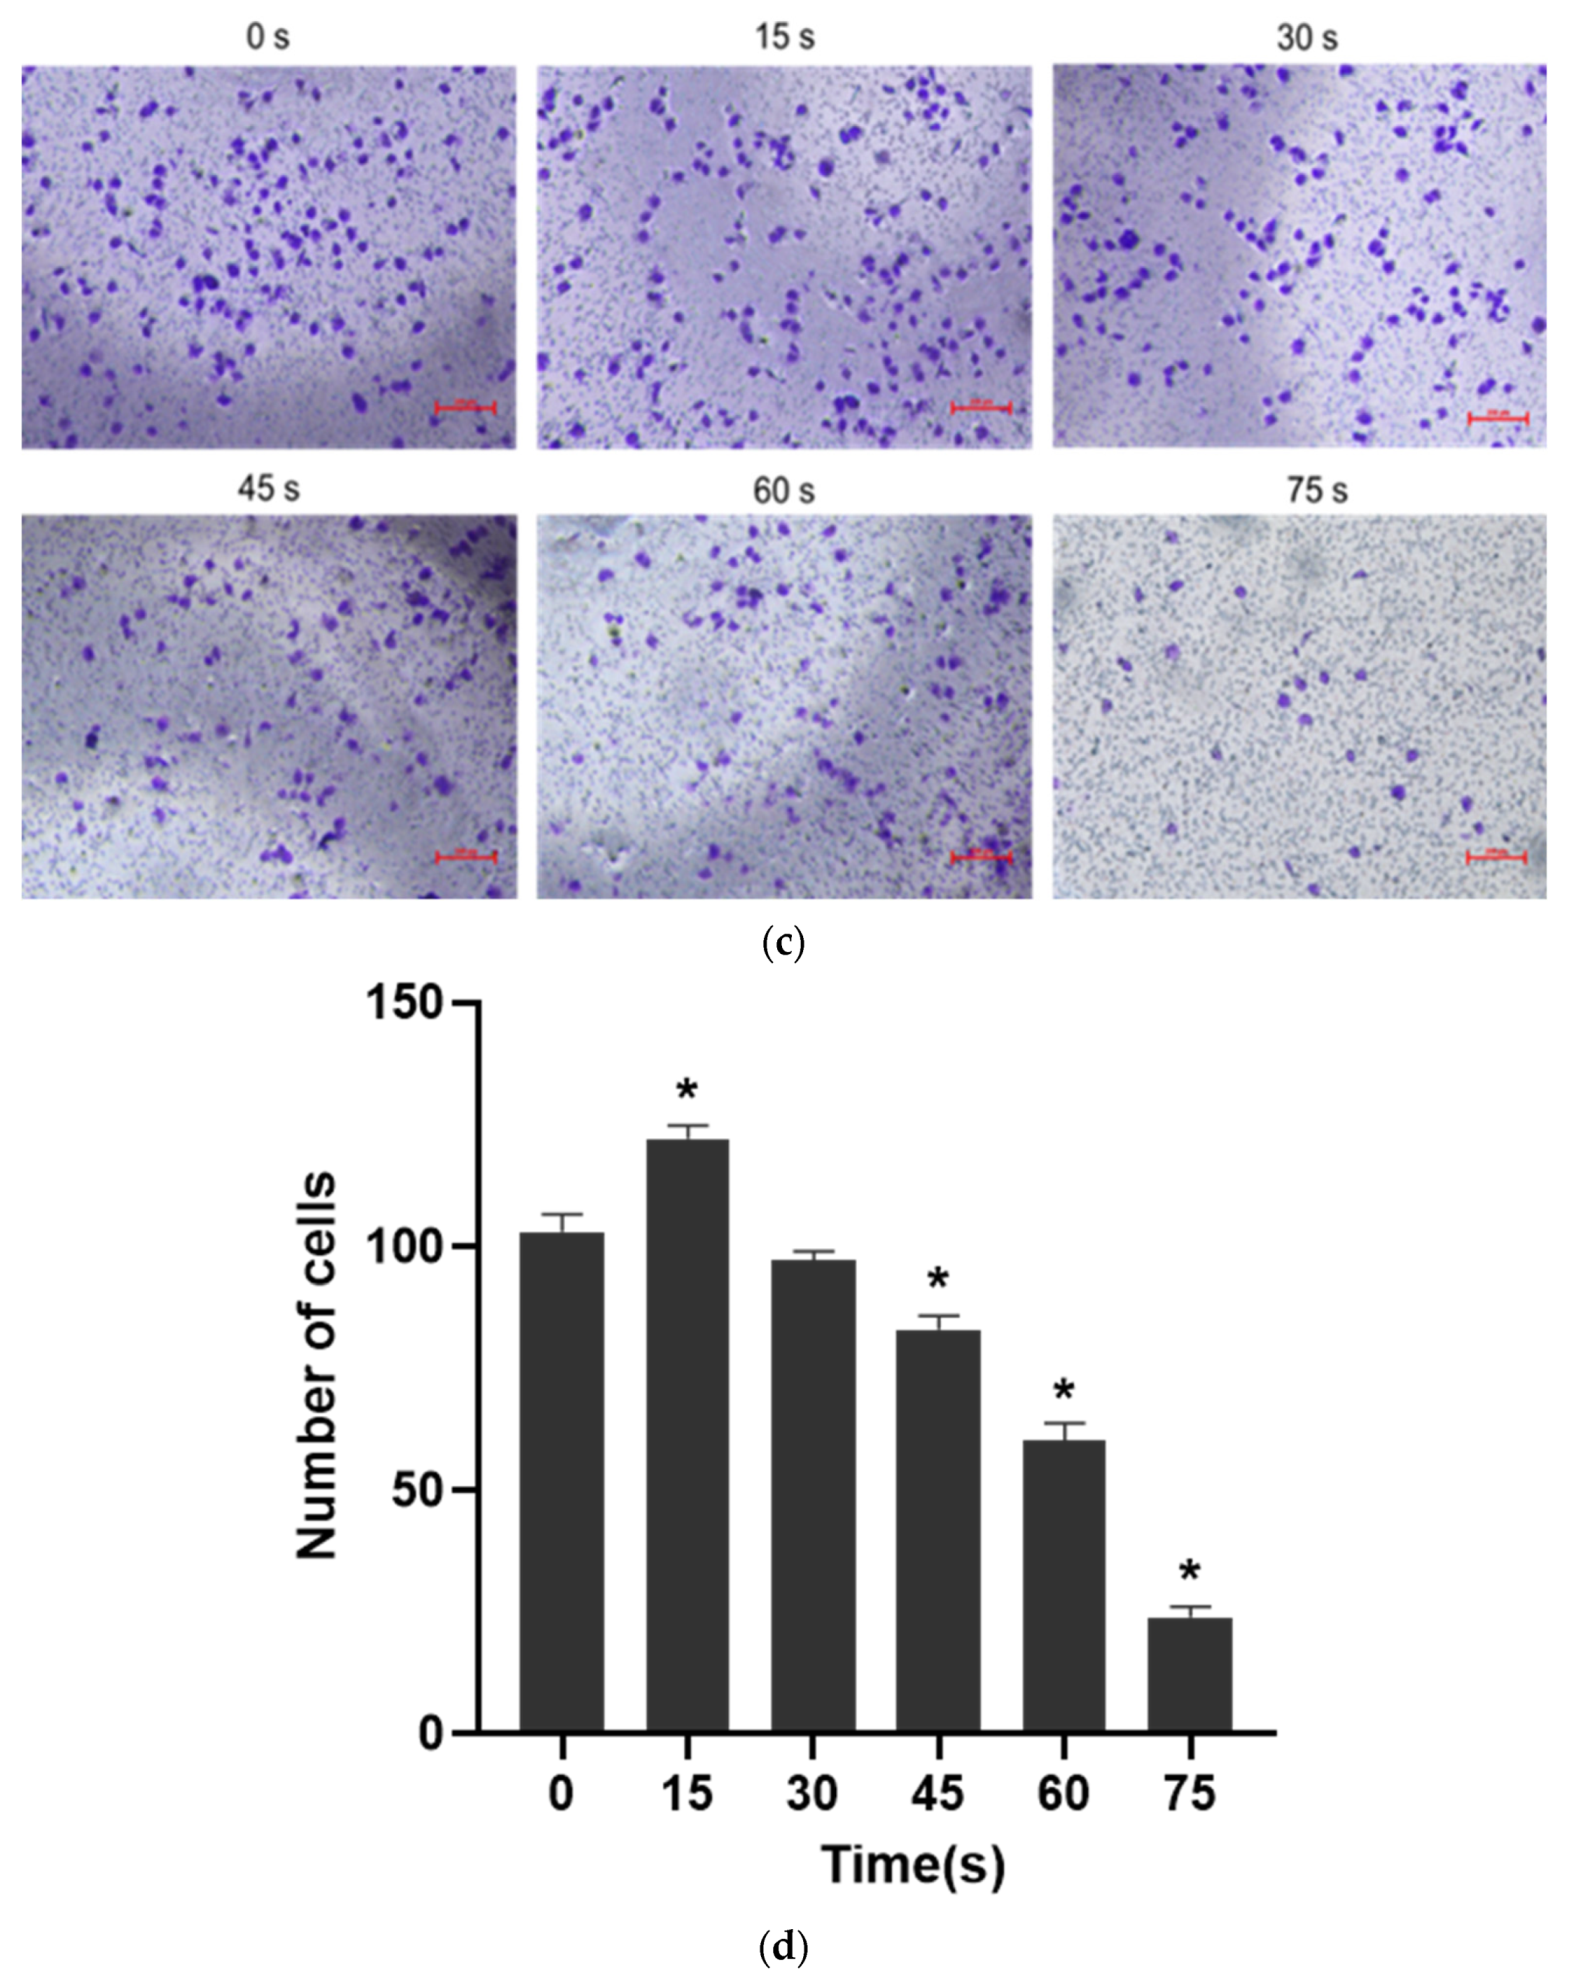
The culture medium containing 1% fetal bovine serum was prepared and added to a 24-well plate for LTP treatment to prepare PAM. The treatment time was the same as before. 600 μL complete culture medium containing 10% fetal bovine serum was added to the lower layer of a new 24-well plate (Corning, NY, USA) and the plate was placed in a Transwell insert (Corning, NY, USA). The cell density was 6 × 10⁴ cells/mL. 500 μL cell suspension was centrifugated at 1200 rpm/min for 4 min in an EP tube. The supernatant was discarded and 200 μL PAM was added to different groups. After blowing evenly, the cells were inoculated in the upper layer of Transwell insert and cultured in an incubator for 24 h. At the end of the culture, the Transwell insert was taken out, the supernatant was discarded, and the upper layer cells were carefully wiped with cotton swabs. The cells were then fixed with 4% paraformaldehyde at room temperature for 20 min, and stained with 0.1% crystal violet for 15 min. After staining, the excess dye was washed off with running water. The cells were observed and photographed under a microscope, and 5 fields were selected randomly to count the number of cells for statistical analysis.
2.7. Detection of Cell Adhesion
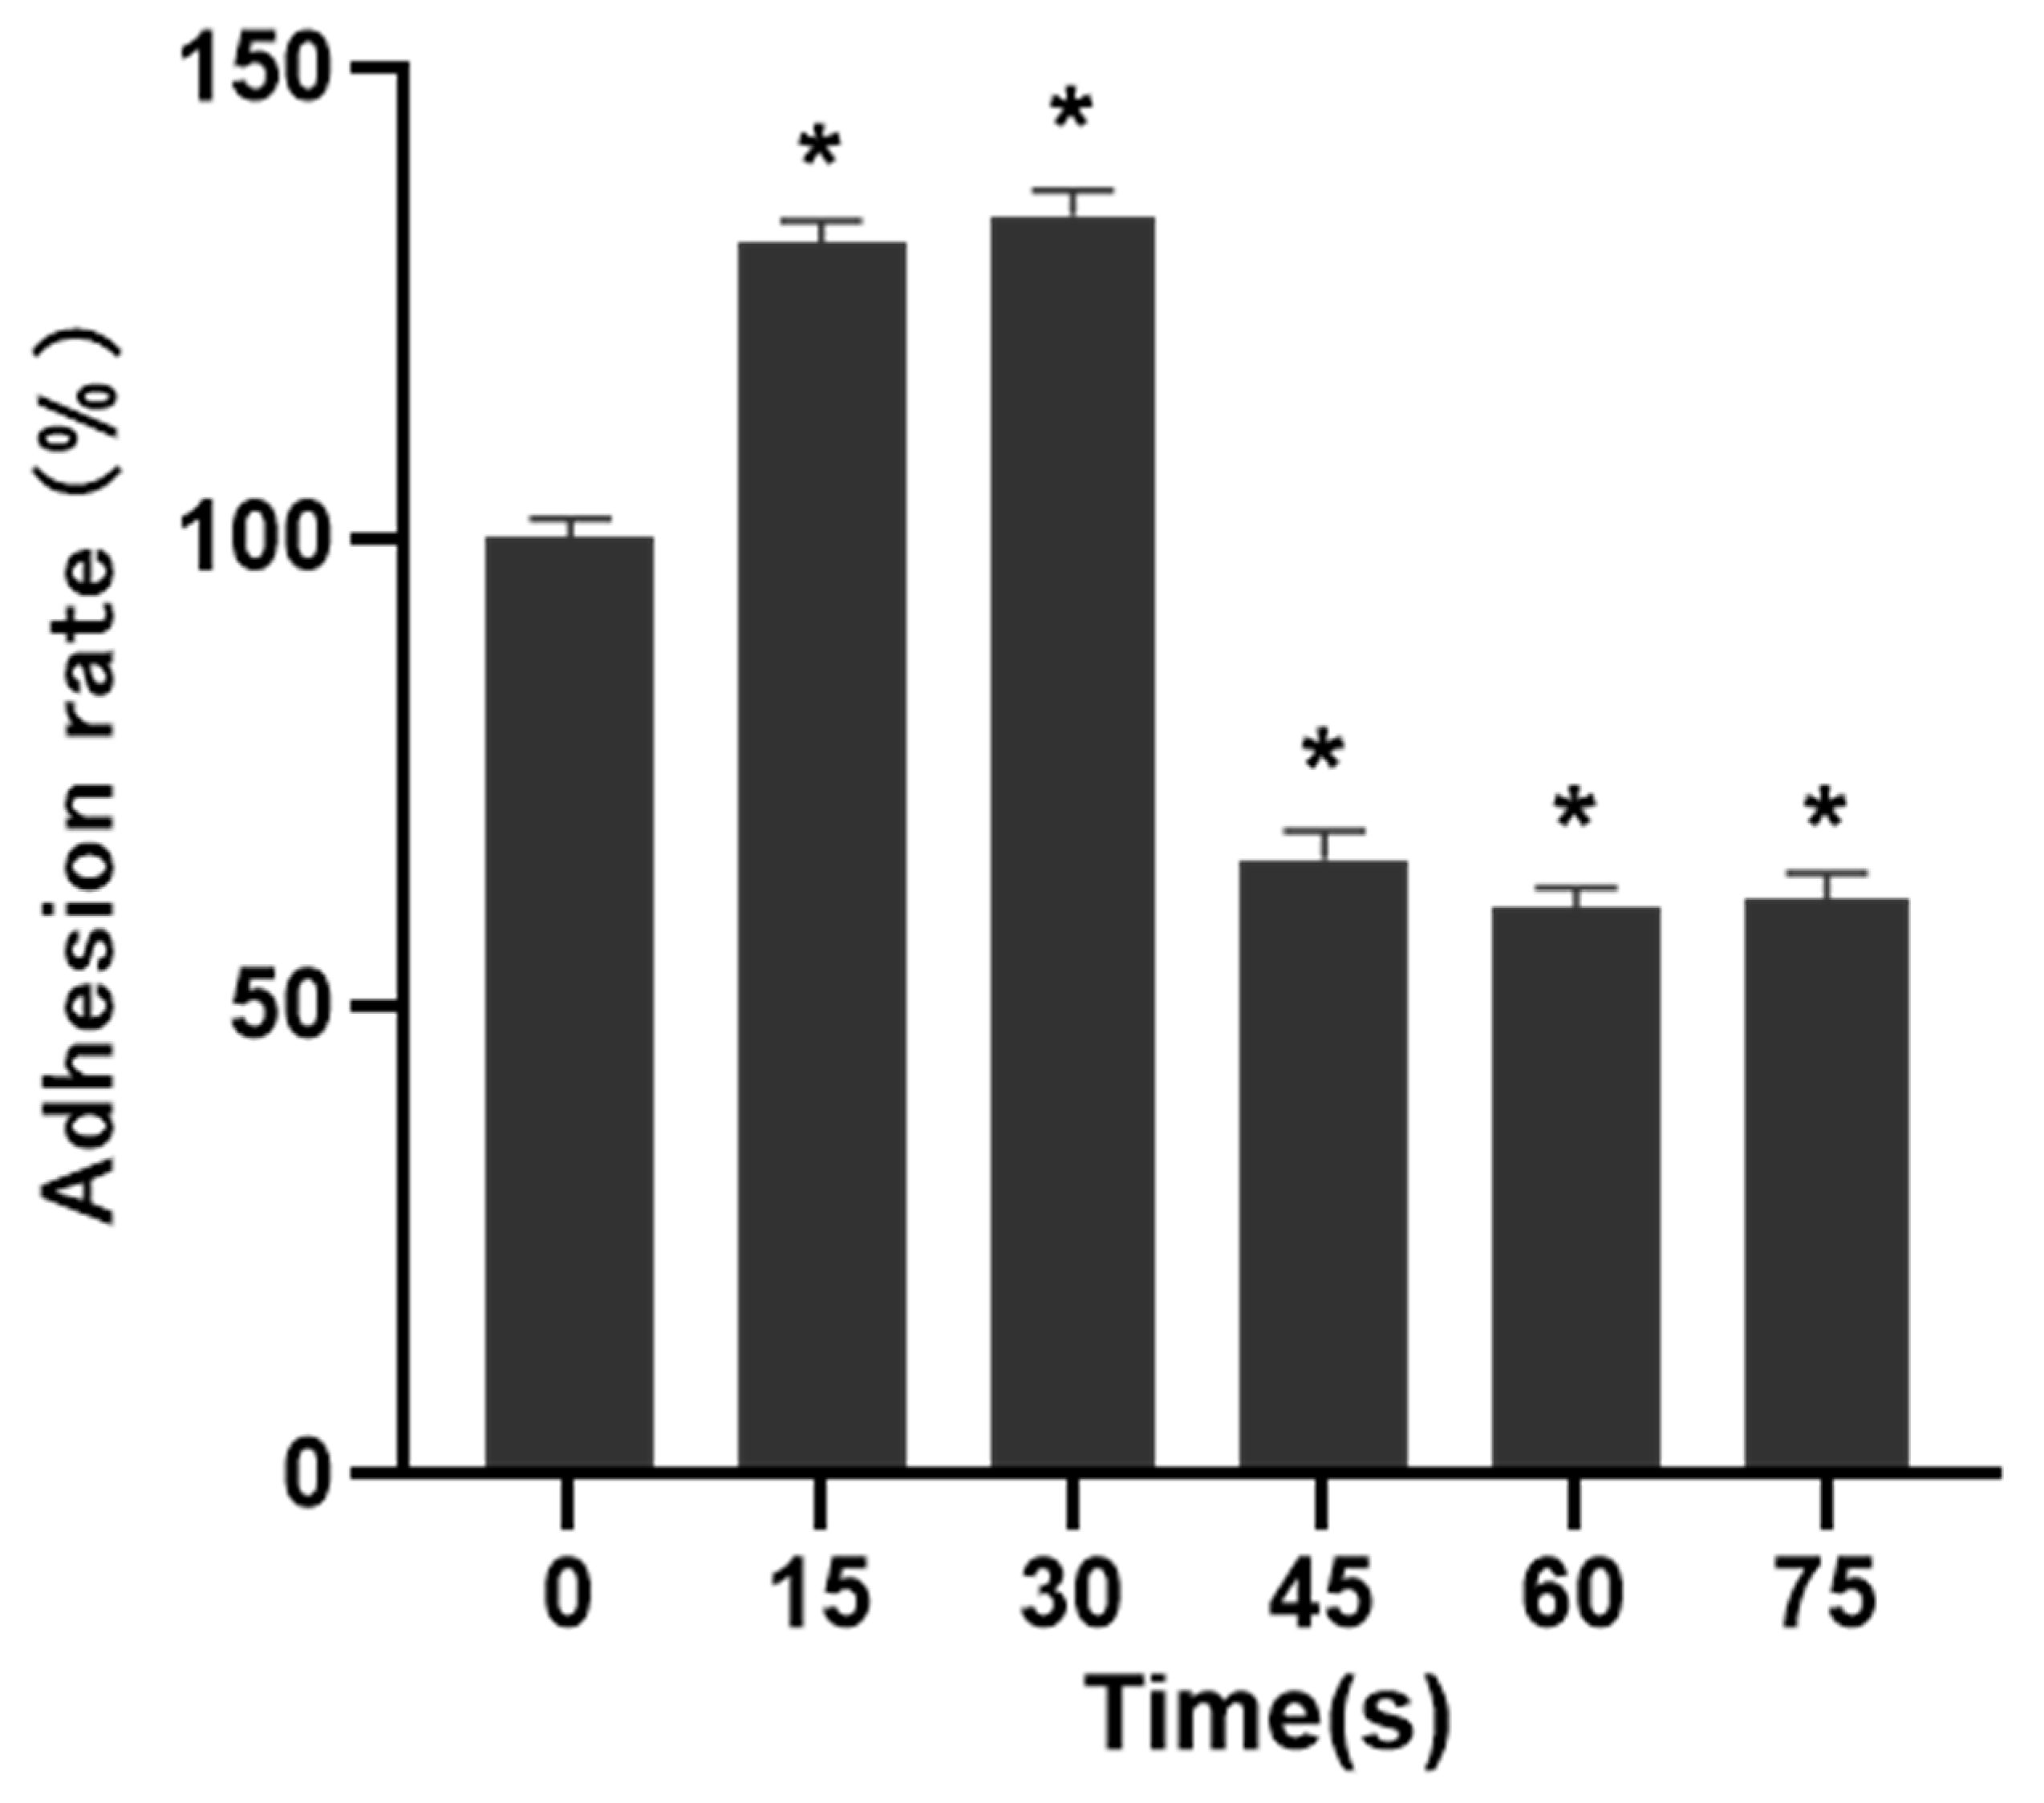
The migration and adhesion of HUVECs were essential steps in the process of angiogenesis, so the matrix adhesive experiment was conducted to measure the changes in the adhesion ability of HUVECs. The matrix glue was mixed with serum-free basal medium at 1:1, and then added to a 96-well plate. After coagulation, 50 μL cell suspension with a density of 4 × 10
5 cells/mL was added to each well, and incubated for 30 min. After incubation, the culture medium was discarded, the suspended cells were washed away with PBS, 10 μL CCK-8 was added to each well, and incubated in dark for 4 h. Then the OD value of the sample was measured. The formula was:
2.8. Detection of Secretion of Cytokines with ELISA
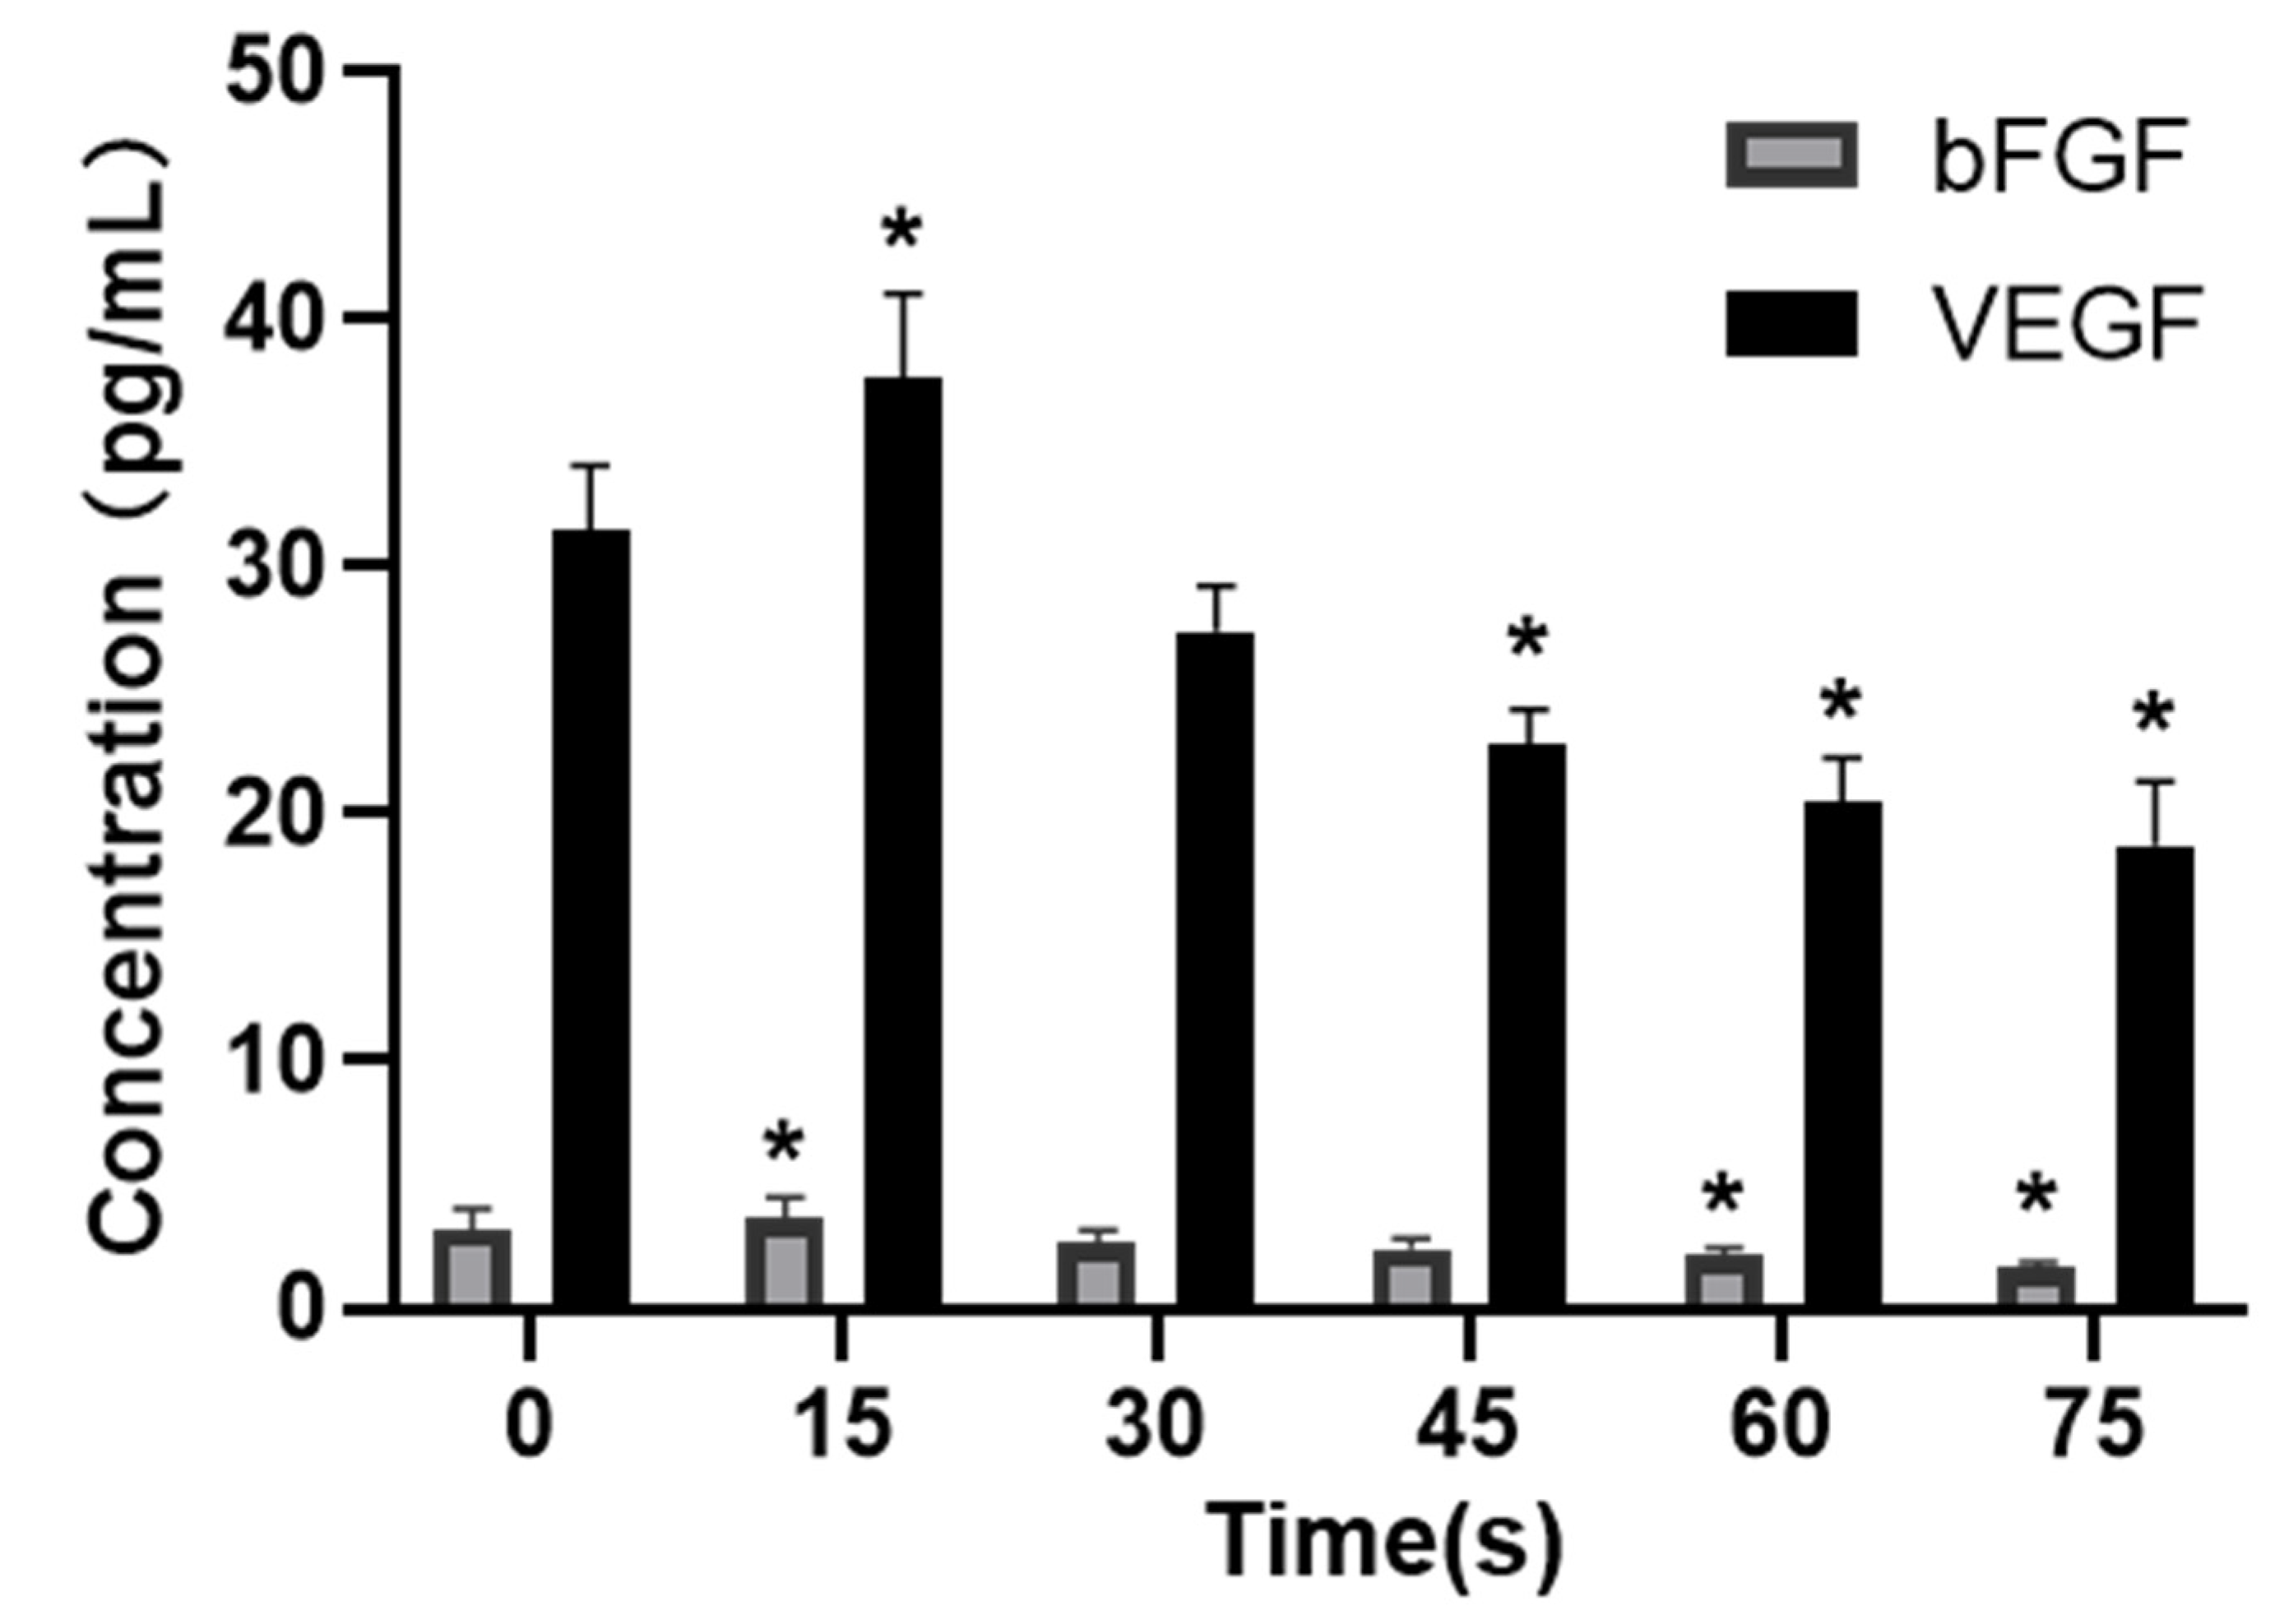
VEGF and bFGF are two important cytokines secreted by HUVECs. In our research, the concentrations of VEGF and bFGF in the supernatant were determined with ELISA. After HUVECs were cultured with PAM for 24 h, the supernatant of cell culture was collected by centrifugation, and the operation was performed according to the requirements of VEGF and bFGF ELISA kit (Jianglaibio, Shanghai, China). The strip in the kit was taken out, the standard wells, blank wells and sample wells were set according to the instructions, and 3 multiple wells were set for each group. 50 μL of sample to be tested and 100 μL of HRP-labeled detection antibody were added to each well. The reaction wells were sealed with sealing plate membrane, and incubated at 37 °C for 60 min. After incubation, the liquid was removed from the plate, washing solution was added to each well and washed 5 times.
Then 50 μL of substrate A and 50 μL of substrate B were added to the well and incubated at 37 °C for 15 min. Finally, 50 μL of stop buffer was added to each well. The OD value of each well was measured at 450 nm within 15 min. The standard linear regression curve was drawn according to the concentration and OD value of the standard sample, and the concentration of each sample was calculated according to the curve equation. 3 parallel samples were set for each experiment, and each experiment was repeated 3 times to remove outliers to reduce errors.
2.9. Detection of Protein Expressions
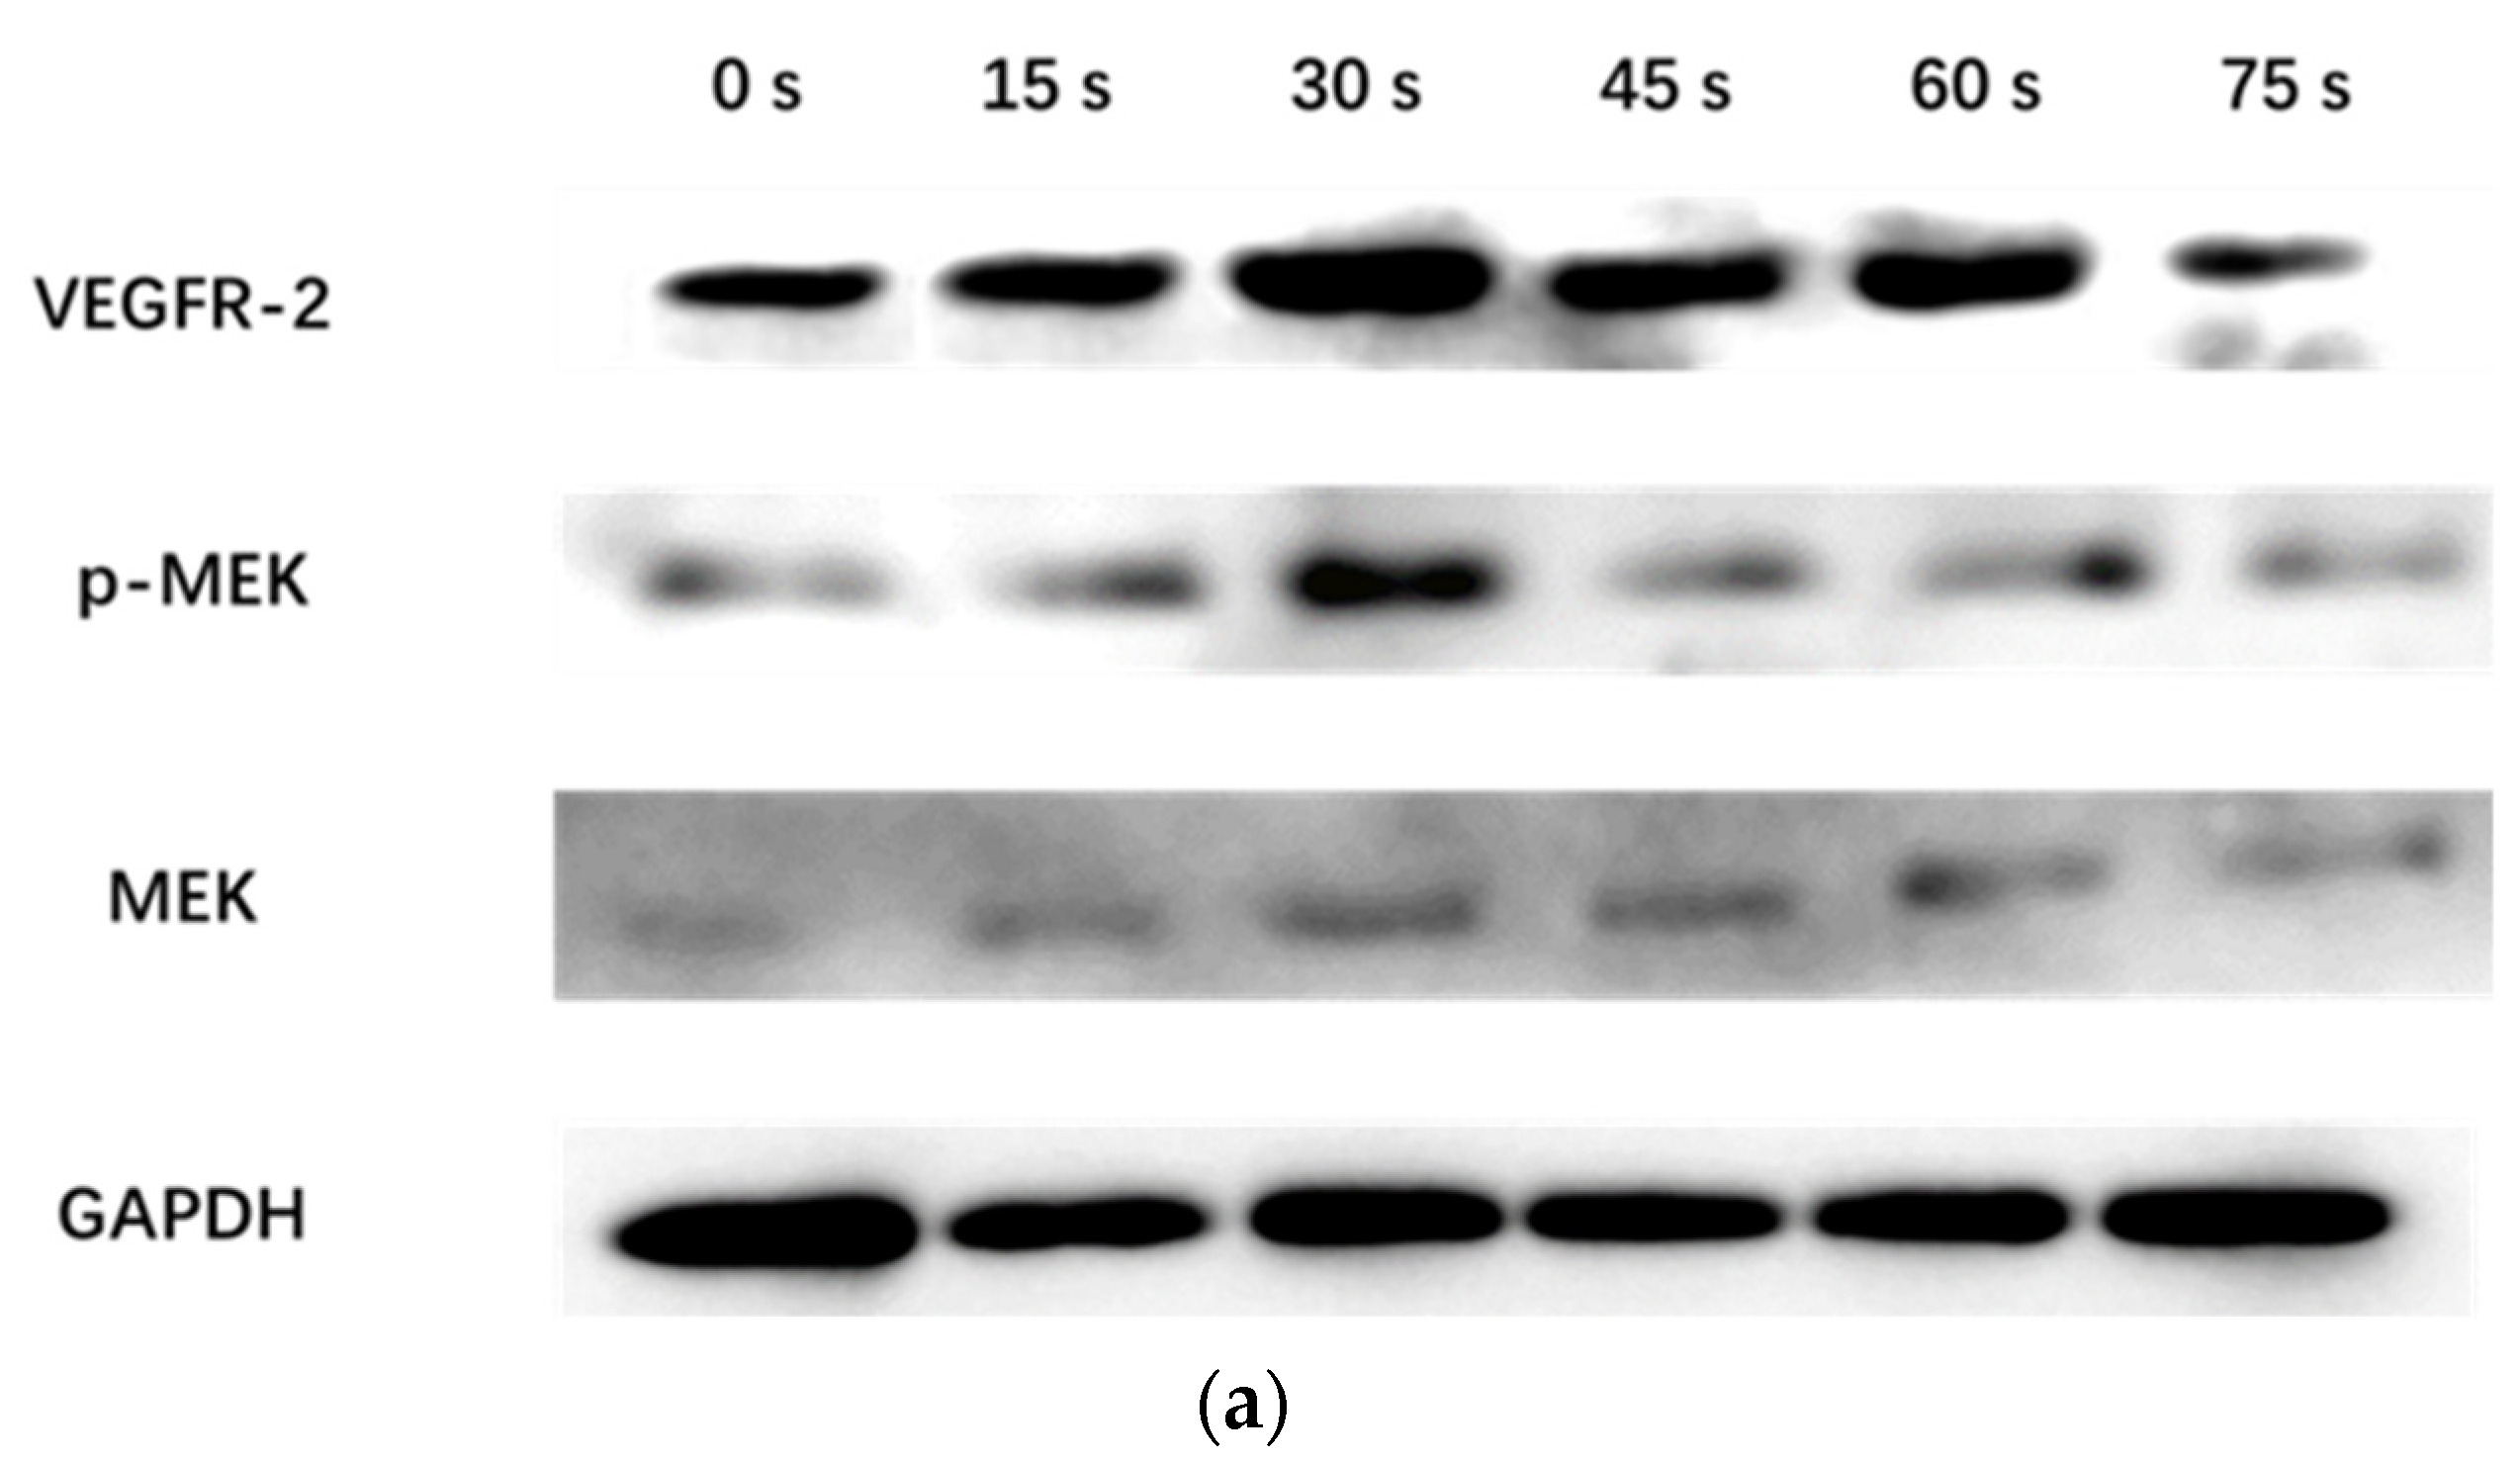
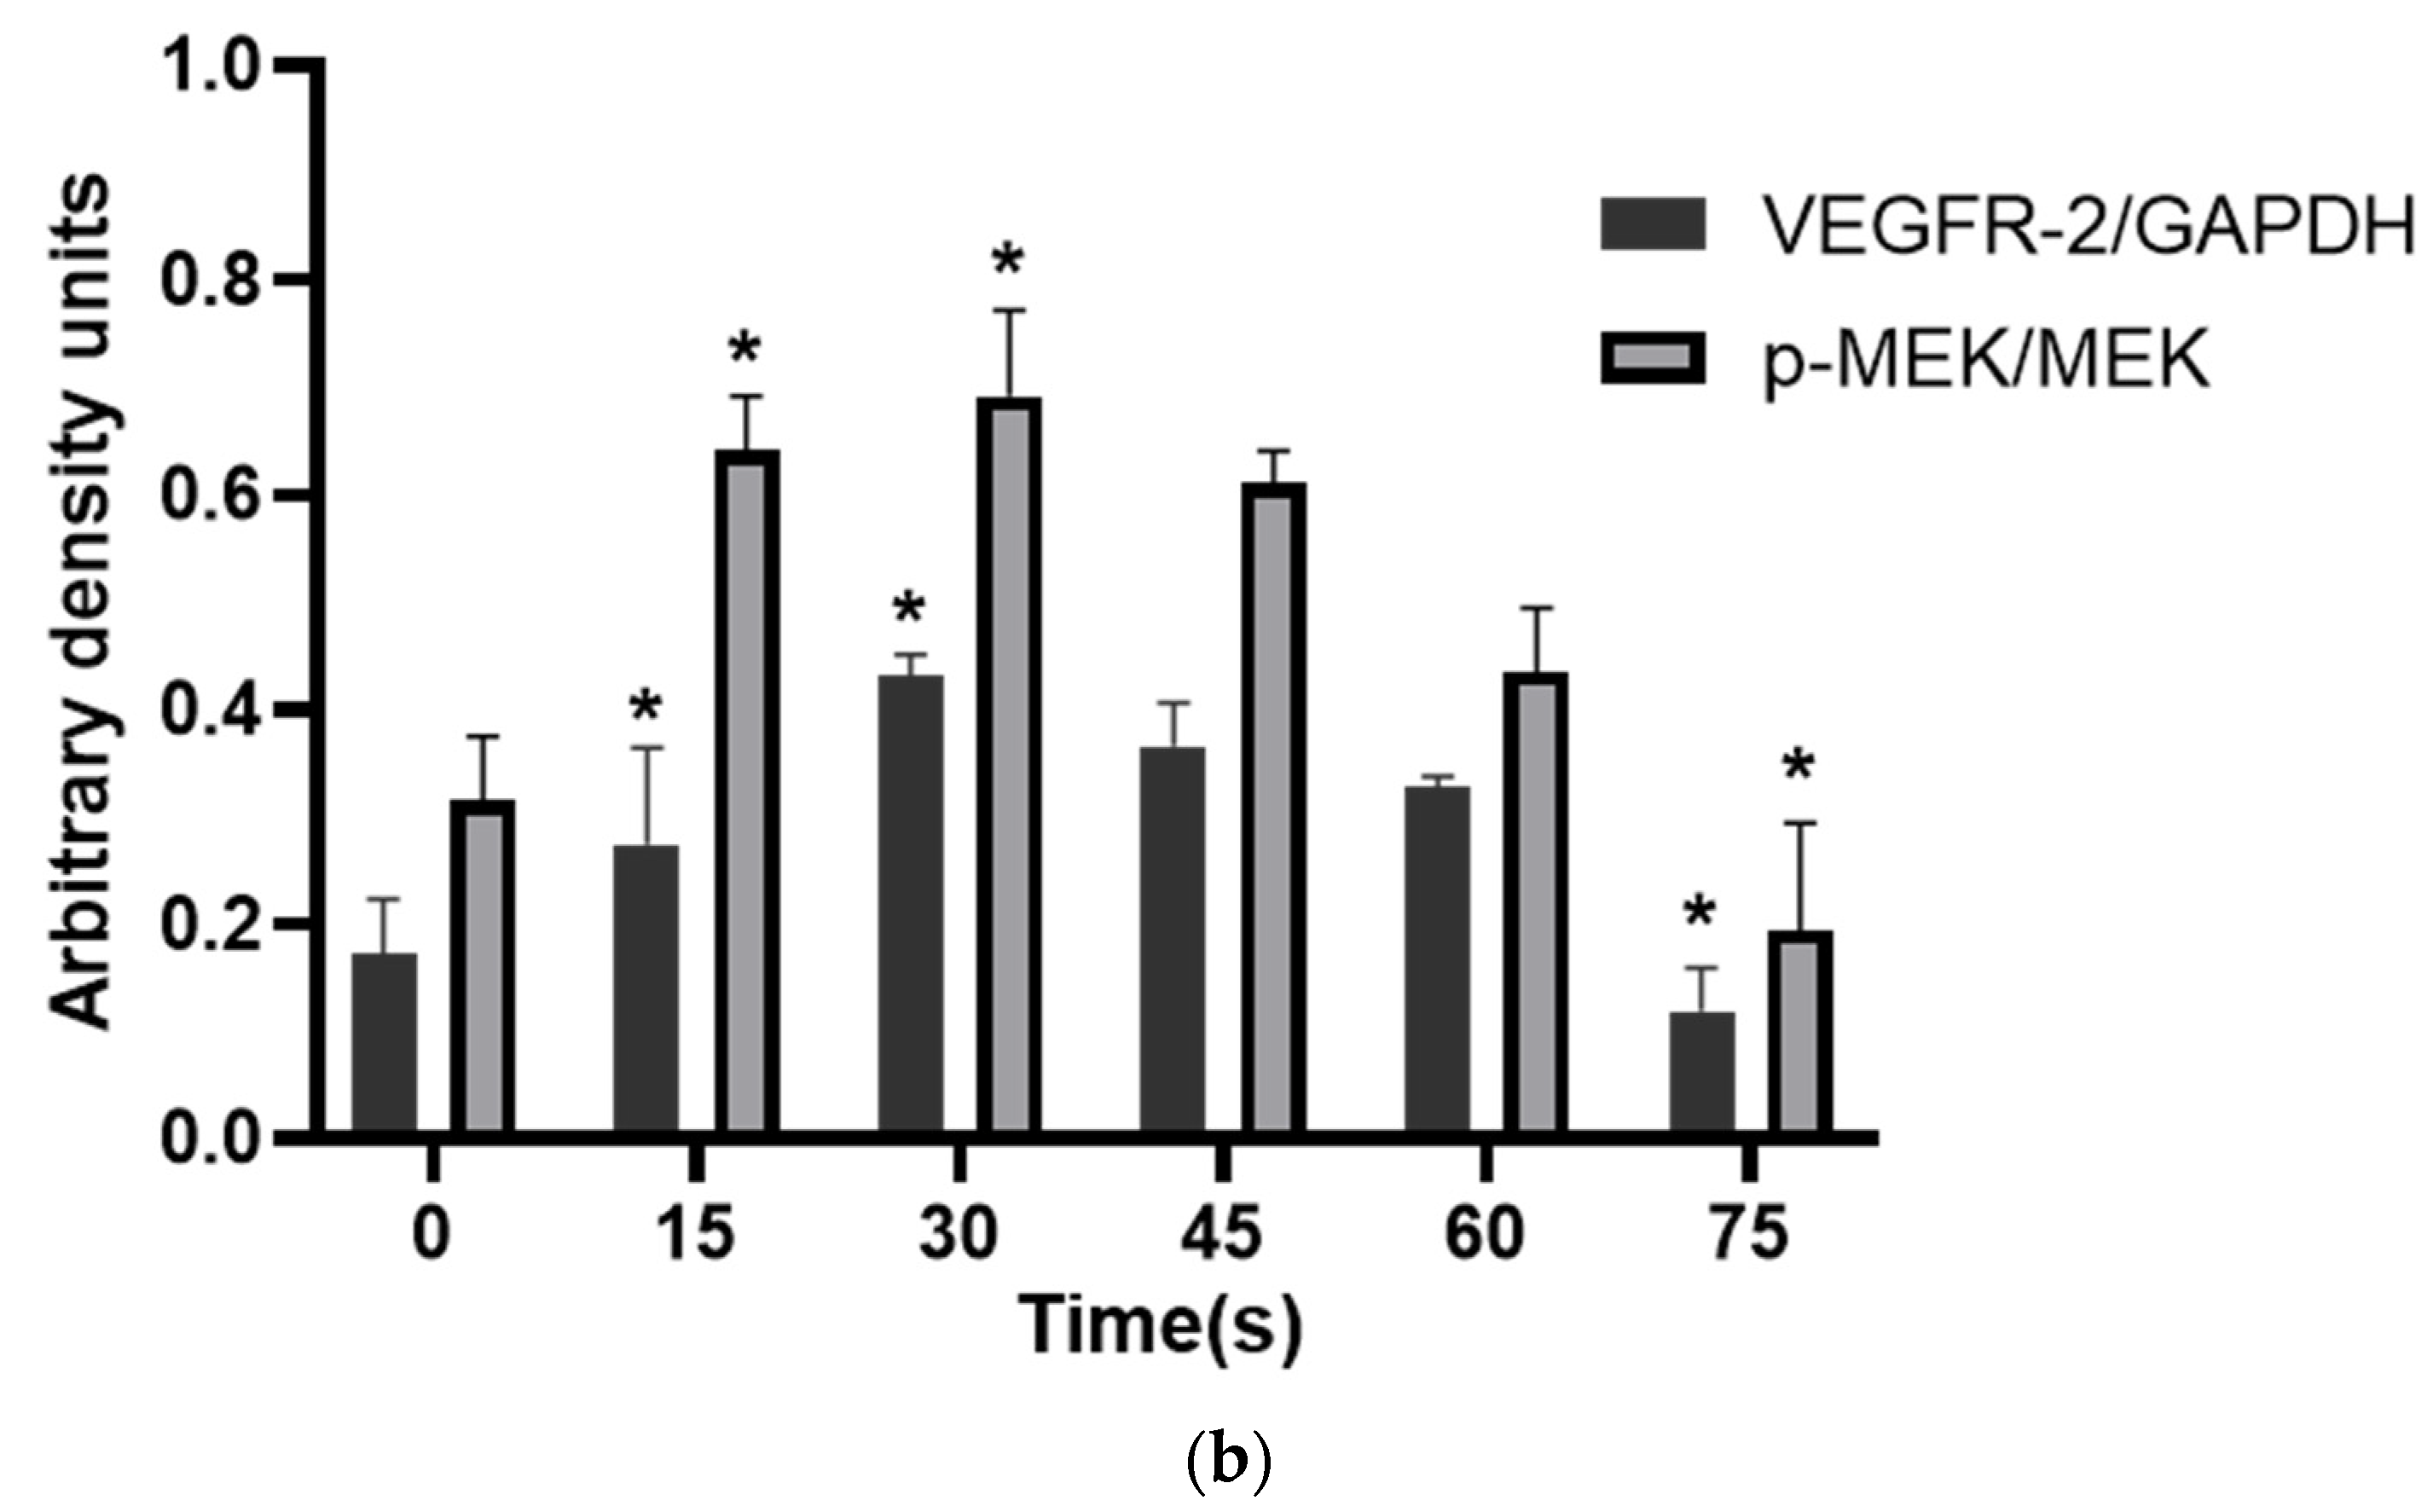
WB assay was used to detect the expression of VEGFR-2 protein and the phosphorylation level of MEK in the MEK-ERK pathway of HUVECs incubated with PAM for 24 h. After the cells were washed twice with pre-cooled PBS, the RIPA cell lysate was added for ice lysis for 20 min, and then centrifuged at 12,000 RPM/min for 5 min. The supernatant was collected and the protein content was determined. 30 μg total protein was used for SDS-PAGE experiment. After electrophoresis, the protein was transferred to polyvinylidene fluoride membrane, 5% non-fat dry milk was added, and was closed in a shaker at room temperature for 2 h. It was then incubated overnight at 4 °C with GAPDH (1:5000) (Immunoway, Plano, TX, USA), rabbit anti-VEGFR-2, p-MEK, and mouse anti-MEK (1:1000) primary antibody (Cell Signaling Technology, Danvers, MA, USA). The membrane was washed with TBST (Tris-Buffered Saline with Tween) 3 times and each time for 10 min. The corresponding HRP-labeled goat anti-rabbit IgG and goat anti-mouse IgG (1:5000) (Immunoway, Plano, TX, USA) were added respectively and incubated at room temperature for 2 h, and then the membrane was washed with TBST for 3 times and each time for 10 min. Finally, ECL color development kit (Millipore, MA, USA) was used in the darkroom for exposure development. The experiment was repeated 3 times with GAPDH as the internal reference.
2.10. Detection of RONS
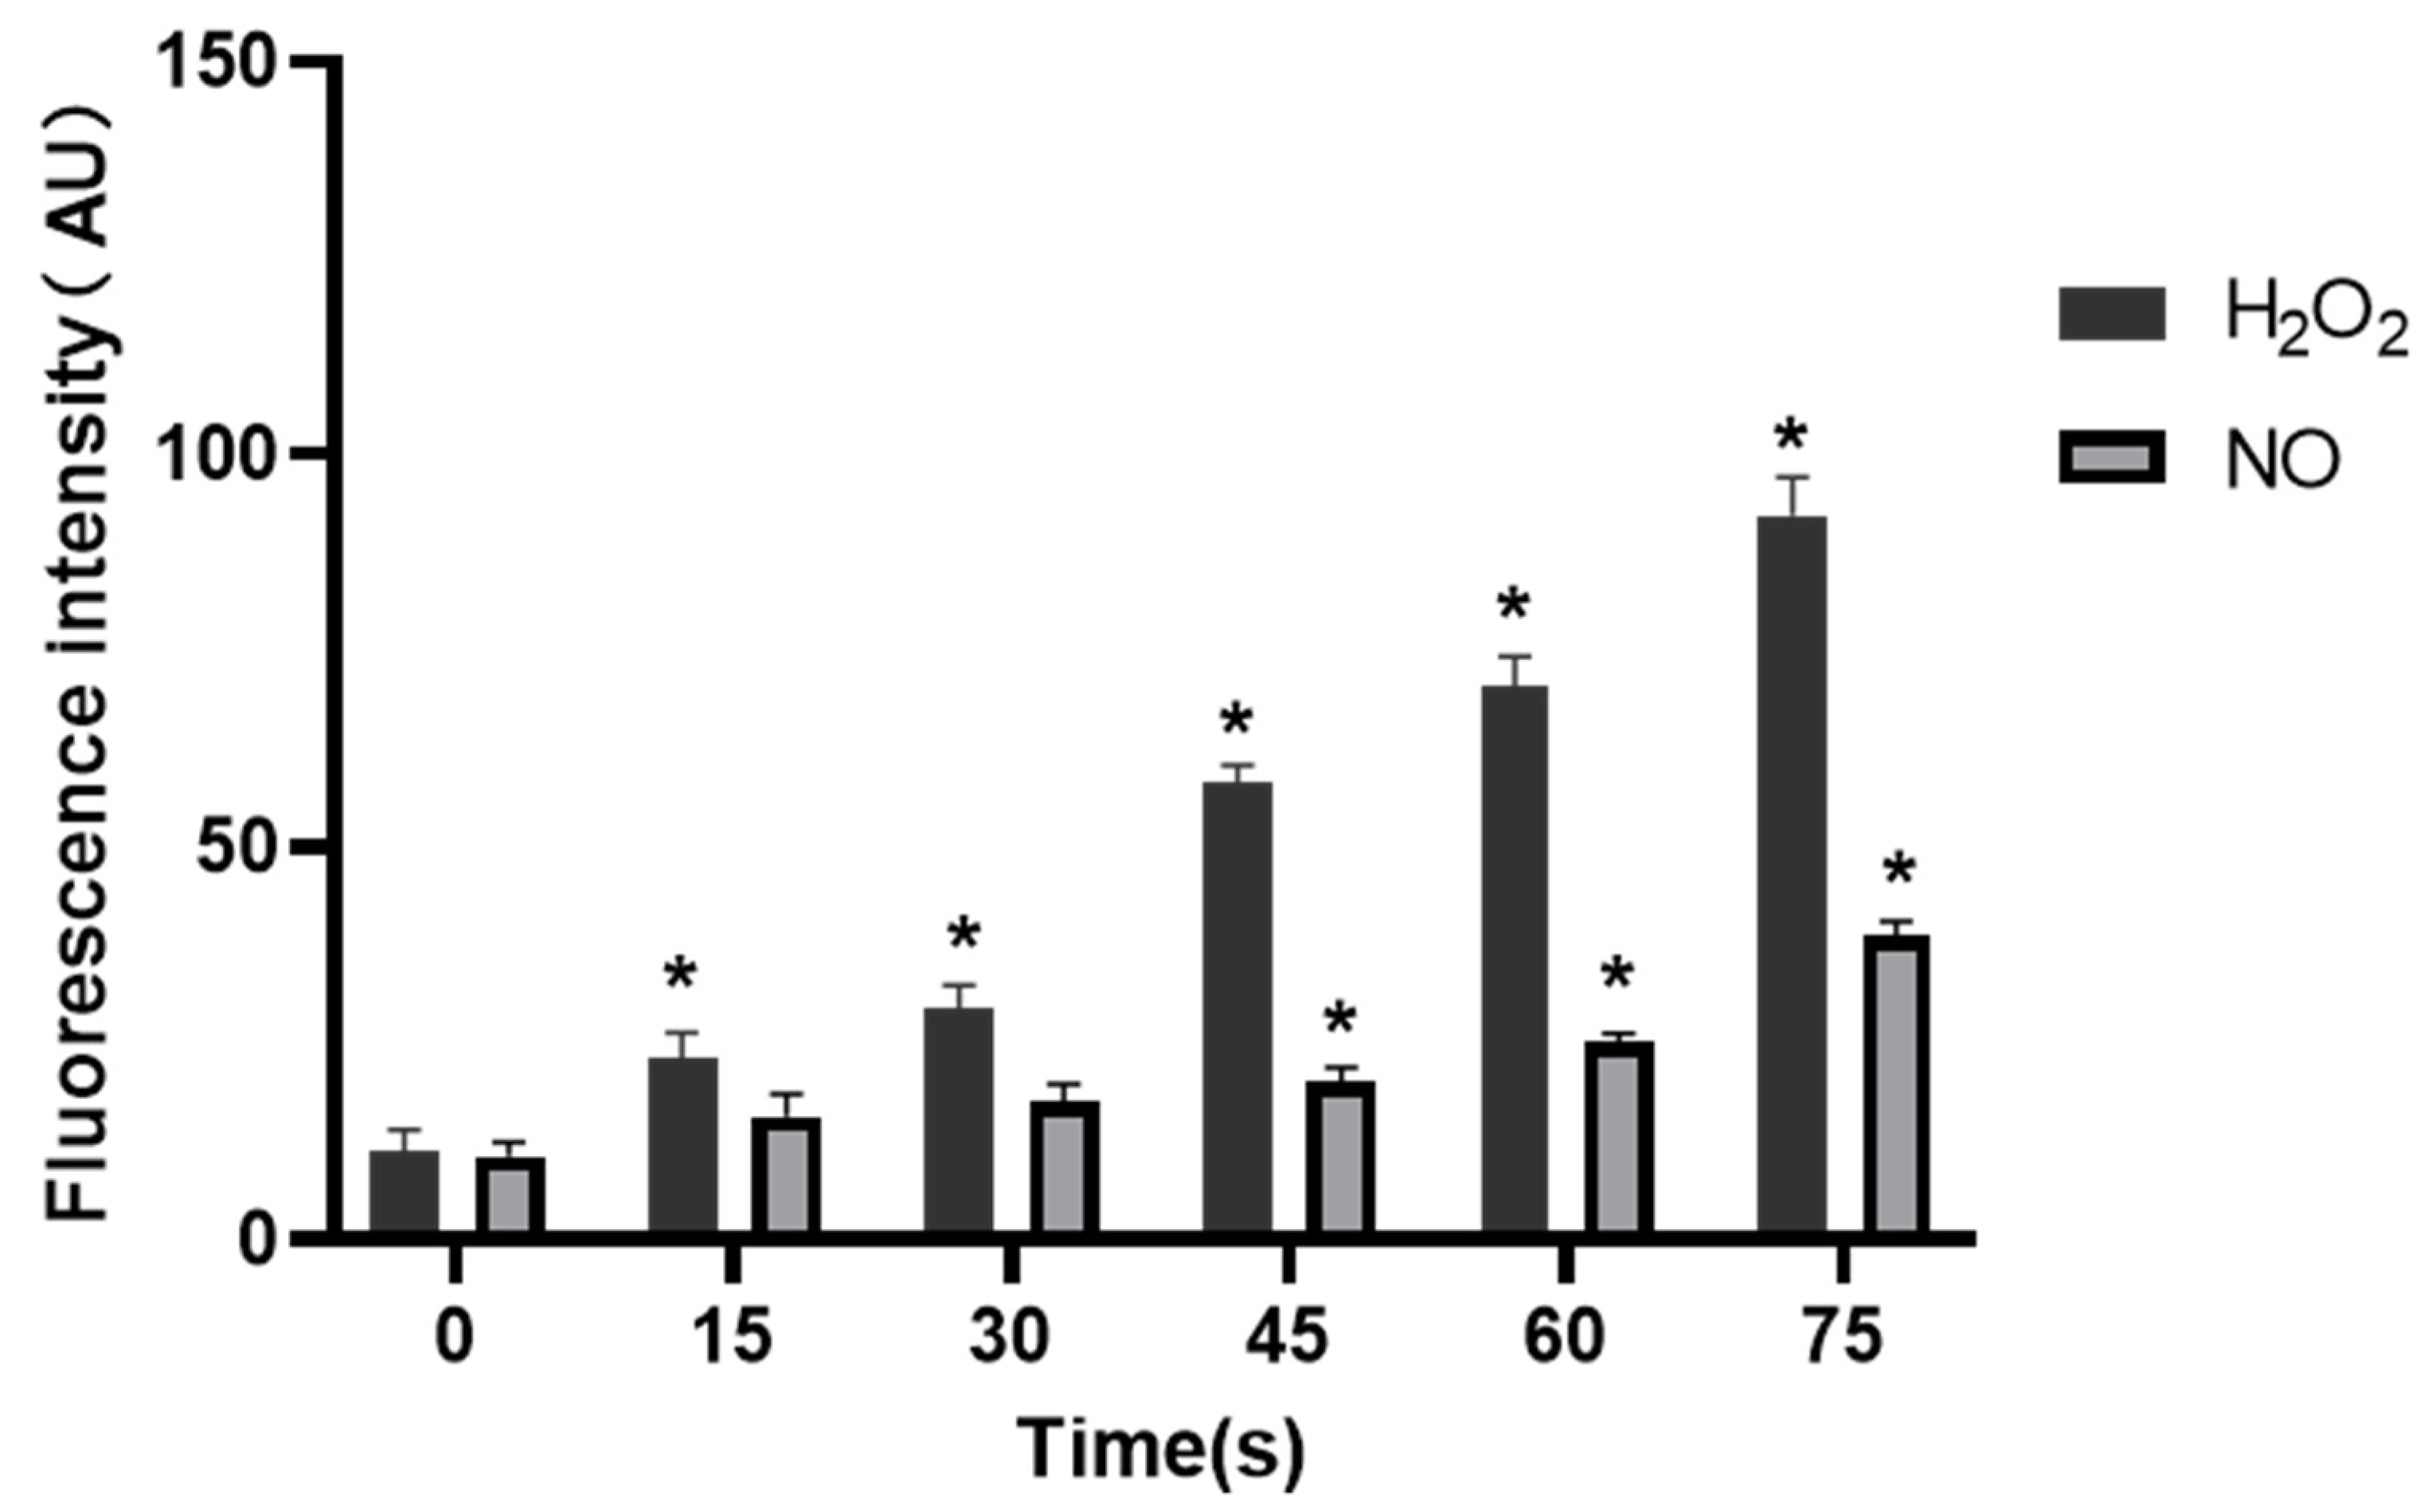
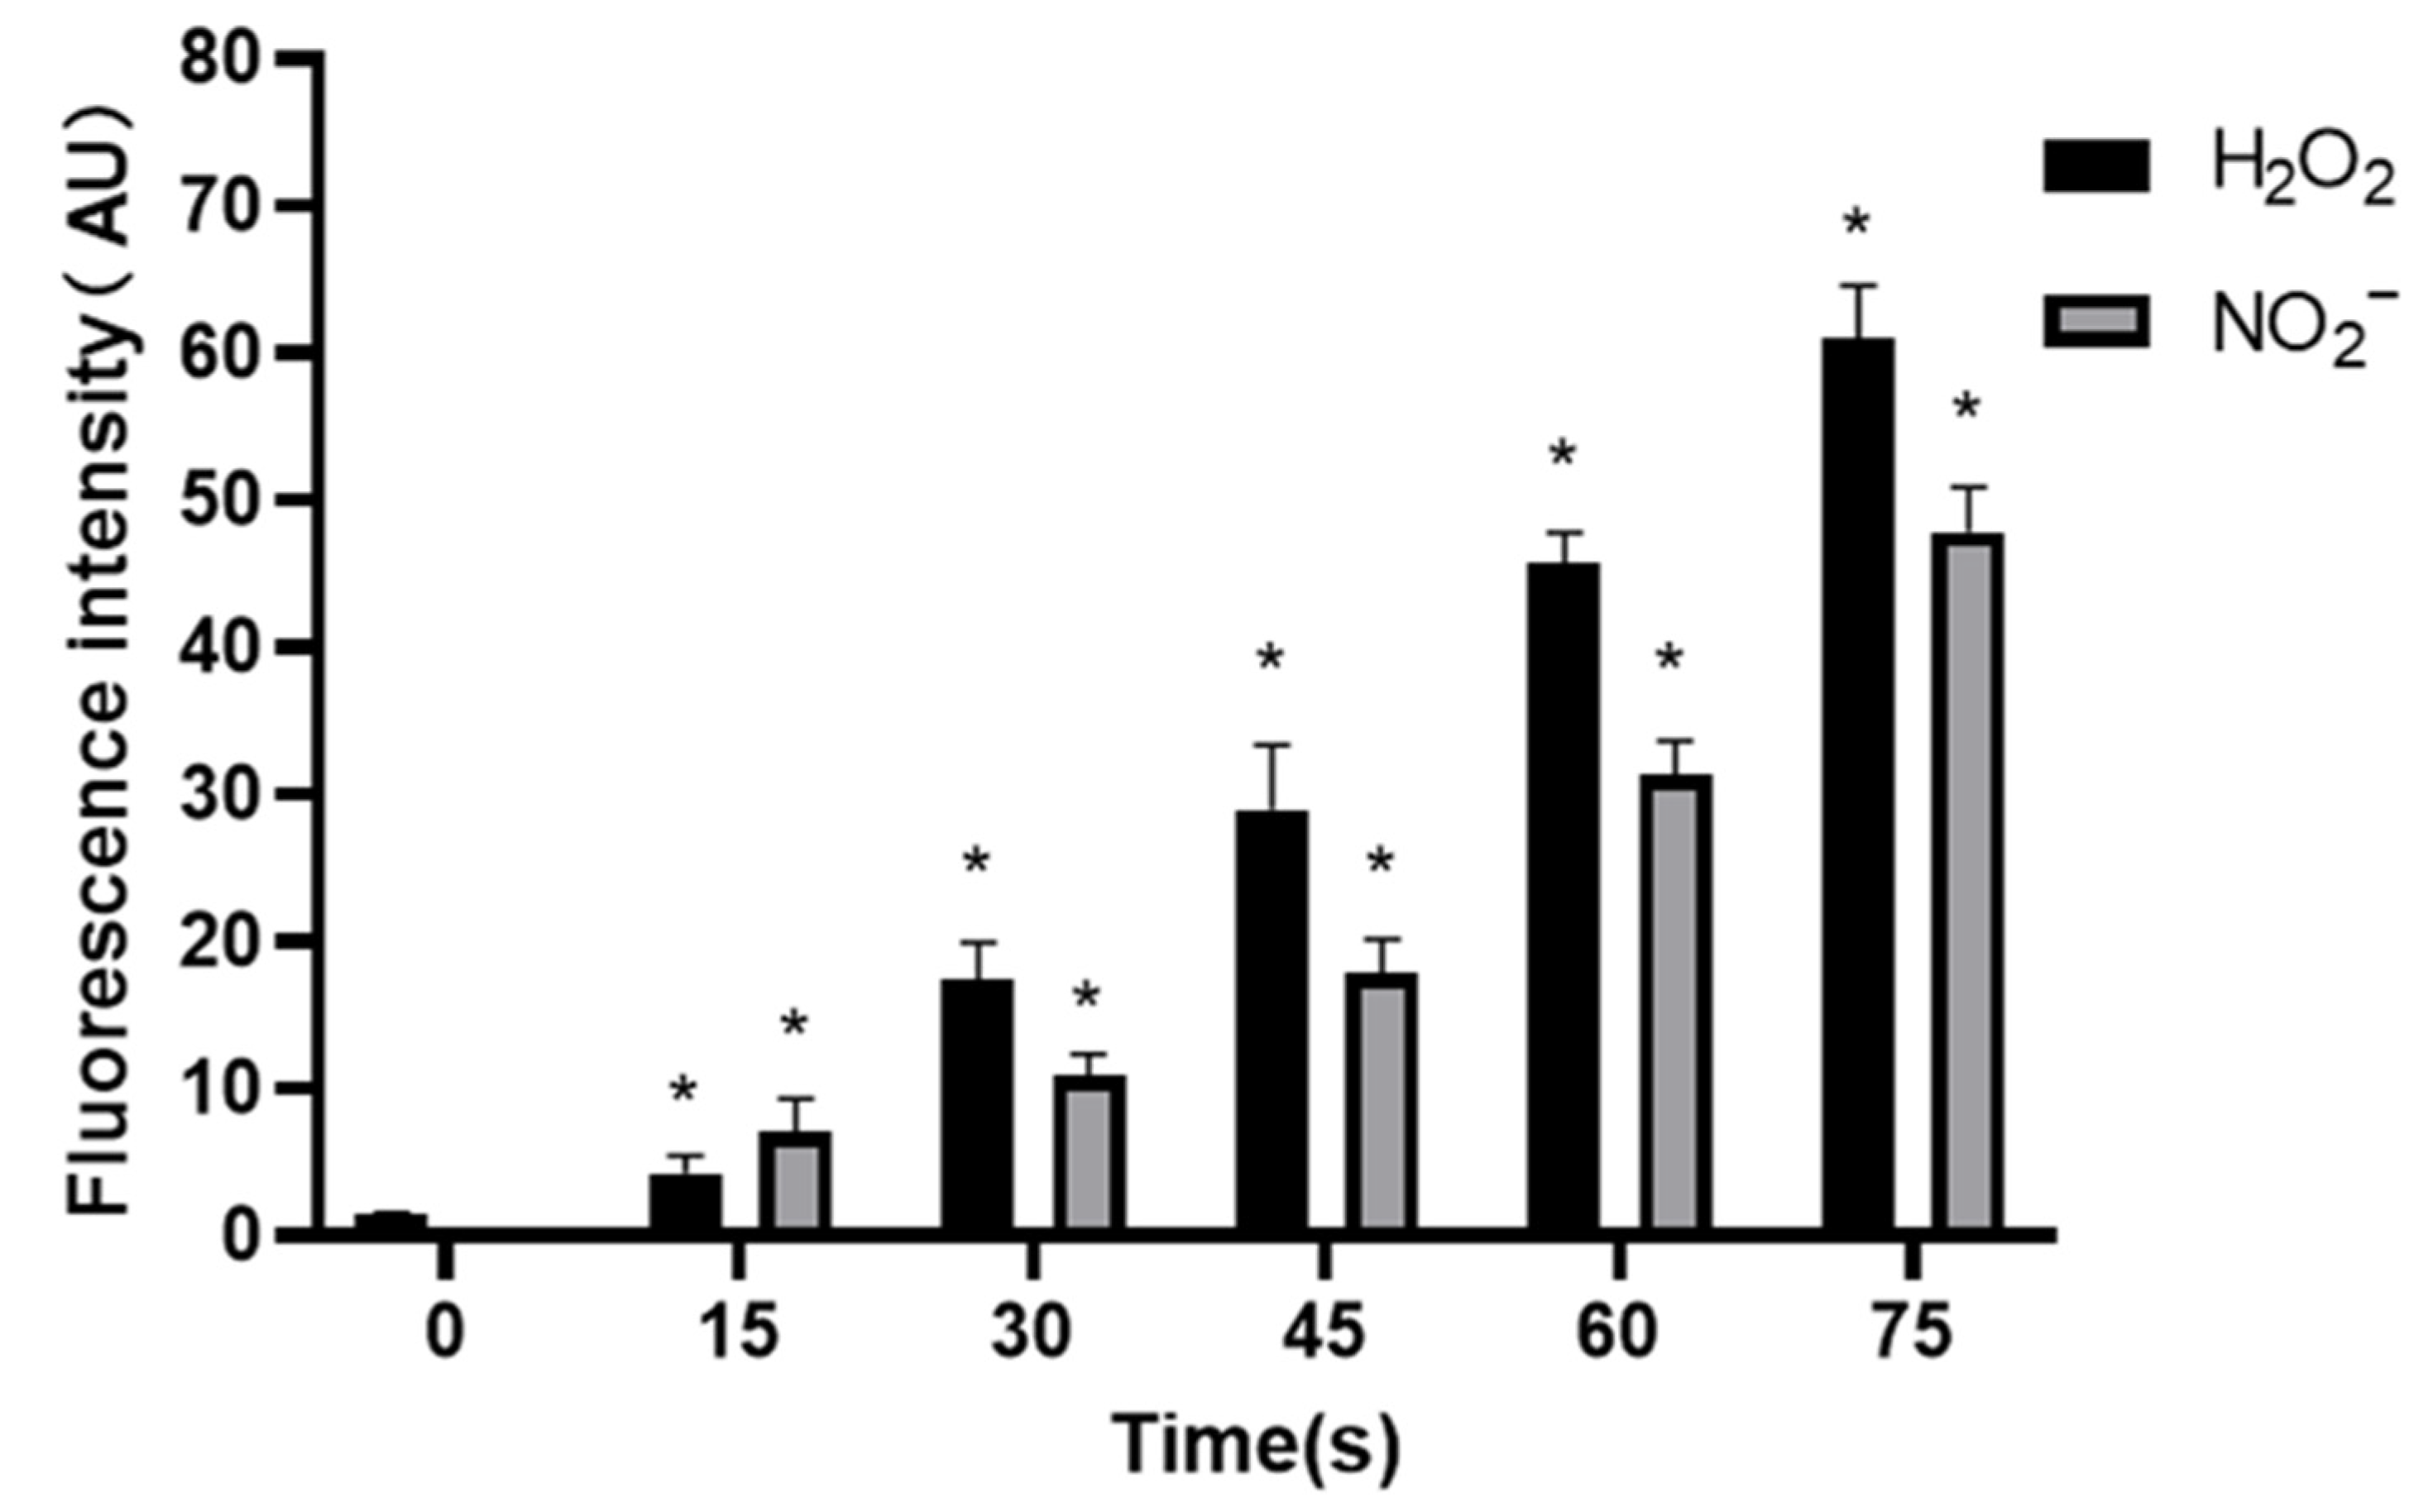
2.10.1. Detection of H2O2 and NO2− Contents in the Cell Culture
Blank well, H2O2 standard liquid well and sample well were set in a black 96-well plate to prepare H2O2 standard liquid concentration gradient, and 50 μL liquid and 50 μL H2O2 probe working solution (MKBio, Shanghai, China) were added to each well. After 30 min incubation in dark at room temperature, the fluorescence intensity was detected with a microplate analyzer, and the standard curve and relation of H2O2 concentration and OD value were fitted to calculate the concentration of H2O2 in PAM. Blank group, NO2− standard solution group and sample group to be tested were set in the black 96-well plate, and the reaction reagent and chromogenic agent in the NO2− detection kit (Njjcbio, Nanjing, China) were added. After 15 min in the dark, the OD value of each well was determined at 550 nm with a microplate analyzer, and the NO2− content in PAM was calculated.
2.10.2. Detection of H2O2 and NO Contents in HUVECs
After HUVECs were cultured with PAM for 24 h, the medium was discarded, and the cells were washed twice with PBS. 20 μM H2O2 probe working solution (MKBio, Shanghai, China) was prepared with pre-cooled PBS, 25 μL working solution was added to each well, and incubated at room temperature in dark for 30 min. 5 μM DAF-FM DA NO probe working solution (Beyotime, Nantong, Jiangsu, China) was prepared with NO probe dilutant, 25 μL working solution was added to each well, and incubated at 37 °C in dark for 30 min. After incubation, the working solution was discarded and the cells were washed with PBS for 3 times. The photos were taken under a fluorescence microscope (Nikon, Tokyo, Japan). The fluorescence intensity was analyzed using ImageJ and statistical analysis was performed.
2.11. Statistical Analysis
At least 3 parallel samples were set for each experiment, and each experiment was repeated 3 times to remove outliers to reduce errors. Excel was used for data analysis, SPSS 20.0 was used for statistical analysis, and Graphpad prism 8.0 was used for graph drawing. Experimental data were expressed as x ± s. ANOVA was used to analyze the statistical differences among different groups. p < 0.05 indicated that the difference was statistically significant.
4. Discussion
The results of MTT and cell cycle experiments in this study showed that PAM produced by LTP treatment for 15–30 s could promote the proliferation and cell viability of HUVECs after 24 h culture, and the proportion of cells in S phase increased. With the extension of LTP treatment, the activity of HUVECs was inhibited by PAM culture for 24 h, and the proportion of cells in S phase decreased significantly. This verified that the change of LTP treatment time could change the proliferation state of cells [
3], which was also consistent with the previous research results that “short-term LTP treatment promoted normal cell proliferation, while long-term treatment inhibited proliferation” [
29]. Kalghatgi et al. [
25] showed that short-term DBD-LTP treatment could enhance endothelial cell proliferation, suggesting that LTP may be a new method of time-dependent factor in endothelium-mediated angiogenesis.
Angiogenesis is a multifactorial, continuous and complex process in which the key steps are the proliferation, migration and differentiation of endothelial cells and the formation, maturation and remodeling of blood vessels [
30]. Therefore, cell migration, adhesion and angiogenesis experiments are important to quantify the angiogenic ability of cells. The results of this study showed that PAM produced by short-term LTP treatment could promote the angiogenesis, migration, infiltration and adhesion of HUVECs. However, PAM produced by long-term LTP treatment inhibited the angiogenesis, migration, infiltration and adhesion of HUVECs. This, on the one hand, is related to the direct inhibition of cell viability by PAM, and on the other hand, the RONS produced by PAM directly inhibits the tube formation and migration ability of cells. For further explanation, we speculate that PAM treatment could gradually decrease connexin 43 (CX43) gap junction expression of HUVECs, which in turn lowers cell migration speed and decreases cell angiogenesis ability. Islam M.M. et al. [
31,
32] found that CX43 is crucial for endothelial cell proliferation, migration and monocyte-endothelial cell adhesion. However, as the generation of LTP is often affected by environmental conditions, the temperature, humidity and gas flow rate (the remaining gas amount in the cylinder affects the stability of gas flow rate) will affect the effects of PAM. Moreover, the differences in cell state, passage times and experimental operation errors make the stability of the effects of 15–30 s PAM on promoting cell migration poor, and there is no significant difference between the results of penetration experiment in 30 s and 0 s groups. Therefore, in future studies, we will consider shortening the treatment interval and optimizing the experimental device, in order to find more accurate discharge conditions that promote the proliferation and angiogenesis of HUVECs.
VEGF is a strong and specific positive promoter that promotes angiogenesis [
33]. bFGF, as one of the most important non-specific angiogenesis factors [
34], can directly interact with HUVECs, promote the proliferation and migration of endothelial cells, and play a positive regulatory role in angiogenesis [
35]. VEGF family members bind to receptors on the cell surface and are activated through dimerization and auto-phosphorylation to trigger the activation of MEK and ERK signal transducers. Activated MEK further phosphorylates ERK1 and ERK2 [
36], which is closely related to cell growth, proliferation, differentiation, and migration. Overexpression of VEGFR directly leads to pathological angiogenesis [
37], and VEGFR mediates different functions in different tissues [
38]. VEGF-VEGFR-2 and MEK-ERK signaling pathways are the most important angiogenic signaling pathways. The experimental results in
Figure 6 and
Figure 7 showed that PAM produced by LTP could promote the secretion of VEGF and bFGF, and enhance the expression of VEGFR-2 and the MEK-ERK signaling pathway when the treatment time was short. However, PAM produced by long-term LTP treatment inhibited the secretion of VEGF and bFGF, and VEGF-VEGFR-2 and MEK-ERK signaling pathways, thereby inhibiting the angiogenesis of cells.
Under normal circumstances, the RONS level of organisms is in a relatively stable dynamic balance, but long-term or high-concentration of external RONS can produce a strong cytotoxic effect on cells [
39,
40]. Studies have shown that exogenous H
2O
2 can inhibit angiogenesis induced by bFGF or VEGF [
41]. High concentration of exogenous NO
2− itself has cytotoxicity and strong oxidation, which can make cell lipid peroxidation, inhibit cell activity and inhibit angiogenesis. The effects of RONS on different types of cells vary depending on the type of cells, the environment they are in, and the response and tolerance of cells to RONS [
42,
43]. RONS are important components of LTP to exert the biological activity. According to the results in
Figure 8 and
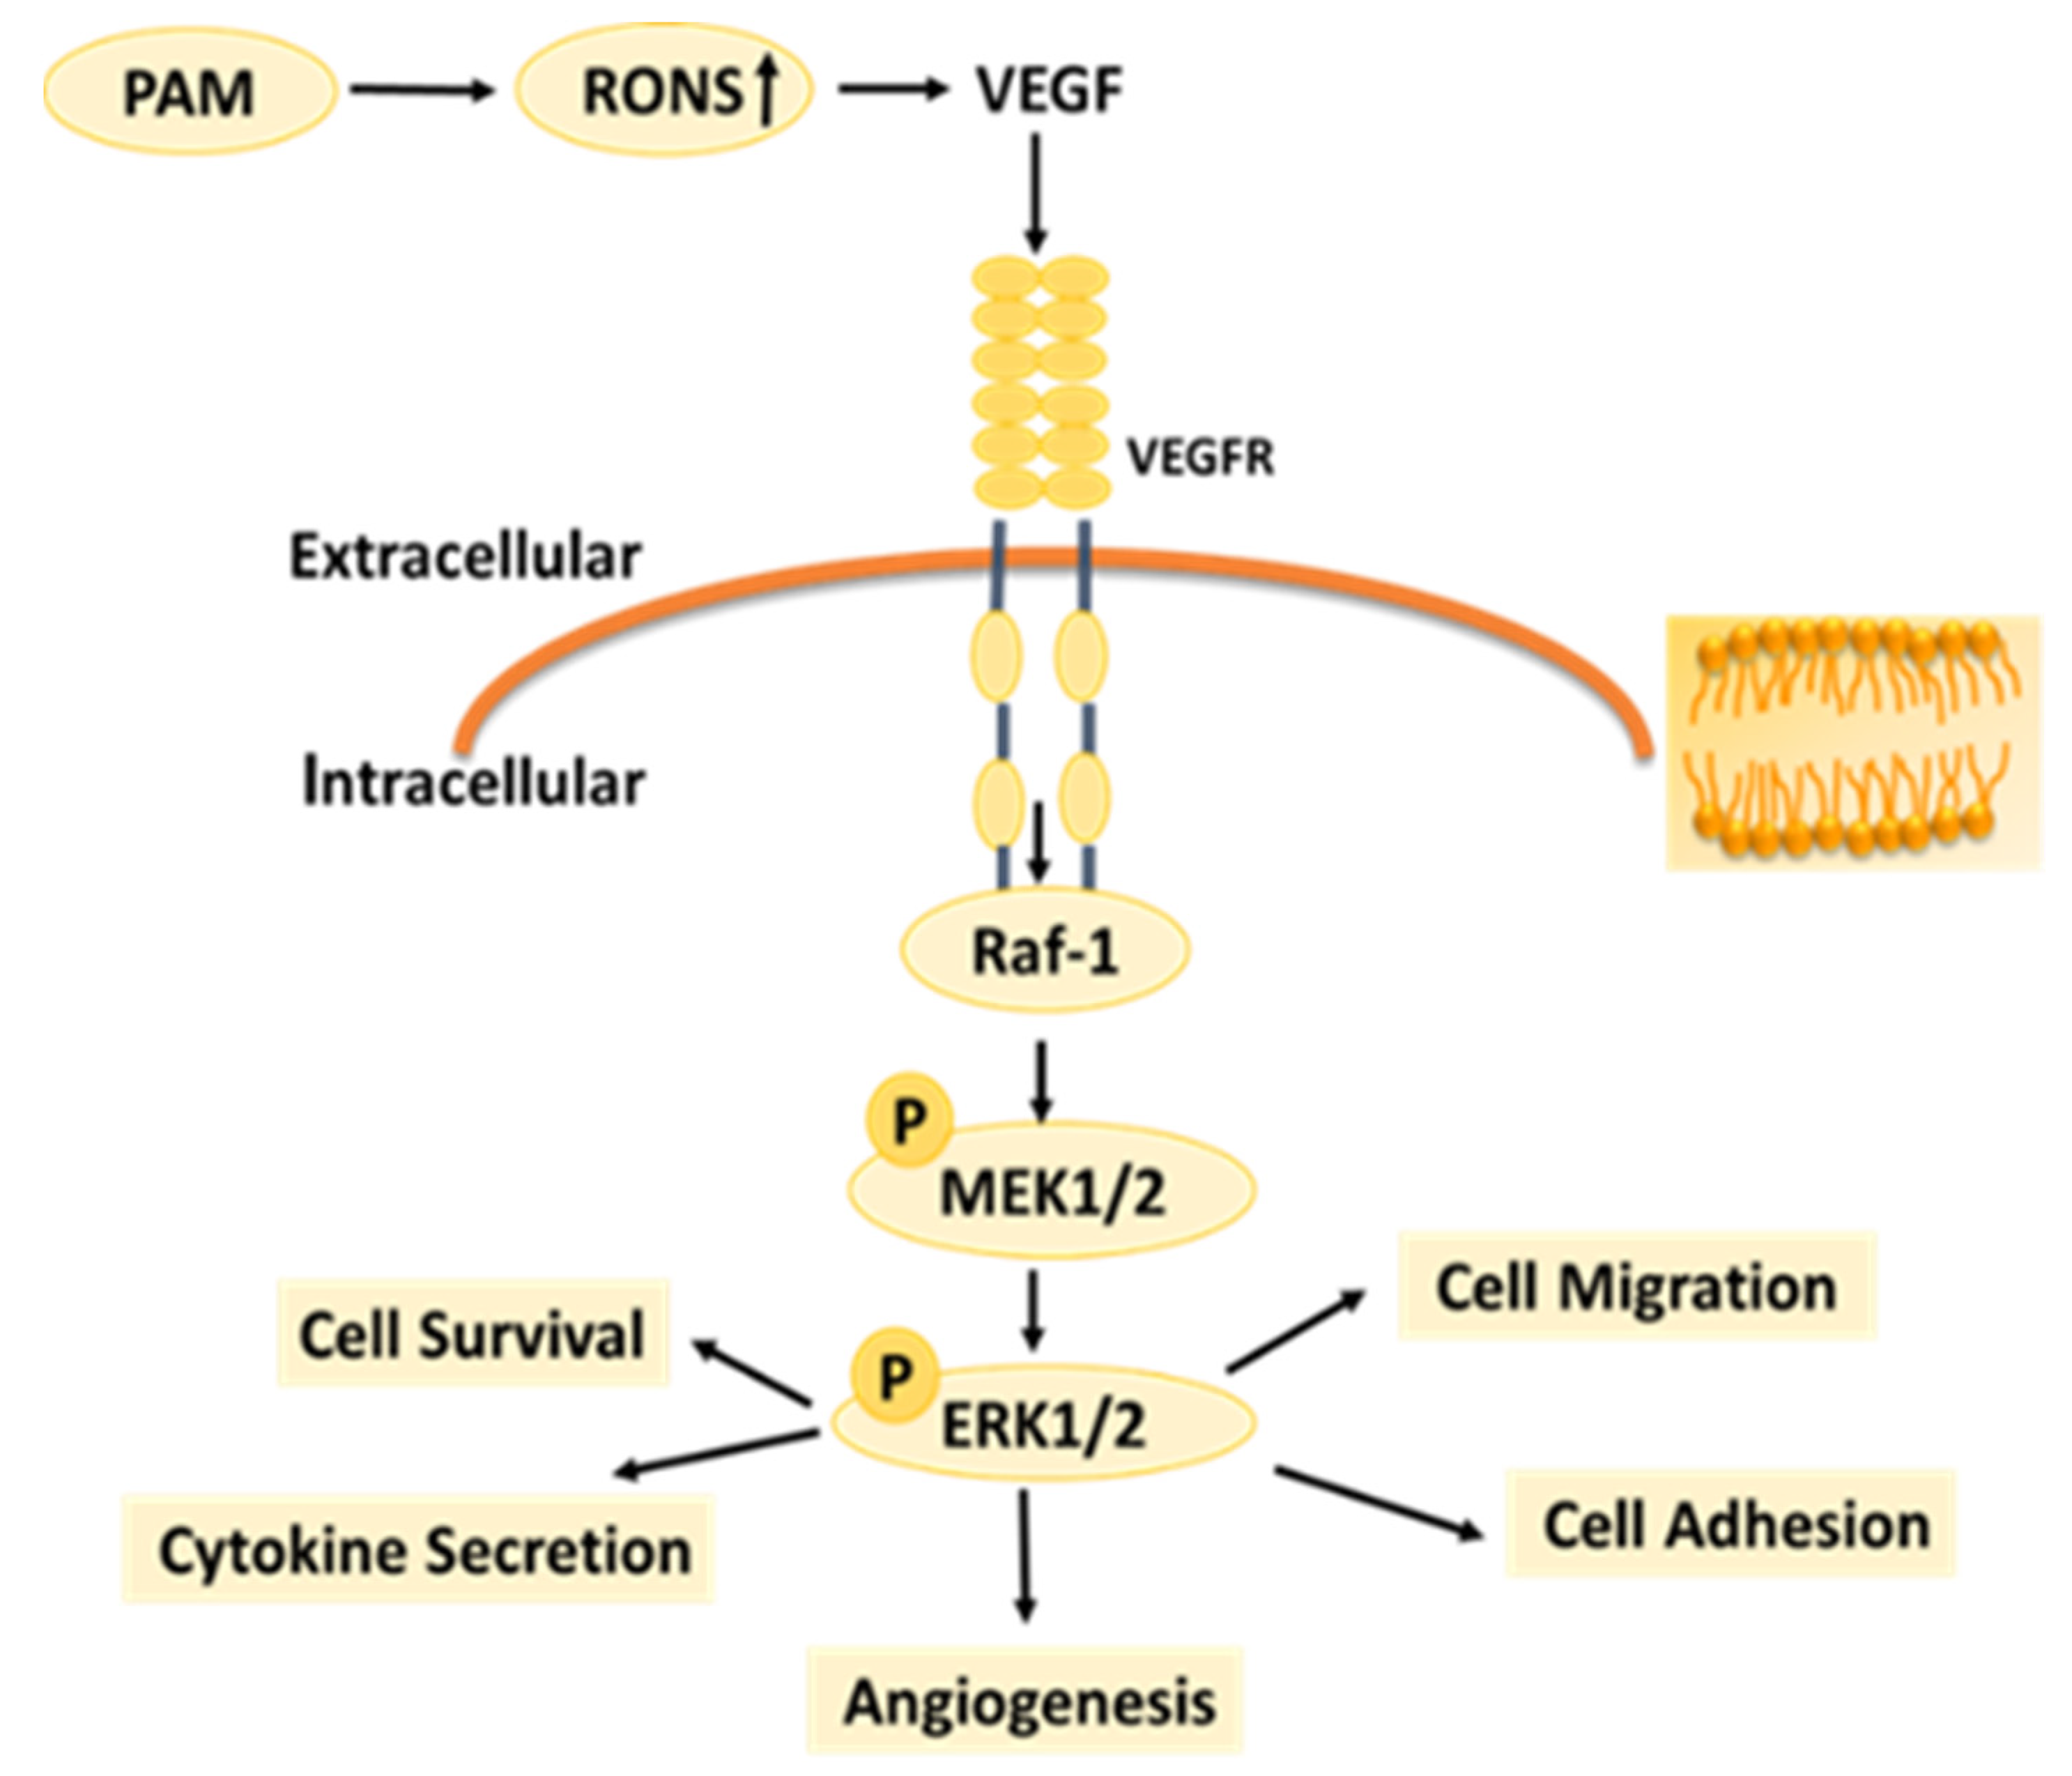
Figure 9, as the LTP treatment time extended, the RONS concentration in PAM and cells gradually increased. The results of this study also confirm that LTP has the characteristics of “short-term treatment promoting cell activity and angiogenesis, while long-term treatment inhibiting cell activity and angiogenesis,” mainly through LTP-generated RONS. The possible mechanism of PAM affecting HUVECs angiogenesis is shown in
Figure 10. PAM obtained by LTP treatment for 15–30 s can promote the proliferation and angiogenesis of HUVECs, which suggests that we can promote angiogenesis by controlling and quantizing ROS level in cells through precise LTP production conditions. PAM obtained by long-term LTP treatment can inhibit cell proliferation, migration, adhesion and angiogenesis, which provides a new idea for the application of PAM in the treatment of tumors.
5. Conclusions
PAM produced by short-term LTP treatment can promote the proliferation, angiogenesis, migration and adhesion of HUVECs, while PAM produced by long-term LTP treatment can inhibit the proliferation, angiogenesis, migration and adhesion of HUVECs. The mechanism may be that PAM treatment changes the content of RONS in cells, affects the expressions of VEGFR-2 and P-MEK, the key proteins in the VEGF-VEGFR-2 signaling pathway, activates or inhibits the VEGF-VEGFR-2 signaling pathway, and finally affects HUVECs activity, secretion of VEGF, bFGF and other cytokines, and the migration, adhesion and angiogenesis.
Next, we will optimize the LTP discharge device, improve the in vivo and in vitro experimental results, and further verify the effects of PAM on cell angiogenesis and treatment conditions. Also, we will explore in depth the impact and mechanism of PAM on HUVEC gap junctions, adhesion, and tight junctions. Meanwhile, we will use HUVECs co-cultured with various cancer cells to explore the effects and mechanisms of LTP on malignant tumor angiogenesis in order to lay a theoretical foundation for PAM to promote wound healing and inhibit tumor angiogenesis.


