1. Introduction
The significance of human capital and physical capital in economic development has been discussed and evidenced thoroughly in the extant literature. In particular, since the modern human capital theory was initially formulated by Schultz [
1] and Becker [
2], the study of the contribution of human capital to economic growth has attracted extensive attention both in academia and in the real world [
3,
4,
5]. It has become a consensus that human capital has significant positive effects on economic growth, but its estimated effects are quite heterogeneous according to relevant empirical studies [
6]. Many countries and regions have invested heavily in education, but the goals assigned to educational development by governments have not always been achieved, especially in developing countries. This indicates that the effects of educational investment may vary at different phases of economic growth, and that the heterogeneous impacts are worthy of further empirical scrutiny.
Despite both physical and human capital being regarded as decisive factors promoting economic development, as evidenced by many relevant theoretical and empirical analyses, the comparison of their impacts on economic development still needs to be explored in the global context. In particular, with the increasingly intensified trade conflicts as well as weak and uncertain business investment in recent years, coupled with the huge shock of the COVID-19 pandemic, it is widely acknowledged that global economic growth is facing the risk of long-term stagnation. Under such circumstances, we urgently need to identify the roles of human and physical capital so as to understand the fundamental driving force of economic growth.
As for the measure of economic growth, gross domestic product (GDP) or gross national product (GNP) are usually used to denote the increase in the total economic volume of a country or region due to various factors of production over time. Apart from this quantity aspect, various factors including environmental conditions, life expectancy, and income inequality have been taken into consideration regarding the quality dimension of economic development [
7]. Green GDP, for instance, by considering the environmental influence (such as energy depletion and environmental pollution) together with the economy, can reflect the sustainability of economic growth to a certain extent. However, there is a lack of studies addressing the effects of human and physical capital on the quality facets of economic development, particularly the sustainability of growth in the long term. In this respect, our study mainly aims to compare the contributions of physical capital and human capital to both the quantity and quality dimensions of economic development in order to better understand the attributes of various capital elements as well as to provide empirical evidence for optimizing capital allocation, bolstering green energy development, and promoting sustainable economic growth.
2. Literature Review
There has been a growing body of research on the contribution of physical and human capital to economic development, and this section will review relevant studies on both the research methods and findings.
2.1. Review of Research Methods
The Solow model (neo-classical growth model) has become the most commonly used analysis framework when studying economic development, and its basic form is as follows:
where
Y refers to the economic output and the notations
K,
L, and
A stand for capital, labor, and technological development, respectively [
8]. However, this traditional form did not distinguish between human capital and physical capital, and it was difficult to clearly explain the essential reasons for technological progress and increasing returns to the economy. In this way, scholars have continuously developed the Solow model based on the human capital theory. For example, Mankiw, Romer, and Weil [
5] introduced human capital as an independent factor of production into the Solow model. They established an augmented Solow growth model (the Mankiw–Romer–Weil version) including accumulation of human capital, which was measured by the ratio of the working-age population in secondary school. Furthermore, they proved that there was a positive correlation between human capital and economic growth with empirical analysis by cross-country data. Lucas [
3] further distinguished the external effects of human capital from its internal effects and realized that human capital increment, rather than human capital stock, was the decisive factor for industrial development and sustained economic growth. In general, the Solow model has been extensively developed and used in the study of economic growth.
Prior literature mainly estimated the output elasticities of physical capital and human capital by the income-shares method and regression analysis. The income-shares method regarded the ratio of capital income to GDP as the output elasticity in a perfectly competitive factor market with constant returns to scale [
9,
10]. Although the calculation of the income shares was simple, its premises and assumptions deviated greatly from realistic situations, and it was often not practical due to the unavailability of relevant statistical data. In contrast, the regression analysis method has been more commonly used, and the Cobb–Douglas production function (hereinafter referred to as the C–D function) is widely acknowledged because of its simple form, as well as the easy estimation and clear interpretation of the parameters concerning their economic significance. The C–D function was first proposed by Solow and Swan [
11] in order to deal with the "knife-edge” equilibrium in the early Harrod–Domar model so that capital and labor can change disproportionately [
12,
13]. They relaxed the assumption that the two are irreplaceable and introduced technological progress to establish the Solow model. However, the C–D function strictly assumes that the elasticity of substitution between elements remains unchanged and the return of scale is constant, which has been controversial in dynamic macroeconomics. Later, many C–D production functions have been developed in econometrics with more complex structures in order to change the limitations of the C–D function, such as the CES production function model [
14], the VES production function model [
15], and the super-logarithmic production function [
16]. Some scholars took further steps in estimating the dynamic characteristics of output elasticities in a certain period rather than analyzing the static elasticities, using the structural time-varying elastic production function [
17], the state–space model [
18], and popularization of the gradient algorithm [
19], etc., although their applicability and theoretical basis were not widely recognized. These extended models introduced new assumptions and new parameter estimation methods to improve the accuracy of the coefficients to a certain extent, but they failed to elaborate the economic meaning of elasticity under many circumstances. The C–D production function, which minimizes the mean and variance estimation errors, has a relatively solid theoretical foundation instead. Thus, this paper employed the classic C–D function as the basic framework based on previous relevant studies.
2.2. Review of Research Findings
Studies on the role of human capital and physical capital in economic growth, particularly in output elasticity, have been conducted from various perspectives. Most pertinent research, for instance, compared the elasticity of output concerning human capital and physical capital, and predicted the durability of their contribution to economic growth. In general, the estimated elasticity of output of human capital was in the range of 0.3 to 0.8, whilst the output elasticity of physical capital varied from 0.2 to 0.6 [
20,
21,
22]. On average, economic development was more sensitive to changes in human capital than to changes in physical capital [
23]. With regard to the persistence of their effect, relevant research indicated that human capital had a continuous pulling effect on economic growth, while physical capital only promoted economic growth in the short term [
24].
Furthermore, there were studies focusing on how the relationship between physical and human capital affected economic growth. Some analyzed the elasticity of substitution between physical and human capital, and insisted that the elasticity of substitution served as a key factor in economic growth [
25]. Others investigated the coordination between physical and human capital. For example, Lucas [
26] stated that a certain level of economic growth can be maintained if physical capital and human capital can grow in a coordinated manner; while Pablo et al. [
27] pointed out that the diminishing marginal effect caused by continuous capital investment can be reduced when an increase in the output elasticity of one type of capital drives the output elasticity of another type.
One strand of literature explored the heterogeneity of the contribution of physical and human capital to different economies. Mamuneas et al. [
28] found that the United States had the highest human capital elasticity (0.29), while Spain had the lowest (0.13). The human capital elasticity of middle-income countries (0.11) was lower than that of low-income countries (0.16), and the elasticity of human capital was positively correlated with the openness of a nation. Some studies in China also showed that the elasticity of human capital in the eastern regions was significantly greater than that in the western regions, while the elasticity of physical capital is much higher in the west [
29,
30].
Additionally, most studies employed traditional GDP to represent economic growth, which failed to take into account the contribution of both total factor productivity and factor inputs such as resources and energy. The concept of green GDP has received growing attention, but considering the difficulty in its measurement, there is still in urgent need to explore more sophisticated calculations and to conduct more relevant empirical research [
31,
32].
In view of the above literature analysis, an important gap in the literature lies in the comparison of the contribution over time of human capital and physical capital to economic development worldwide. Furthermore, most relevant studies measured economic development with GDP, which mainly reflects the quantity of economic growth while overlooking the sustainability of economies. Our study, in this way, aims to fill these gaps and explore the differential role of physical and human capital in both the quantity and quality of economic growth. This paper is designed to mainly address three questions: (1) How different are the impacts of physical and human capital accumulation on economic growth? (2) Are there any differences of the roles of physical and human capital play in the quantity and quality of economic development? (3) How do the contributions of physical and human capital to economic development vary among countries and regions at different economic phases? Based on the prior literature, we will first build the economic growth model to compare the impacts of physical and human capital on economic development. Apart from the traditional GDP as the most commonly used measure for economic growth, green GDP, taking the resource consumption and environmental damage in production into consideration, is regarded as an indicator of the quality dimension of economic development in our study. In addition, given that the impacts of physical and human capital on economic growth might be varied for economies at different levels of development, we will explore the heterogeneity of the output elasticities of physical and human capital using the quantile regression methods.
3. Research Design
3.1. Modeling the Impacts of Physical and Human Capital on GDP and Green GDP
The widely used Mankiw–Romer–Weil neoclassical growth model regards human capital as well as the traditional capital and labor as the core elements for economic growth, with each playing a relatively separate role. In this way, we introduced the human capital variable (H) into the Solow model, and built a log-log regression as follows:
where
refers to the economic output of country
i in the year of
t. The three independent variables
,
, and
stand for the capital, labor, and human capital of country
i in year
t, respectively, and the variable
A represents technological development. The sum of coefficients in this equation
α +
β +
γ can be equal to 1 (indicating constant returns to scale), greater than 1 (increasing returns to scale), or less than 1 (diminishing returns to scale). Since our study aimed to take not only the traditional quantity of economic growth but also the quality dimension of economic development into consideration, we performed the regressions of both the traditional GDP and green GDP on physical and human capital at the total and per capita levels, respectively, and established the following models:
It should be noted that the variable green GDP here does not refer to the real green output, but is an indicator considering the efficiency of energy utilization and environmental damage. It is the product of the traditional GDP times the rate of energy use times the proportion of renewable energy, which represents the domestic productivity, energy efficiency, and environmental preservation of a country or region as a whole [
31]. Although the absolute value of this variable has little practical meaning, it reflects the overall scenarios of economic development and environmental preservation to some extent. Moreover, we employed the fixed-effect models after the Hausman test [
33].
The above analysis has so far been more concerned with averages, focusing on the impact of changes in physical and human capital on the mean values of economic growth while failing to consider changes in the continuous distributions of GDP and green GDP. Indeed, physical and human capital are both closely related to economic development, yet their roles in developed and developing countries may be heterogenous. The least-squares regression models analyze the conditional mean, yet it is susceptible to interference from the extreme values of certain variables, and cannot measure the impact of changes in the physical and human capital at different stages of economic development. Thus we chose to use the quantile regression model proposed by Koenker and Bassett [
34], which describes the changes of regression parameters at different quantile levels so as to reflect the relationship between variables more accurately and yield more robust results. We employed the deciles that divide the population into ten parts, and explored the heterogeneous effects of the two factors on economies with different development phases.
3.2. Data Description and Measurement
The data of this study were mainly from the World Bank and the United Nations Development Program (UNDP). We gauged the quantity of economic output by the traditional GDP (constant 2010 USD); while the concept of green GDP was employed to measure the quality of economic development, and the metrics of green GDP have been elaborated before, and equals the traditional GDP multiplied by both the GDP produced through consuming per unit of energy resources and the proportion of the renewable energy of the total [
31]. Physical capital was measured by the gross capital formation (constant 2010 USD), including investment in fixed assets of the economy and net changes in the level of inventories, such as plants, machinery, infrastructure, and land. Labor refers to the total labor force, including all groups of 15 years and older that meet the definition of the economically active population set by the International Labor Organization. The study uses education as the proxy variable for human capital since education serves as the main way to form human capital, which can also exclude the influence of the price factor of human capital measured by currency [
35]. One of the key dimensions of the Human Development Index (HDI) developed by the UNDP measures access to education by expected years of schooling of children at school-entry age and mean years of schooling of the adult population, on the basis of which our study calculated the stock of human capital with the average years of schooling derived from HDI multiplied by the total number of people over 25 years old. The analysis at the individual level took the size of the national population into consideration, and the per capita variables were GDP, green GDP, physical capital, labor force, and the human capital mentioned above divided by the country’s total population. In sum, the variable of education was collected from the UNDP datasets, while other relevant variables all came from the World Bank. Given that the World Bank database has not updated information such as energy consumption per unit of GDP and the proportion of renewable energy since 2015, we mainly selected the data during the period of 1990 to 2014. Furthermore, the 189 nations and regions in the World Bank’s public database do not exactly match the 193 countries in the UNDP database. After screening, a total of 143 countries and regions were finally retained after matching the two datasets and excluding countries that strayed from the general economic development paths due to wars or other reasons.
4. Results
4.1. Descriptive Statistics
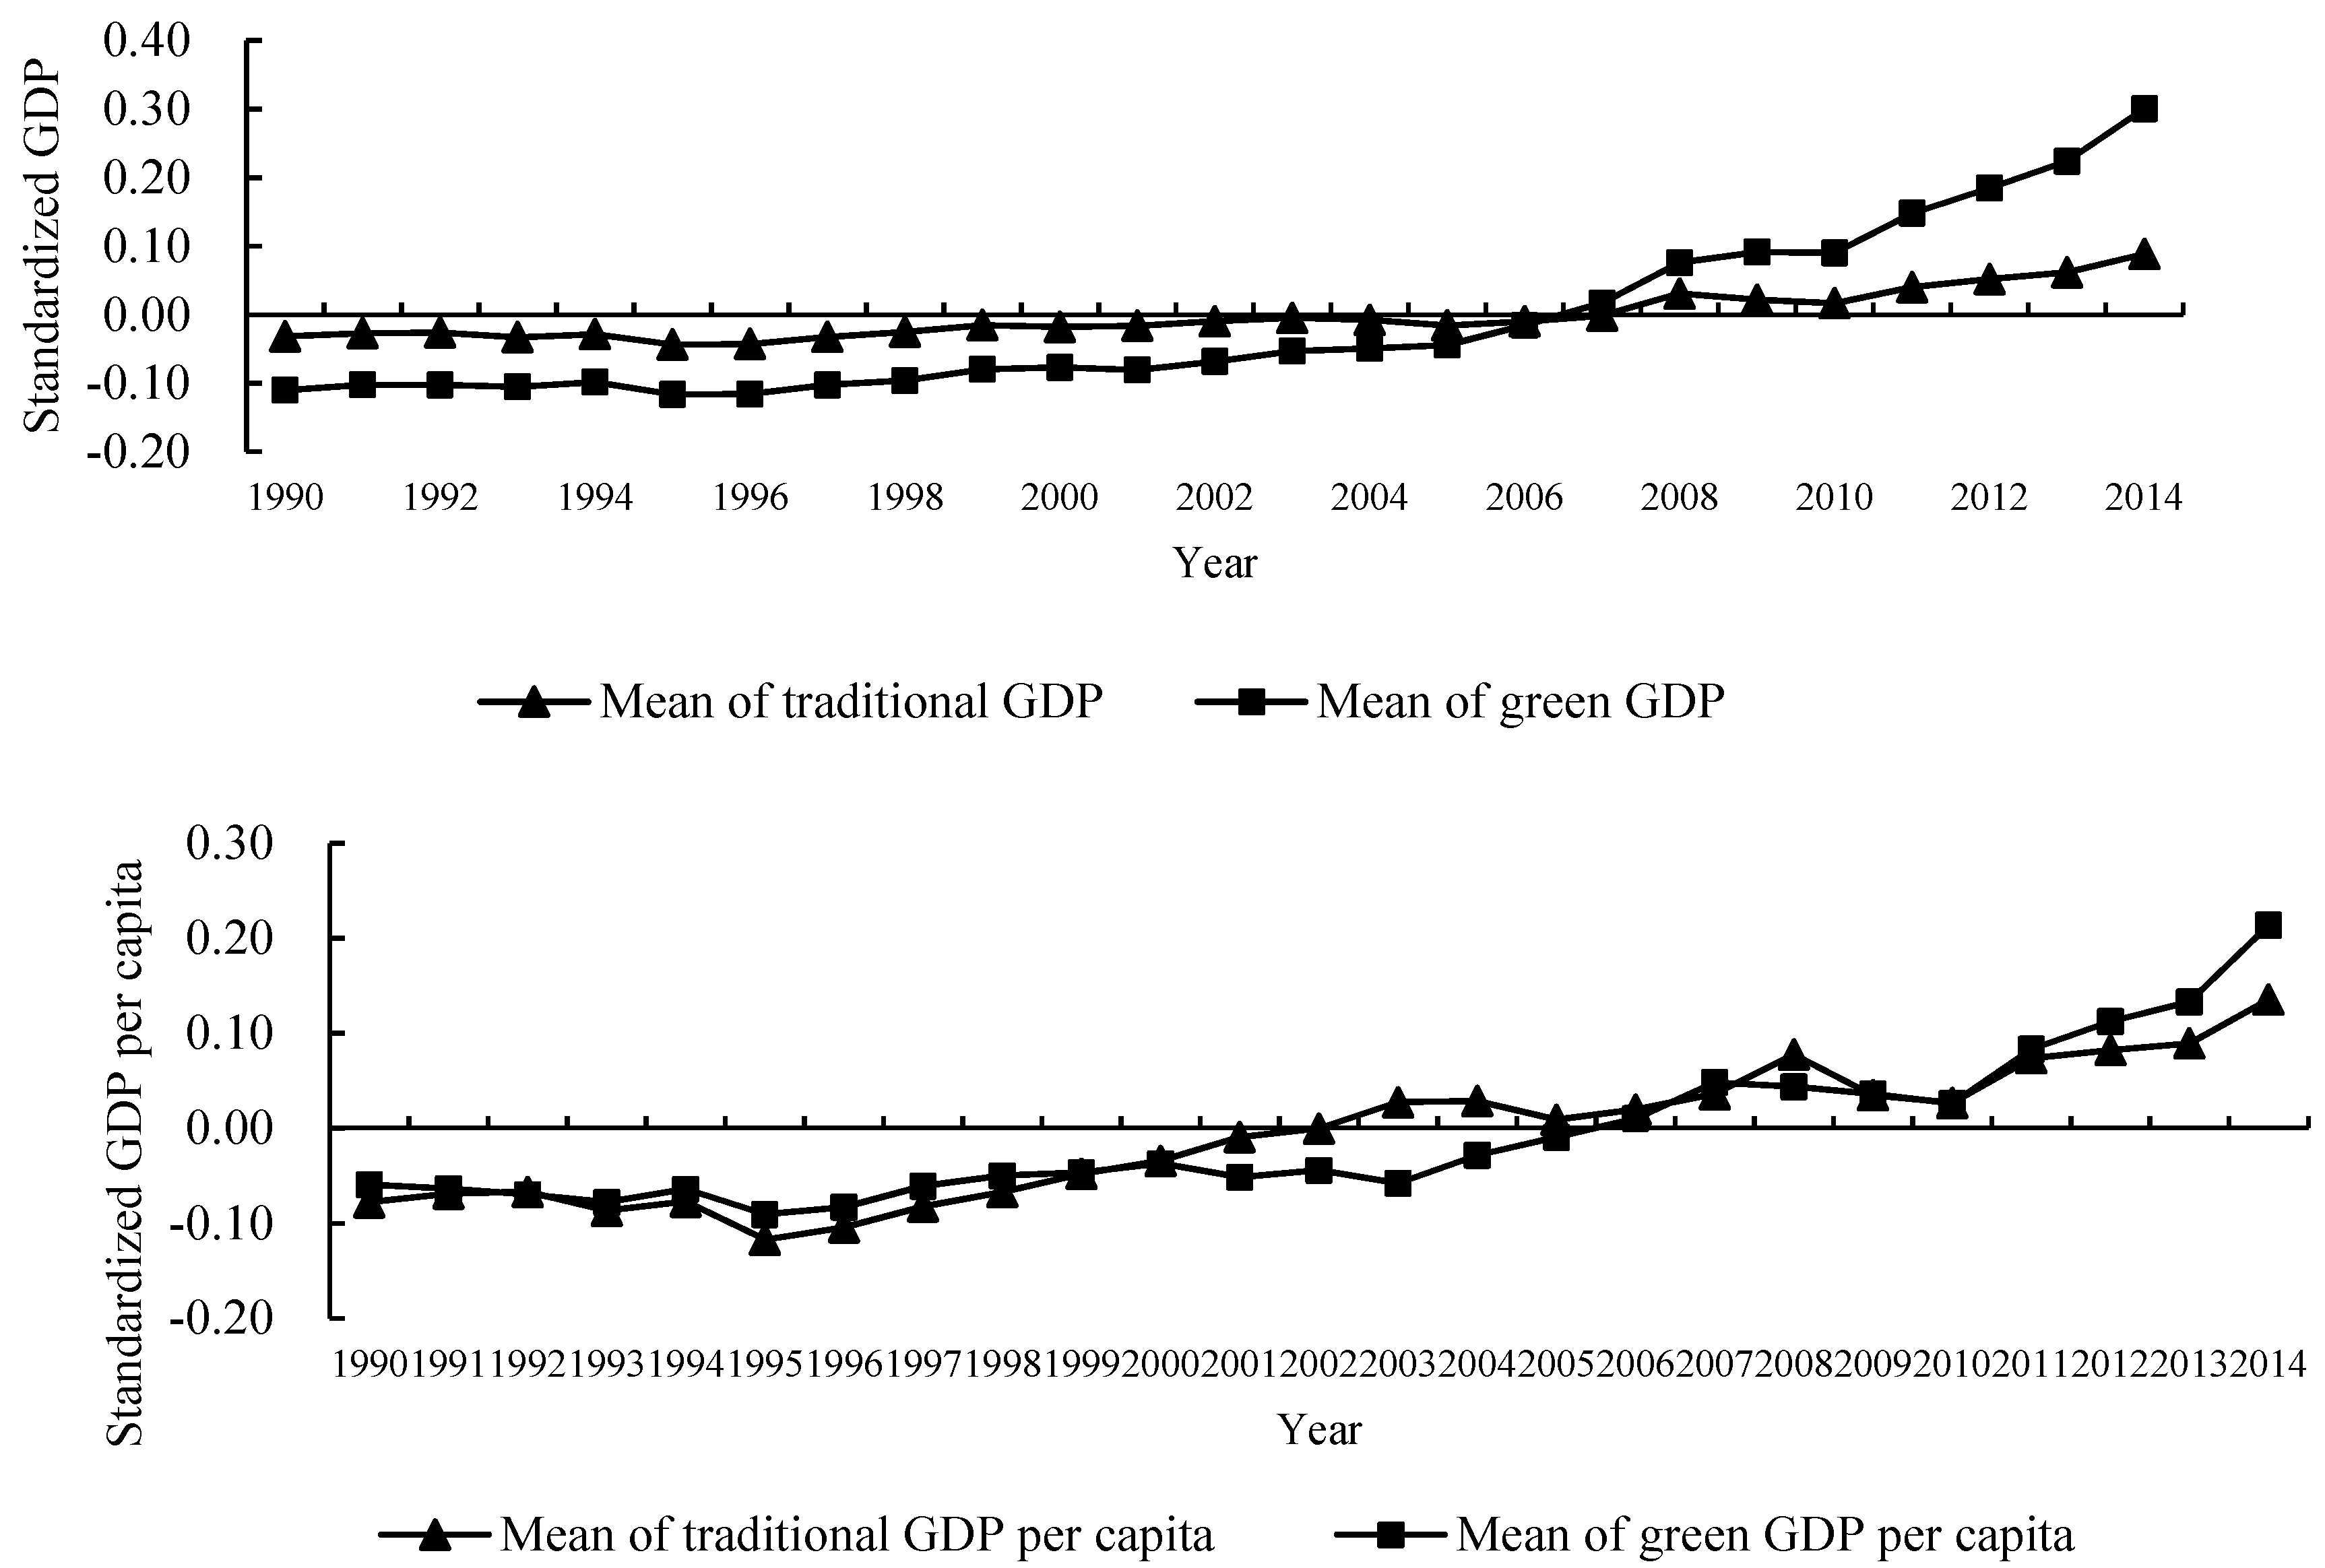
In order to compare the green GDP and traditional GDP of countries and regions in our sample using descriptive statistics, we used the normalized values of the green GDP and traditional GDP to make the comparison clearer. The standardized GDP and green GDP both have lognormal distributions with a mean of 0 and variance of 1.
Figure 1 shows the changes in the means of traditional GDP and green GDP at the aggregate level and per capita level after standardization, which all experienced a steady increase from 1990 to 2014. Specifically, the average traditional GDP at the total level overtook the average green GDP before the year 2006 and their changing trends were relatively similar, indicating that the global economic development over this span was not, on average, environmentally friendly. After that, the growth rate of the green GDP has soared and even exceeded the traditional GDP, reflecting that the world economy has, on average, become green since 2006. This can be attributed to technological development to a certain extent. The technology of energy conversion in the early stage may not be mature, while the efficiency of energy use has been improved with technological advancement and the green economic development has thus been greatly improved compared with the traditional economic level. The per capita level of the means of green GDP and traditional GDP grew alternately until 2010, after which green GDP per capita completely surpassed traditional GDP per capita, indicating that the economic development of countries and regions in the sample has become greener on average in recent years. Considering the policies on environmental governance and energy conservation, the international community signed a series of international treaties in the early 1990s to protect the ozone layer such as the Vienna Convention in 1985 and the Montreal Protocol in 1987, which stipulated that developed countries will phase out more than 40 controlled substances in 1996 and developing countries in 2010. This can explain, to a certain extent, why the global economy became greener on average after the year 2010 at the per capita level.
Table 1 presents the means of the global stock of physical and human capital at both the total and per capita level over the last few decades. For instance, the mean of physical capital per capita worldwide experienced a slow decrease from USD 3160.73 in 1990 to USD 3112.59 in 2001, before it started to gradually rise again. In the year 2008, the stock of physical capital per capita on average witnessed a temporary decline, after which it maintained a growth trend, reaching USD 4097.12 in 2014. Meanwhile, the average years of education increased steadily from 6.419 years in 1990 to 9.268 years in 2014. At the national level, the number of countries with backward education has decreased significantly, which was due to both the popularization of education by governments and international organizations, and also to the increasing trend in the rate of return of education. In order to meet the growing demand for talent as economies developed rapidly, human capital became scarce, and education, in this way, was more attractive and more worth investing in than ever before.
4.2. Regression Results
4.2.1. Results of Ordinary Panel Regression Models
We applied country fixed effect regression models after the Hausman test for panel data. In order to avoid the spurious regression phenomenon caused by the presence of unit roots, we first performed the Fisher-PP test to check the stationarity of data, and the results in
Table 2 show that the null hypothesis of unit root can be rejected at a significance level of 1%, which means that the time series data were stationary as a panel.
Table 3 presents the correlation coefficients between variables, and there were significant correlations between physical capital, human capital, labor, and economic growth (
p < 0.01). Furthermore, we calculated the variance inflation factors (VIF) of all predictors in the regression models (3) to (6), and in accordance with
Table 4, all the VIF values were less than 10 except for the human capital at the total level, indicating that there might have been high correlation between human capital and other explanatory variables. Given that collinearity may undermine the statistical significance of independent variables, yet the coefficients of human capital remained significant in the regression models presented in
Table 5, it should not be a concern on this occasion.
Table 5 shows the average elasticities of output with respect to physical and human capital. In the fitted model with traditional GDP as the dependent variable, the least-squares estimate of the mean output elasticities of physical and human capital were 0.26 and 0.48, respectively, for the entire sample. This means that a percentage increase in the stock of physical capital and human capital significantly brought in 0.26% and 0.48% of growth in the traditional GDP, respectively. In the model with green GDP as the dependent variable, the mean output elasticities of physical and human capital were 0.43 and 1.08, which indicated that green GDP significantly grew by 0.43% and 1.08% with a one percent increase in physical capital and human capital respectively. Similarly, the regression coefficients of traditional GDP per capita on physical and human capital were 0.26 and 0.39, respectively, while the corresponding coefficients of green GDP per capita on physical and human capital were 0.42 and 0.65. In addition, we conducted the chi-square tests to check whether the comparison of estimations between different regression models (suest) were significantly different, which indicated that the estimated coefficients of physical and human capital in the green GDP models was significantly higher than those in the GDP models at both the total and per capita levels (
p < 0.01). Therefore, it is not difficult to conclude that economic growth, particularly the green GDP, is more sensitive to changes in human capital than those in physical capital. Moreover, green GDP turned out to be more responsive to changes in human capital as well as physical capital than the traditional GDP.
4.2.2. Results of Panel Quantile Regression Models
Our study further applied the quantile regression model with the panel data.
Table 6 presents the output elasticities of physical and human capital in the entire distribution of GDP and green GDP at the total and per capita levels. Generally, the coefficient of human capital significantly overtook that of physical capital for the traditional and green GDP at either the total or per capita level. The elastic coefficients of physical capital to GDP and GDP per capita at the first decile were 0.286 and 0.281, respectively, which both decreased monotonically to 0.233 and 0.234 at the upper decile. Meanwhile, the estimated output elasticities of human capital remained relatively stable over quantiles at approximately 0.48 and 0.39, respectively. Moreover, the output elasticity of physical capital to green GDP and green GDP per capita also declined as the quantile increase, while the estimates of human capital kept rising from 0.892 and 0.533 at the tenth quantile to 1.274 and 0.733 at the 90th quantile. This indicates that countries with more rapid economic growth gradually become less sensitive to changes in physical capital, but the impacts of human capital were maintained across countries with various income levels, and in particular, the role of human capital turned out to be more prominent for the building of the green economy of more developed countries and regions.
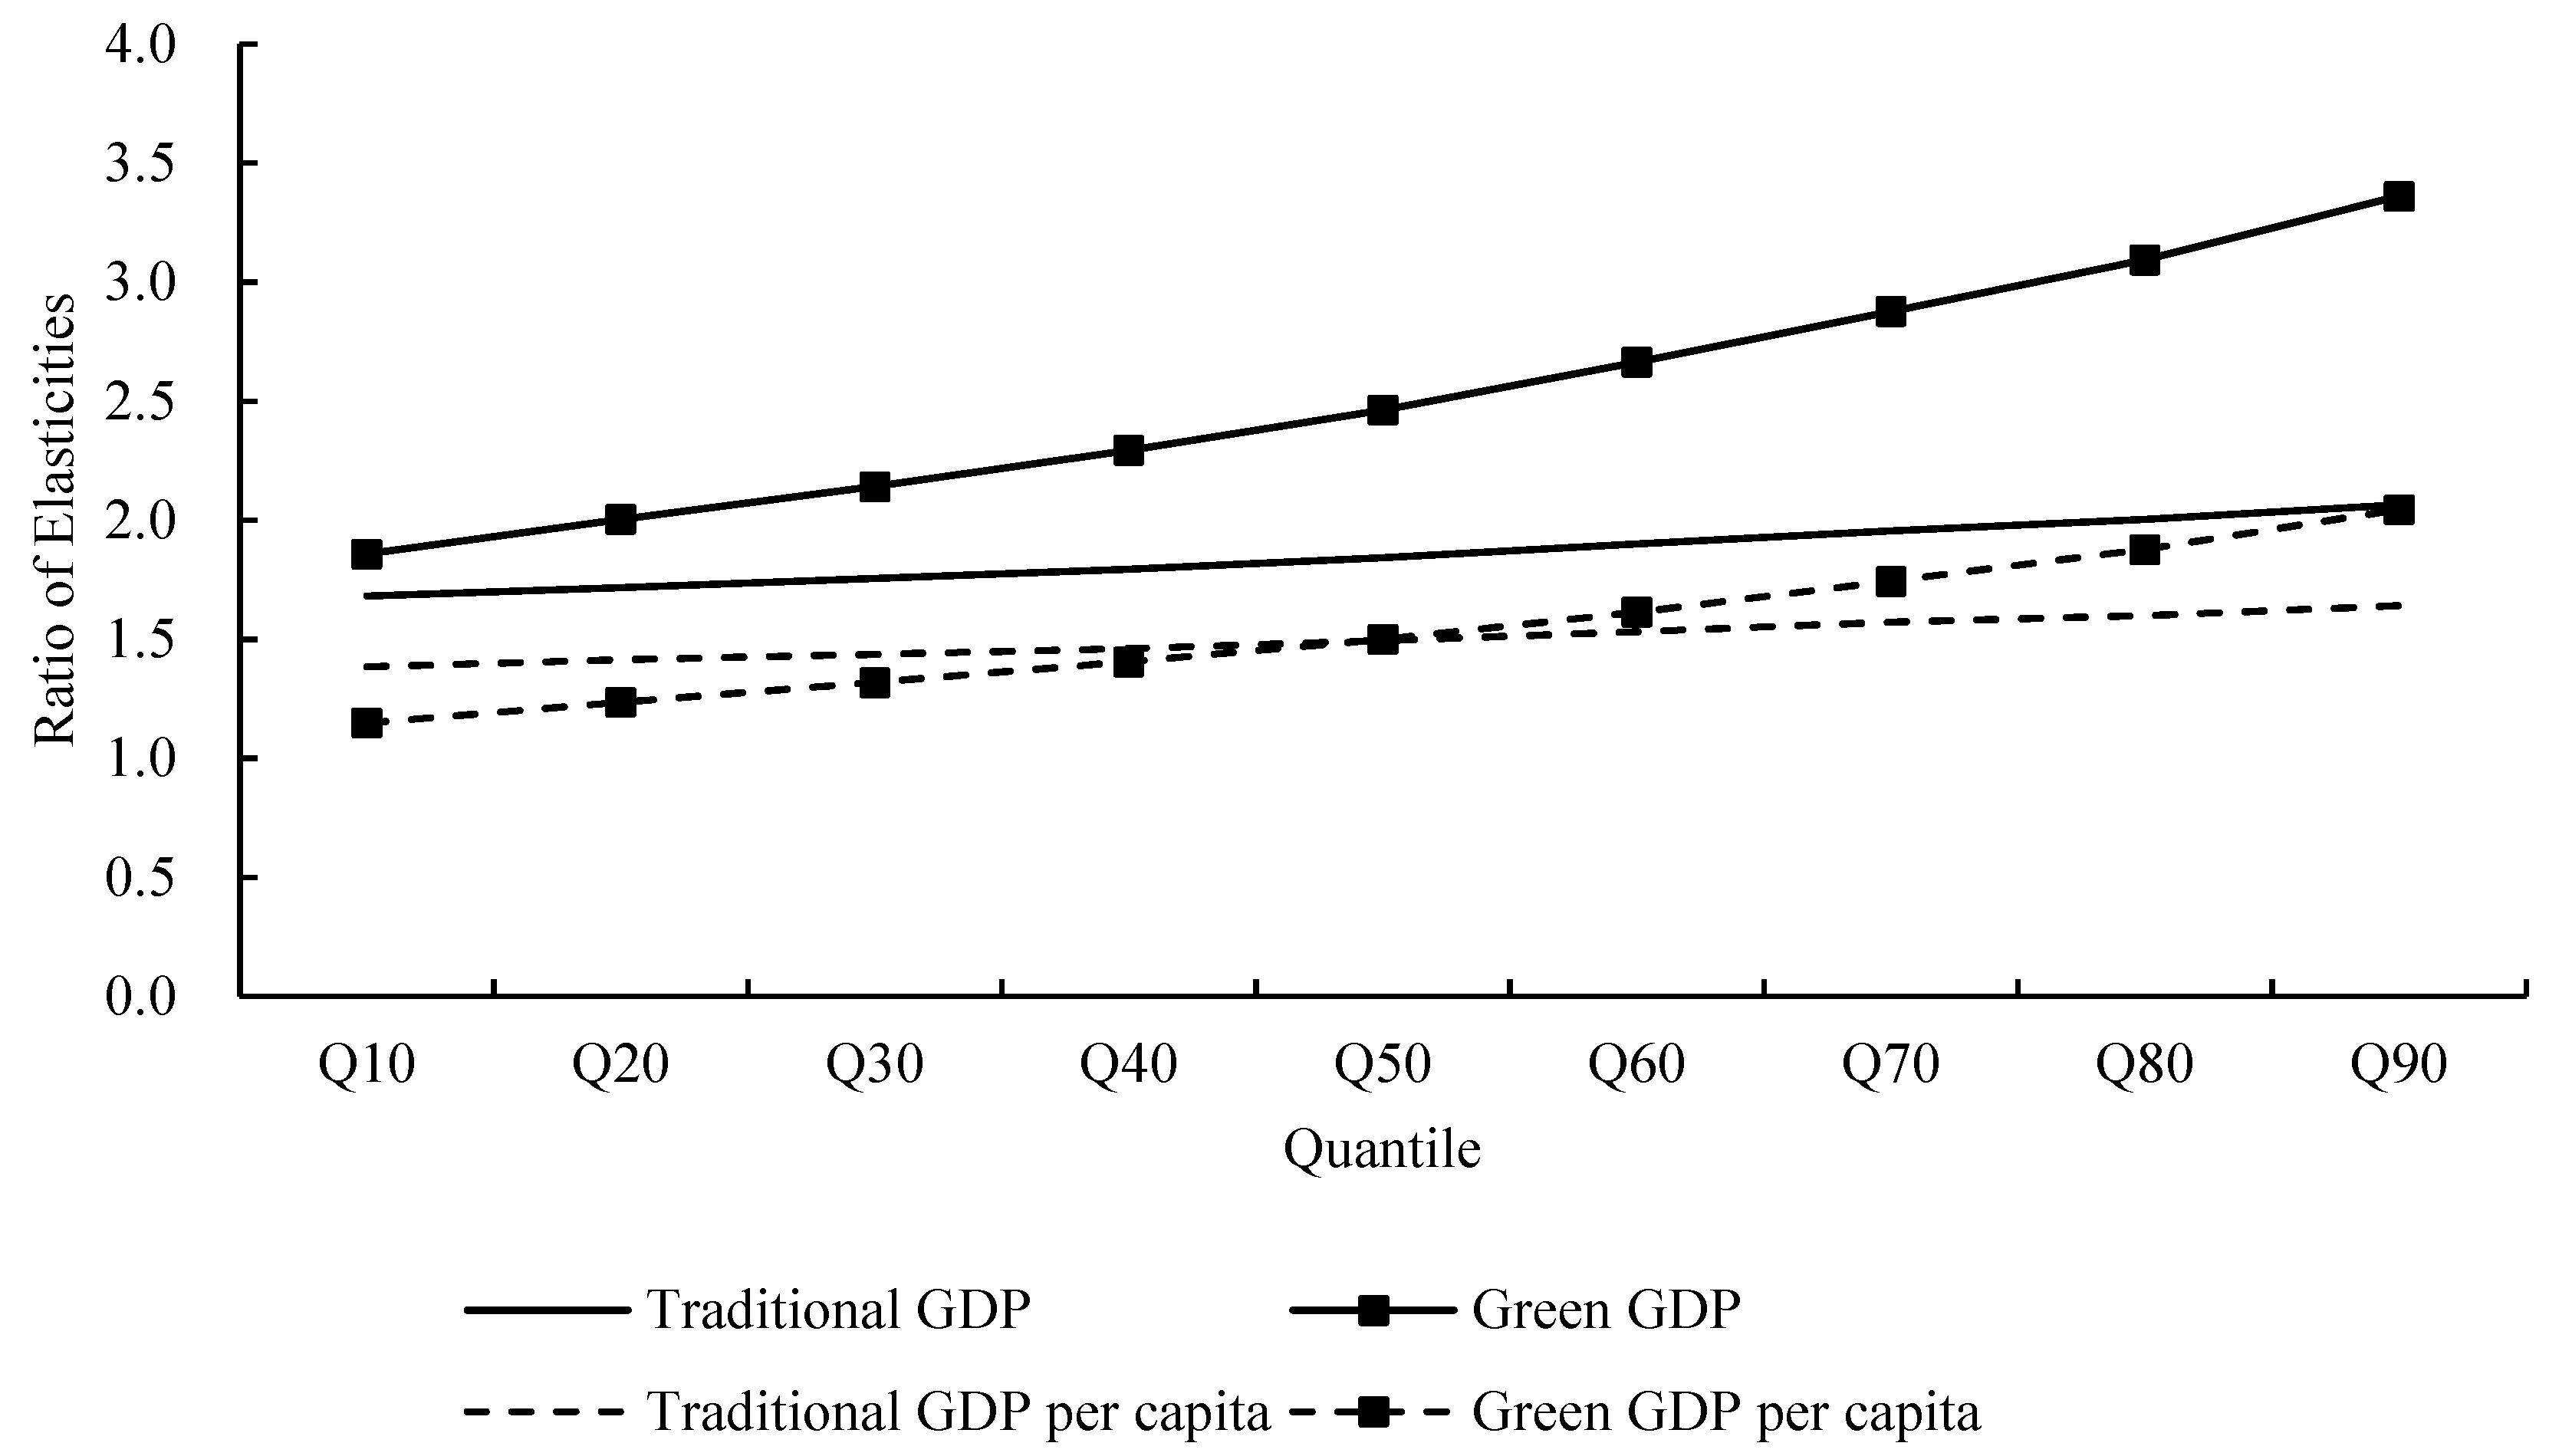
Figure 2 shows the ratio of the elasticity of human capital to the elasticity of physical capital. A ratio greater than 1 means that the elasticity of human capital is greater than that of physical capital. It was evident that the elasticity ratio of human capital to physical capital increased with upper green GDP quantile, which means the sustainability of economic development depended more on the accumulation of human capital, especially for developed countries and regions. This may have been due to the influence brought by industrial upgrading. Labor-intensive industries are more conducive to the input of material capital, while high-tech industries have a greater demand for human capital.
5. Discussion
Schultz [
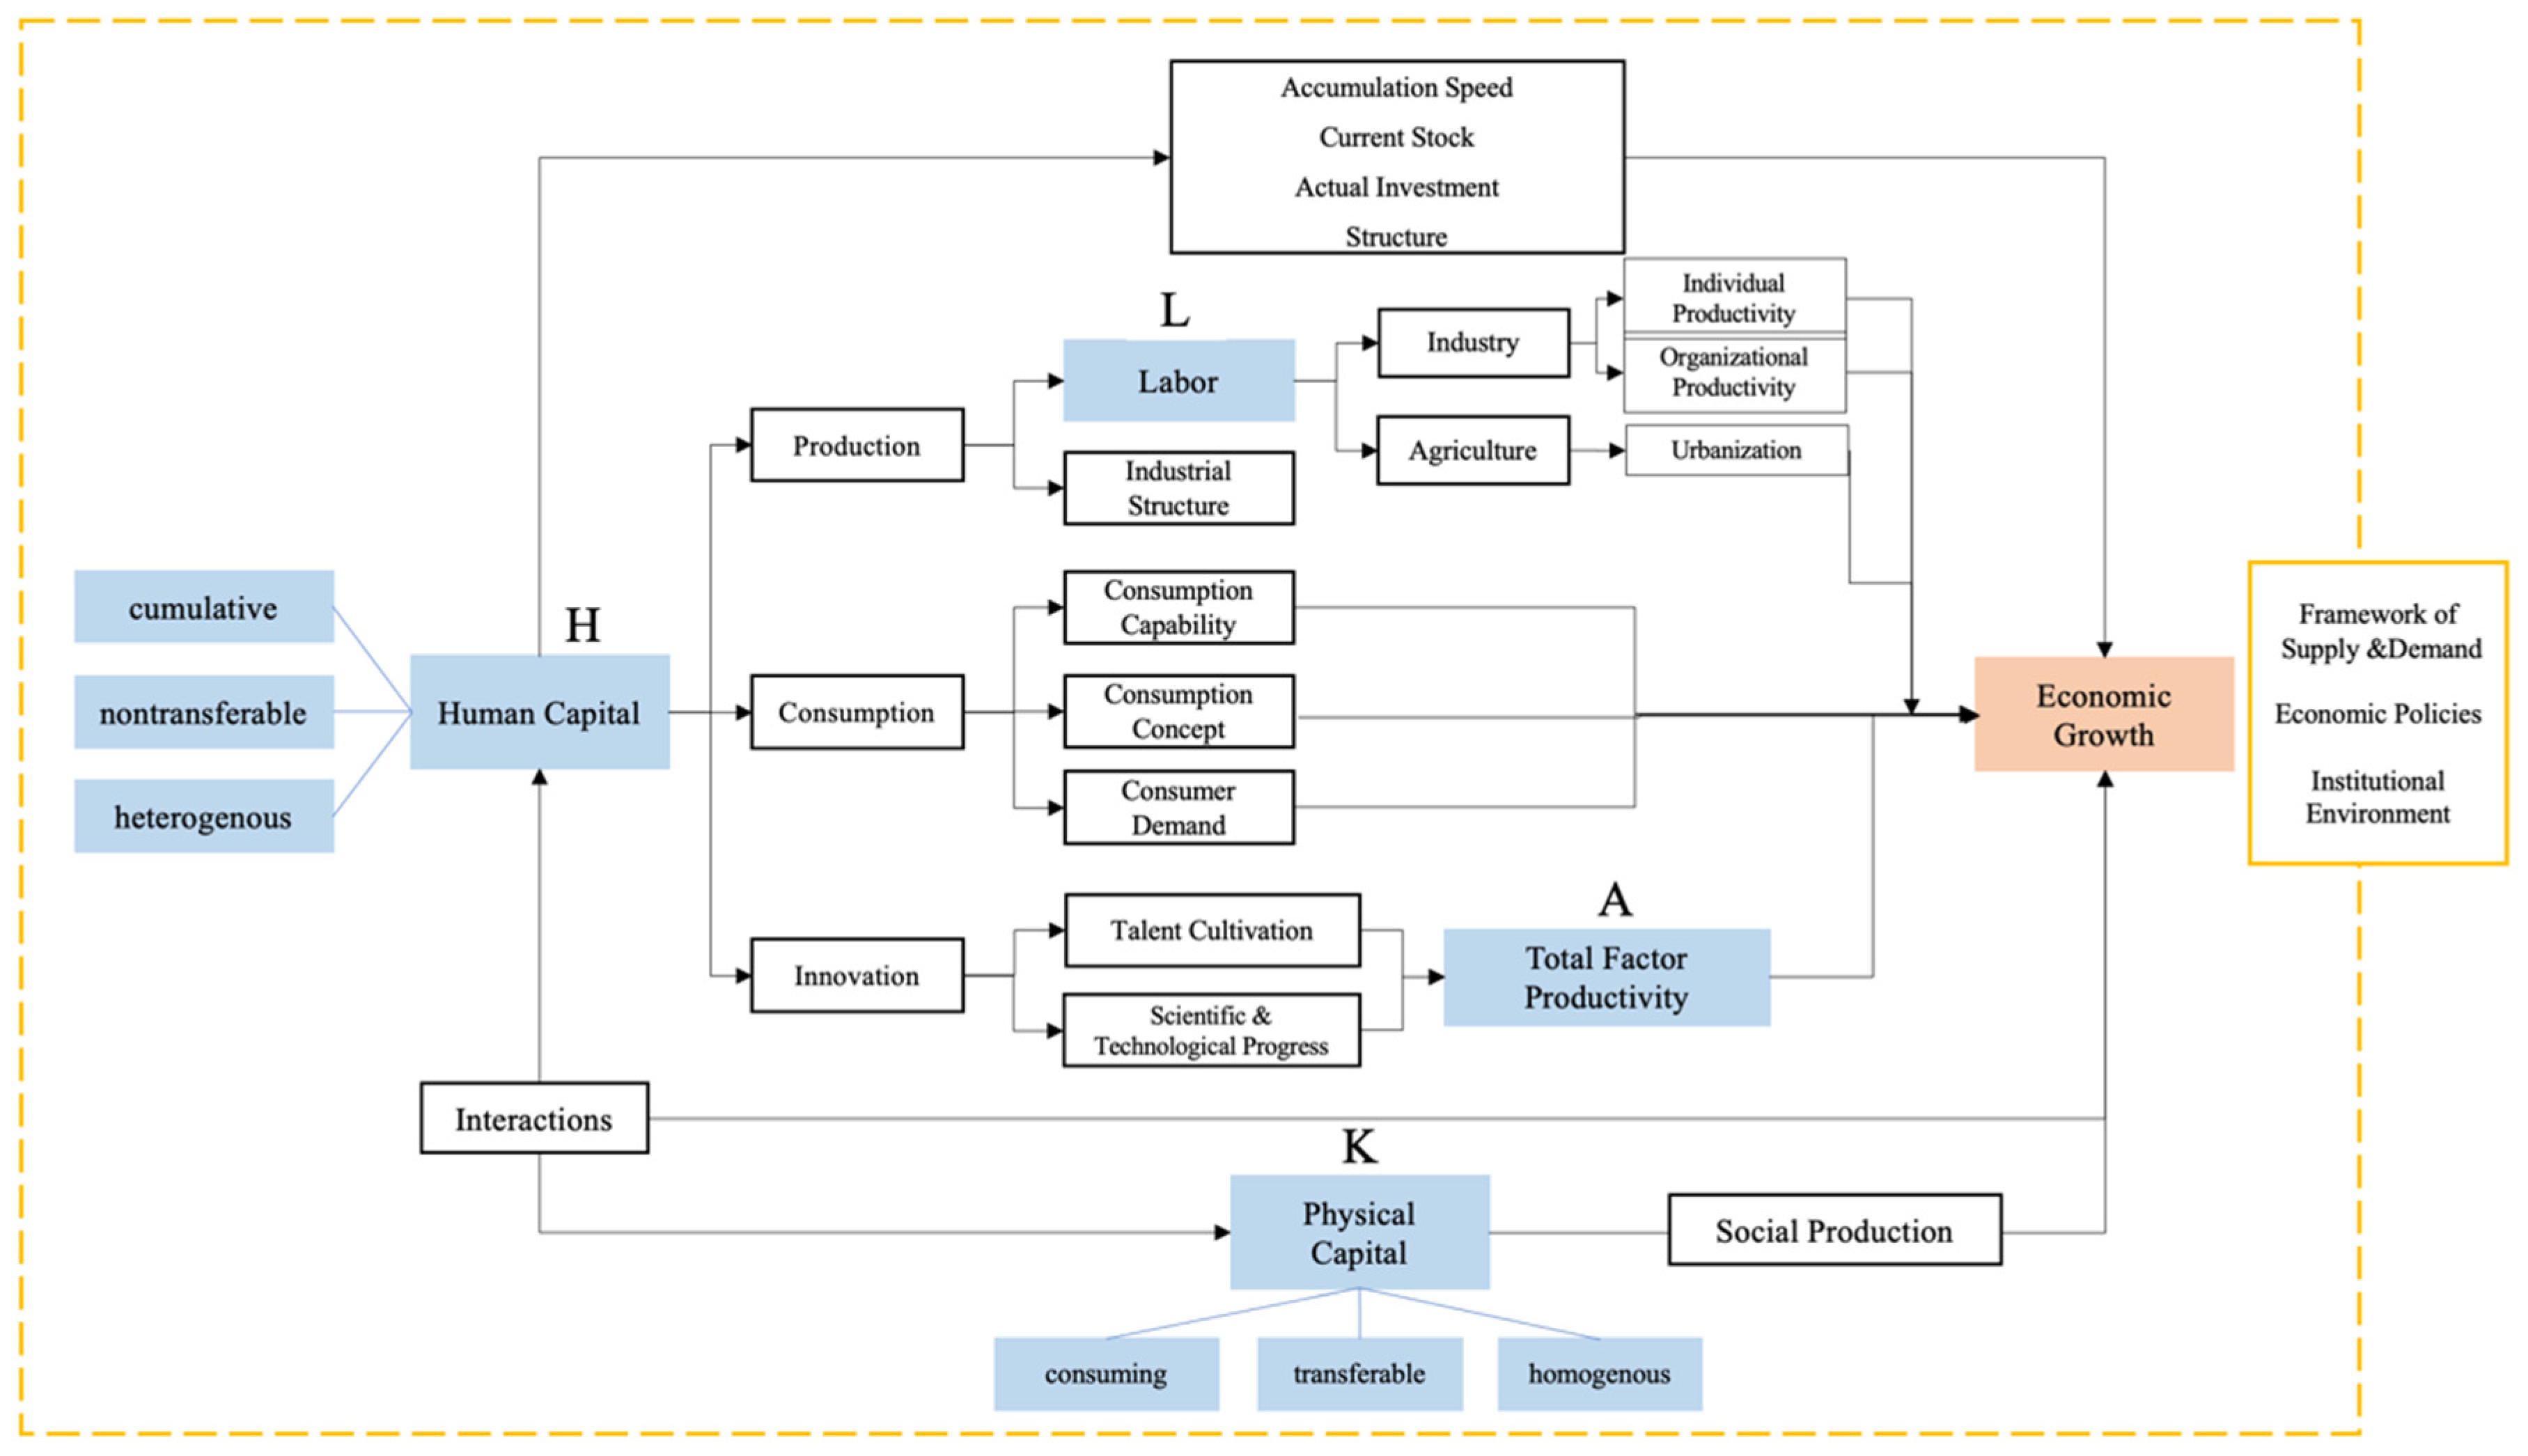
1] insisted that the economics of education required a comprehensive and deep understanding of the concept of capital. Some economists assumed capital as material wealth while failing to include human capital, the importance of which has gradually emerged with economic development. The key investment in human capital lies in education, and relevant empirical evidence on the economic significances of education indeed leads to the growing awareness of the traditional value of school education and university scientific research. Our study invited human capital into the Solow model in order to compare the importance of physical capital and human capital to economic growth, and the results indicated that economic growth is more sensitive to changes in human capital rather than changes in physical capital. We discussed some possibilities about the influencing mechanisms of different factors on economic development, as shown in
Figure 3.
First, the stock, as well as structures of physical capital and human capital, may exert internal impacts on economic development. Physical capital usually refers to the capital embodied in the quantity and quality of the production materials such as plants, machinery, raw materials, and semi-finished products owned by society. Physical capital is regarded as consuming since it can be constantly worn out with use. Its ownership can be easily transferred or inherited by future generations. In addition, the nature of all physical capital can be regarded as homogenous in the form of currency, which plays relatively the same role in economic development. Human capital, on the other hand, refers to the cumulative capital embodied in the stock of production knowledge, labor skills, and health qualities accumulated by the individual. It is difficult to separate human capital from its owners, so it is not possible for it to be replicated or transferred to other individuals in a short period. In addition, individuals can be equipped with heterogeneous levels of human capital even receiving exactly the same education. The stock and structure of human capital can affect the economy in both direct and indirect ways. As an independent factor of production, human capital may have direct effects on economic growth. Furthermore, it may affect the technological innovation of nations at the macro level, which in return, decides the rate of economic growth. It may also improve the production efficiency of the labor force in industries and agriculture, optimize structures of organizations, enhance individual abilities in consumption, alter people’s consumption concepts and increase consumer demand at the micro-level. In general, physical capital serves as the basis of economic development, which directly expands social production, stimulates social employment, and increases national income, while the intangibility and abundance of human capital make economic growth more sensitive to its changes.
Second, physical capital and human capital are not completely independent but indeed interact with each other. The function of human capital can only be given full play with investment in physical capital. The marginal output of physical capital keeps being diminishing without the support of human capital. Therefore, the interaction between human capital and physical capital may affect their respective importance in economic growth. Third, the external environment including institutional context, economic policies, and the relations of supply and demand also matters. The impacts of human capital and physical capital on economic growth vary at different stages of economic development. The institutional context affects the utilization rate of the two as well as their marginal outputs, and economic policies may also lead to different requirements for physical capital and human capital.
Overall, our study evidenced the important role of human capital in economic growth, and it indeed plays an even more dominant and indispensable role than physical capital considering its diversity in composition, cumulatively in practice, and flexibility in accumulation. In particularly, human capital provides a strong guarantee for the sustainability of the economy in the knowledge age with an aging population and artificial intelligence boom. There have been increasingly severe challenges to sustainable development in the global context, with greenhouse gas emissions increasing substantially and extreme weather events occurring frequently. Thus, human capital must be continuously invested, accumulated, and utilized in order to reduce greenhouse gas emissions from mankind’s activities (such as fossil energy consumption) and to form a sustainable energy system by using renewable energy and other new energy as the main alternative to replace traditional energy. Developing countries and regions should strive to increase the stock of human capital and improve the efficiency of its use to improve people’s livelihoods, and achieve rapid economic development; while for the developed nations, it is essential to optimize the allocation of human capital as well as other factors, and to promote talent training and technological innovation with the purpose of guaranteeing the sustainability of economic development.
6. Conclusions
This paper introduced human capital into the Solow model to compare the significance of physical capital and human capital to economic growth. The main conclusions are as follows:
First, the paper explored the different impacts of physical and human capital accumulation on economic growth, and the results showed that economic development, concerning the dimensions of both quantity and quality, is more sensitive to changes in human capital than physical capital.
Second, as for the differential roles of physical and human capital for countries and regions at different economic phases, the results indicated that the more developed economies are less responsive to changes in physical capital, while the impacts of human capital maintain to be prominent. This is relatively consistent with the reality that the development of low-income countries such as Burundi, Ethiopia, Guinea, and Mozambique perhaps depends highly on the accumulation of physical capital, while high-income countries such as Canada, Switzerland, Germany, Spain, and the United Kingdom rely more on the accumulation of human capital. Several other relevant studies also strongly confirm the significant impact of human capital on economic development [
22,
36,
37].
Third, the sustainability of economic growth, in particular, depends highly on the accumulation of human capital. Therefore, human capital should be invested in in order to achieve rapid and sustainable development of the national economy.
There were several limitations of our study. First, education was deemed as the key component of human capital in our study, which inevitably ignored other factors such as health; while the educational levels on average cannot reflect the heterogeneity in the quality of education in different countries and regions, which may lead to overestimation of the output elasticity of human capital. Future relevant studies can discuss more possibilities on the measurement of human capital. Second, future research may discuss more possibilities on the calculation of green GDP. This study has indirectly estimated the green GDP, yet more calculation methods should be explored to ensure the reliability of the estimation.
Author Contributions
Conceptualization and research design, X.D., Y.H. and W.G.; data curation, X.D. and Y.H.; formal analysis, Y.H. and W.G.; funding acquisition, X.D. and W.M.; investigation, W.G. and Y.H.; resources, X.D. and W.M.; visualization, Y.H. and W.G.; writing—original draft, W.G., Y.H. and X.D.; writing—review and editing, X.D., Y.H. and W.G. All authors have read and agreed to the published version of the manuscript.
Funding
This research was funded by a research project sponsored by the National Natural Science Foundation of China (NSFC), P.R.C., “Research on Faculty Composition and Career Development in Chinese Colleges and Universities”, grant number 71974007; and a key research project (2016) of the Institute of Educational Economics, Peking University, sponsored by Ministry of Education, P.R.C., “Education and Economic Growth in the Context of New Economic Normalization”, grant number 16JJD880004.
Data Availability Statement
Conflicts of Interest
The authors declare no conflict of interest.
References
- Schultz, T.W. Education and economic growth. In Social Forces Influencing American Education; Henry, N.B., Ed.; University of Chicago Press: Chicago, IL, USA, 1961; pp. 85–90. [Google Scholar]
- Becker, G.S. Human Capital: A Theoretical and Empirical Analysis, with Special Reference to Education; Columbia University Press: New York, NY, USA, 1964. [Google Scholar]
- Lucas, R.E., Jr. On the mechanics of economic development. J. Monet. Econ. 1988, 22, 3–42. [Google Scholar] [CrossRef]
- Romer, P.M. Increasing Returns and Long-Run Growth. J. Political Econ. 1986, 94, 1002–1037. [Google Scholar] [CrossRef] [Green Version]
- Mankiw, N.G.; Romer, D.; Weil, D.N. A contribution to the empirics of economic growth. Q. J. Econ. 1992, 107, 407–437. [Google Scholar] [CrossRef]
- Pritchett, L. Where Has All the Education Gone? World Bank Econ. Rev. 2001, 15, 367–391. [Google Scholar] [CrossRef] [Green Version]
- Barro, R.J. Quantity and Quality of Economic Growth (No. 168); Banco Central de Chile: Santiago, Chile, 2002. [Google Scholar]
- Solow, R.M. A contribution to the economic growth. Q. J. Econ. 1956, 70, 65–94. [Google Scholar] [CrossRef]
- Blanchard, O.J.; Nordhaus, W.D.; Phelps, E.S. The Medium Run. Brook. Pap. Econ. Act. 1997, 1997, 89. [Google Scholar] [CrossRef] [Green Version]
- Douglas, G. Getting Income Shares Right. J. Political Econ. 2002, 110, 458–474. [Google Scholar]
- Swan, T.W. Economic growth and capital accumulation. Econ. Rec. 1956, 32, 334–361. [Google Scholar] [CrossRef]
- Harrod, R.F. An essay in dynamic theory. Econ. J. 1939, 49, 14–33. [Google Scholar]
- Domar, E.D. Capital Expansion, Rate of Growth, and Employment. Econometrica 1946, 14, 137–147. [Google Scholar] [CrossRef]
- Arrow, K.J.; Chenery, H.B.; Minhas, B.S.; Solow, R.M. Capital-Labor Substitution and Economic Efficiency. Rev. Econ. Stat. 1961, 43, 225. [Google Scholar] [CrossRef]
- Sato, R.; Hoffman, R.F. Production functions with variable elasticity of factor substitution: Some analysis and testing. Rev. Econ. Stat. 1968, 50, 453–460. [Google Scholar] [CrossRef]
- Christensen, L.R.; Jorgenson, D.W.; Lau, L.J. Transcendental Logarithmic Production Frontiers. Rev. Econ. Stat. 1973, 55, 28. [Google Scholar] [CrossRef]
- Guo, H.; Ren, B. Structural changes, factor output elasticity and China’s potential economic growth rate. Quant. Tech. Econ. Res. 2014, 31, 72–84. [Google Scholar]
- Gao, Y.; Qi, Z. The total factor productivity estimation of China based on time-varying parameters. Quant. Tech. Econ. Res. 2008, 2, 100–121. [Google Scholar]
- Tang, B.; Song, J. Dynamic identification of parameters α and β in Solow growth rate model. Nat. Sci. J. Heilongjiang Univ. 1988, 4, 38–42. [Google Scholar]
- Awel, A.M. The Long-Run Relationship between Human Capital and Economic Growth in Sweden; MPRA Paper 45183; University Library of Munich: Munich, Germany, 2013. [Google Scholar]
- Dorothee, B.; Luc, S.; Bernice, S. Human Capital and Growth: New Evidences from African Data. Int. Econ. J. 2013, 27, 55–77. [Google Scholar]
- Wang, Y.; Liu, S.S. Education, Human Capital and Economic Growth: Empirical Research on 55 Countries and Regions (1960–2009). Theor. Econ. Lett. 2016, 6, 347–355. [Google Scholar] [CrossRef] [Green Version]
- Huang, Y.; Ding, X.; Chen, R.; Min, W. An empirical analysis of the contribution of human capital and physical capital to economic growth: Commemorating the 60th anniversary of the foundation of human capital theory. J. East China Norm. Univ. (Educ. Sci.) 2020, 38, 21–33. [Google Scholar]
- Maitra, B. Investment in Human Capital and Economic Growth in Singapore. Glob. Bus. Rev. 2016, 17, 425–437. [Google Scholar] [CrossRef]
- Gómez Manuel, A. Capital–labor substitution and long-run growth in a model with physical and human capital. Math. Soc. Sci. 2015, 78, 106–113. [Google Scholar] [CrossRef]
- Lucas, R.E. Making a Miracle. Econometrics 1993, 61, 251. [Google Scholar] [CrossRef]
- Pablo-Romero, M.D.P.; Gómez-Calero, M.D.L.P. A translog production function for the Spanish provinces: Impact of the human and physical capital in economic growth. Econ. Model. 2013, 32, 77–87. [Google Scholar] [CrossRef]
- Mamuneas, T.P.; Savvides, A.; Stengos, T. Economic development and the return to human capital: A smooth coefficient semiparametric approach. J. Appl. Econ. 2005, 21, 111–132. [Google Scholar] [CrossRef]
- Guo, Z.; Cao, J. A comparative analysis of the impact of human capital and physical capital on economic growth and fluctuations in the eastern and western regions in China. China’s Popul. Resour. Environ. 2008, 1, 133–138. [Google Scholar]
- Fang, C.; Huang, B. The impact of education investment on China’s economic growth: A spatial econometric study based on the growth regression framework. J. Dalian Univ. Technol. (Soc. Sci. Ed.) 2018, 39, 91–99. [Google Scholar]
- Gao, W.; Ding, X.; Chen, R.; Min, W. An Empirical Study of the Role of Higher Education in Building a Green Economy. Sustainability 2019, 11, 6823. [Google Scholar] [CrossRef] [Green Version]
- Lin, W.; Yang, J.; Chen, B. Temporal and Spatial Analysis of Integrated Energy and Environment Efficiency in China Based on a Green GDP Index. Energies 2011, 4, 1376–1390. [Google Scholar] [CrossRef]
- Hausman, J.A. Specification Tests in Econometrics. Econometrica 1978, 46, 1251. [Google Scholar] [CrossRef] [Green Version]
- Koenker, R.; Bassett, G., Jr. Regression quantiles. Econom. J. Econom. Soc. 1978, 46, 33–50. [Google Scholar] [CrossRef]
- Barro, R.J.; Lee, J. Sources of economic growth. Carnegie-Rochester Conf. Ser. Public Policy 1994, 40, 1–46. [Google Scholar] [CrossRef]
- Matousek, R.; Tzeremes, N.G. The asymmetric impact of human capital on economic growth. Empir. Econ. 2021, 60, 1309–1334. [Google Scholar] [CrossRef]
- Eftimoski, D. Human Capital and Economic Growth in OECD Countries Revisited: Initial Stock versus Changes in the Stock of Human Capital Effects. Jahrbücher für Nationalökonomie und Statistik 2021. [Google Scholar] [CrossRef]
| Publisher’s Note: MDPI stays neutral with regard to jurisdictional claims in published maps and institutional affiliations. |
© 2021 by the authors. Licensee MDPI, Basel, Switzerland. This article is an open access article distributed under the terms and conditions of the Creative Commons Attribution (CC BY) license (https://creativecommons.org/licenses/by/4.0/).


