
Evaluation of Satellite Precipitation Estimates over the South West Pacific Region

Abstract
:
1. Introduction
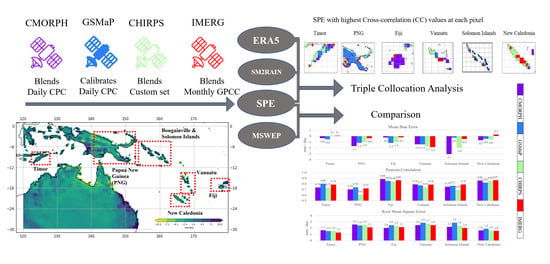
2. Materials and Methods
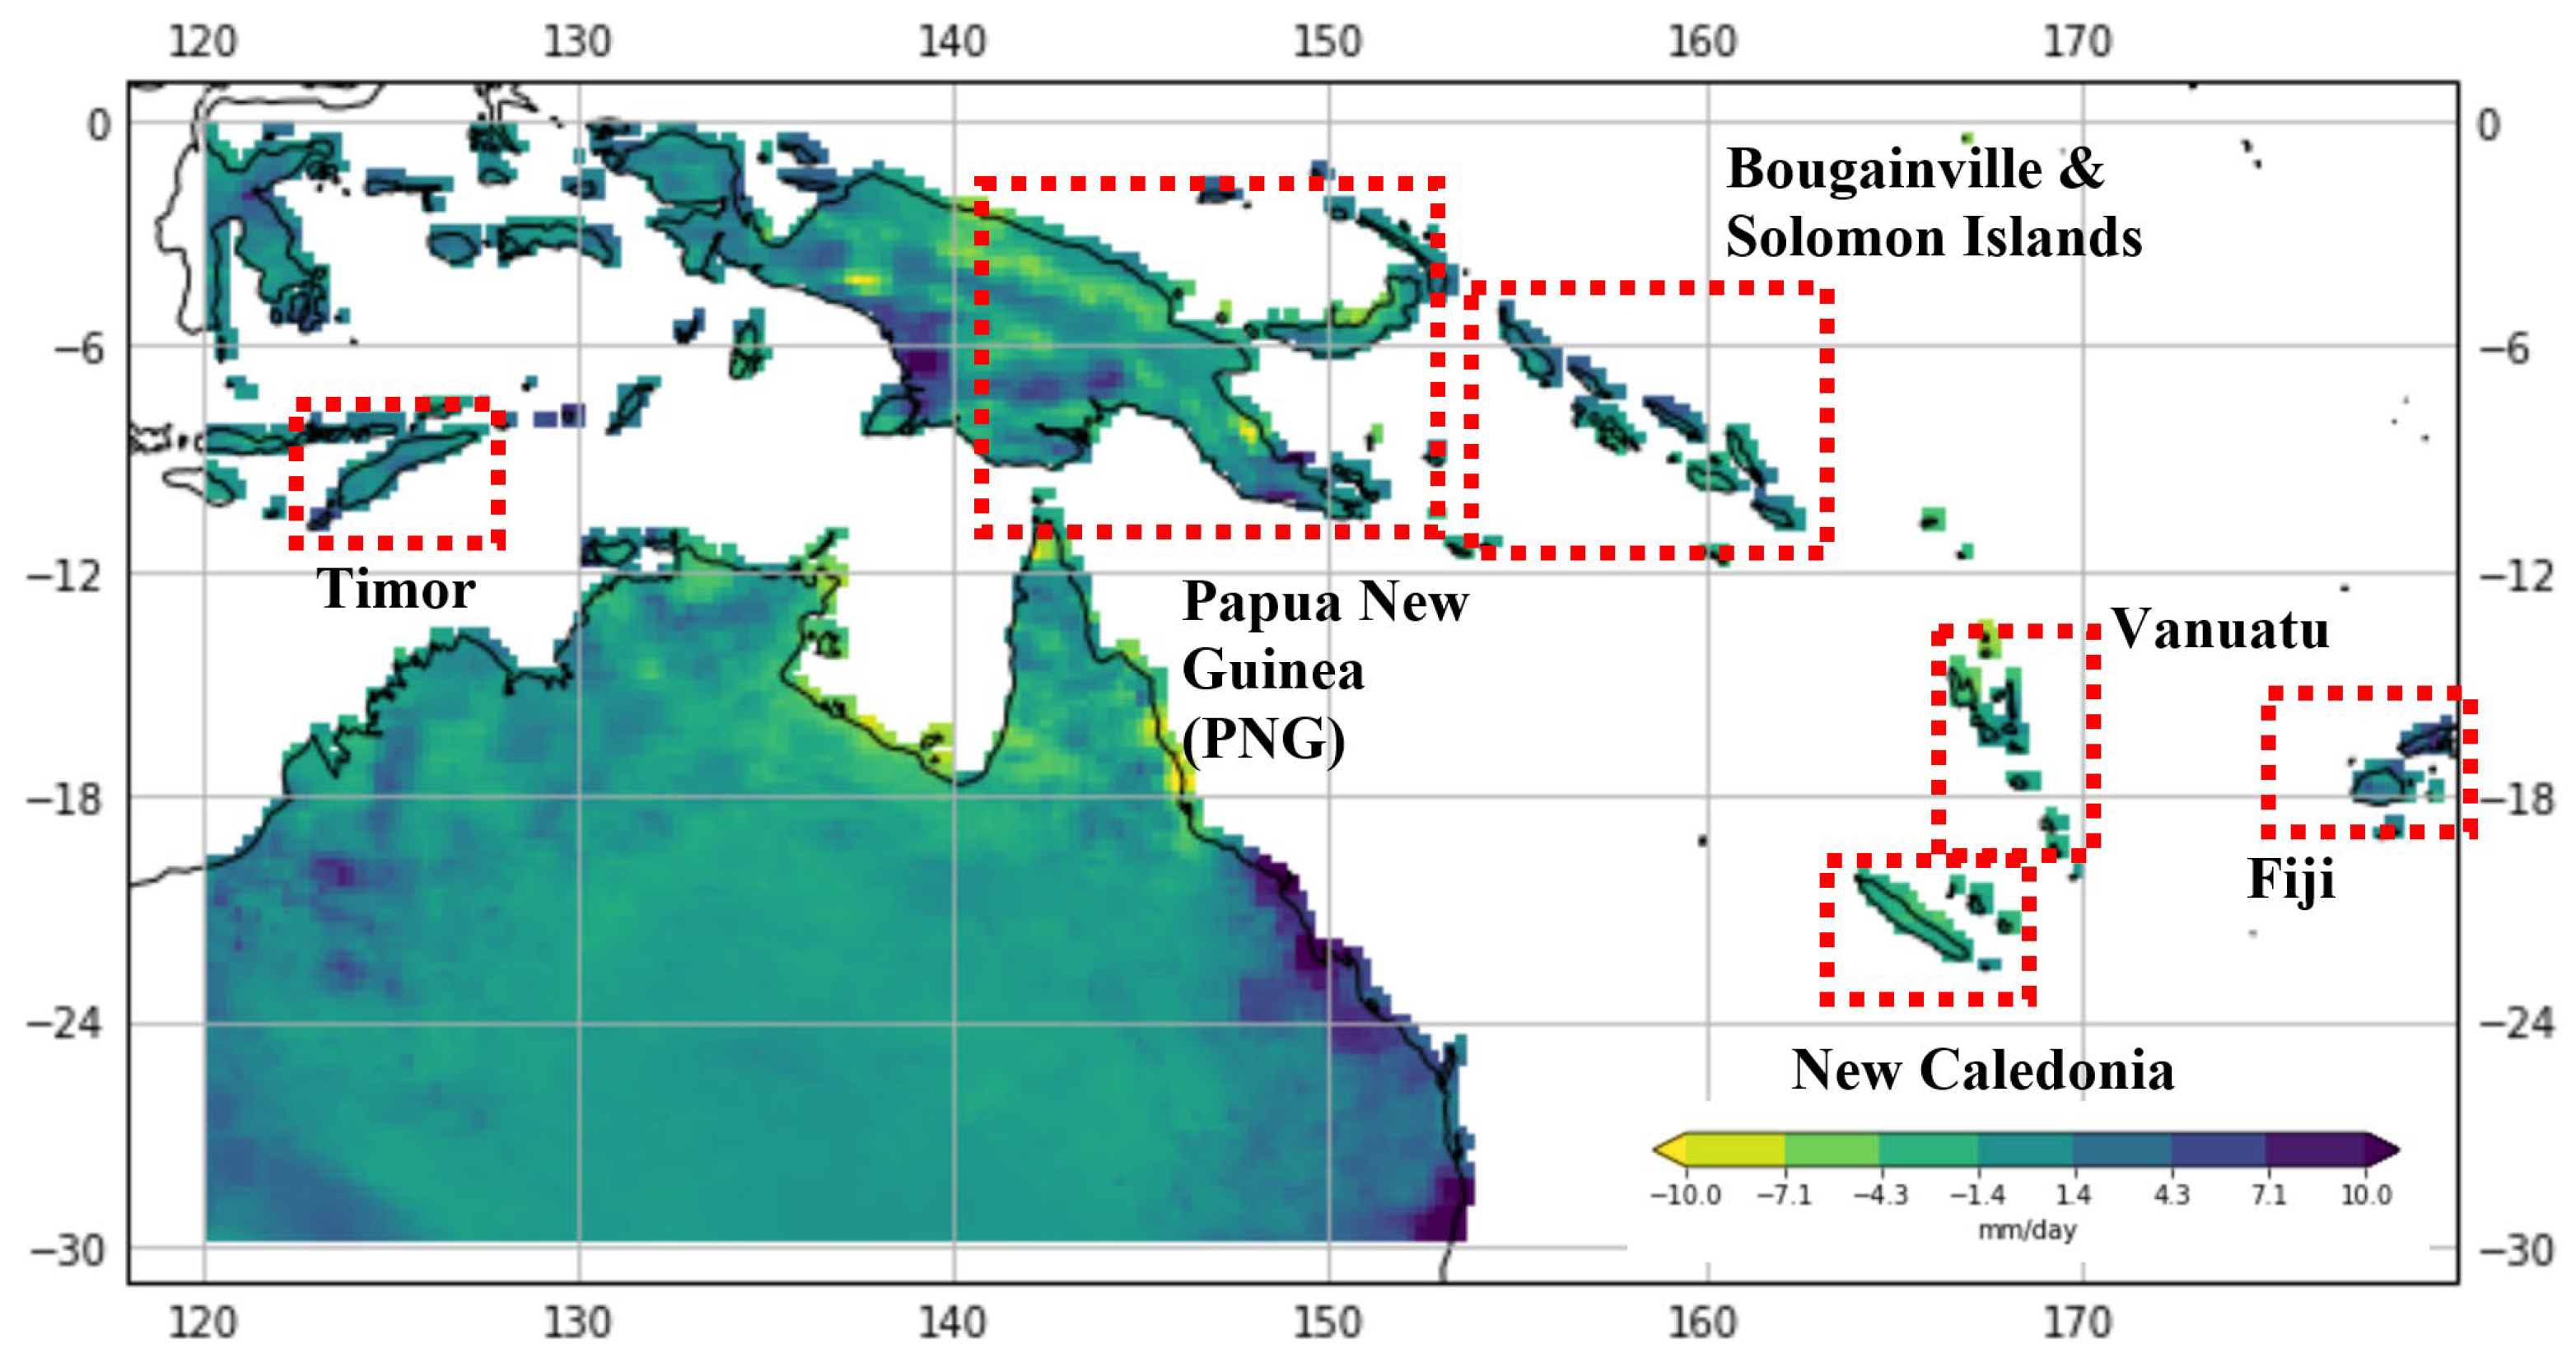
2.1. Study Area
2.2. Datasets
2.3. Method
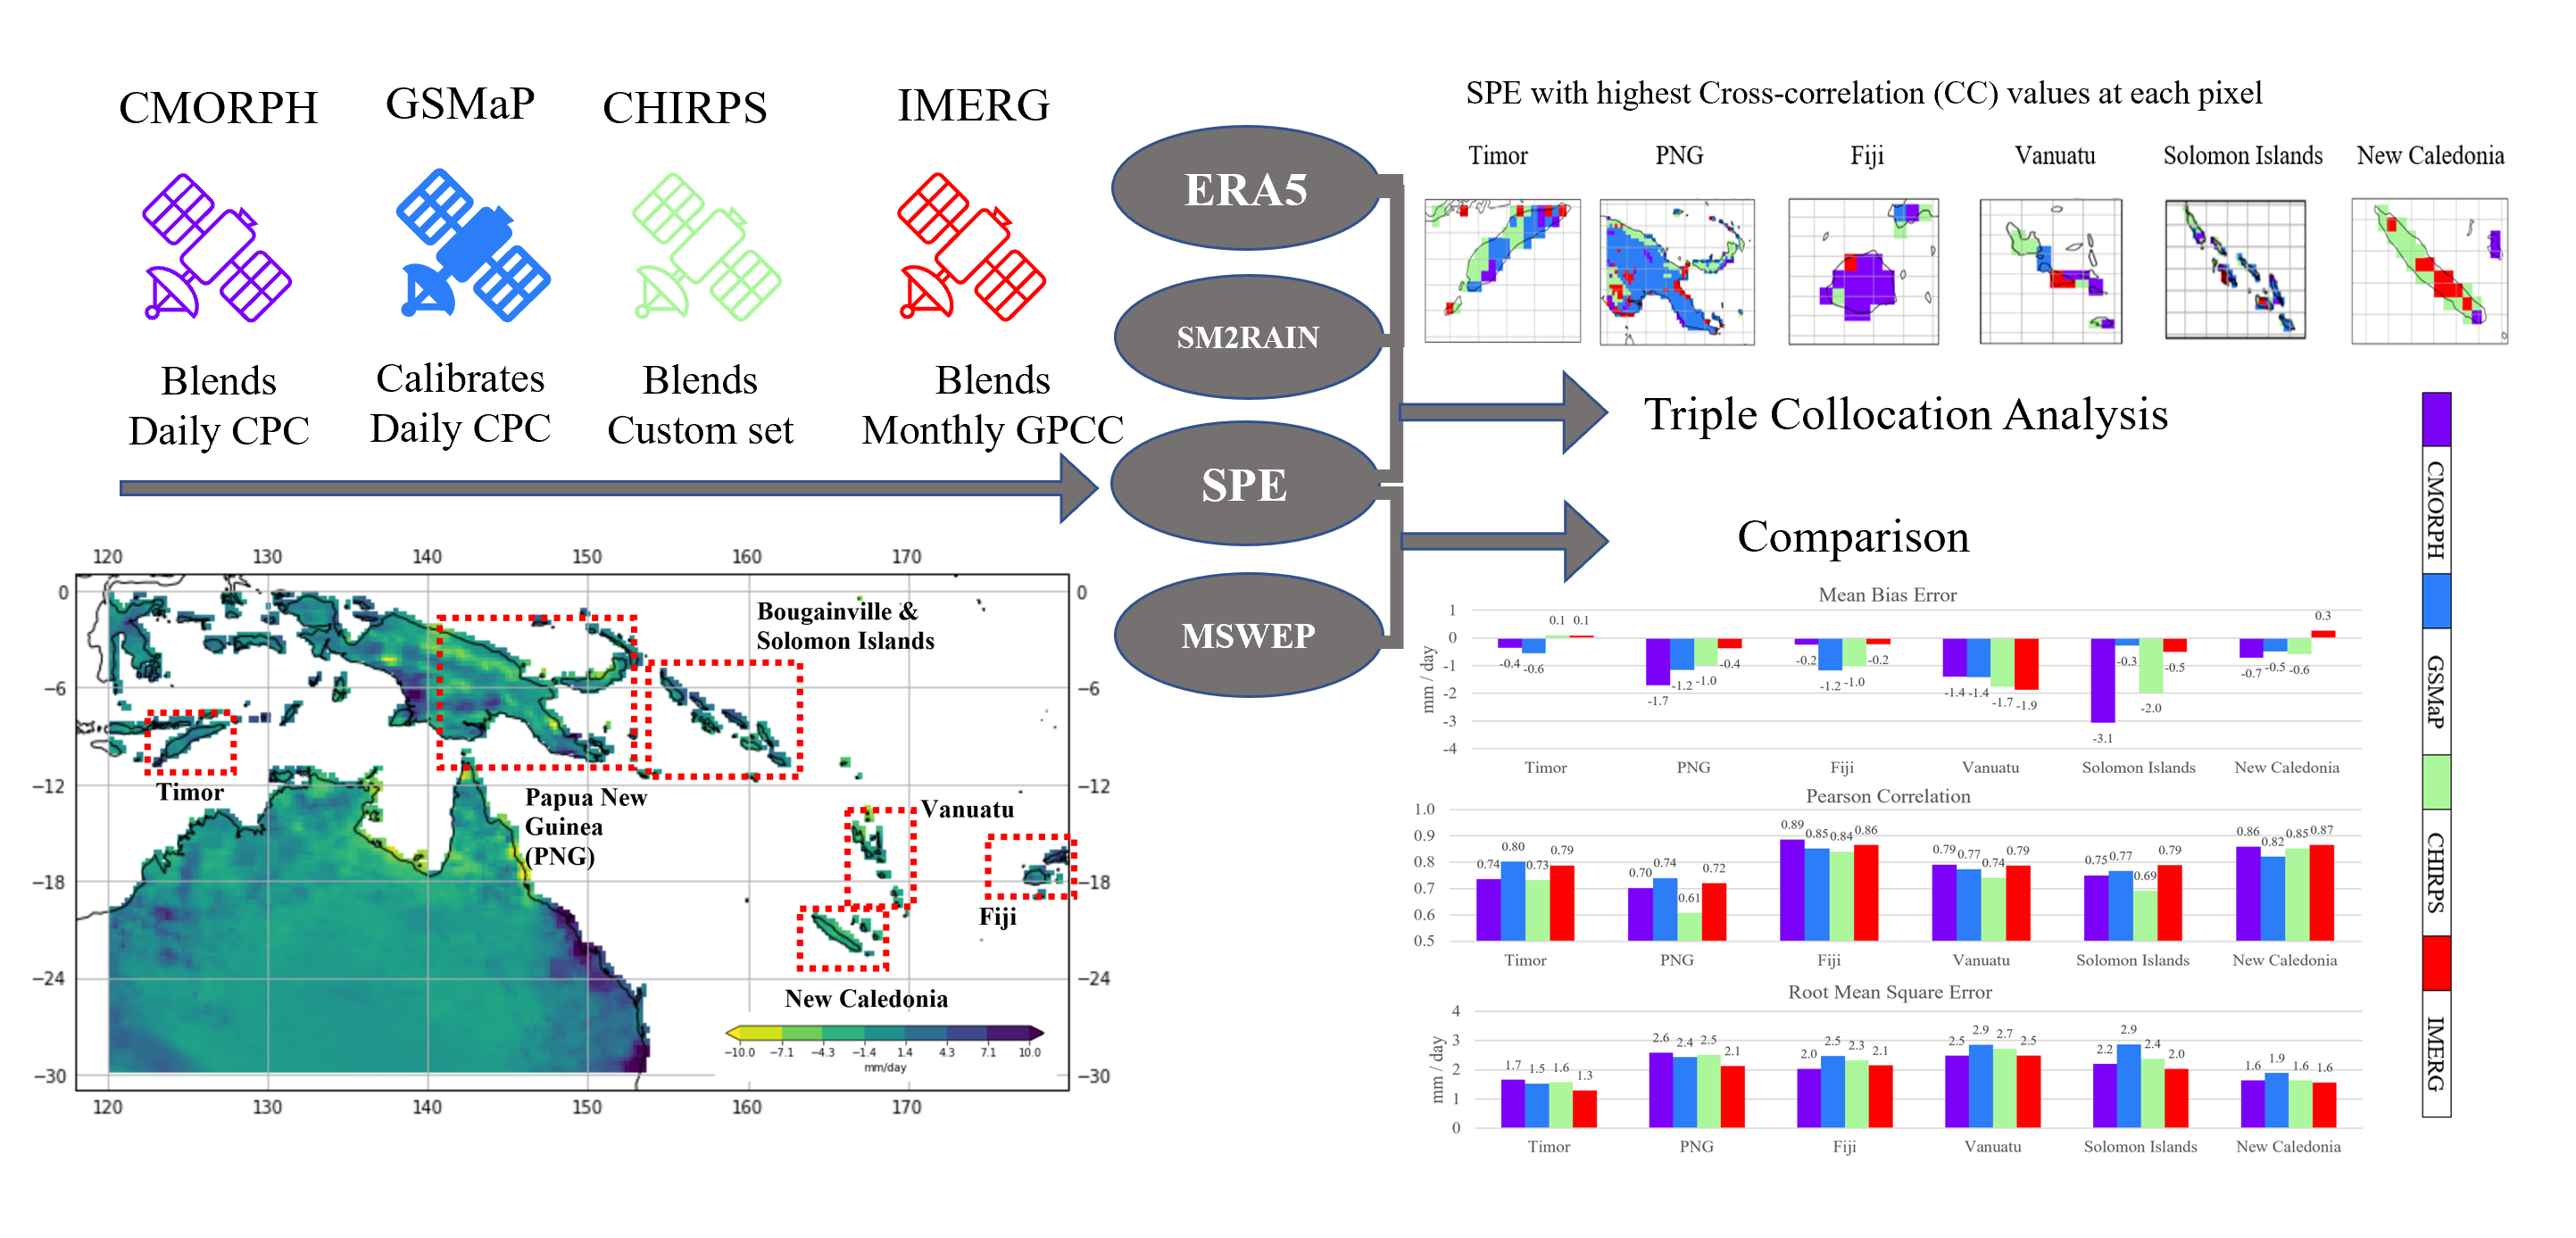
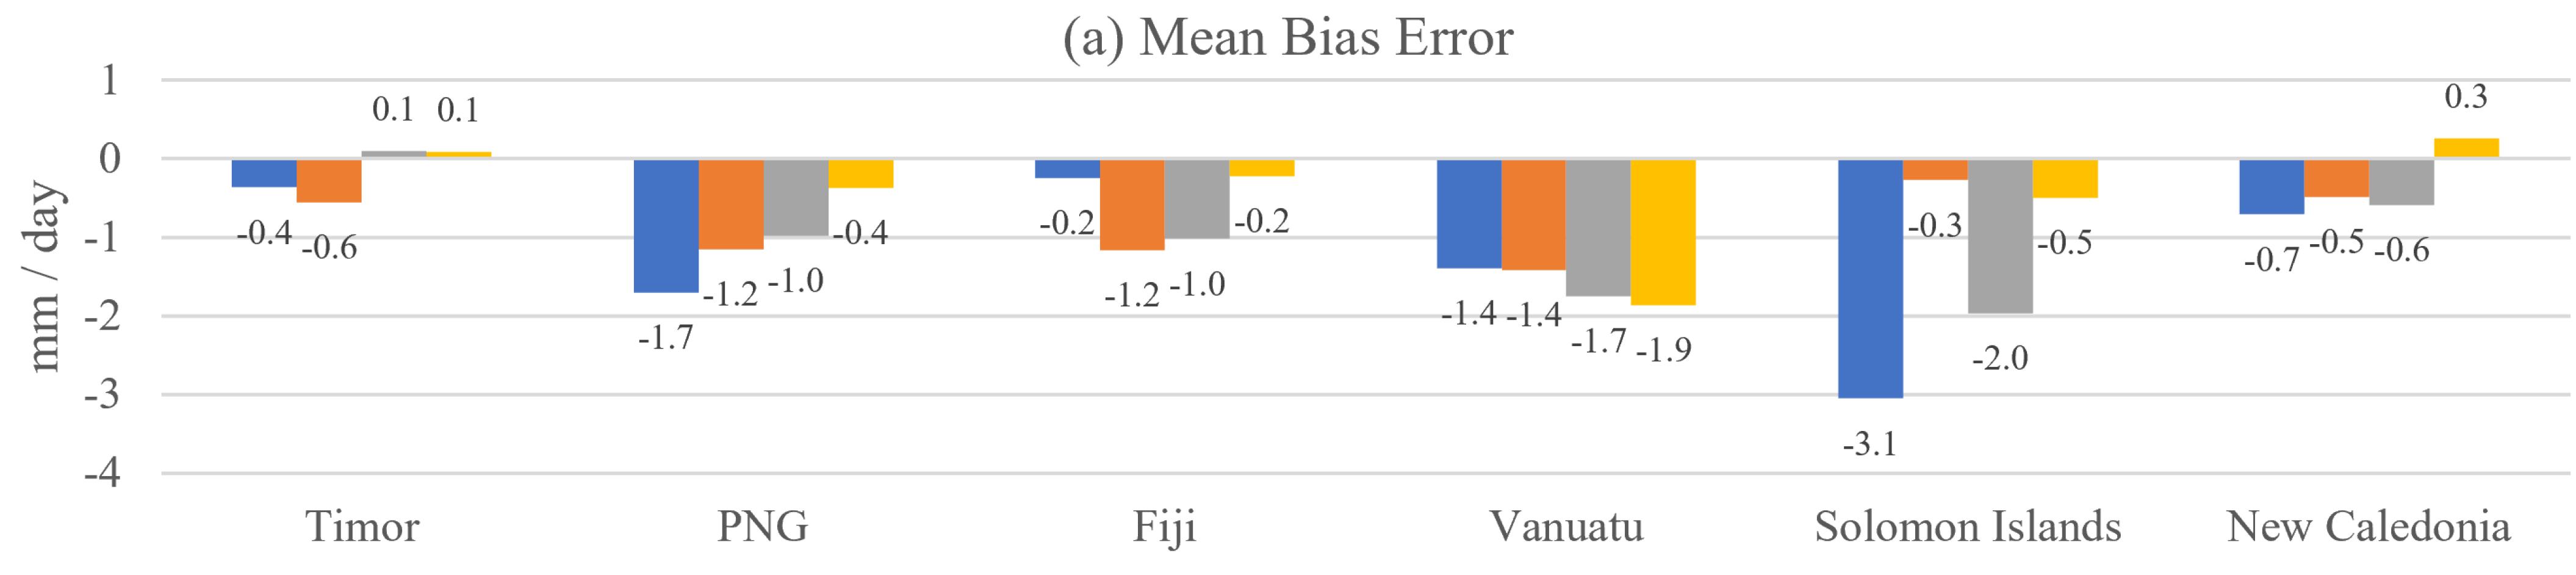
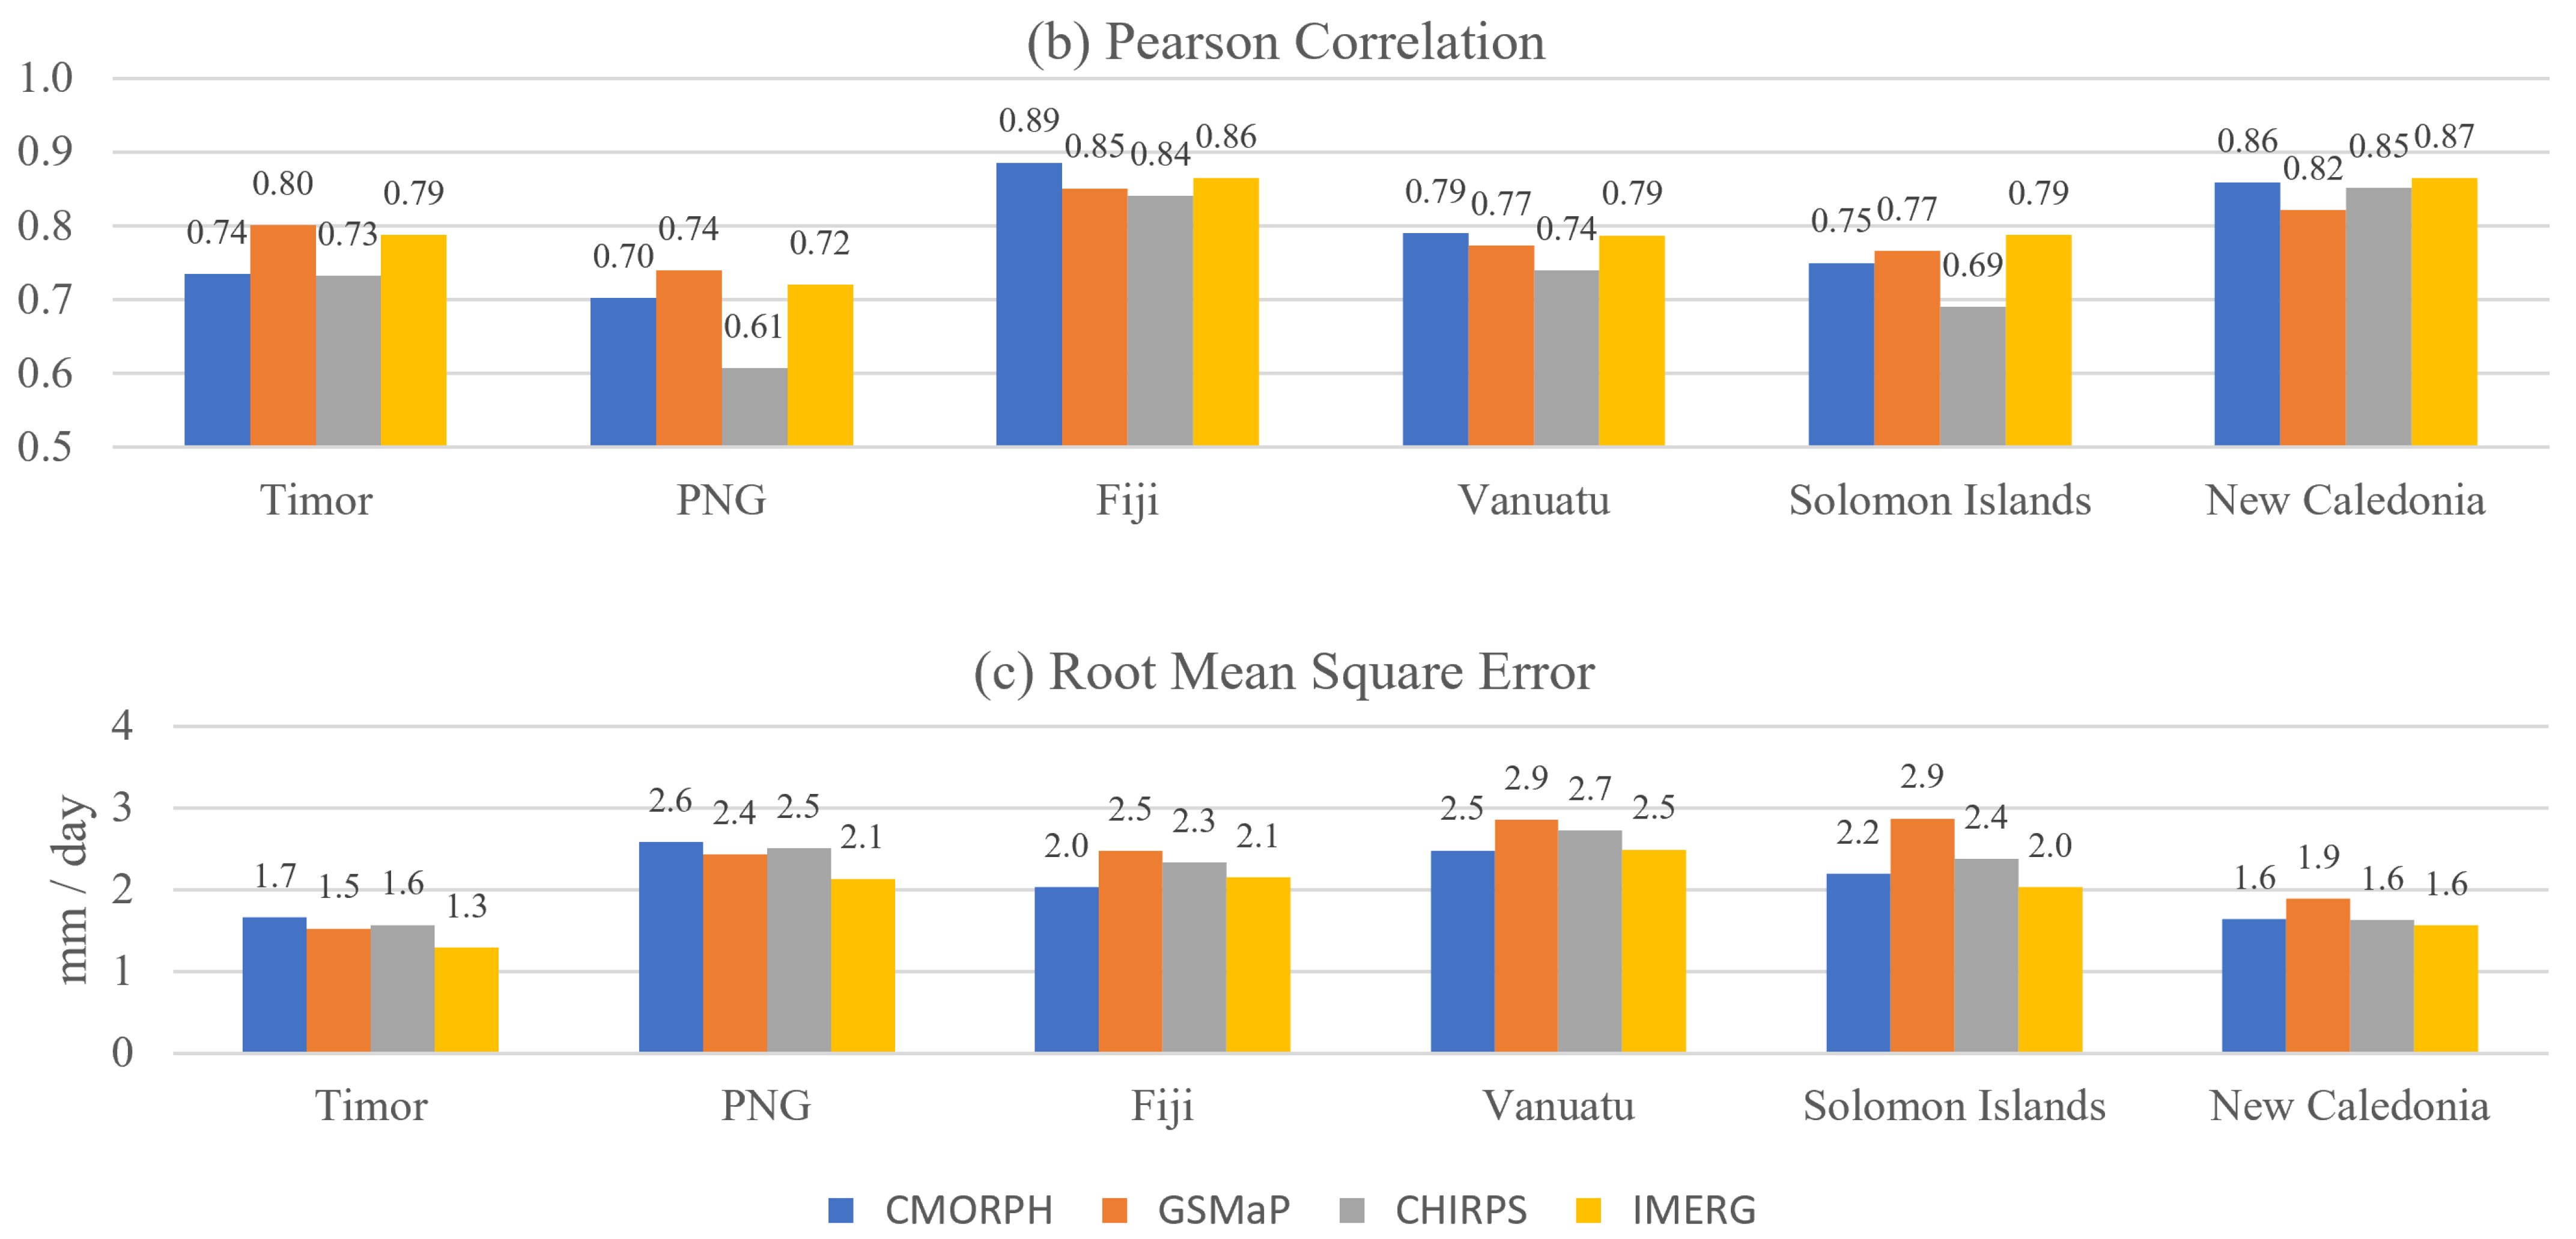
3. Results
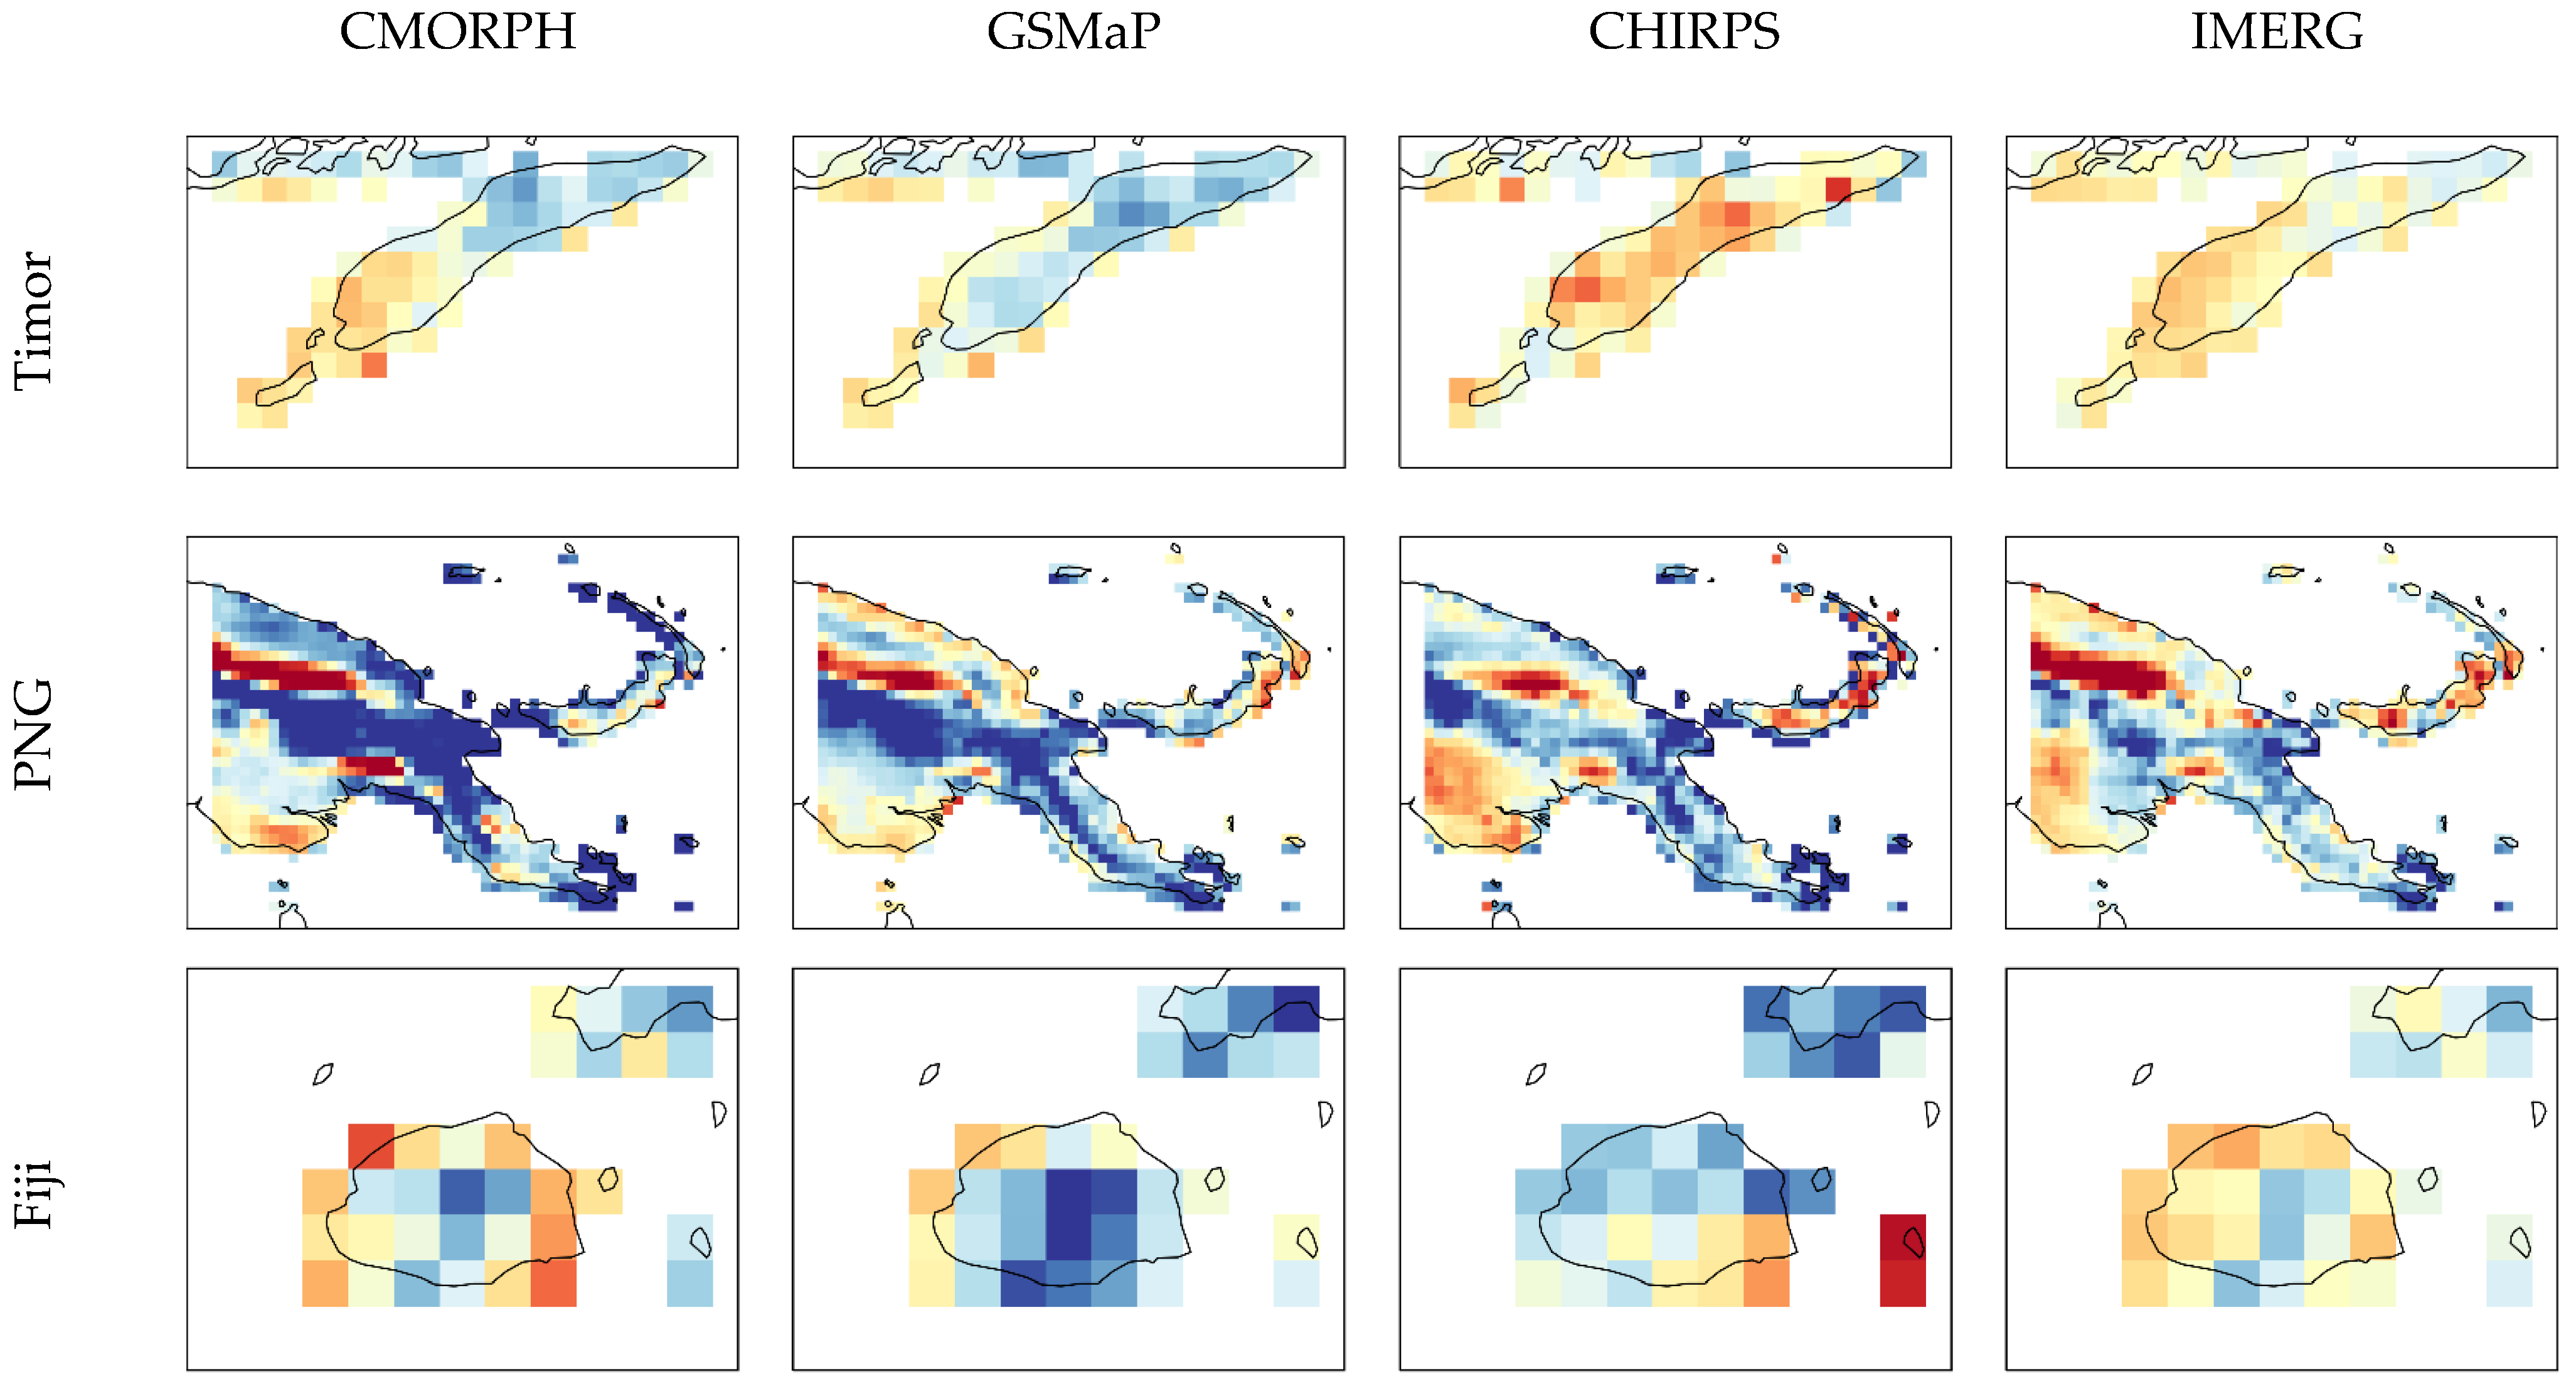
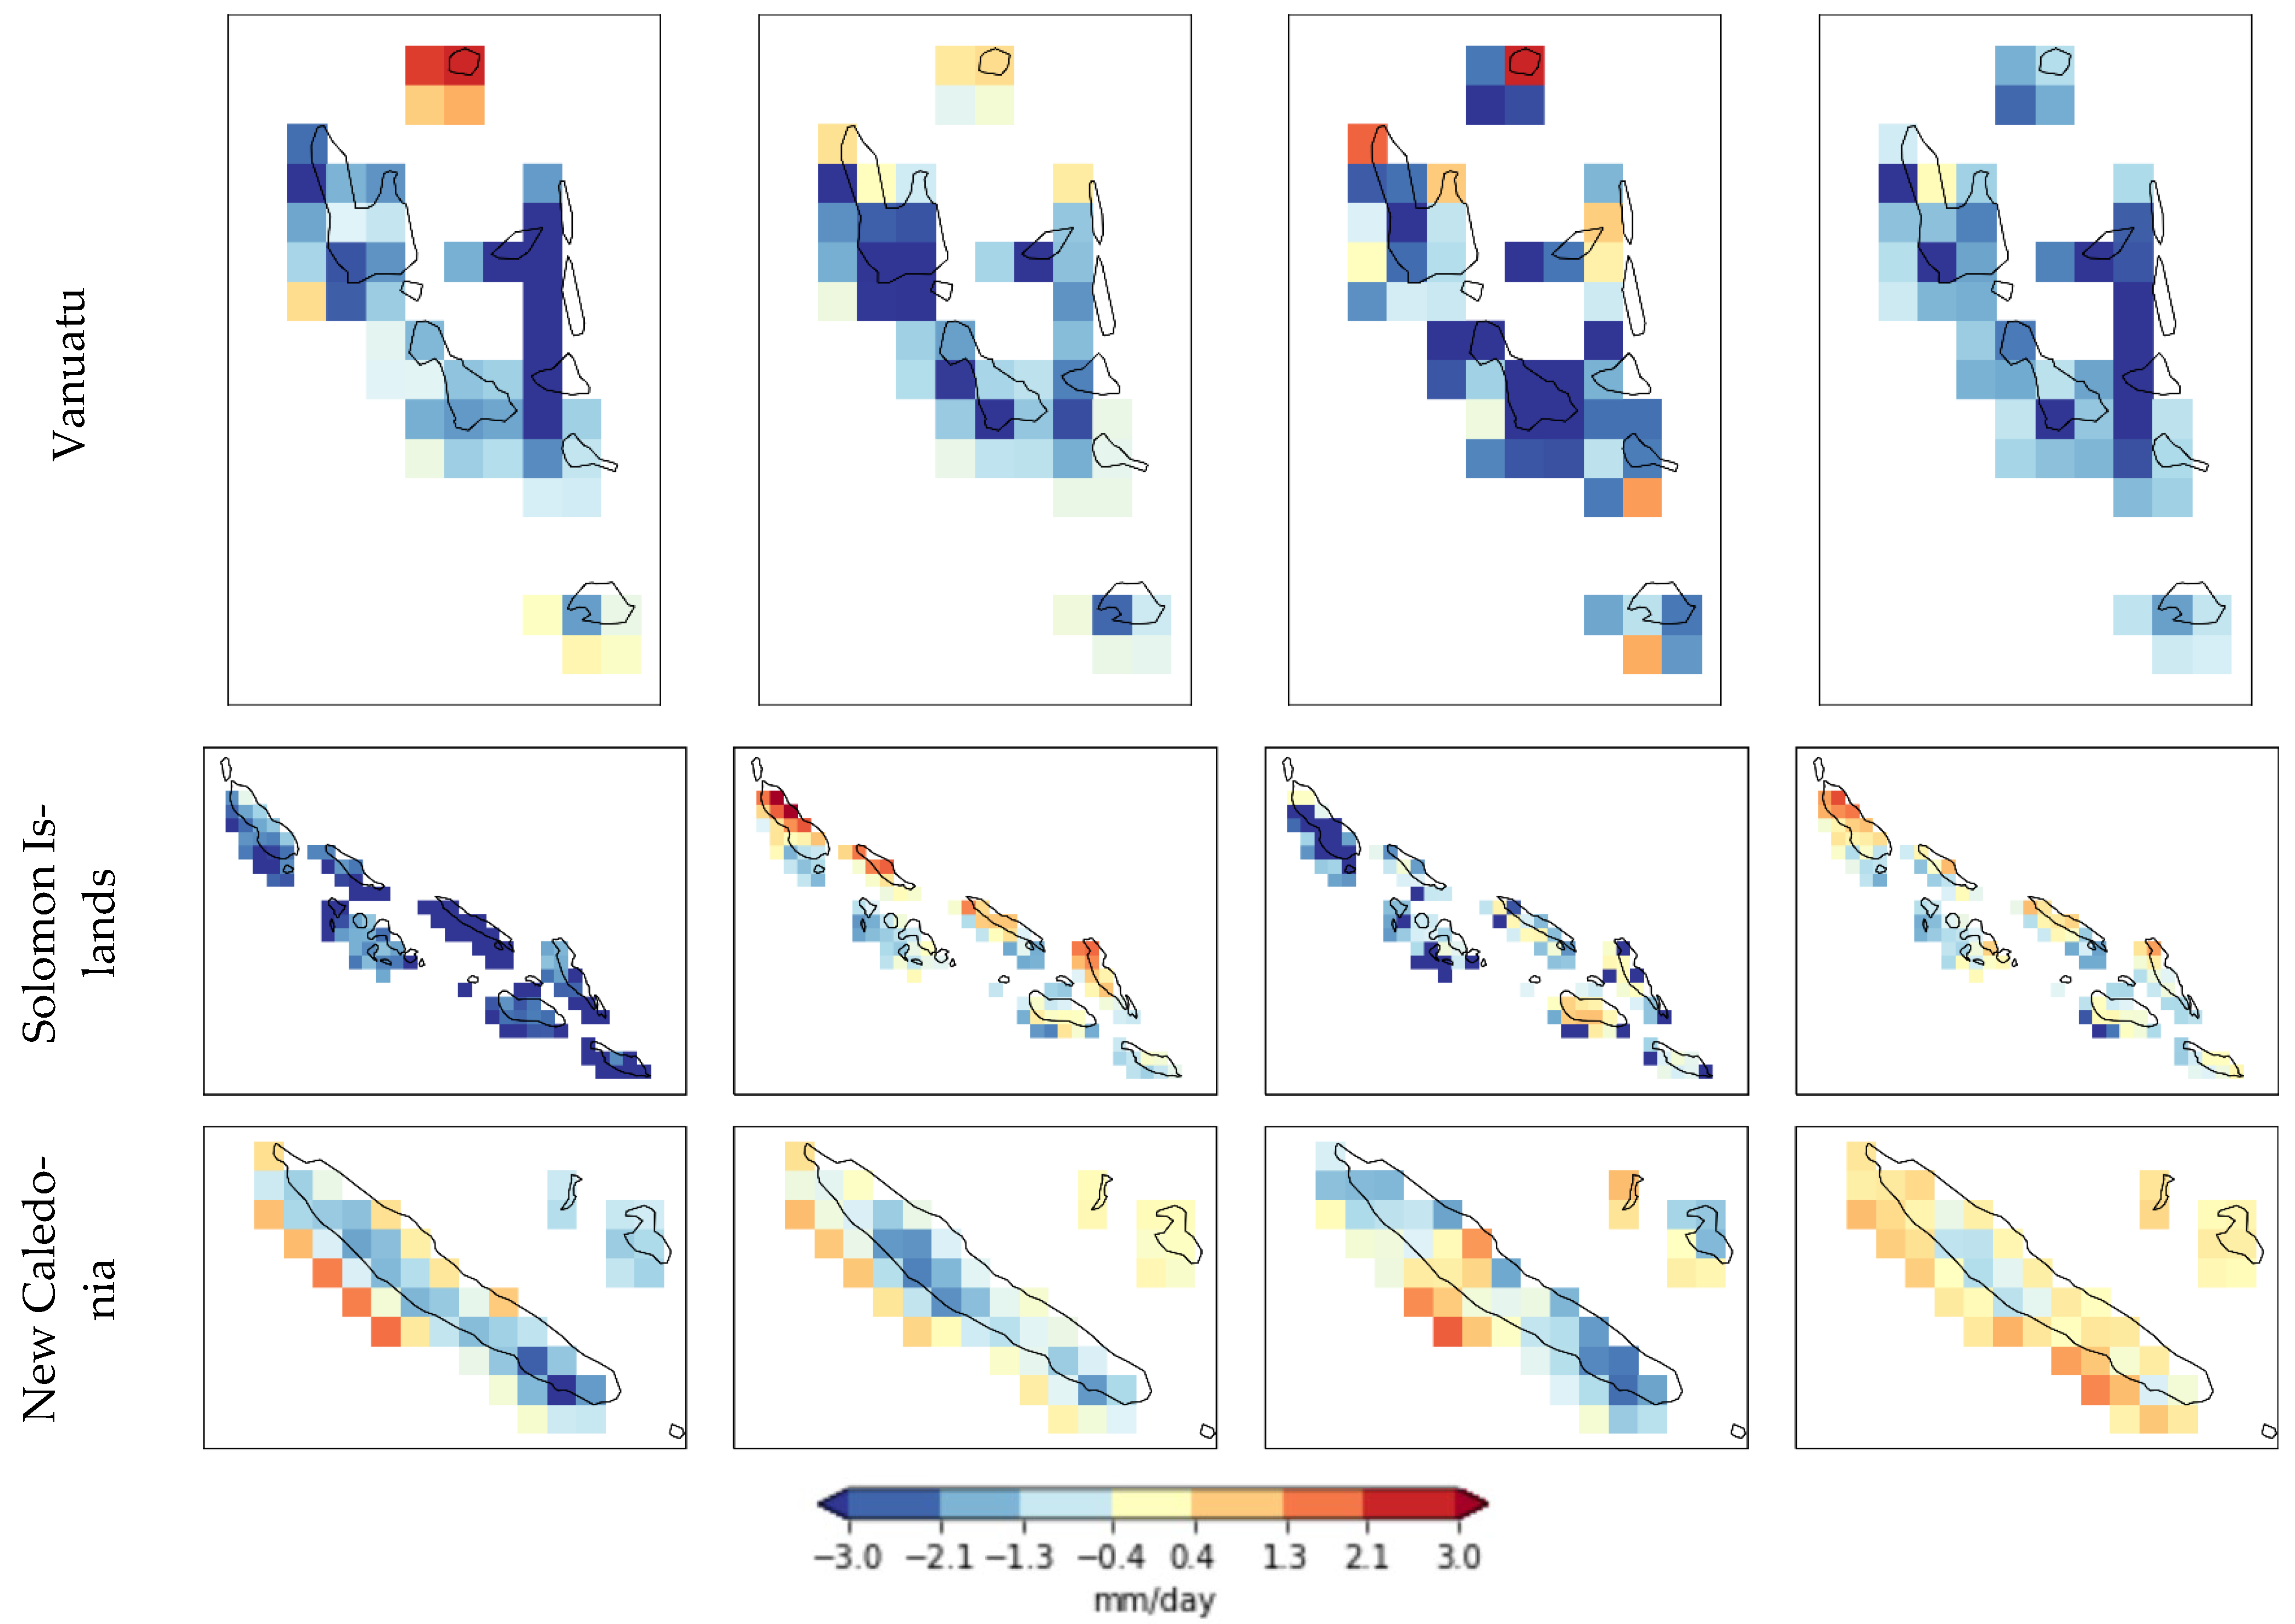
3.1. Performance of Datasets Compared to MSWEP
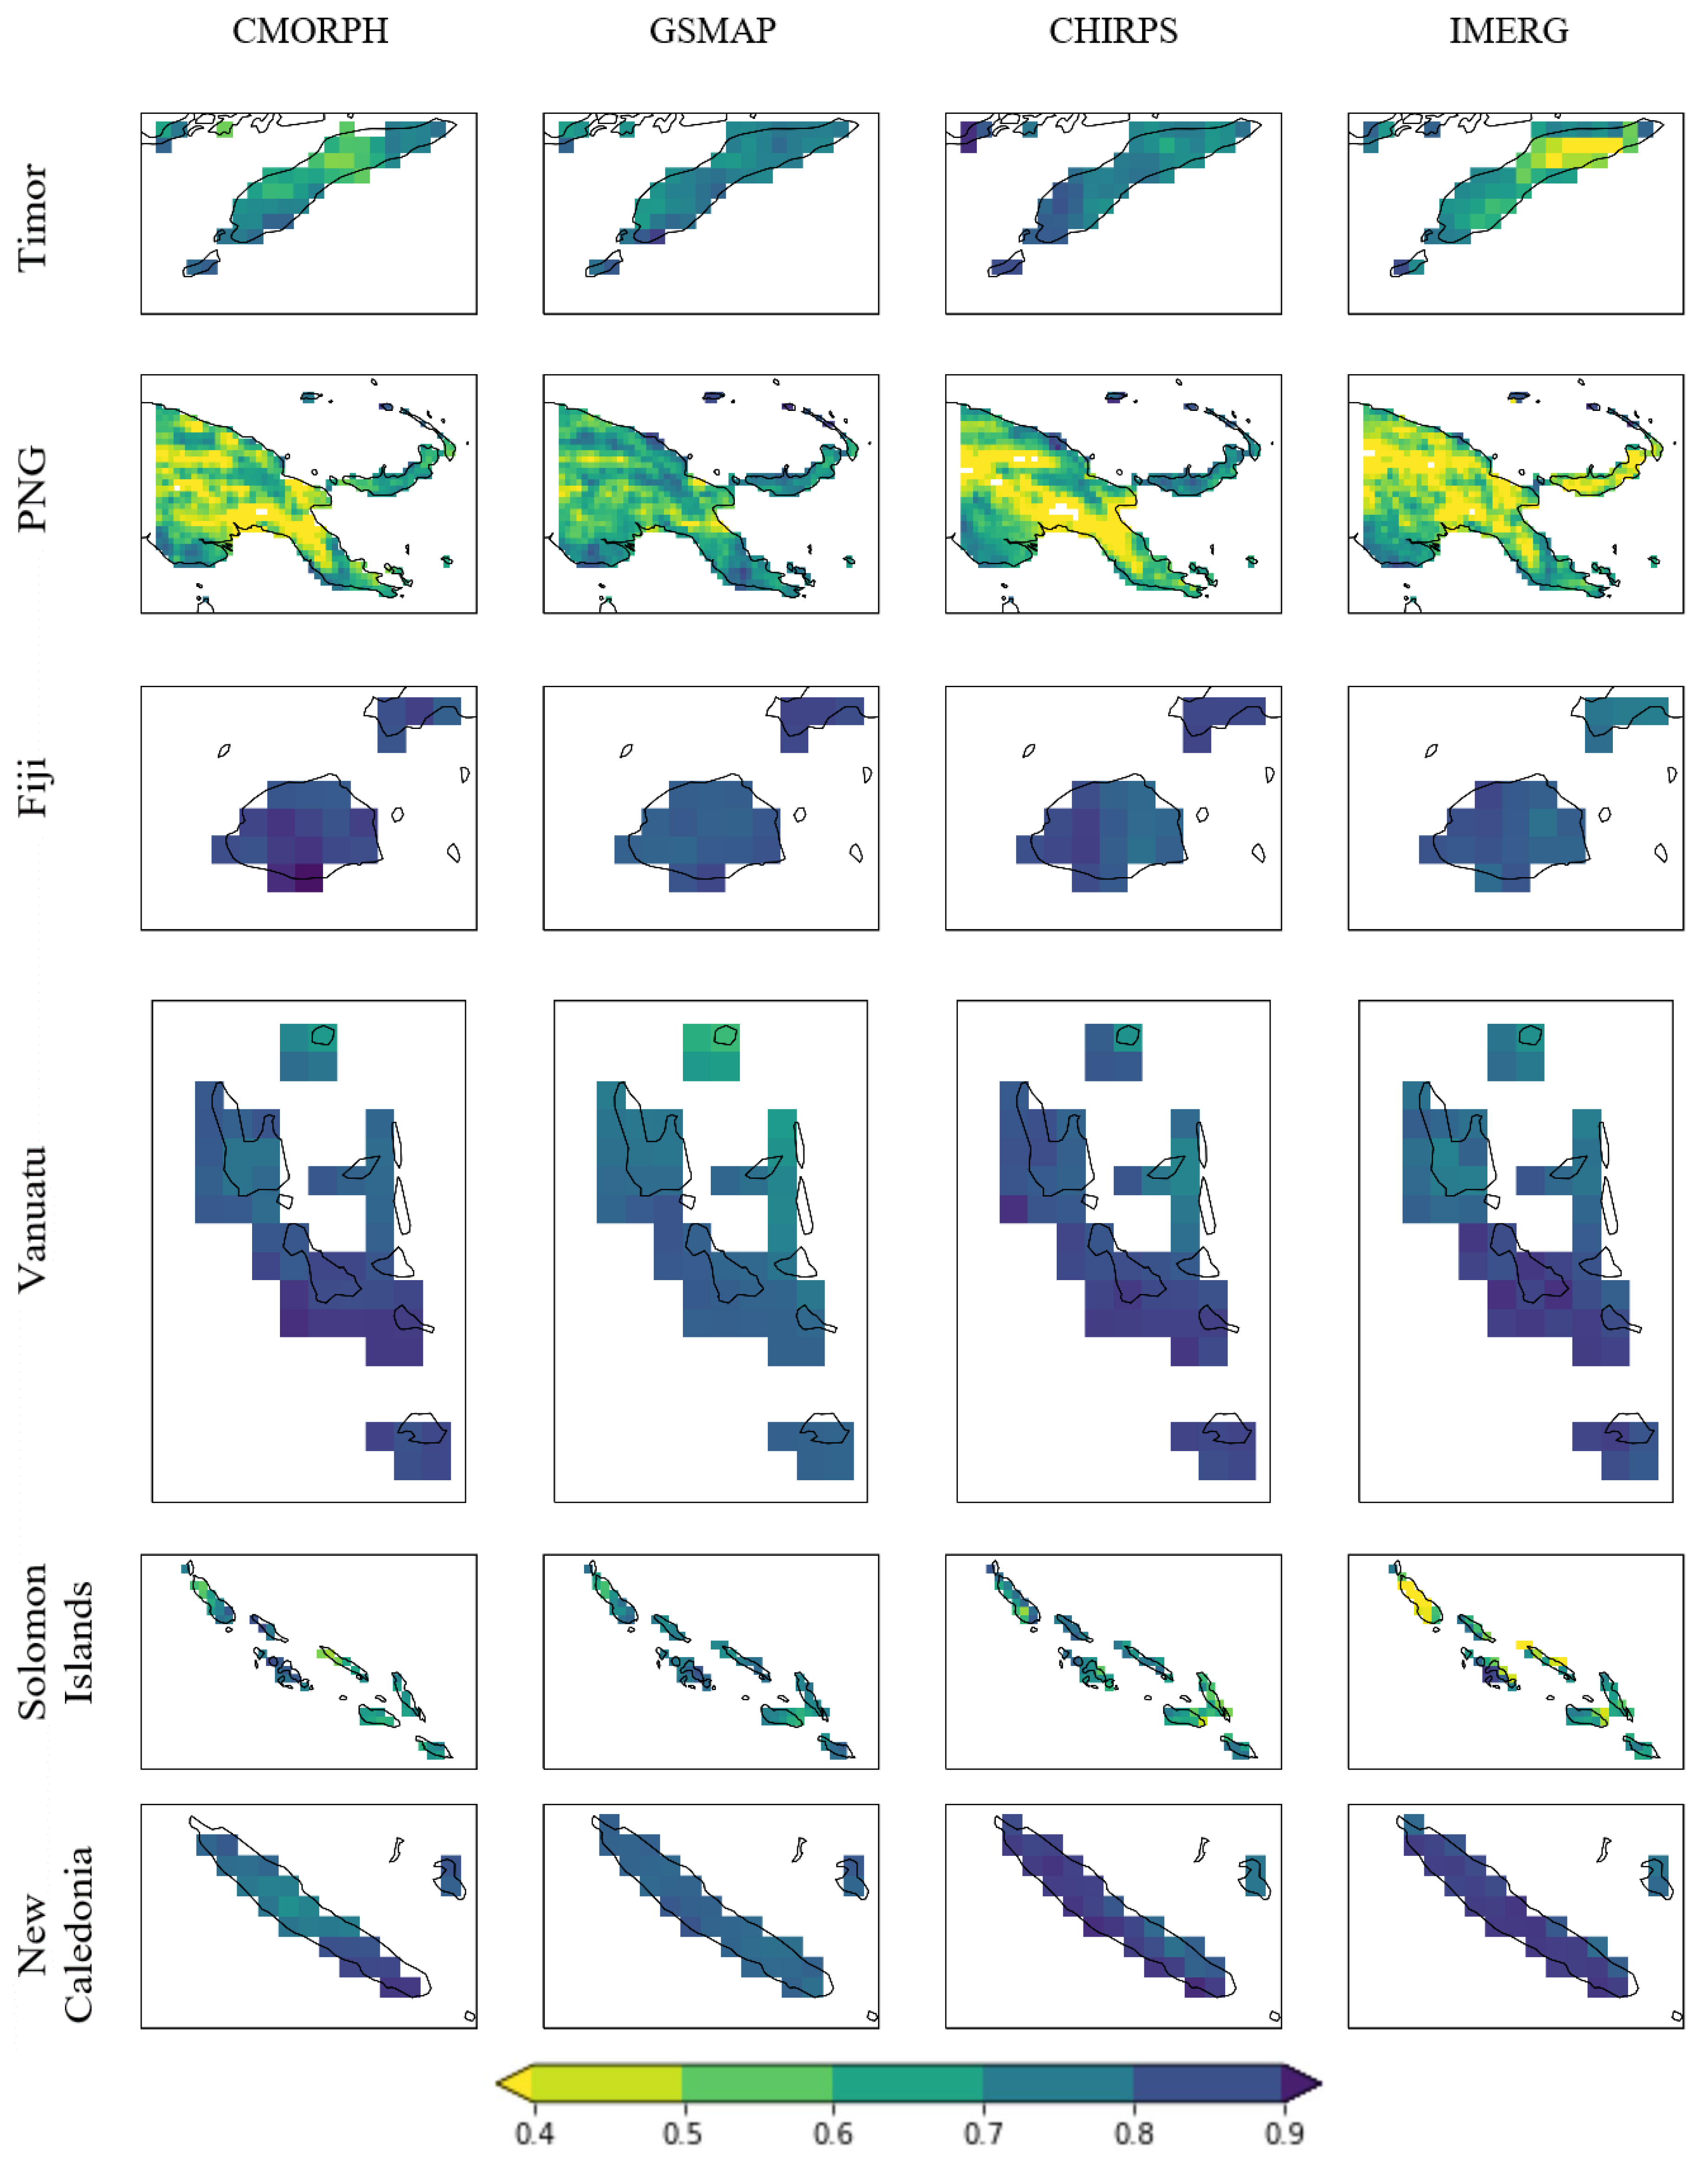
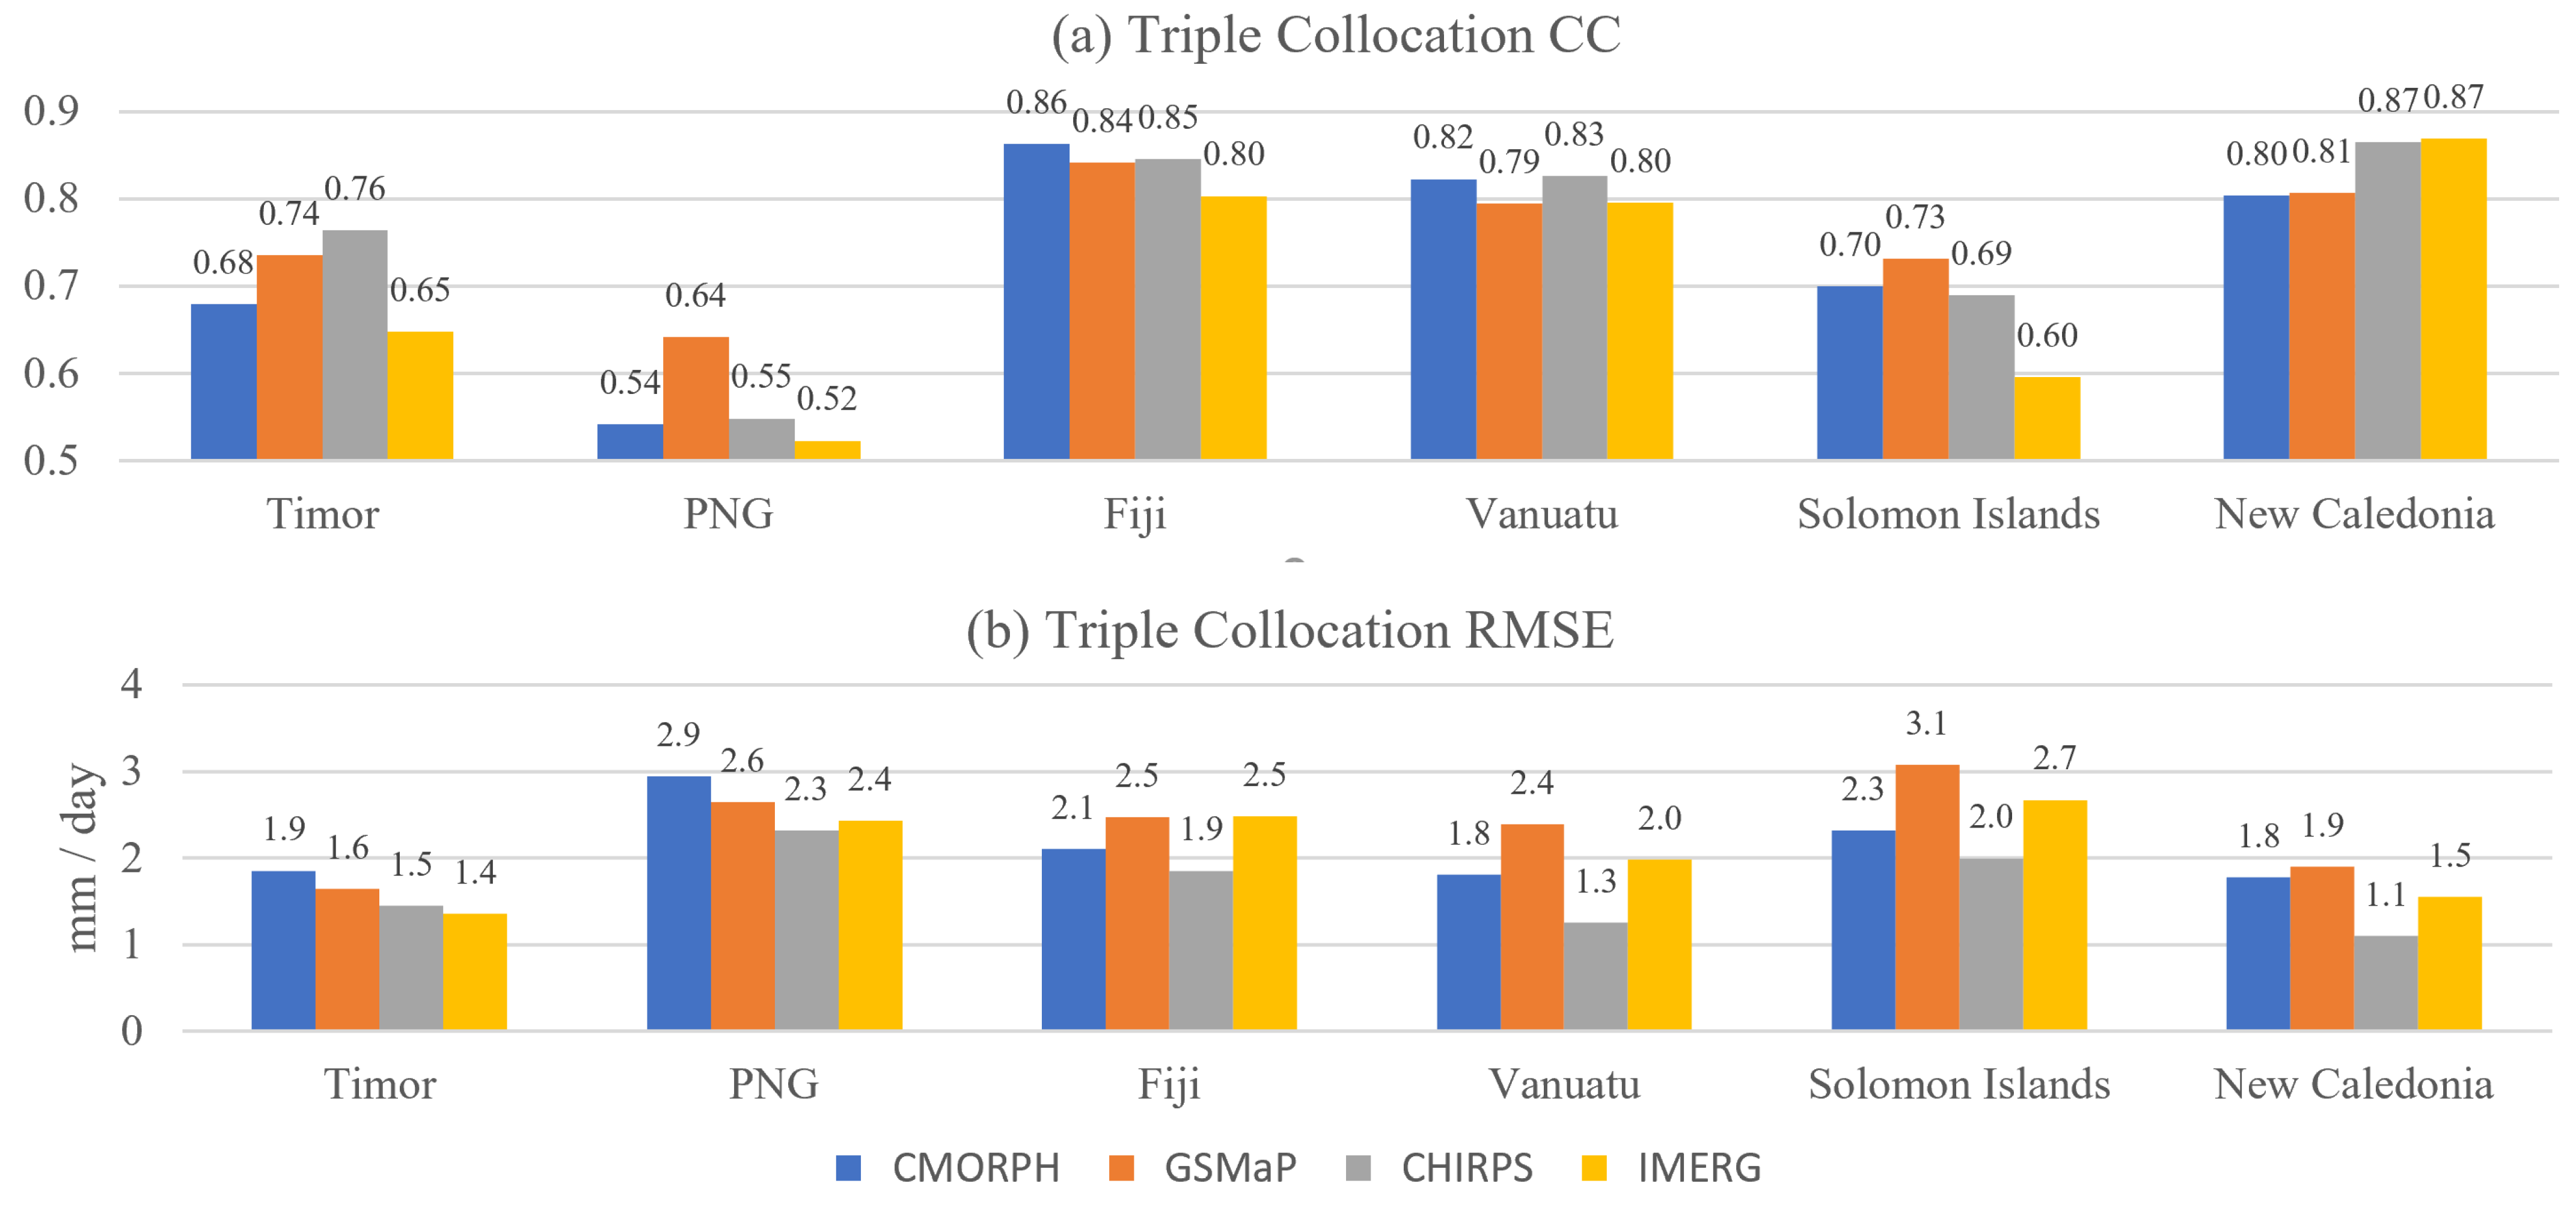
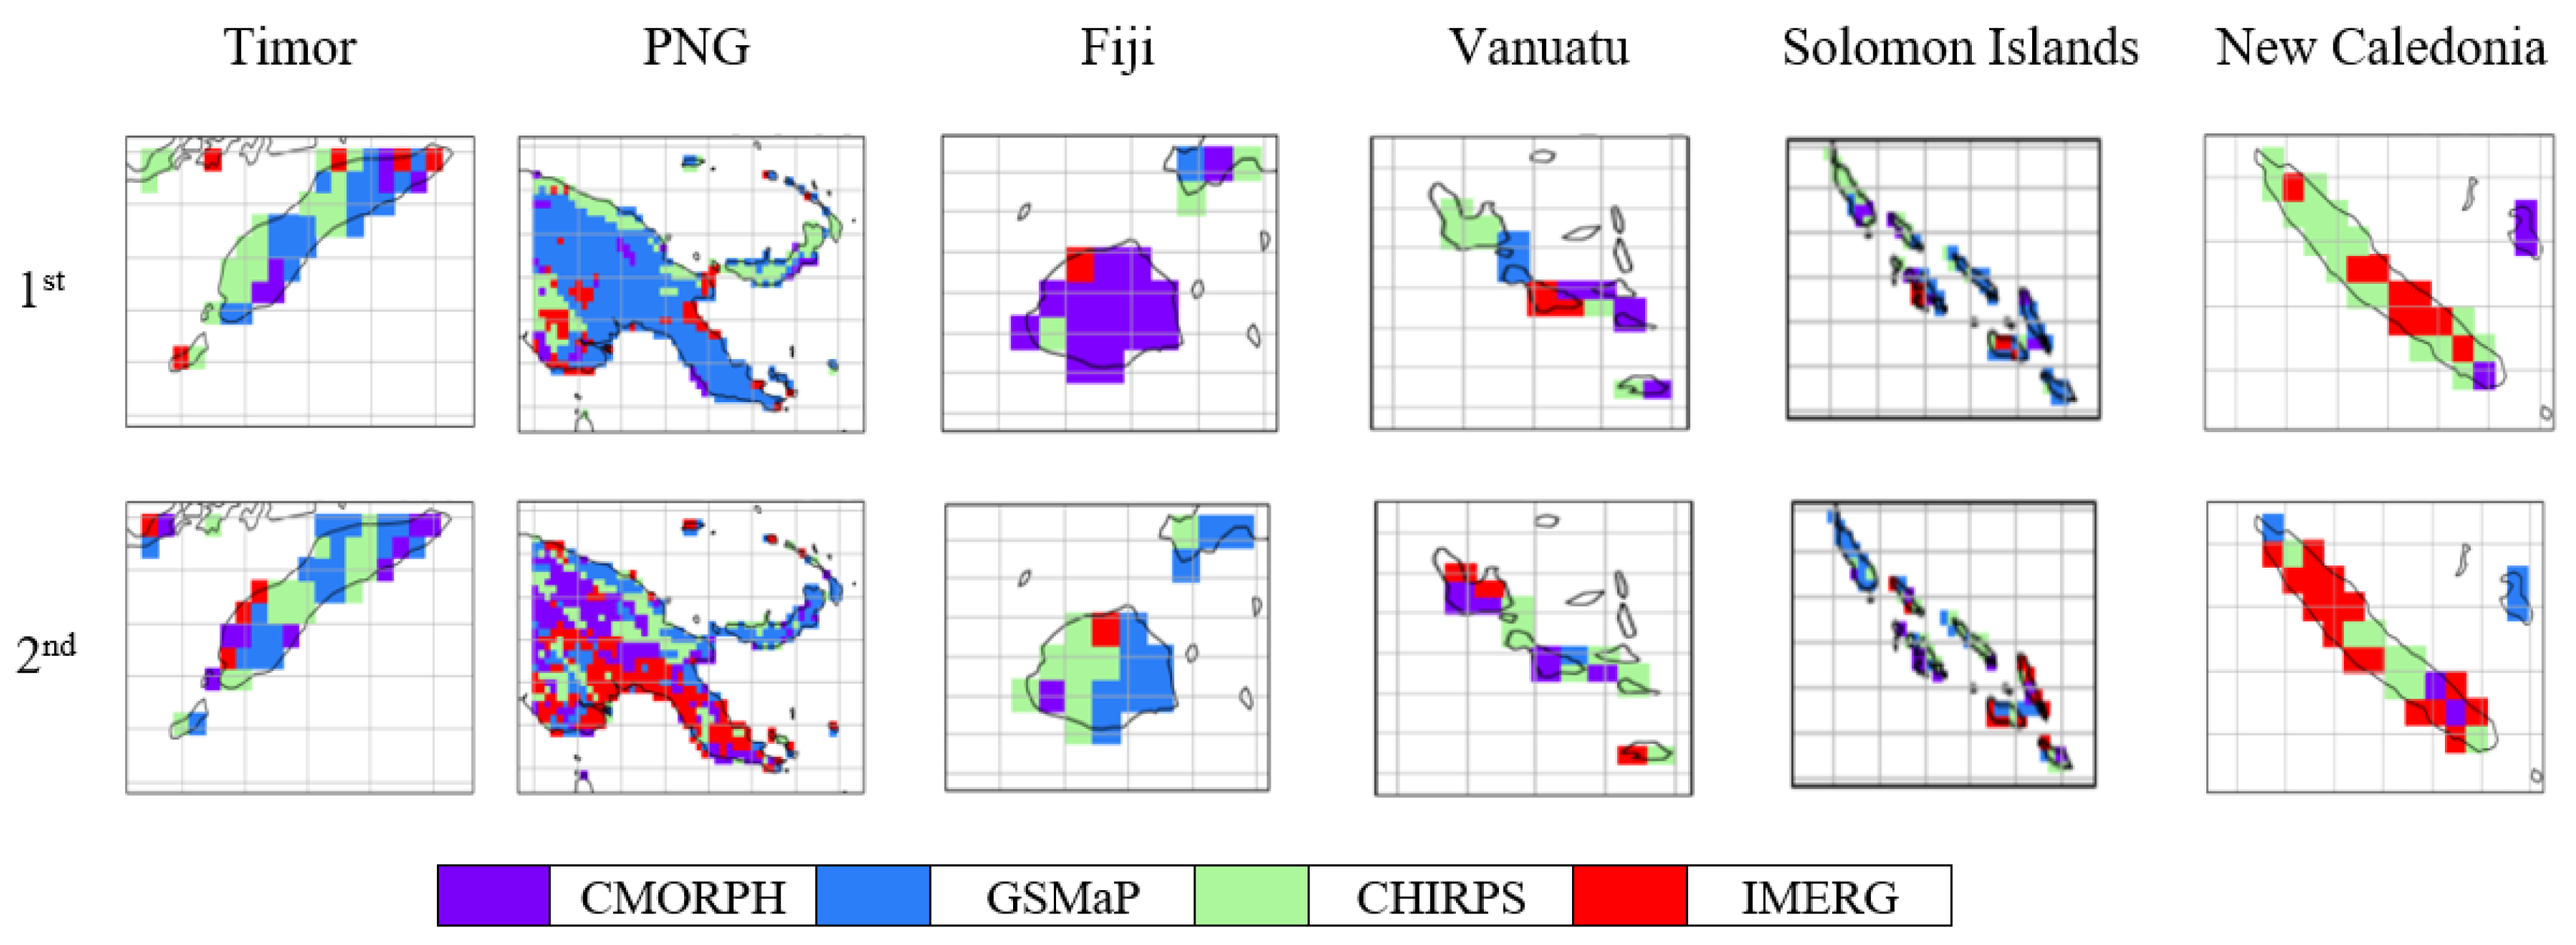
3.2. Triple Collocation Analysis
4. Discussion
5. Conclusions
Author Contributions
Funding
Institutional Review Board Statement
Informed Consent Statement
Data Availability Statement
Acknowledgments
Conflicts of Interest
Appendix A. Tabulated Results of Metrics

| Timor | PNG | Fiji | Vanuatu | Solomon Islands | New Caledonia | Average | |||
|---|---|---|---|---|---|---|---|---|---|
| MBE | Mean | CMORPH | −0.363 | −1.704 | −0.245 | −1.392 | −3.052 | −0.709 | −1.244 |
| GSMaP | −0.552 | −1.151 | −1.166 | −1.417 | −0.271 | −0.487 | −0.841 | ||
| CHIRPS | 0.097 | −0.974 | −1.019 | −1.748 | −1.962 | −0.590 | −1.033 | ||
| SM2RAIN-ASCAT | 0.516 | 1.052 | −1.027 | −0.879 | 0.502 | −0.207 | −0.007 | ||
| IMERG | 0.089 | −0.374 | −0.220 | −1.864 | −0.500 | 0.257 | −0.435 | ||
| Median | CMORPH | −0.421 | −1.675 | −0.338 | −1.365 | −2.685 | −0.905 | −1.232 | |
| GSMaP | −0.638 | −1.094 | −1.029 | −1.244 | −0.414 | −0.425 | −0.807 | ||
| CHIRPS | 0.050 | −0.911 | −1.391 | −2.318 | −1.275 | −0.616 | −1.077 | ||
| SM2RAIN-ASCAT | 0.675 | 0.620 | −0.965 | −0.663 | 0.353 | −0.354 | −0.056 | ||
| IMERG | 0.126 | −0.468 | −0.159 | −1.670 | −0.523 | 0.336 | −0.393 | ||
| Quint | Lower | CMORPH | 93.881 | 87.028 | 93.954 | 94.369 | 94.909 | 93.984 | 93.021 |
| GSMaP | 95.788 | 87.772 | 90.060 | 94.070 | 95.356 | 90.241 | 92.215 | ||
| CHIRPS | 91.176 | 85.556 | 90.904 | 93.064 | 94.164 | 90.525 | 90.898 | ||
| SM2RAIN-ASCAT | 91.607 | 81.947 | 88.453 | 89.651 | 92.786 | 90.157 | 89.100 | ||
| IMERG | 93.773 | 88.136 | 92.484 | 94.369 | 95.588 | 92.948 | 92.883 | ||
| Upper | CMORPH | 91.672 | 84.389 | 93.301 | 92.246 | 95.542 | 93.265 | 91.736 | |
| GSMaP | 93.191 | 86.024 | 90.877 | 92.277 | 95.658 | 91.293 | 91.554 | ||
| CHIRPS | 90.616 | 82.262 | 90.822 | 91.114 | 94.767 | 92.497 | 90.346 | ||
| SM2RAIN-ASCAT | 90.842 | 81.377 | 88.371 | 89.210 | 92.998 | 90.725 | 88.921 | ||
| IMERG | 91.715 | 86.160 | 91.068 | 93.237 | 95.969 | 93.934 | 92.014 | ||
| MAE | Mean | CMORPH | 1.067 | 1.928 | 1.363 | 1.651 | 1.640 | 1.141 | 1.465 |
| GSMaP | 0.989 | 1.822 | 1.780 | 1.892 | 2.185 | 1.392 | 1.677 | ||
| CHIRPS | 1.048 | 1.871 | 1.592 | 1.826 | 1.773 | 1.168 | 1.547 | ||
| SM2RAIN-ASCAT | 0.949 | 2.194 | 2.125 | 2.378 | 2.379 | 1.439 | 1.911 | ||
| IMERG | 0.860 | 1.611 | 1.547 | 1.574 | 1.531 | 1.106 | 1.372 | ||
| Median | CMORPH | 1.028 | 1.828 | 1.277 | 1.605 | 1.618 | 1.144 | 1.416 | |
| GSMaP | 0.969 | 1.795 | 1.812 | 1.842 | 2.173 | 1.433 | 1.671 | ||
| CHIRPS | 0.983 | 1.790 | 1.554 | 1.825 | 1.752 | 1.175 | 1.513 | ||
| SM2RAIN-ASCAT | 0.920 | 2.120 | 2.084 | 2.361 | 2.346 | 1.491 | 1.887 | ||
| IMERG | 0.807 | 1.508 | 1.511 | 1.598 | 1.531 | 1.079 | 1.339 | ||
| Pearson | Mean | CMORPH | 0.735 | 0.703 | 0.886 | 0.791 | 0.750 | 0.859 | 0.787 |
| GSMaP | 0.802 | 0.740 | 0.851 | 0.774 | 0.767 | 0.821 | 0.792 | ||
| CHIRPS | 0.732 | 0.607 | 0.841 | 0.740 | 0.691 | 0.852 | 0.744 | ||
| SM2RAIN-ASCAT | 0.723 | 0.509 | 0.668 | 0.531 | 0.427 | 0.732 | 0.598 | ||
| IMERG | 0.788 | 0.720 | 0.865 | 0.787 | 0.788 | 0.865 | 0.802 | ||
| Median | CMORPH | 0.737 | 0.709 | 0.894 | 0.787 | 0.754 | 0.858 | 0.790 | |
| GSMaP | 0.803 | 0.745 | 0.850 | 0.780 | 0.772 | 0.815 | 0.794 | ||
| CHIRPS | 0.742 | 0.611 | 0.831 | 0.740 | 0.705 | 0.849 | 0.747 | ||
| SM2RAIN-ASCAT | 0.738 | 0.510 | 0.671 | 0.534 | 0.427 | 0.773 | 0.609 | ||
| IMERG | 0.799 | 0.721 | 0.871 | 0.773 | 0.810 | 0.880 | 0.809 | ||
| RMSE | Mean | CMORPH | 1.658 | 2.589 | 2.032 | 2.482 | 2.198 | 1.642 | 2.100 |
| GSMaP | 1.525 | 2.434 | 2.475 | 2.856 | 2.876 | 1.892 | 2.343 | ||
| CHIRPS | 1.569 | 2.511 | 2.332 | 2.726 | 2.376 | 1.632 | 2.191 | ||
| SM2RAIN-ASCAT | 1.371 | 2.866 | 3.136 | 3.367 | 3.033 | 1.991 | 2.627 | ||
| IMERG | 1.294 | 2.134 | 2.148 | 2.494 | 2.034 | 1.564 | 1.945 | ||
| Median | CMORPH | 1.600 | 2.452 | 1.903 | 2.509 | 2.150 | 1.660 | 2.046 | |
| GSMaP | 1.502 | 2.411 | 2.503 | 2.756 | 2.847 | 1.951 | 2.328 | ||
| CHIRPS | 1.491 | 2.443 | 2.311 | 2.658 | 2.356 | 1.689 | 2.158 | ||
| SM2RAIN-ASCAT | 1.318 | 2.692 | 3.102 | 3.326 | 2.983 | 2.107 | 2.588 | ||
| IMERG | 1.225 | 2.006 | 2.133 | 2.533 | 2.057 | 1.547 | 1.917 | ||
References
- IPCC. Climate Change 2014: Synthesis Report. Contribution of Working Groups I, II and III to the Fifth Assessment Report of the Intergovernmental Panel on Climate Change; Core Writing Team, Ed.; IPCC: Geneva, Switzerland, 2014; p. 151. [Google Scholar]
- Stanley, T.; Kirschbaum, D.B.; Pascale, S.; Kapnick, S. Extreme precipitation in the Himalayan landslide hotspot. In Satellite Precipitation Measurement; Springer: Cham, Switzerland, 2020; pp. 1087–1111. [Google Scholar]
- Li, X.; Chen, Y.; Deng, X.; Zhang, Y.; Chen, L. Evaluation and hydrological utility of the GPM IMERG Precipitation products over the Xinfengjiang river reservoir basin, China. Remote Sens. 2021, 13, 866. [Google Scholar] [CrossRef]
- Dinku, T. The value of satellite rainfall estimates in agriculture and food security. In Satellite Precipitation Measurement; Springer: Cham, Switzerland, 2020; pp. 1113–1129. [Google Scholar]
- Funk, C.; Peterson, P.; Landsfeld, M.; Pedreros, D.; Verdin, J.; Shukla, S.; Husak, G.; Rowland, J.; Harrison, L.; Hoell, A.; et al. The climate hazards infrared precipitation with stations—A new environmental record for monitoring extremes. Sci. Data 2015, 2, 150066. [Google Scholar] [CrossRef] [PubMed] [Green Version]
- Tarnavsky, E.; Bonifacio, R. Drought risk management using satellite-based rainfall estimates. In Satellite Precipitation Measurement; Springer: Cham, Switzerland, 2020; pp. 1029–1053. [Google Scholar]
- Morin, E.; Marra, F.; Armon, M. Dryland precipitation climatology from satellite observations. In Satellite Precipitation Measurement; Springer: Cham, Switzerland, 2020; pp. 843–859. [Google Scholar]
- Kidd, C.; Shige, S.; Vila, D.; Tarnavsky, E.; Yamamoto, M.K.; Maggioni, V.; Maseko, B. The IPWG Satellite Precipitation Validation Effort The IPWG satellite precipitation validation effort. In Satellite Precipitation Measurement: Volume 2; Levizzani, V., Levizzani, V., Kidd, C., Kirschbaum, D.B., Kummerow, C.D., Nakamura, K., Turk, F.J., Eds.; Springer International Publishing: Berlin, Germany, 2020; pp. 453–470. [Google Scholar]
- Ebert, E.E.; Janowiak, J.E.; Kidd, C. Comparison of near-real-time precipitation estimates from satellite observations and numerical models. Bull. Am. Meteorol. Soc. 2007, 88, 47–64. [Google Scholar] [CrossRef] [Green Version]
- Massari, C.; Crow, W.; Brocca, L. An assessment of the performance of global rainfall estimates without ground-based observations. Hydrol. Earth Syst. Sci. 2017, 21, 4347–4361. [Google Scholar] [CrossRef] [Green Version]
- Alemohammad, S.H.; McColl, K.A.; Konings, A.G.; Entekhabi, D.; Stoffelen, A. Characterization of precipitation product errors across the United States using multiplicative triple collocation. Hydrol. Earth Syst. Sci. 2015, 19, 3489–3503. [Google Scholar] [CrossRef] [Green Version]
- De Freitas, C.R.; Helbig, M.; Matzarakis, A. Hydroclimatic assessment of water resources of low Pacific islands: Evaluating sensitivity to climatic change and variability. Int. J. Climatol. 2014, 34, 881–892. [Google Scholar] [CrossRef]
- CSIRO; Bureau of Meteorology. Climate Change in the Pacific: Scientific Assessment and New Research; Program, P.C.C.S., Ed.; Australian Government: Aspendale, Australia, 2011; p. 272. [Google Scholar]
- Kuleshov, Y.; McGree, S.; Jones, D.; Charles, A.; Cottrill, A.; Prakash, B.; Atalifo, T.; Nihmei, S.; Seuseu, F.L.S.K. Extreme weather and climate events and their impacts on island countries in the western Pacific: Cyclones, floods and droughts. Atmos. Clim. Sci. 2014, 4, 803–818. [Google Scholar] [CrossRef] [Green Version]
- Tahani, L.; Prakash, B.; Ngari, A.; Malala, H.; Mackenzie, B.; Inape, K.; Finaulahi, S.; Ene, E.; Kuleshov, Y.; Schreider, S.; et al. Recent changes in mean and extreme temperature and precipitation in the western Pacific islands. J. Clim. 2019, 32, 4919–4941. [Google Scholar] [CrossRef]
- McGree, S.; Schreider, S.; Kuleshov, Y. Trends and variability in droughts in the Pacific islands and northeast Australia. J. Clim. 2016, 29, 8377–8397. [Google Scholar] [CrossRef]
- Chen, F.; Crow, W.T.; Ciabatta, L.; Filippucci, P.; Panegrossi, G.; Marra, A.C.; Puca, S.; Massari, C. Enhanced large-scale validation of satellite-based land rainfall products. J. Hydrometeorol. 2021, 22, 245–257. [Google Scholar] [CrossRef]
- Li, C.; Tang, G.; Hong, Y. Cross-evaluation of ground-based, multi-satellite and reanalysis precipitation products: Applicability of the triple collocation method across mainland China. J. Hydrol. 2018, 562, 71–83. [Google Scholar] [CrossRef]
- Tanim, A.H.; Mullick, M.R.A.; Sikdar, M.S. Evaluation of spatial rainfall products in sparsely gauged region using copula uncertainty modeling with triple collocation. J. Hydrol. Eng. 2021, 26. [Google Scholar] [CrossRef]
- Chen, F.; Crow, W.T.; Ciabatta, L.; Filippucci, P.; Panegrossi, G.; Marra, A.C.; Puca, S.; Massari, C. Daily evaluation of 26 precipitation datasets using Stage-IV gauge-radar data for the CONUS. Hydrol. Earth Syst. Sci. 2019, 23, 207–224. [Google Scholar] [CrossRef] [Green Version]
- Brocca, L.; Filippucci, P.; Hahn, S.; Ciabatta, L.; Massari, C.; Camici, S.; Schüller, L.; Bojkov, B.; Wagner, W. SM2RAIN–ASCAT (2007–2018): Global daily satellite rainfall data from ASCAT soil moisture observations. Earth Syst. Sci. Data 2019, 11, 1583–1601. [Google Scholar] [CrossRef] [Green Version]
- Tashima, T.; Kubota, T.; Mega, T.; Ushio, T.; Oki, R. Precipitation extremes monitoring using the near-real-time GSMaP product. IEEE J. Sel. Top. Appl. Earth Obs. Remote Sens. 2020, 13, 5640–5651. [Google Scholar] [CrossRef]
- Huffman, G.J.; Bolvin, D.T.; Braithwaite, D.; Hsu, K.; Joyce, R.; Xie, P. Integrated Multi-Satellite Retrievals for GPM (IMERG), Algorithm Theoretical Basis Document; NASA: Washington, DC, USA, 2018. [Google Scholar]
- Kubota, T.; Aonashi, K.; Ushio, T.; Shige, S.; Takayabu, Y.N.; Kachi, M.; Arai, Y.; Tashima, T.; Masaki, T.; Kawamoto, N.; et al. Global satellite mapping of precipitation (GSMaP) products in the GPM Era. Satell. Precip. Meas. 2020, 1, 355–373. [Google Scholar]
- Lu, D.; Yong, B. Evaluation and hydrological utility of the latest GPM IMERG V5 and GSMaP V7 precipitation products over the Tibetan plateau. Remote Sens. 2018, 10, 2022. [Google Scholar] [CrossRef] [Green Version]
- Xie, P.; Joyce, R.; Wu, S.; Yoo, S.-H.; Yarosh, Y.; Sun, F.; Lin, R. Reprocessed, bias-corrected CMORPH global high-resolution precipitation estimates from 1998. J. Hydrometeorol. 2017, 18, 1617–1641. [Google Scholar] [CrossRef]
- Chua, Z.-W.; Kuleshov, Y.; Watkins, A. Evaluation of satellite precipitation estimates over Australia. Remote Sens. 2020, 12, 678. [Google Scholar] [CrossRef] [Green Version]
- Chua, Z.-W.; Kuleshov, Y.; Watkins, A.B. Drought detection over Papua New Guinea using satellite-derived products. Remote Sens. 2020, 12, 3589. [Google Scholar] [CrossRef]
- Kuleshov, Y.; Kurino, T.; Kubota, T.; Tashima, T.; Xie, P. WMO space-basedweather and climate extremes monitoring demonstration project (SEMDP): First outcomes of regional cooperation on drought and heavy precipitation monitoring for Australia and Southeast Asia. In RAINFALL—Extremes, Distribution and Properties; IntechOpen: London, UK, 2019; pp. 51–57. [Google Scholar]
- Huffman, G.J.; Bolvin, D.T.; Braithwaite, D.; Hsu, K.-L.; Joyce, R.J.; Kidd, C.; Nelkin, E.J.; Sorooshian, S.; Stocker, E.F.; Tan, J.; et al. Integrated multi-satellite retrievals for the global precipitation measurement (GPM) mission (IMERG). In Satellite Precipitation Measurement; Springer: Cham, Switzerland, 2020; pp. 343–353. [Google Scholar]
- Massari, C.; Maggioni, V. Error and uncertainty characterization. In Satellite Precipitation Measurement: Volume 2; Levizzani, V., Kidd, C., Kirschbaum, D.B., Kummerow, C.D., Nakamura, K., Turk, F.J., Eds.; Springer International Publishing: Cham, Switzerland, 2020; pp. 515–532. [Google Scholar]
- Beck, H.E.; van Dijk, A.I.J.M.; Levizzani, V.; Schellekens, J.; Miralles, D.G.; Martens, B.; de Roo, A. MSWEP: 3-hourly 0.25° global gridded precipitation (1979–2015) by merging gauge, satellite, and reanalysis data. Hydrol. Earth Syst. Sci. 2017, 21, 589–615. [Google Scholar] [CrossRef] [Green Version]
- Brocca, L.; Moramarco, T.; Melone, F.; Wagner, W. A new method for rainfall estimation through soil moisture observations. Geophys. Res. Lett. 2013, 40, 853–858. [Google Scholar] [CrossRef]
- Hersbach, H.; Bell, B.; Berrisford, P.; Hirahara, S.; Horányi, A.; Muñoz-Sabater, J.; Nicolas, J.; Peubey, C.; Radu, R.; Schepers, D.; et al. The ERA5 global reanalysis. Q. J. R. Meteorol. Soc. 2020, 146, 1999–2049. [Google Scholar] [CrossRef]
- Hersbach, H.; Bell, B.; Berrisford, P.; Hirahara, S.; Horányi, A.; Muñoz-Sabater, J.; Nicolas, J.; Peubey, C.; Radu, R.; Schepers, D.; et al. Estimating error cross-correlations in soil moisture data sets using extended collocation analysis. J. Geophys. Res. Atmos. 2016, 121, 1208–1219. [Google Scholar] [CrossRef] [Green Version]
- Hersbach, H.; Bell, B.; Berrisford, P.; Hirahara, S.; Horányi, A.; Muñoz-Sabater, J.; Nicolas, J.; Peubey, C.; Radu, R.; Schepers, D.; et al. Extended triple collocation: Estimating errors and correlation coefficients with respect to an unknown target. Geophys. Res. Lett. 2014, 41, 6229–6236. [Google Scholar] [CrossRef] [Green Version]
- Hersbach, H.; Bell, B.; Berrisford, P.; Hirahara, S.; Horányi, A.; Muñoz-Sabater, J.; Nicolas, J.; Peubey, C.; Radu, R.; Schepers, D.; et al. Tropical cyclone genesis in the Southern Hemisphere and its relationship with the ENSO. In Annales Geophysicae; Copernicus GmbH: Gottingen, Germany, 2009. [Google Scholar]
- Kuleshov, Y. Climate change and southern hemisphere tropical cyclones international initiative: Twenty years of successful regional cooperation. In Climate Change, Hazards and Adaptation Options; Springer: Dodrecht, The Netherlands, 2020; pp. 411–439. [Google Scholar]
- Khan, S.; Maggioni, V. Assessment of level-3 gridded global precipitation mission (GPM) products over oceans. Remote Sens. 2019, 11, 255. [Google Scholar] [CrossRef] [Green Version]
- Beck, H.E.; Vergopolan, N.; Pan, M.; Levizzani, V.; van Dijk, A.I.J.M.; Weedon, G.P.; Brocca, L.; Pappenberger, F.; Huffman, G.J.; Wood, E.F. Global-scale evaluation of 22 precipitation datasets using gauge observations and hydrological modeling. Hydrol. Earth Syst. Sci. 2017, 21, 6201–6217. [Google Scholar] [CrossRef] [Green Version]
- Sun, Q.; Miao, C.; Duan, Q.; Ashouri, H.; Sorooshian, S.; Hsu, K.L. A review of global precipitation data sets: Data sources, estimation, and intercomparisons. Rev. Geophys. 2018, 56, 79–107. [Google Scholar] [CrossRef] [Green Version]
- Yang, S.; Chen, M.; Xie, P.; Yatagai, A.; Hayasaka, T.; Fukushima, Y.; Liu, C. A gauge-based analysis of daily precipitation over East Asia. J. Hydrometeorol. 2007, 8, 607–626. [Google Scholar] [CrossRef]
- Yang, S.; Chen, M.; Xie, P.; Yatagai, A.; Hayasaka, T.; Fukushima, Y.; Liu, C. So, how much of the Earth’s surface is covered by rain gauges? Bull. Am. Meteorol. Soc. 2017, 98, 69–78. [Google Scholar] [CrossRef]
- Masunaga, H.; Schröder, M.; Furuzawa, F.A.; Kummerow, C.; Rustemeier, E.; Schneider, U. Inter-product biases in global precipitation extremes. Environ. Res. Lett. 2019, 14. [Google Scholar] [CrossRef]
- Tarpanelli, A.; Massari, C.; Ciabatta, L.; Filippucci, P.; Amarnath, G.; Brocca, L. Exploiting a constellation of satellite soil moisture sensors for accurate rainfall estimation. Adv. Water Resour. 2017, 108, 249–255. [Google Scholar] [CrossRef]
- Tarpanelli, A.; Massari, C.; Ciabatta, L.; Filippucci, P.; Amarnath, G.; Brocca, L. Soil moisture and precipitation: The SM2RAIN algorithm for rainfall retrieval from satellite soil moisture. In Satellite Precipitation Measurement; Springer: Cham, Switzerland, 2020; pp. 1013–1027. [Google Scholar]
- Chew, C.C.; Small, E.E. Soil moisture sensing using spaceborne GNSS reflections: Comparison of CYGNSS reflectivity to SMAP soil moisture. Geophys. Res. Lett. 2018, 45, 4049–4057. [Google Scholar] [CrossRef] [Green Version]
- Chen, S.; Hong, Y.; Cao, Q.; Kirstetter, P.-E.; Gourley, J.J.; Qi, Y.; Zhang, J.; Howard, K.; Hu, J.; Wang, J. Performance evaluation of radar and satellite rainfalls for Typhoon Morakot over Taiwan: Are remote-sensing products ready for gauge denial scenario of extreme events? J. Hydrol. 2013, 506, 4–13. [Google Scholar] [CrossRef]


Publisher’s Note: MDPI stays neutral with regard to jurisdictional claims in published maps and institutional affiliations. |
© 2021 by the authors. Licensee MDPI, Basel, Switzerland. This article is an open access article distributed under the terms and conditions of the Creative Commons Attribution (CC BY) license (https://creativecommons.org/licenses/by/4.0/).
Share and Cite
Wild, A.; Chua, Z.-W.; Kuleshov, Y. Evaluation of Satellite Precipitation Estimates over the South West Pacific Region. Remote Sens. 2021, 13, 3929. https://doi.org/10.3390/rs13193929
Wild A, Chua Z-W, Kuleshov Y. Evaluation of Satellite Precipitation Estimates over the South West Pacific Region. Remote Sensing. 2021; 13(19):3929. https://doi.org/10.3390/rs13193929
Chicago/Turabian StyleWild, Ashley, Zhi-Weng Chua, and Yuriy Kuleshov. 2021. "Evaluation of Satellite Precipitation Estimates over the South West Pacific Region" Remote Sensing 13, no. 19: 3929. https://doi.org/10.3390/rs13193929
APA StyleWild, A., Chua, Z.-W., & Kuleshov, Y. (2021). Evaluation of Satellite Precipitation Estimates over the South West Pacific Region. Remote Sensing, 13(19), 3929. https://doi.org/10.3390/rs13193929