
Association of Novel Advanced Glycation End-Product (AGE10) with Complications of Diabetes as Measured by Enzyme-Linked Immunosorbent Assay

 , ,
, ,
Abstract
:1. Introduction
2. Materials and Methods
2.1. Analytical Methods Used during Developing an Immunoassay for AGE10 Quantification
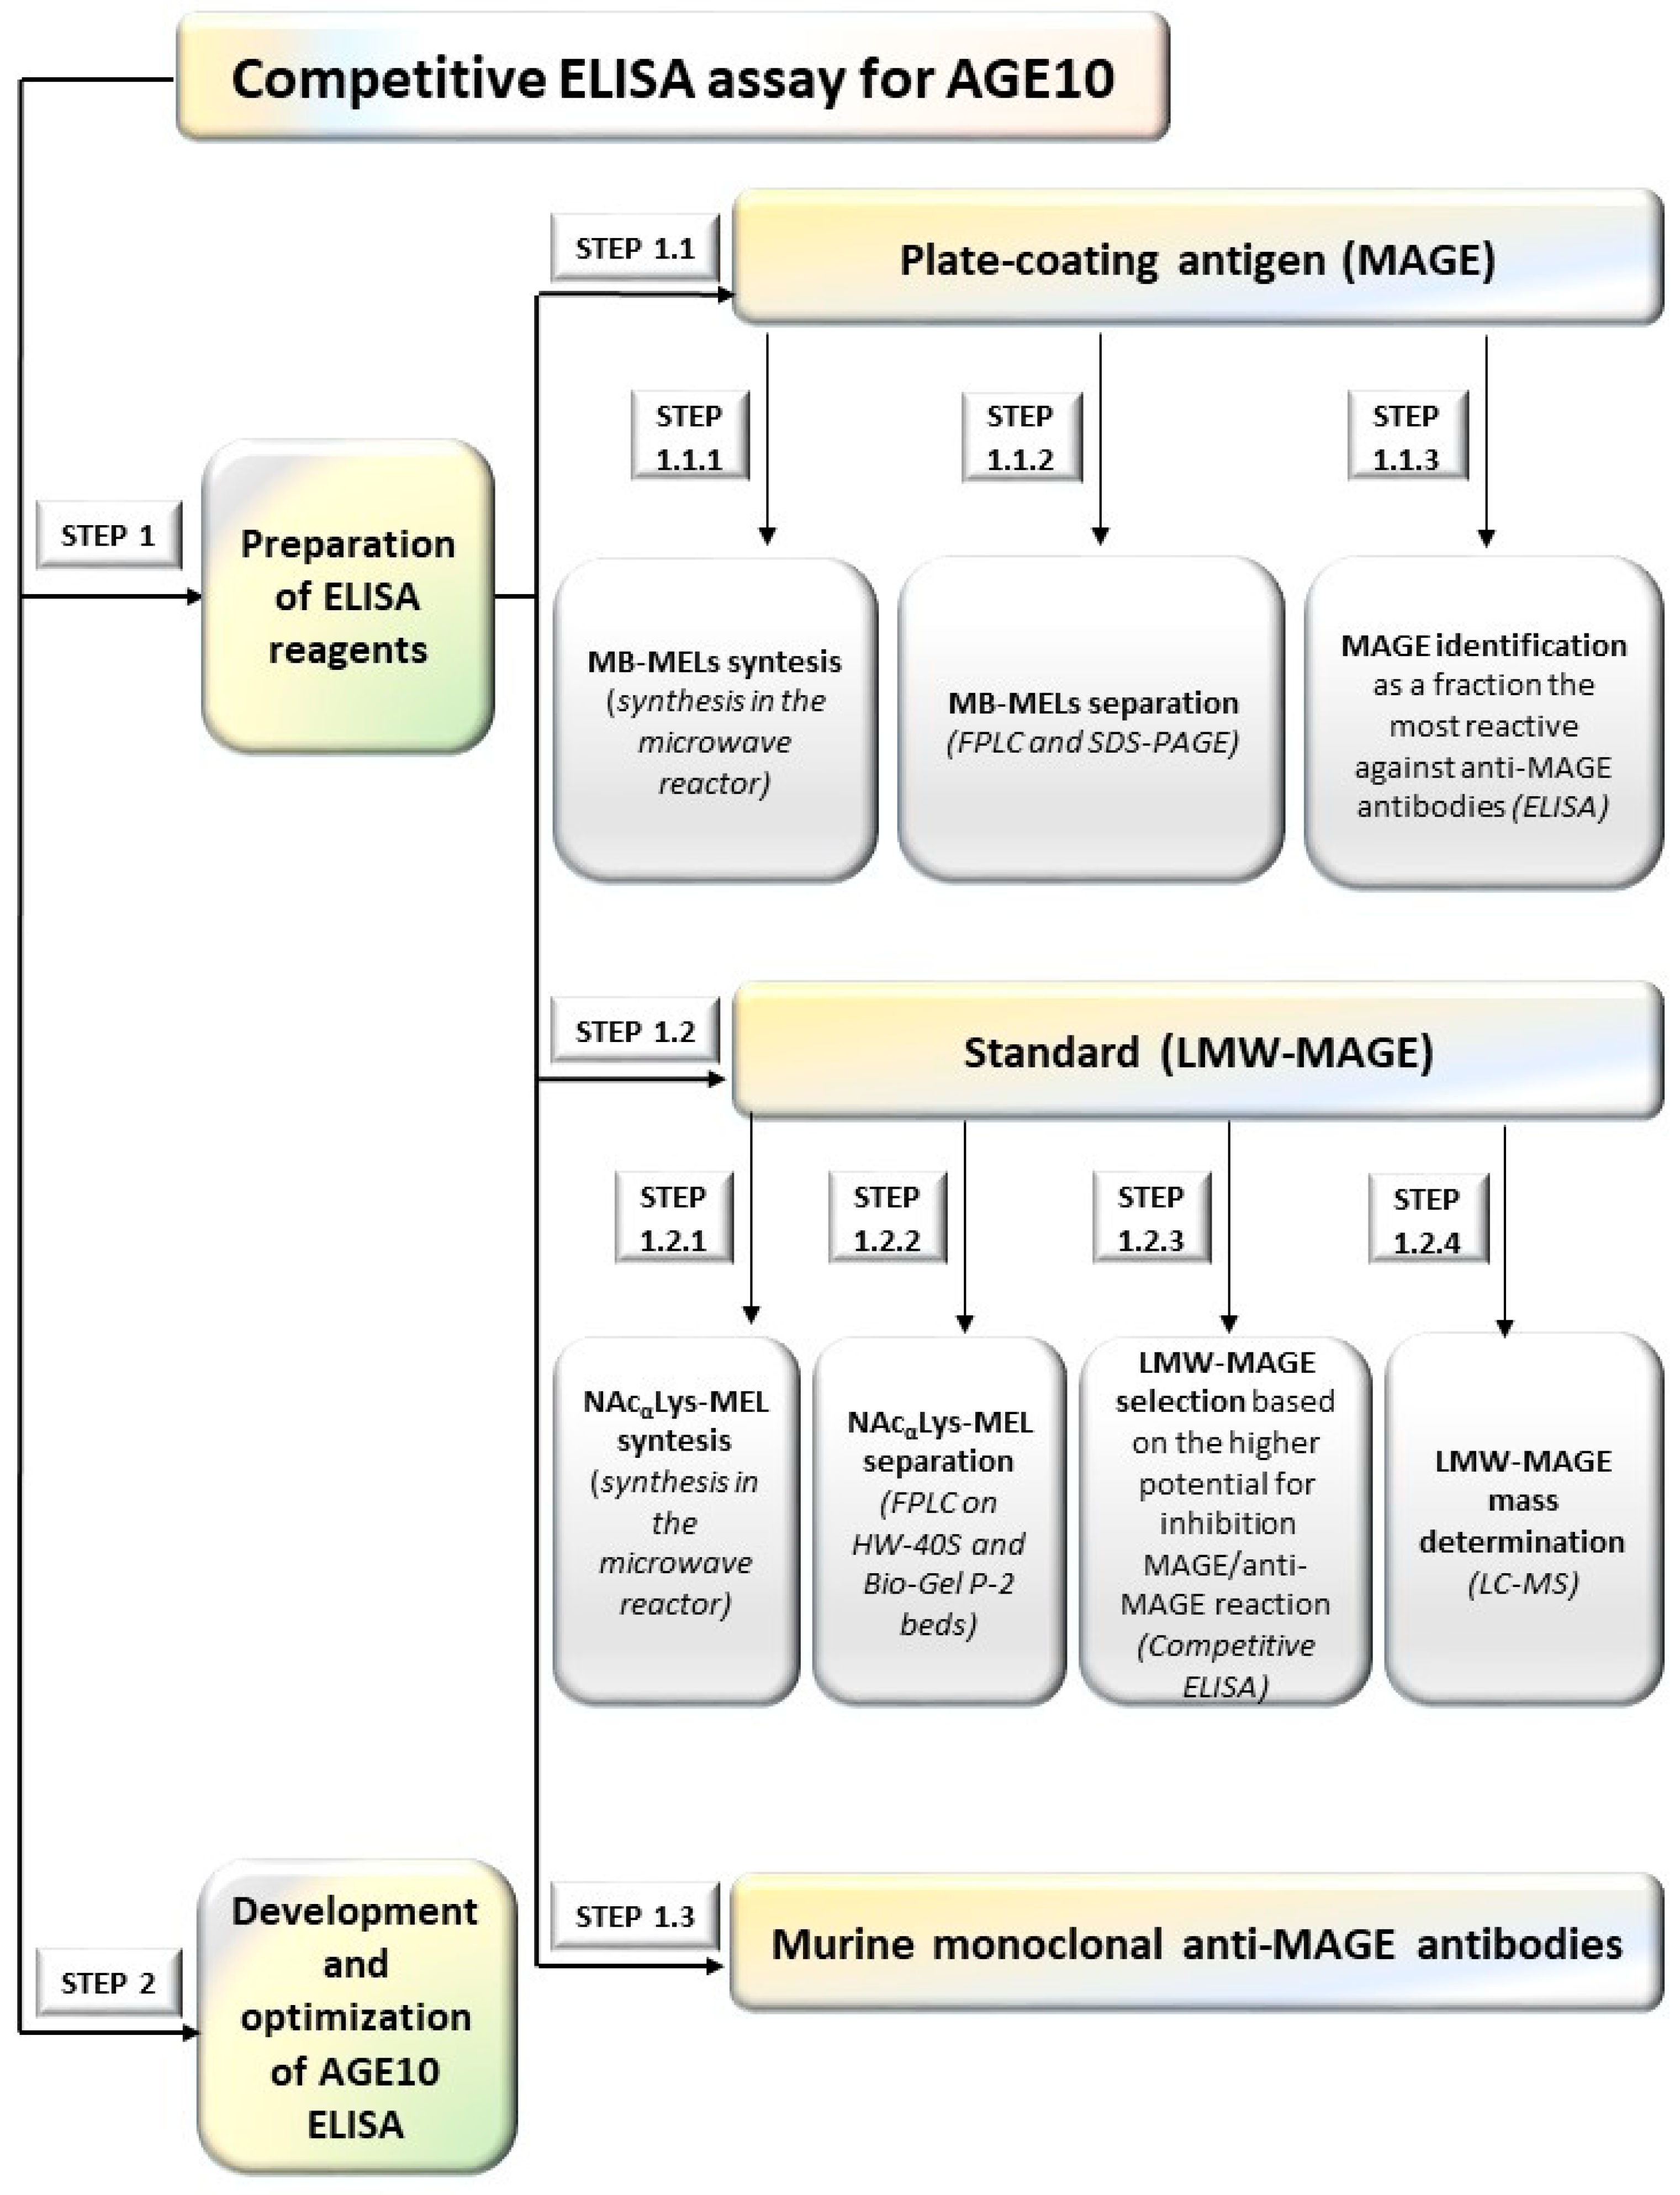
2.1.1. Preparation of ELISA Reagents (Step 1)
2.1.2. Development AGE10 ELISA (Step 1.2)
2.2. Study Population
Preparation of Murine Monoclonal Anti-MAGE Antibodies (Step 1.3)
2.3. Statistical Analysis
3. Results
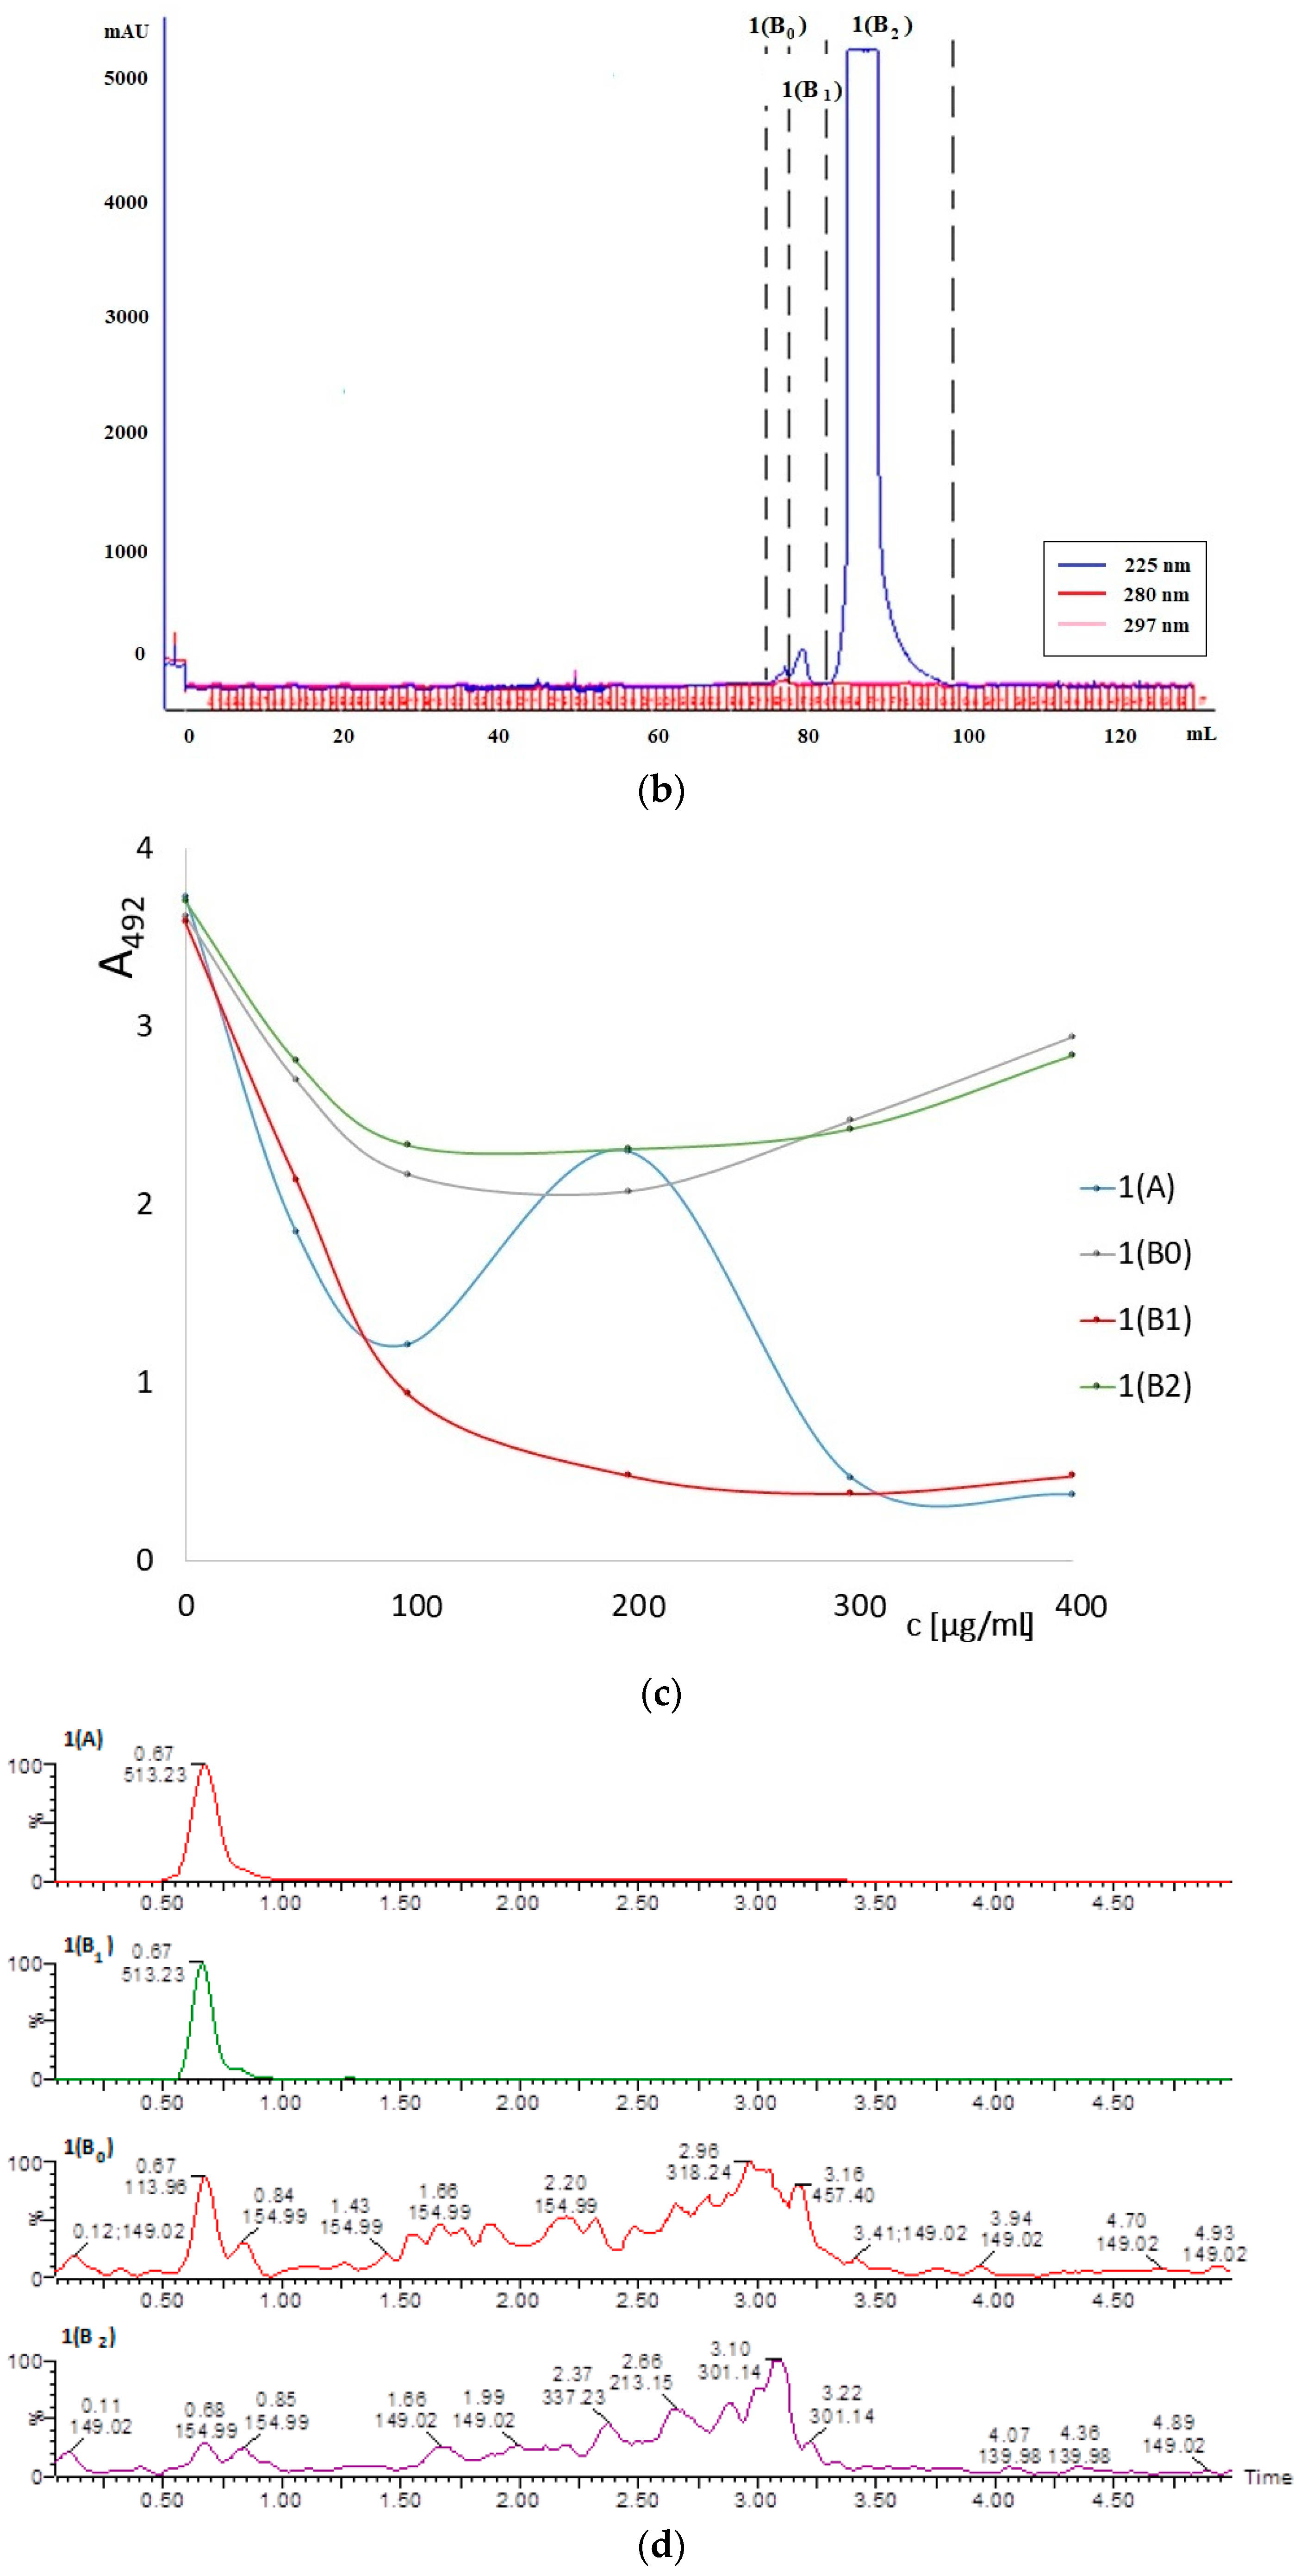
3.1. ELISA Reagents
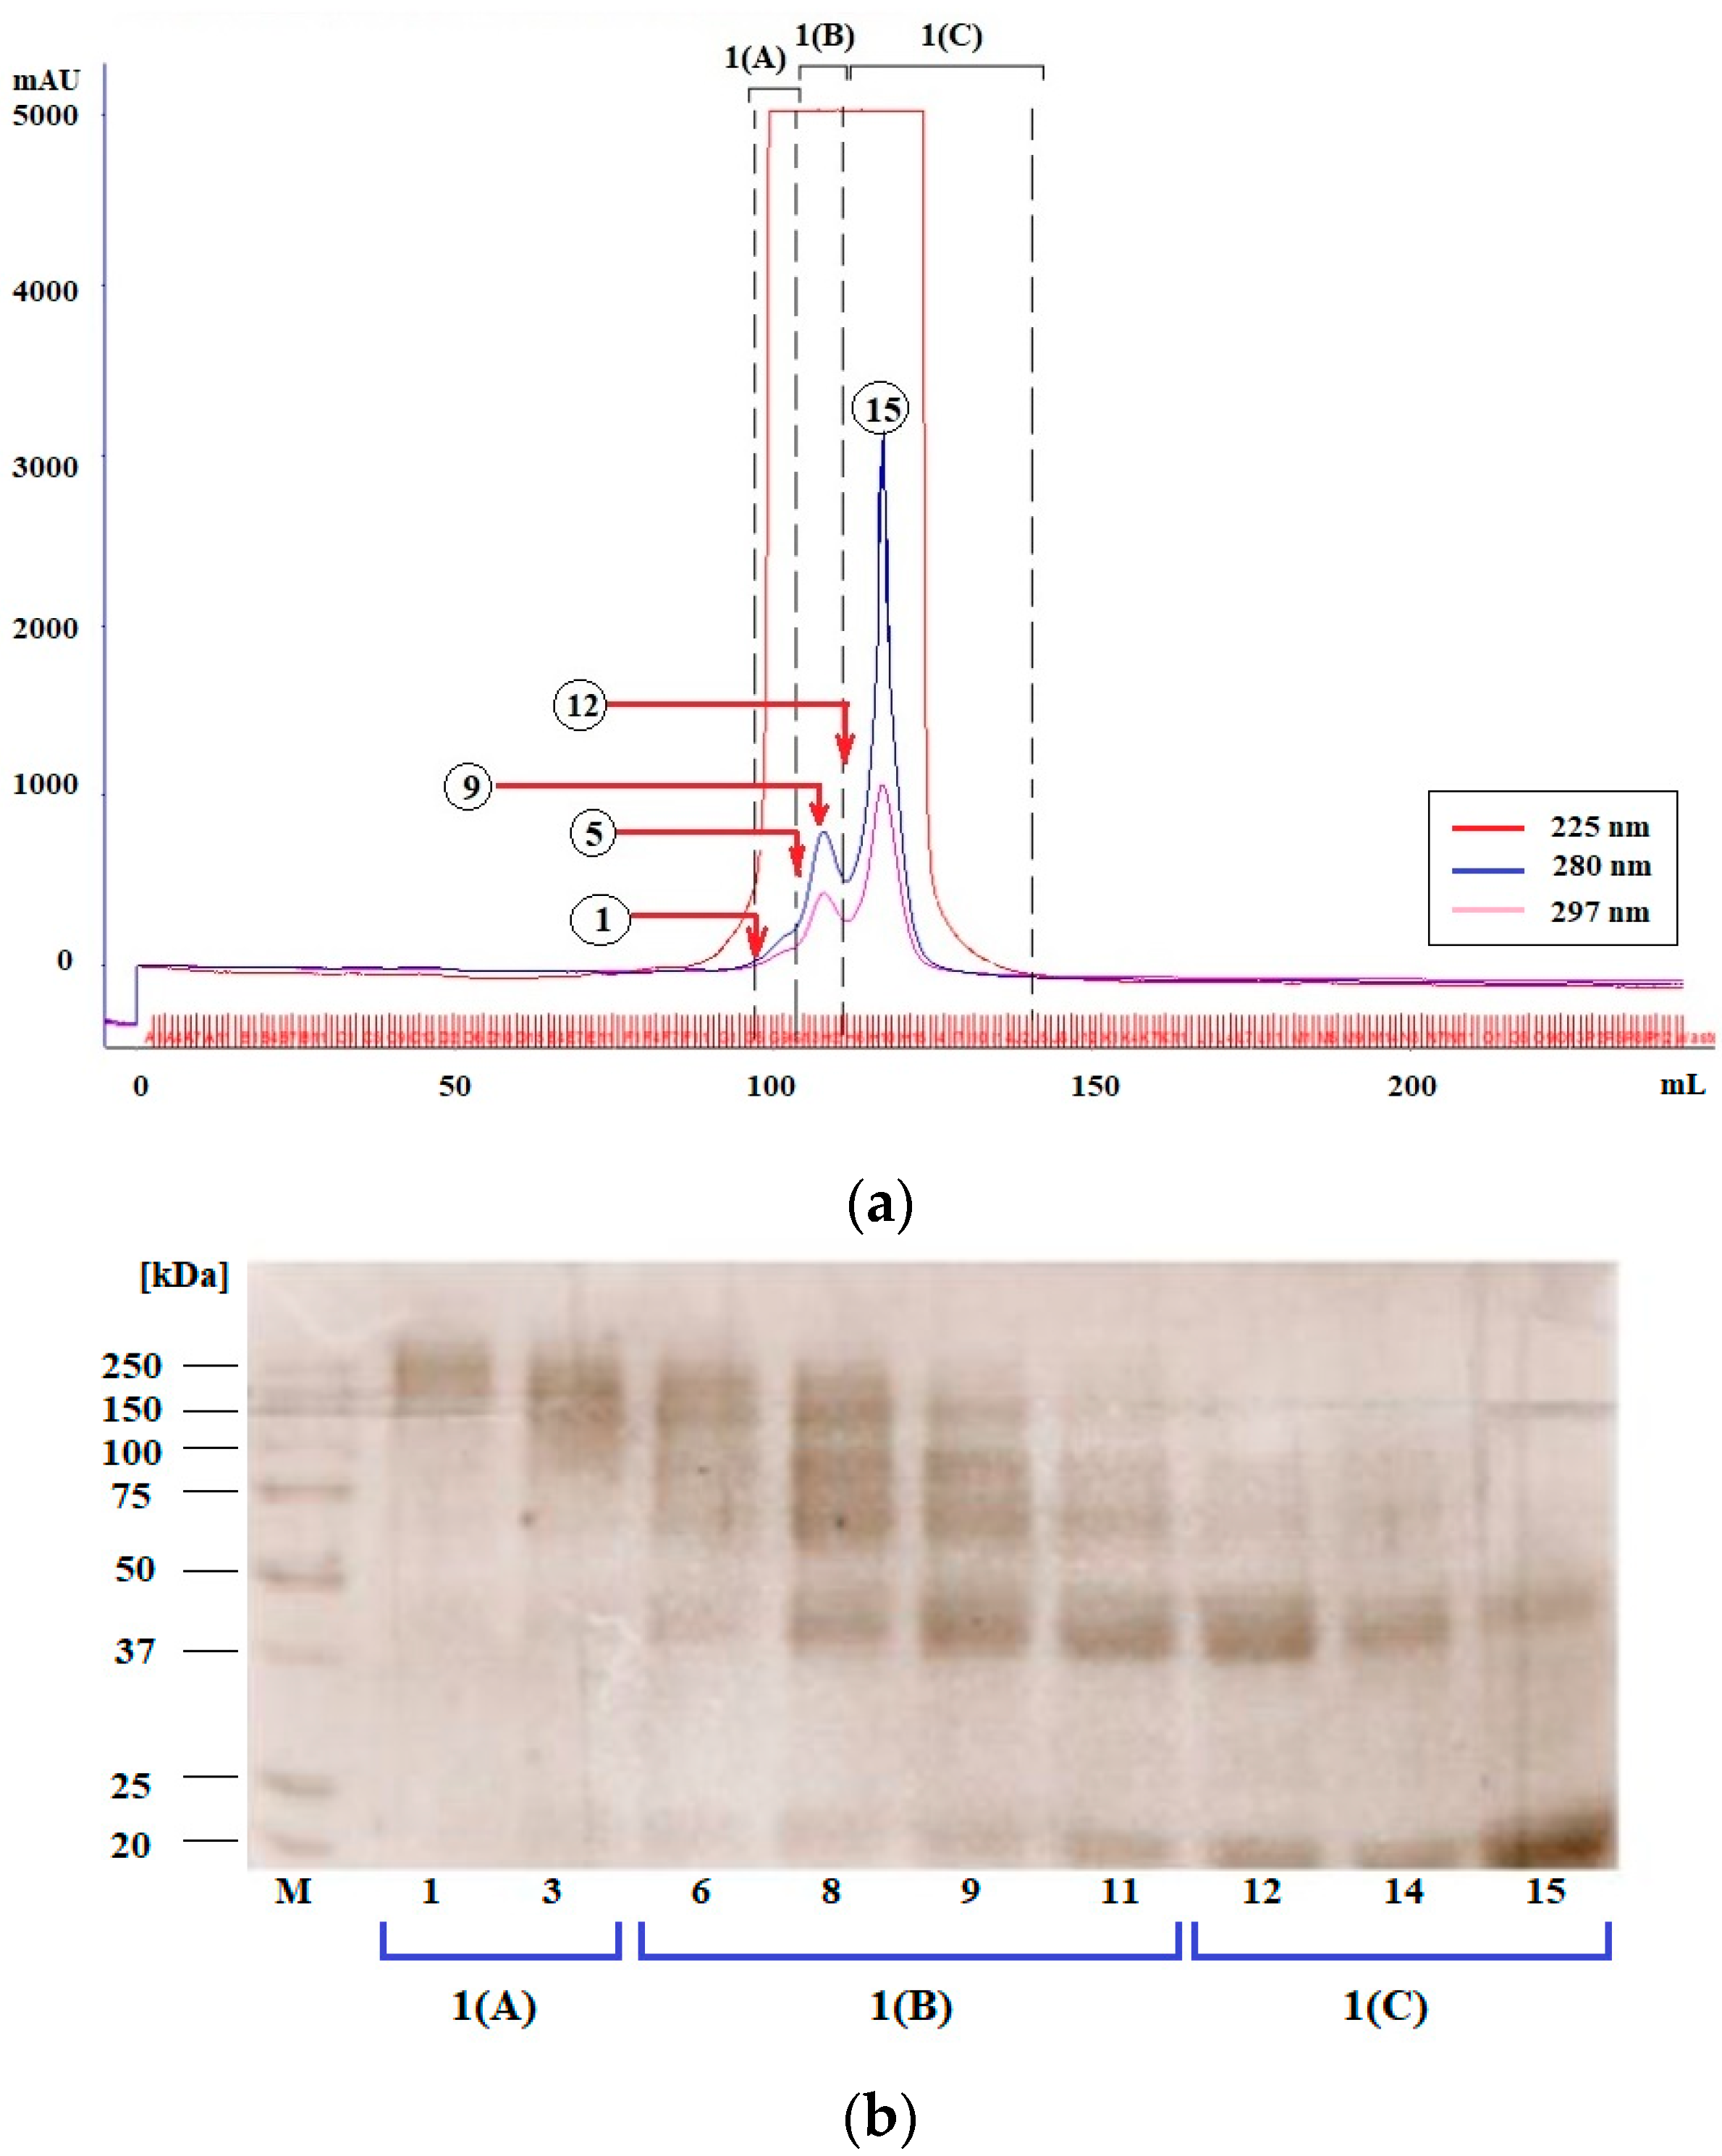
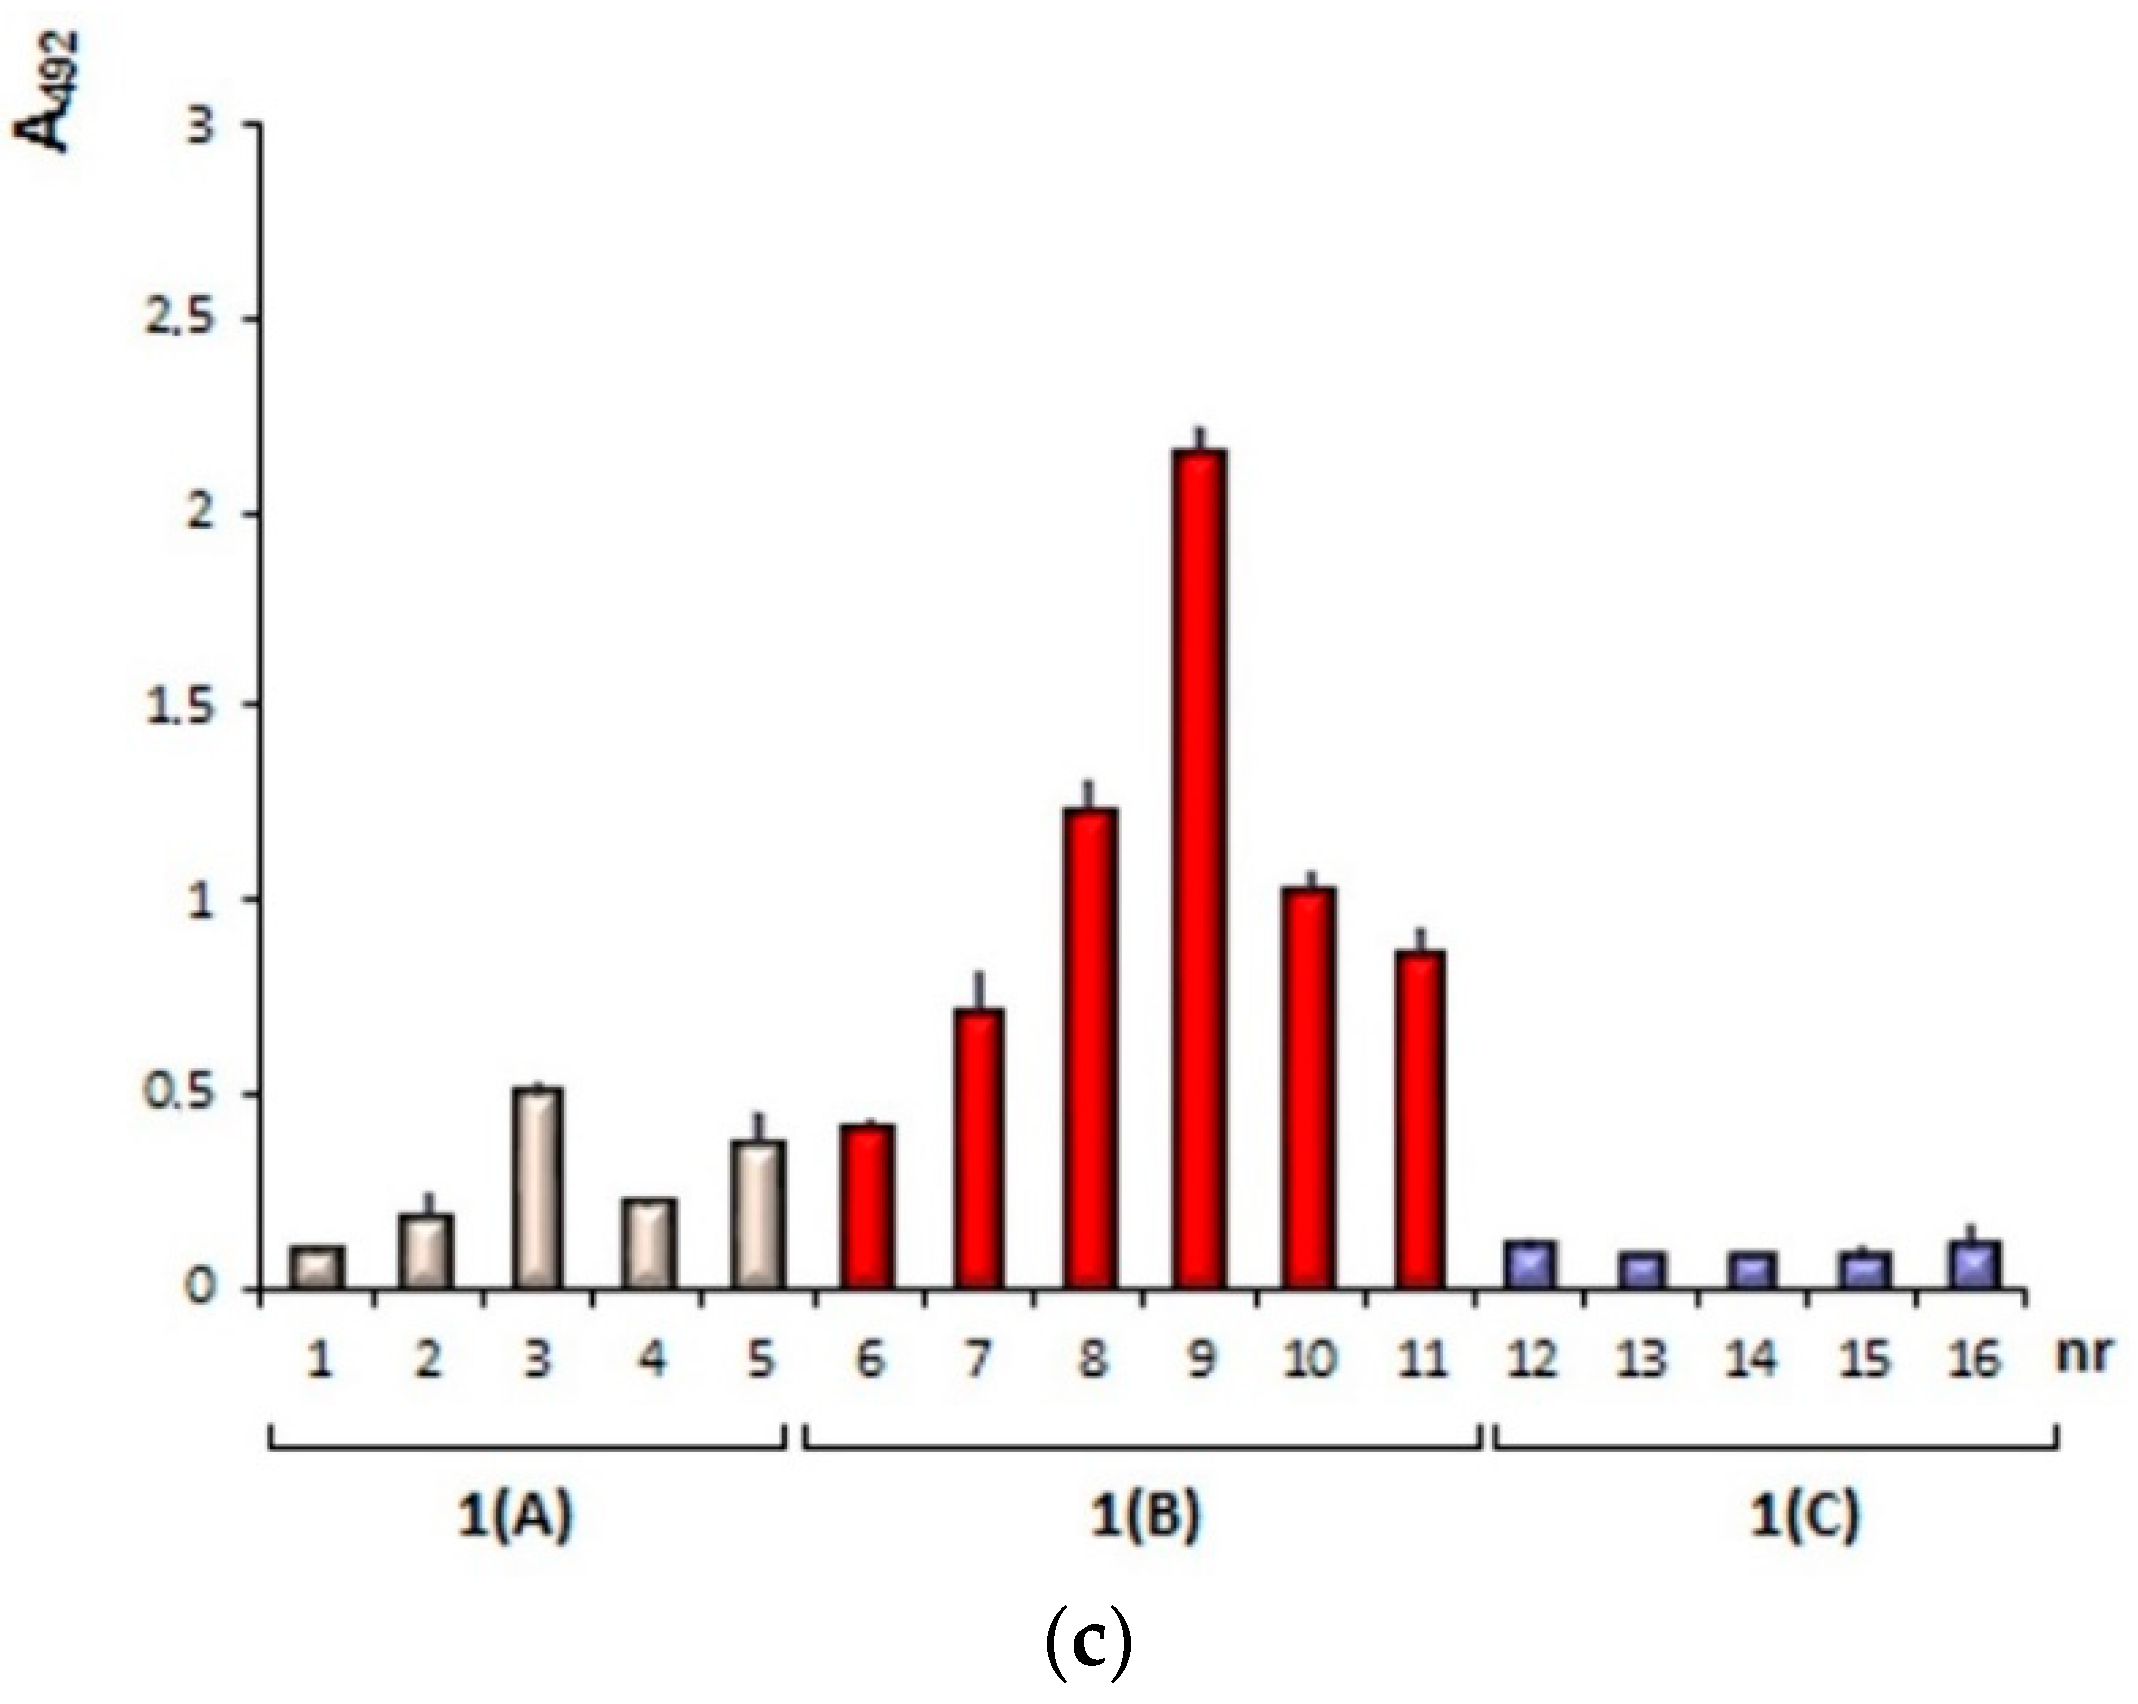
3.1.1. Plate-Coating Antigen (MAGE)
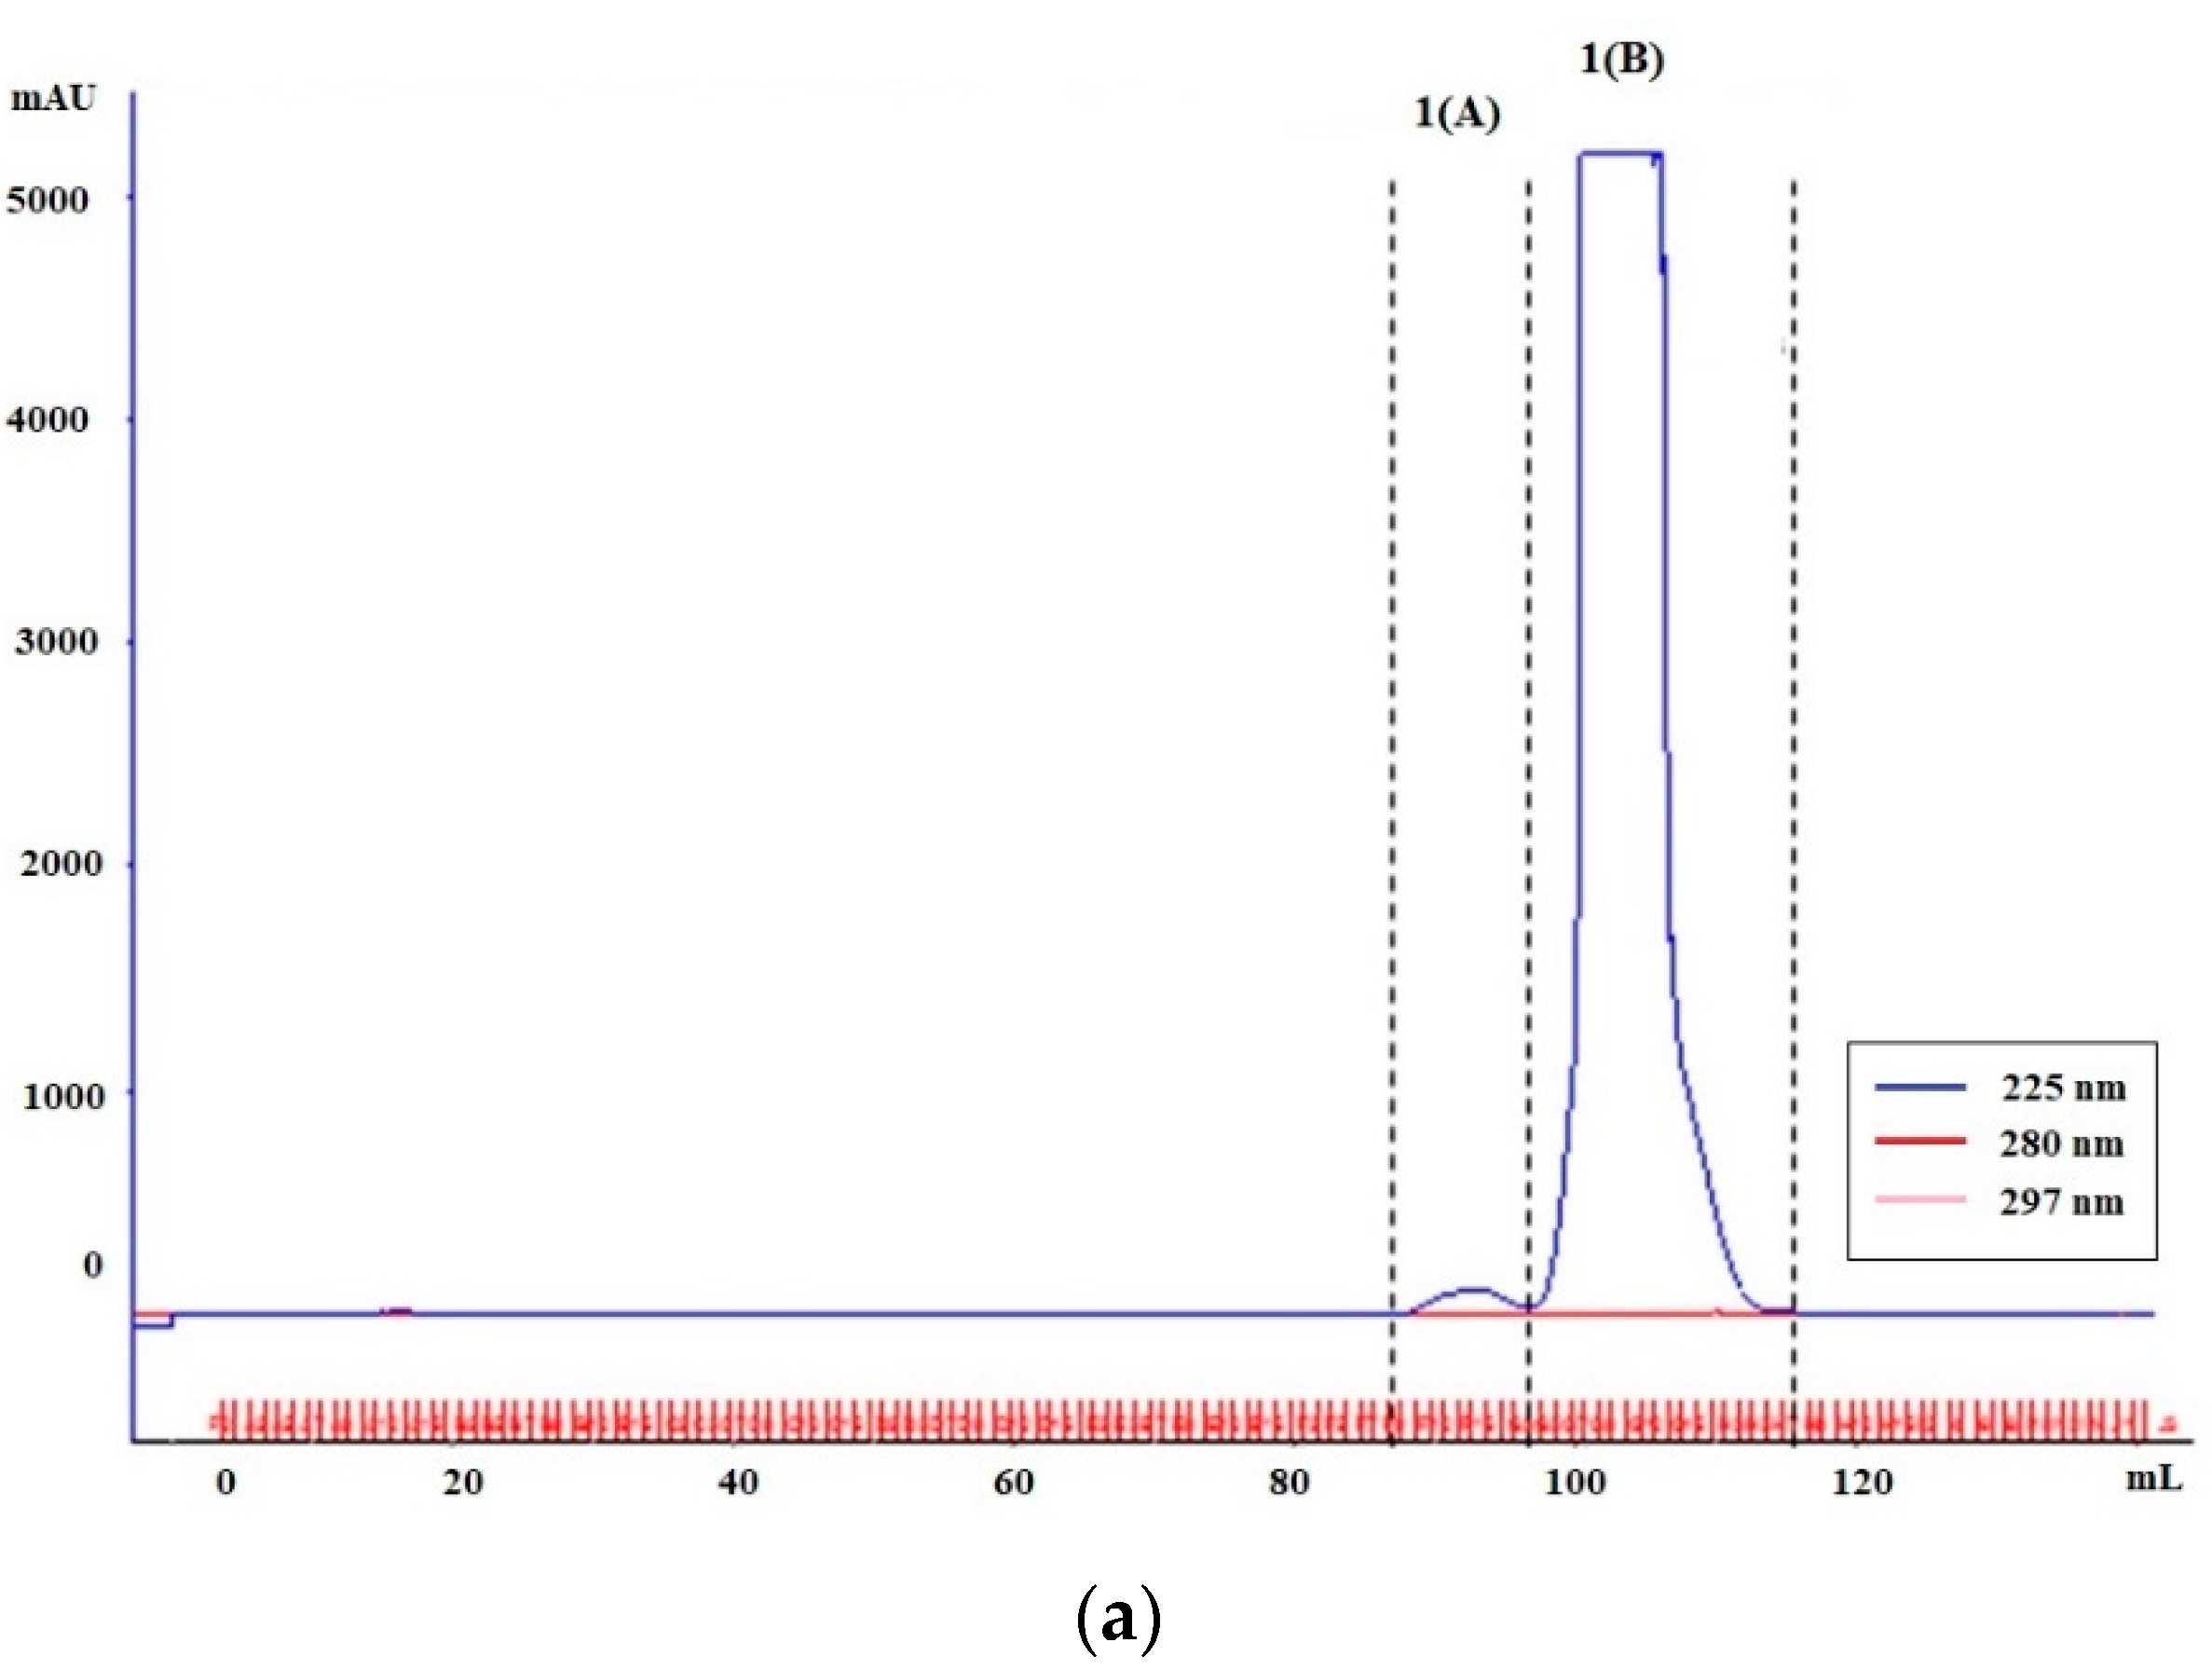
3.1.2. Standards (LMW-MAGE)
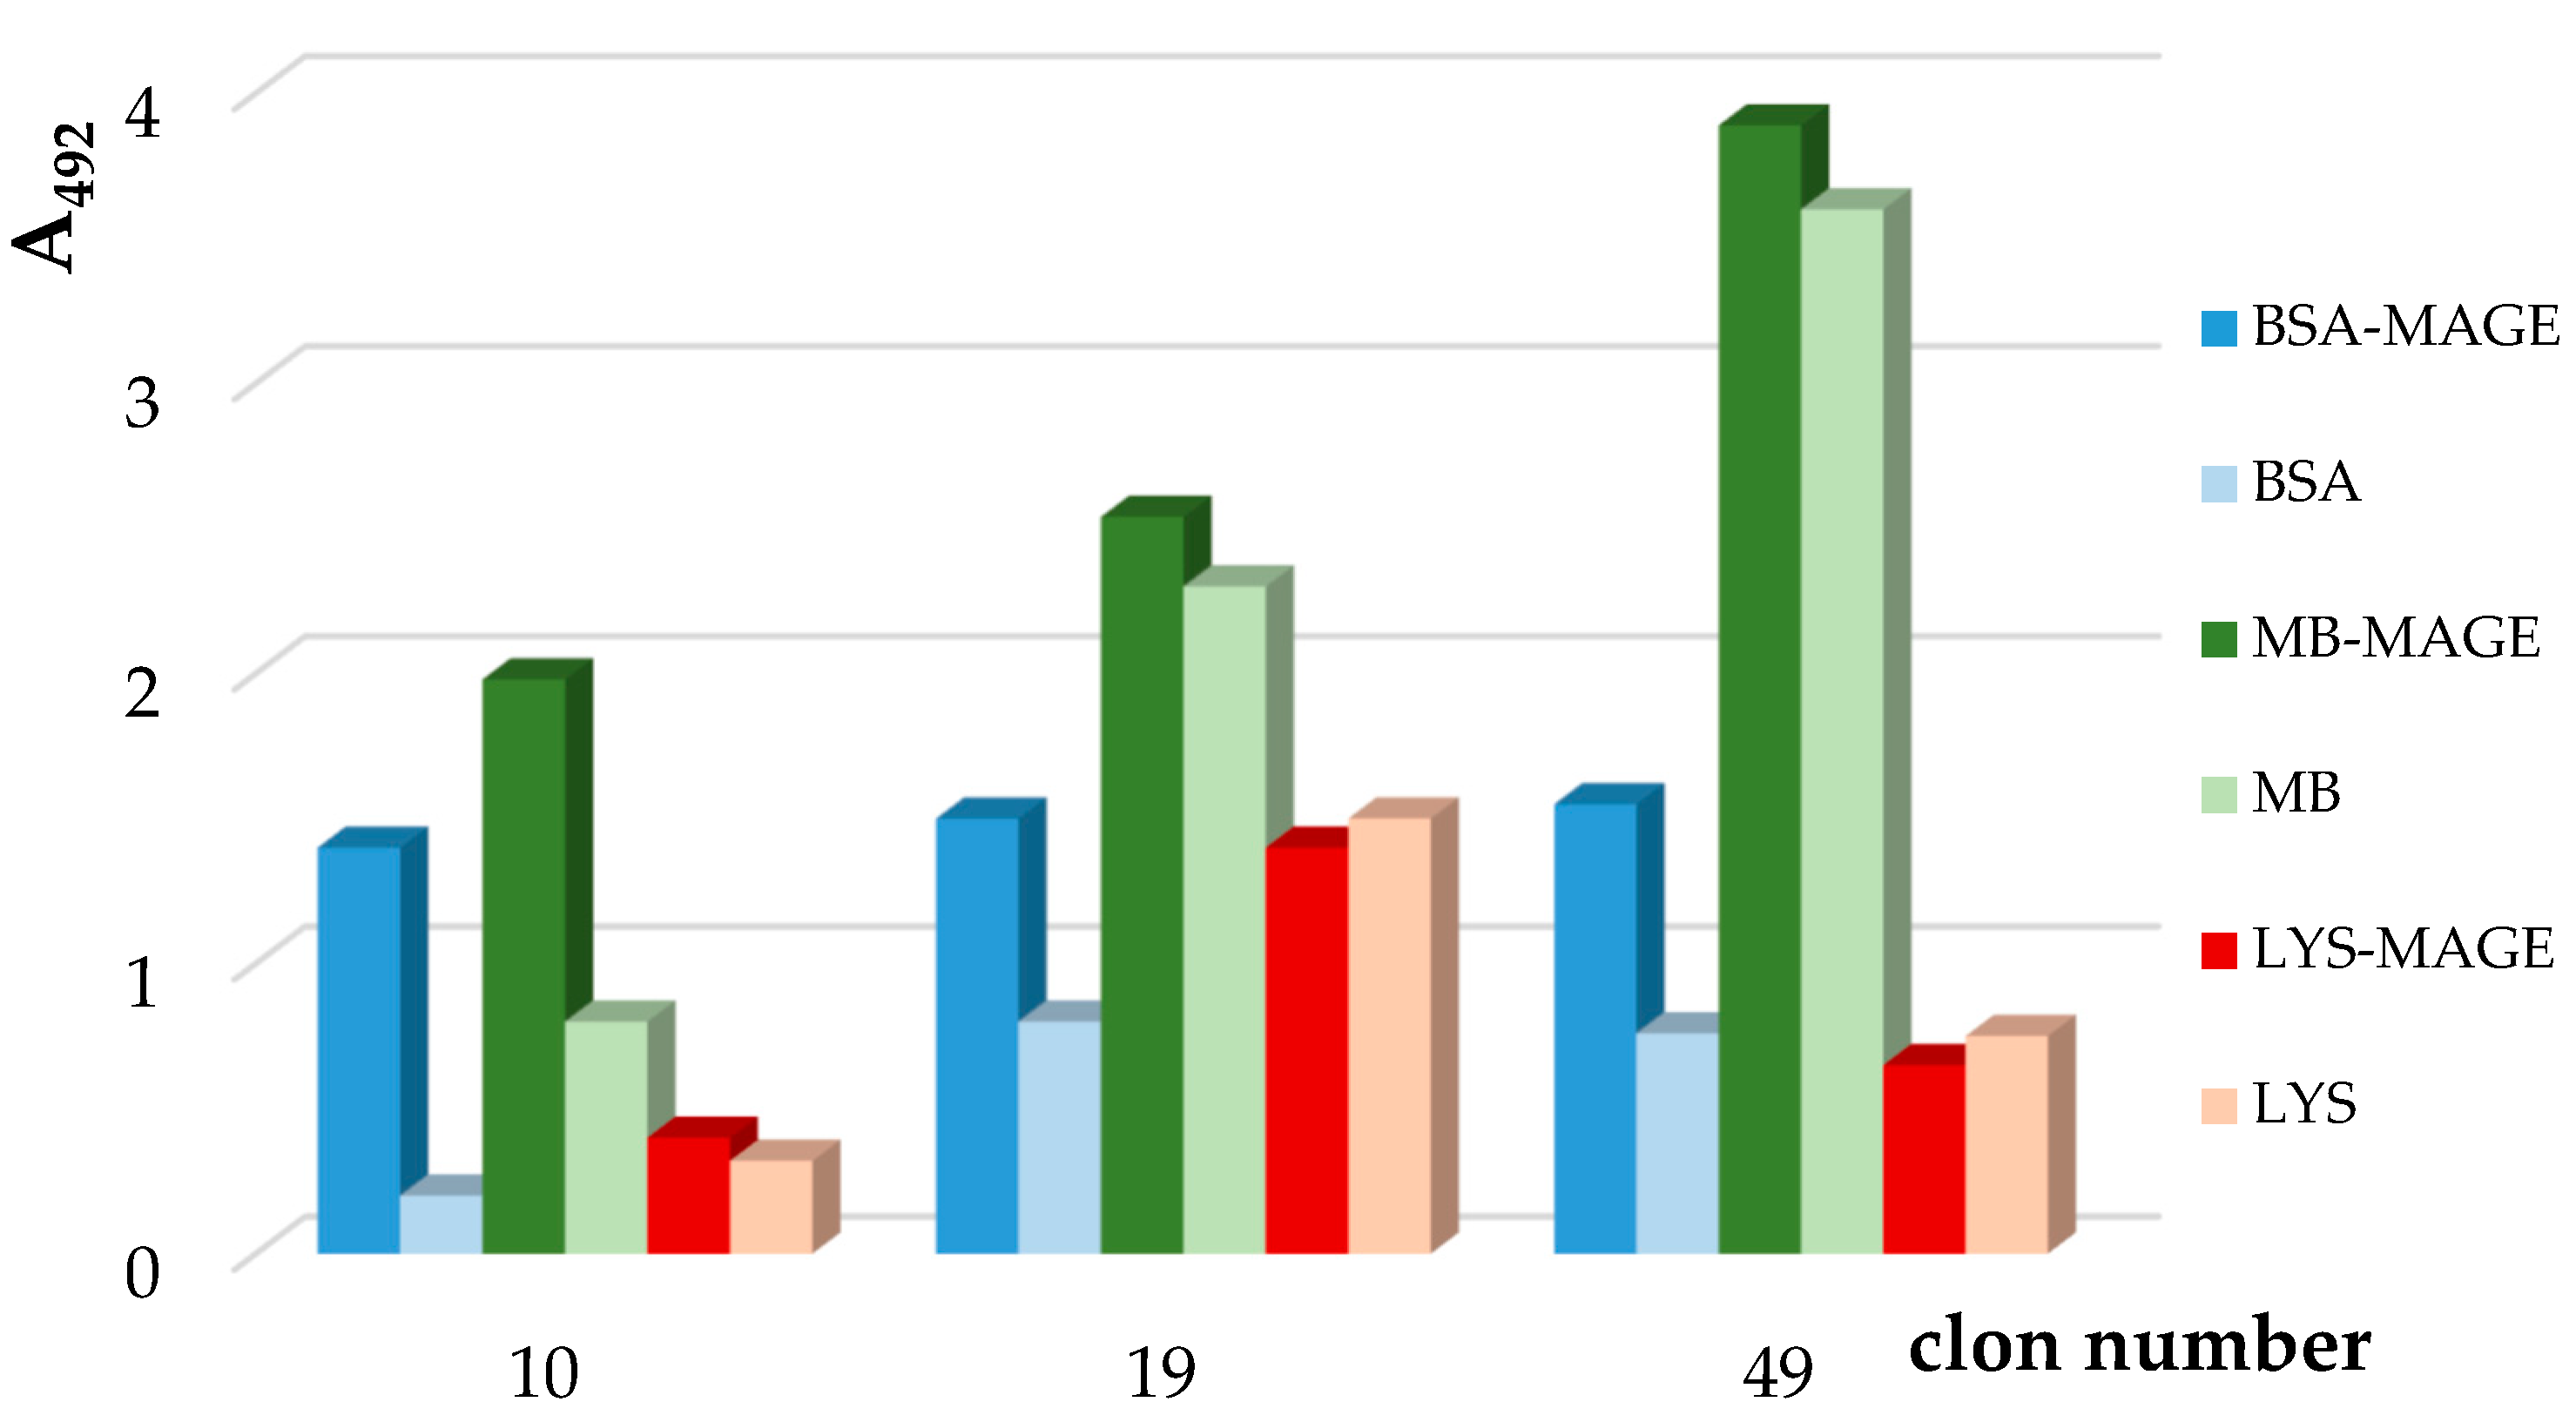
3.1.3. Preparation of Murine Anti-MAGE Monoclonal Antibodies
3.2. AGE10 ELISA
3.3. Determination of AGE10 Concentration in Sera—Validation of AGE10 ELISA
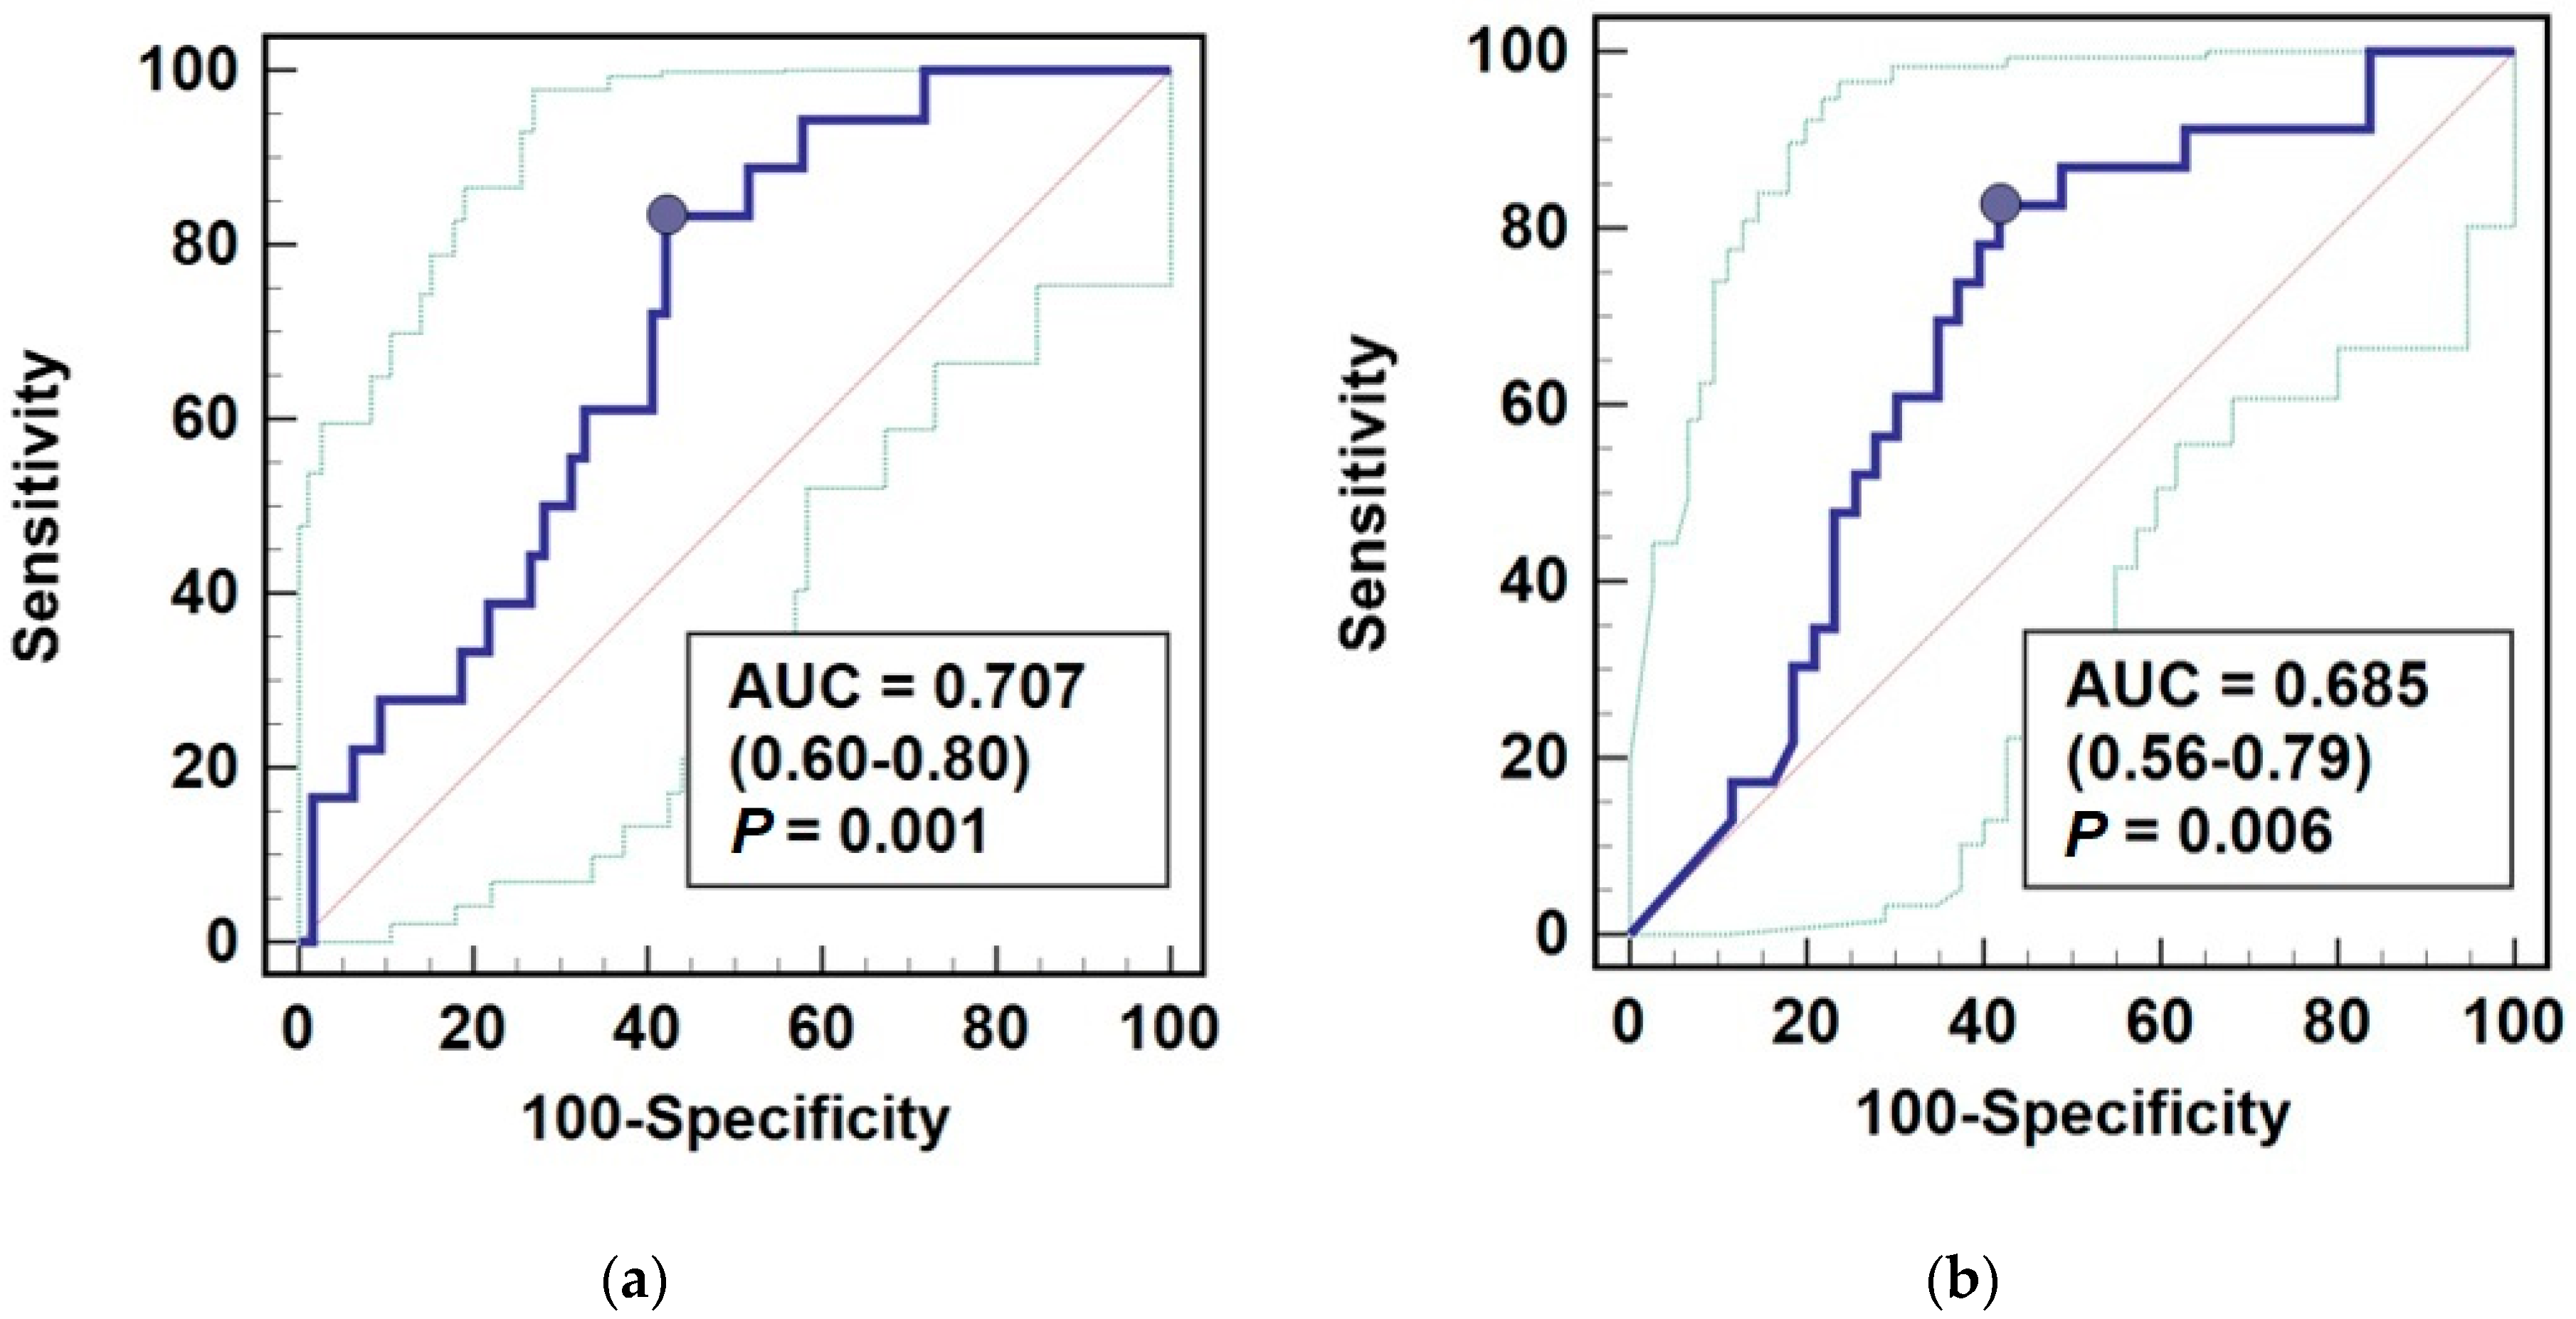
3.4. AGE10 Potential as a Biomarker
4. Discussion
5. Conclusions
Supplementary Materials
Author Contributions
Funding
Institutional Review Board Statement
Informed Consent Statement
Data Availability Statement
Acknowledgments
Conflicts of Interest
References
- Nigro, C.; Leone, A.; Fiory, F.; Prevenzano, I.; Nicolò, A.; Mirra, P.; Beguinot, F.; Miele, C. Dicarbonyl stress at the crossroads of healthy and unhealthy aging. Cells 2019, 8, 749. [Google Scholar] [CrossRef] [PubMed] [Green Version]
- Bucala, R. Diabetes, aging, and their tissue complications. J. Clin. Investig. 2014, 124. [Google Scholar] [CrossRef] [PubMed] [Green Version]
- Murata, M. Browning and pigmentation in food through the Maillard reaction. Glycoconj. J. 2020, 38, 283–292. [Google Scholar] [CrossRef]
- Haque, E.; Kamil, M.; Hasan, A.; Irfan, S.; Sheikh, S.; Khatoon, A.; Nazir, A.; Mir, S.S. Advanced glycation end products (AGEs), protein aggregation and their cross talk: New insight in tumorigenesis. Glycobiology 2019, 30, 2–18. [Google Scholar] [CrossRef] [PubMed]
- Krämer, A.C.; Davies, M.J. Effect of Methylglyoxal-Induced Glycation on the composition and structure of β-lactoglobulin and α-lactalbumin. J. Agric. Food Chem. 2019, 67, 699–710. [Google Scholar] [CrossRef] [PubMed]
- Goh, S.Y.; Cooper, M.E. The role of advanced glycation end products in progression and complications of diabetes. J. Clin. Endocrinol. Metab. 2008, 93, 1143–1152. [Google Scholar] [CrossRef] [Green Version]
- Farinha, J.B.; Ramis, T.R.; Vieira, A.F.; Macedo, R.C.O.; Rodrigues-Krause, J.; Boeno, F.P.; Schroeder, H.T.; Müller, C.H.; Boff, W.; Krause, M.; et al. Glycemic, inflammatory and oxidative stress responses to different high-intensity training protocols in type 1 diabetes: A randomized clinical trial. J. Diabetes Complicat. 2018, 32, 1124–1132. [Google Scholar] [CrossRef] [PubMed]
- Swami, P.; Thiyagarajan, S.; Vetter, S.W.; Leclerc, E.; Vidger, A.; Indurthi, V.S.K. Rage up-regulation differently affects cell proliferation and migration in pancreatic cancer cells. Int. J. Mol. Sci. 2020, 21, 7723. [Google Scholar] [CrossRef]
- Sharma, A.; Kaur, S.; Sarkar, M.; Sarin, B.C.; Changotra, H. The AGE-RAGE axis and RAGE genetics in chronic obstructive pulmonary disease. Clin. Rev. Allergy Immunol. 2020, 60, 244–258. [Google Scholar] [CrossRef]
- Kostov, K.; Blazhev, A. Use of glycated hemoglobin (A1c) as a biomarker for vascular risk in type 2 diabetes: Its relationship with matrix metalloproteinases-2, -9 and the metabolism of collagen IV and elastin. Medicina 2020, 56, 231. [Google Scholar] [CrossRef]
- Krishnamoorthy, D.; Hoy, R.C.; Natelson, D.M.; Torre, O.M.; Laudier, D.M.; Iatridis, J.C.; Illien-Jünger, S. Dietary advanced glycation end-product consumption leads to mechanical stiffening of murine intervertebral discs. DMM Dis. Models Mech. 2018, 11, dmm036012. [Google Scholar] [CrossRef] [Green Version]
- Bahmani, F.; Kia, M.; Soleimani, A.; Mohammadi, A.A.; Asemi, Z. The effects of selenium supplementation on biomarkers of inflammation and oxidative stress in patients with diabetic nephropathy: A randomised, double-blind, placebo-controlled trial. Br. J. Nutr. 2016, 116, 1222–1228. [Google Scholar] [CrossRef]
- Li, R.L.; Wang, J.X.; Chai, L.J.; Guo, H.; Wang, H.; Chen, L.; Hu, L.M.; Wang, S.X. Xueshuantong for injection (Lyophilized) alleviates streptozotocin-induced diabetic retinopathy in rats. Chin. J. Integr. Med. 2020, 26, 825–832. [Google Scholar] [CrossRef]
- Pitocco, D.; Scavone, G.; Di Leo, M.; Vitiello, R.; Rizzi, A.; Tartaglione, L.; Costantini, F.; Flex, A.; Galli, M.; Caputo, S.; et al. Charcot Neuroarthropathy: From the laboratory to the Bedside. Curr. Diabetes Rev. 2019, 16, 62–72. [Google Scholar] [CrossRef]
- Maranta, F.; Cianfanelli, L.; Cianflone, D. Glycaemic control and vascular complications in diabetes mellitus type 2. Adv. Exp. Med. Biol. 2021, 1307, 129–152. [Google Scholar] [CrossRef]
- Arnold, S.V.; Echouffo-Tcheugui, J.B.; Lam, C.S.; Inzucchi, S.E.; Tang, F.; McGuire, D.K.; Goyal, A.; Maddox, T.M.; Sperling, L.S.; Fonarow, G.C.; et al. Patterns of glucose-lowering medication use in patients with type 2 diabetes and heart failure. Insights from the Diabetes Collaborative Registry (DCR). Am. Heart J. 2018, 203, 25–29. [Google Scholar] [CrossRef]
- Ruiz-Meana, M.; Minguet, M.; Bou-Teen, D.; Miro-Casas, E.; Castans, C.; Castellano, J.; Bonzon-Kulichenko, E.; Igual, A.; Rodriguez-Lecoq, R.; Jázquez, J.; et al. Ryanodine receptor glycation favors mitochondrial damage in the senescent heart. Circulation 2019, 139, 949–964. [Google Scholar] [CrossRef]
- Sanjeevi, N.; Lipsky, L.M.; Nansel, T.R. Cardiovascular biomarkers in association with dietary intake in a longitudinal study of youth with type 1 diabetes. Nutrients 2018, 10, 1552. [Google Scholar] [CrossRef] [Green Version]
- Takahashi, N.; Takahashi, Y.; Tabara, Y.; Matsumoto, T.; Kawaguchi, T.; Kuriyama, A.; Ueshima, K.; Matsuda, F.; Chin, K.; Nakayama, T. Correlates of autonomic nervous system function in a general population with special reference to HbA1c: The Nagahama study. Diabetes Res. Clin. Pract. 2020, 163, 108126. [Google Scholar] [CrossRef]
- Hartog, J.W.L.; De Vries, A.P.J.; Lutgers, H.L.; Meerwaldt, R.; Huisman, R.M.; Van Son, W.J.; De Jong, P.E.; Smit, A.J. Accumulation of advanced glycation end products, measured as skin autofluorescence, in renal disease. Proc. Ann. N. Y. Acad. Sci. 2005, 1043, 299–307. [Google Scholar] [CrossRef] [PubMed]
- Oldfield, M.D.; Bach, L.A.; Forbes, J.M.; Nikolic-Paterson, D.; McRobert, A.; Thallas, V.; Atkins, R.C.; Osicka, T.; Jerums, G.; Cooper, M.E. Advanced glycation end products cause epithelial-myofibroblast transdifferentiation via the receptor for advanced glycation end products (RAGE). J. Clin. Investig. 2001, 108, 1853–1863. [Google Scholar] [CrossRef]
- Miyata, T.; Van Ypersele De Strihou, C. Angiotensin II receptor blockers and angiotensin converting enzyme inhibitors: Implication of radical scavenging and transition metal chelation in inhibition of advanced glycation end product formation. Arch. Biochem. Biophys. 2003, 419, 50–54. [Google Scholar] [CrossRef]
- Li, C.; Wang, H.; Juárez, M.; Ruan, E.D. Structural characterization of Amadori rearrangement product of glucosylated Nα-acetyl-lysine by nuclear magnetic resonance spectroscopy. Int. J. Spectrosc. 2014, 2014, 789356. [Google Scholar] [CrossRef] [Green Version]
- Staniszewska, M.; Bronowicka-Szydełko, A.; Gostomska-Pampuch, K.; Szkudlarek, J.; Bartyś, A.; Bieg, T.; Gamian, E.; Kochman, A.; Picur, B.; Pietkiewicz, J.; et al. The melibiose-derived glycation product mimics a unique epitope present in human and animal tissues. Sci. Rep. 2021, 11, 1–13. [Google Scholar] [CrossRef]
- Kuzan, A. Toxicity of advanced glycation end products (Review). Biomed. Rep. 2021, 14, 1–8. [Google Scholar] [CrossRef]
- Sato, T.; Shimogaito, N.; Wu, X.; Kikuchi, S.; Yamagishi, S.; Takeuchi, M. Toxic Advanced glycation end products (TAGE) theory in Alzheimer’s Disease. Am. J. Alzheimer’s Dis. Other Dement. 2006, 21, 197–208. [Google Scholar] [CrossRef]
- Dippold, W.G.; Lloyd, K.O.; Li, L.T.; Ikeda, H.; Oettgen, H.F.; Old, L.J. Cell surface antigens of human malignant melanoma: Definition of six antigenic systems with mouse monoclonal antibodies. Proc. Natl. Acad. Sci. USA 1980, 77, 6114–6118. [Google Scholar] [CrossRef] [Green Version]
- Saeed, M.; Kausar, M.A.; Singh, R.; Siddiqui, A.J.; Akhter, A. The role of glyoxalase in glycation and carbonyl stress induced metabolic disorders. Curr. Protein Pept. Sci. 2020, 21, 846–859. [Google Scholar] [CrossRef]
- Rhee, S.Y.; Kim, Y.S. The role of advanced glycation end products in diabetic vascular complications. Diabetes Metab. J. 2018, 42, 188–195. [Google Scholar] [CrossRef]
- Bhat, S.A.; Bhat, W.F.; Afsar, M.; Khan, M.S.; Al-Bagmi, M.S.; Bano, B. Modification of chickpea cystatin by reactive dicarbonyl species: Glycation, oxidation and aggregation. Arch. Biochem. Biophys. 2018, 650, 103–115. [Google Scholar] [CrossRef]
- Lee, M.Y.; Hsu, W.H.; Lai, C.W.; Chen, S.C.; Liang, C.C. The association between glycated albumin, glycohemoglobin, and glycated albumin to glycohemoglobin ratio in diabetic retinopathy of prediabetes. Kaohsiung J. Med Sci. 2019, 35, 695–701. [Google Scholar] [CrossRef] [Green Version]
- Muralidharan, M.; Bhat, V.; Mandal, A.K. Structural analysis of glycated human hemoglobin using native mass spectrometry. FEBS J. 2020, 287, 1247–1254. [Google Scholar] [CrossRef]
- Sillner, N.; Walker, A.; Hemmler, D.; Bazanella, M.; Heinzmann, S.S.; Haller, D.; Schmitt-Kopplin, P. Milk-derived Amadori products in feces of formula-fed infants. J. Agric. Food Chem. 2019, 67, 8061–8069. [Google Scholar] [CrossRef]
- Sourris, K.C.; Harcourt, B.E.; Forbes, J.M. A new perspective on therapeutic inhibition of advanced glycation in diabetic microvascular complications: Common downstream endpoints achieved through disparate therapeutic approaches? Am. J. Nephrol. 2009, 30, 323–335. [Google Scholar] [CrossRef]
- Holderied, A.; Romoli, S.; Eberhard, J.; Konrad, L.A.; Devarapu, S.K.; Marschner, J.A.; Müller, S.; Anders, H.J. Glomerular parietal epithelial cell activation induces collagen secretion and thickening of Bowman’s capsule in diabetes. Lab. Investig. 2015, 95, 273–282. [Google Scholar] [CrossRef]
- Ghazanfari-Sarabi, S.; Habibi-Rezaei, M.; Eshraghi-Naeeni, R.; Moosavi-Movahedi, A.A. Prevention of haemoglobin glycation by acetylsalicylic acid (ASA): A new view on old mechanism. PLoS ONE 2019, 14, e0214725. [Google Scholar] [CrossRef] [Green Version]
- Urios, P.; Grigorova-Borsos, A.M.; Sternberg, M. Aspirin inhibits the formation of pentosidine, a cross-linking advanced glycation end product, in collagen. Diabetes Res. Clin. Pract. 2007, 77, 337–340. [Google Scholar] [CrossRef]
- Rehms, H.; Barz, W. Degradation of stachyose, raffinose, melibiose and sucrose by different tempe-producing Rhizopus fungi. Appl. Microbiol. Biotechnol. 1995, 44, 47–52. [Google Scholar] [CrossRef]
- Megías-Pérez, R.; Grimbs, S.; D’Souza, R.N.; Bernaert, H.; Kuhnert, N. Profiling, quantification and classification of cocoa beans based on chemometric analysis of carbohydrates using hydrophilic interaction liquid chromatography coupled to mass spectrometry. Food Chem. 2018, 258, 284–294. [Google Scholar] [CrossRef]
- Schievano, E.; Tonoli, M.; Rastrelli, F. NMR quantification of carbohydrates in complex mixtures. A challenge on honey. Anal. Chem. 2017, 89, 13405–13414. [Google Scholar] [CrossRef]
- O’Connell, K.J.; Motherway, M.O.C.; O’Callaghan, J.; Fitzgerald, G.F.; Paul Ross, R.; Ventura, M.; Stanton, C.; van Sinderen, D. Metabolism of four α-glycosidic linkage-containing oligosaccharides by Bifidobacterium breve UCC2003. Appl. Environ. Microbiol. 2013, 79, 6280–6292. [Google Scholar] [CrossRef] [Green Version]
- Sandek, A.; Bjarnason, I.; Volk, H.D.; Crane, R.; Meddings, J.B.; Niebauer, J.; Kalra, P.R.; Buhner, S.; Herrmann, R.; Springer, J.; et al. Studies on bacterial endotoxin and intestinal absorption function in patients with chronic heart failure. Int. J. Cardiol. 2012, 157, 80–85. [Google Scholar] [CrossRef]
- Stanic-Vucinic, D.; Prodic, I.; Apostolovic, D.; Nikolic, M.; Cirkovic Velickovic, T. Structure and antioxidant activity of β-lactoglobulin-glycoconjugates obtained by high-intensity-ultrasound-induced Maillard reaction in aqueous model systems under neutral conditions. Food Chem. 2013, 138, 590–599. [Google Scholar] [CrossRef]
- Vlassopoulos, A.; Lean, M.E.J.; Combet, E. Role of oxidative stress in physiological albumin glycation: A neglected interaction. Free Radic. Biol. Med. 2013, 60, 318–324. [Google Scholar] [CrossRef] [Green Version]
- Visentin, S.; Medana, C.; Barge, A.; Giancotti, V.; Cravotto, G. Microwave-assisted Maillard reactions for the preparation of advanced glycation end products (AGEs). Org. Biomol. Chem. 2010, 8, 2473–2477. [Google Scholar] [CrossRef]
- Nagaraj, R.H.; Linetsky, M.; Stitt, A.W. The pathogenic role of Maillard reaction in the aging eye. Amino Acids 2012, 42, 1205–1220. [Google Scholar] [CrossRef]
- Sadowska-Bartosz, I.; Bartosz, G. Prevention of protein glycation by natural compounds. Molecules 2015, 20, 3309–3334. [Google Scholar] [CrossRef]
- Wautier, J.L.; Wautier, M.P.; Schmidt, A.M.; Anderson, G.M.; Hori, O.; Zoukourian, C.; Capron, L.; Chappey, O.; Yan, S.D.; Brett, J.; et al. Advanced glycation end products (AGEs) on the surface of diabetic erythrocytes bind to the vessel wall via a specific receptor inducing oxidant stress in the vasculature: A link between surface-associated AGEs and diabetic complications. Proc. Natl. Acad. Sci. USA 1994, 91, 7742–7746. [Google Scholar] [CrossRef] [Green Version]
- Tsujinaka, H.; Itaya-Hironaka, A.; Yamauchi, A.; Sakuramoto-Tsuchida, S.; Ota, H.; Takeda, M.; Fujimura, T.; Takasawa, S.; Ogata, N. Human retinal pigment epithelial cell proliferation by the combined stimulation of hydroquinone and advanced glycation end-products via up-regulation of VEGF gene. Biochem. Biophys. Rep. 2015, 2, 123–131. [Google Scholar] [CrossRef]
- Makrantonaki, E.; Jiang, D.; Hossini, A.M.; Nikolakis, G.; Wlaschek, M.; Scharffetter-Kochanek, K.; Zouboulis, C.C. Diabetes mellitus and the skin. Rev. Endocr. Metab. Disord. 2016, 17, 269–282. [Google Scholar] [CrossRef]
- Alikhani, Z.; Alikhani, M.; Boyd, C.M.; Nagao, K.; Trackman, P.C.; Graves, D.T. Advanced glycation end products enhance expression of pro-apoptotic genes and stimulate fibroblast apoptosis through cytoplasmic and mitochondrial pathways. J. Biol. Chem. 2005, 280, 12087–12095. [Google Scholar] [CrossRef] [Green Version]
- Hudson, B.I.; Kalea, A.Z.; del Mar Arriero, D.M.; Harja, E.; Boulanger, V.A.; Schmidt, A.M. Interaction of the RAGE cytoplasmic domain with diaphanous-1 is required for ligand-stimulated cellular migration through activation of Rac1 and Cdc42. J. Biol. Chem. 2008, 283, 34457–34468. [Google Scholar] [CrossRef] [Green Version]
- Yamamoto, Y.; Kato, I.; Doi, T.; Yonekura, H.; Ohashi, S.; Takeuchi, M.; Watanabe, T.; Yamagishi, S.; Sakurai, S.; Takasawa, S.; et al. Development and prevention of advanced diabetic nephropathy in RAGE-overexpressing mice. J. Clin. Investig. 2001, 108, 261–268. [Google Scholar] [CrossRef]
- Jeong, S.-R.; Lee, K.-W. Methylglyoxal-derived advanced glycation end product (AGE4)-induced apoptosis leads to mitochondrial dysfunction and endoplasmic reticulum stress through the RAGE/JNK pathway in kidney cells. Int. J. Mol. Sci. 2021, 22, 6530. [Google Scholar] [CrossRef]
- Rabbani, N.; Thornalley, P.J. Advanced glycation end products in the pathogenesis of chronic kidney disease. Kidney Int. 2018, 93, 803–813. [Google Scholar] [CrossRef] [Green Version]
- Roberts, M.A.; Thomas, M.C.; Fernando, D.; Macmillan, N.; Power, D.A.; Ierino, F.L. Low molecular weight advanced glycation end products predict mortality in asymptomatic patients receiving chronic haemodialysis. Nephrol Dial Transpl. 2006, 21, 1611–1617. [Google Scholar] [CrossRef] [Green Version]
- Coe, L.M.; Denison, J.D.; McCabe, L.R. Low dose aspirin therapy decreases blood glucose levels but does not prevent type i diabetes-induced bone loss. Cell. Physiol. Biochem. 2011, 28, 923–932. [Google Scholar] [CrossRef] [Green Version]
- Pietkiewicz, J.; Bronowicka-Szydełko, A.; Dzierzba, K.; Danielewicz, R.; Gamian, A. Glycation of the muscle-specific enolase by reactive carbonyls: Effect of temperature and the protection role of carnosine, pirydoxamine and phosphatidylserine. Protein J. 2011, 30, 149–158. [Google Scholar] [CrossRef]
- Gomes, R.A.; Oliveira, L.M.A.; Silva, M.; Ascenso, C.; Quintas, A.; Costa, G.; Coelho, A.V.; Sousa Silva, M.; Ferreira, A.E.N.; Ponces Freire, A.; et al. Protein glycation in vivo: Functional and structural effects on yeast enolase. Biochem. J. 2008, 416, 317–325. [Google Scholar] [CrossRef] [Green Version]


| Characteristics | Parameter | Values |
|---|---|---|
| Demographics: | Age, mean ± SD | 62 ± 10 years |
| Sex, n [F/M] | 51/31 | |
| Disease, n (%): | T2DM | 75 (91.4%) |
| T1DM | 4 (4.9%) | |
| T3DM | 3 (3.7%) | |
| Complication, n (%): | Hypertension | 70 (85.4%) |
| Hyperlipidemia | 67 (81.7%) | |
| Macroangiopathies | 53 (64.6%) | |
| Microangiopathy | 18 (22%) | |
| CHD | 24 (29.3%) | |
| PAD | 21 (25.6%) | |
| Nephropathy | 10 (12.2%) | |
| Retinopathy | 9 (10.6%) | |
| Polyneuropathy | 29 (35.4%) | |
| Myocardial infarction | 9 (10.6%) | |
| Stroke | 9 (10.6%) | |
| Treatment, n (%): | Metformin | 58 (70.7%) |
| Sulfonylurea | 35 (42.7%) | |
| Insulin | 33 (40.2%) | |
| Aspirin | 49 (59.8%) | |
| Clopidogrel | 6 (7.3%) | |
| Oral anticoagulants | 10 (12.2%) | |
| Laboratory parameters, mean ± SD: | HbA1c [%] | 8.12 ± 2.13 |
| LDL [mg/dL] | 98 ± 34 | |
| HDL [mg/dL] | 46.4 ± 15.8 | |
| TC [mg/dL] | 180.4 ± 91.2 | |
| TG [mg/dL] | 180 ± 91.2 | |
| GLC [mg/dL] | 166.8 ± 70.1 | |
| CRP [mg/dL] | 2.59 ± 2.18 | |
| Albuminuria [g/dL] | 18.76 ± 10.37 | |
| Creatinine [mg/dL] | 0.96 ± 0.22 | |
| eGFR [mL/min/1.73 m2] | 74.11 ± 17.2 |
| Complication | Mean AGE 10 (95%CI), n | p | |
|---|---|---|---|
| Without Complication | With Complication | ||
| Macroangiopathy | 110 (76–144), 29 | 111 (86–137), 53 | 0.953 |
| Ischemic stroke | 108 (86–128), 73 | 139 (56–223), 9 | 0.327 |
| PAD | 105 (82–128), 61 | 128 (83–174), 21 | 0.318 |
| Myocardial infarction | 114 (93–136), 73 | 85 (17–152), 9 | 0.362 |
| Ischemic heart disease | 119 (96–143), 58 | 90.5 (50–13), 24 | 0.197 |
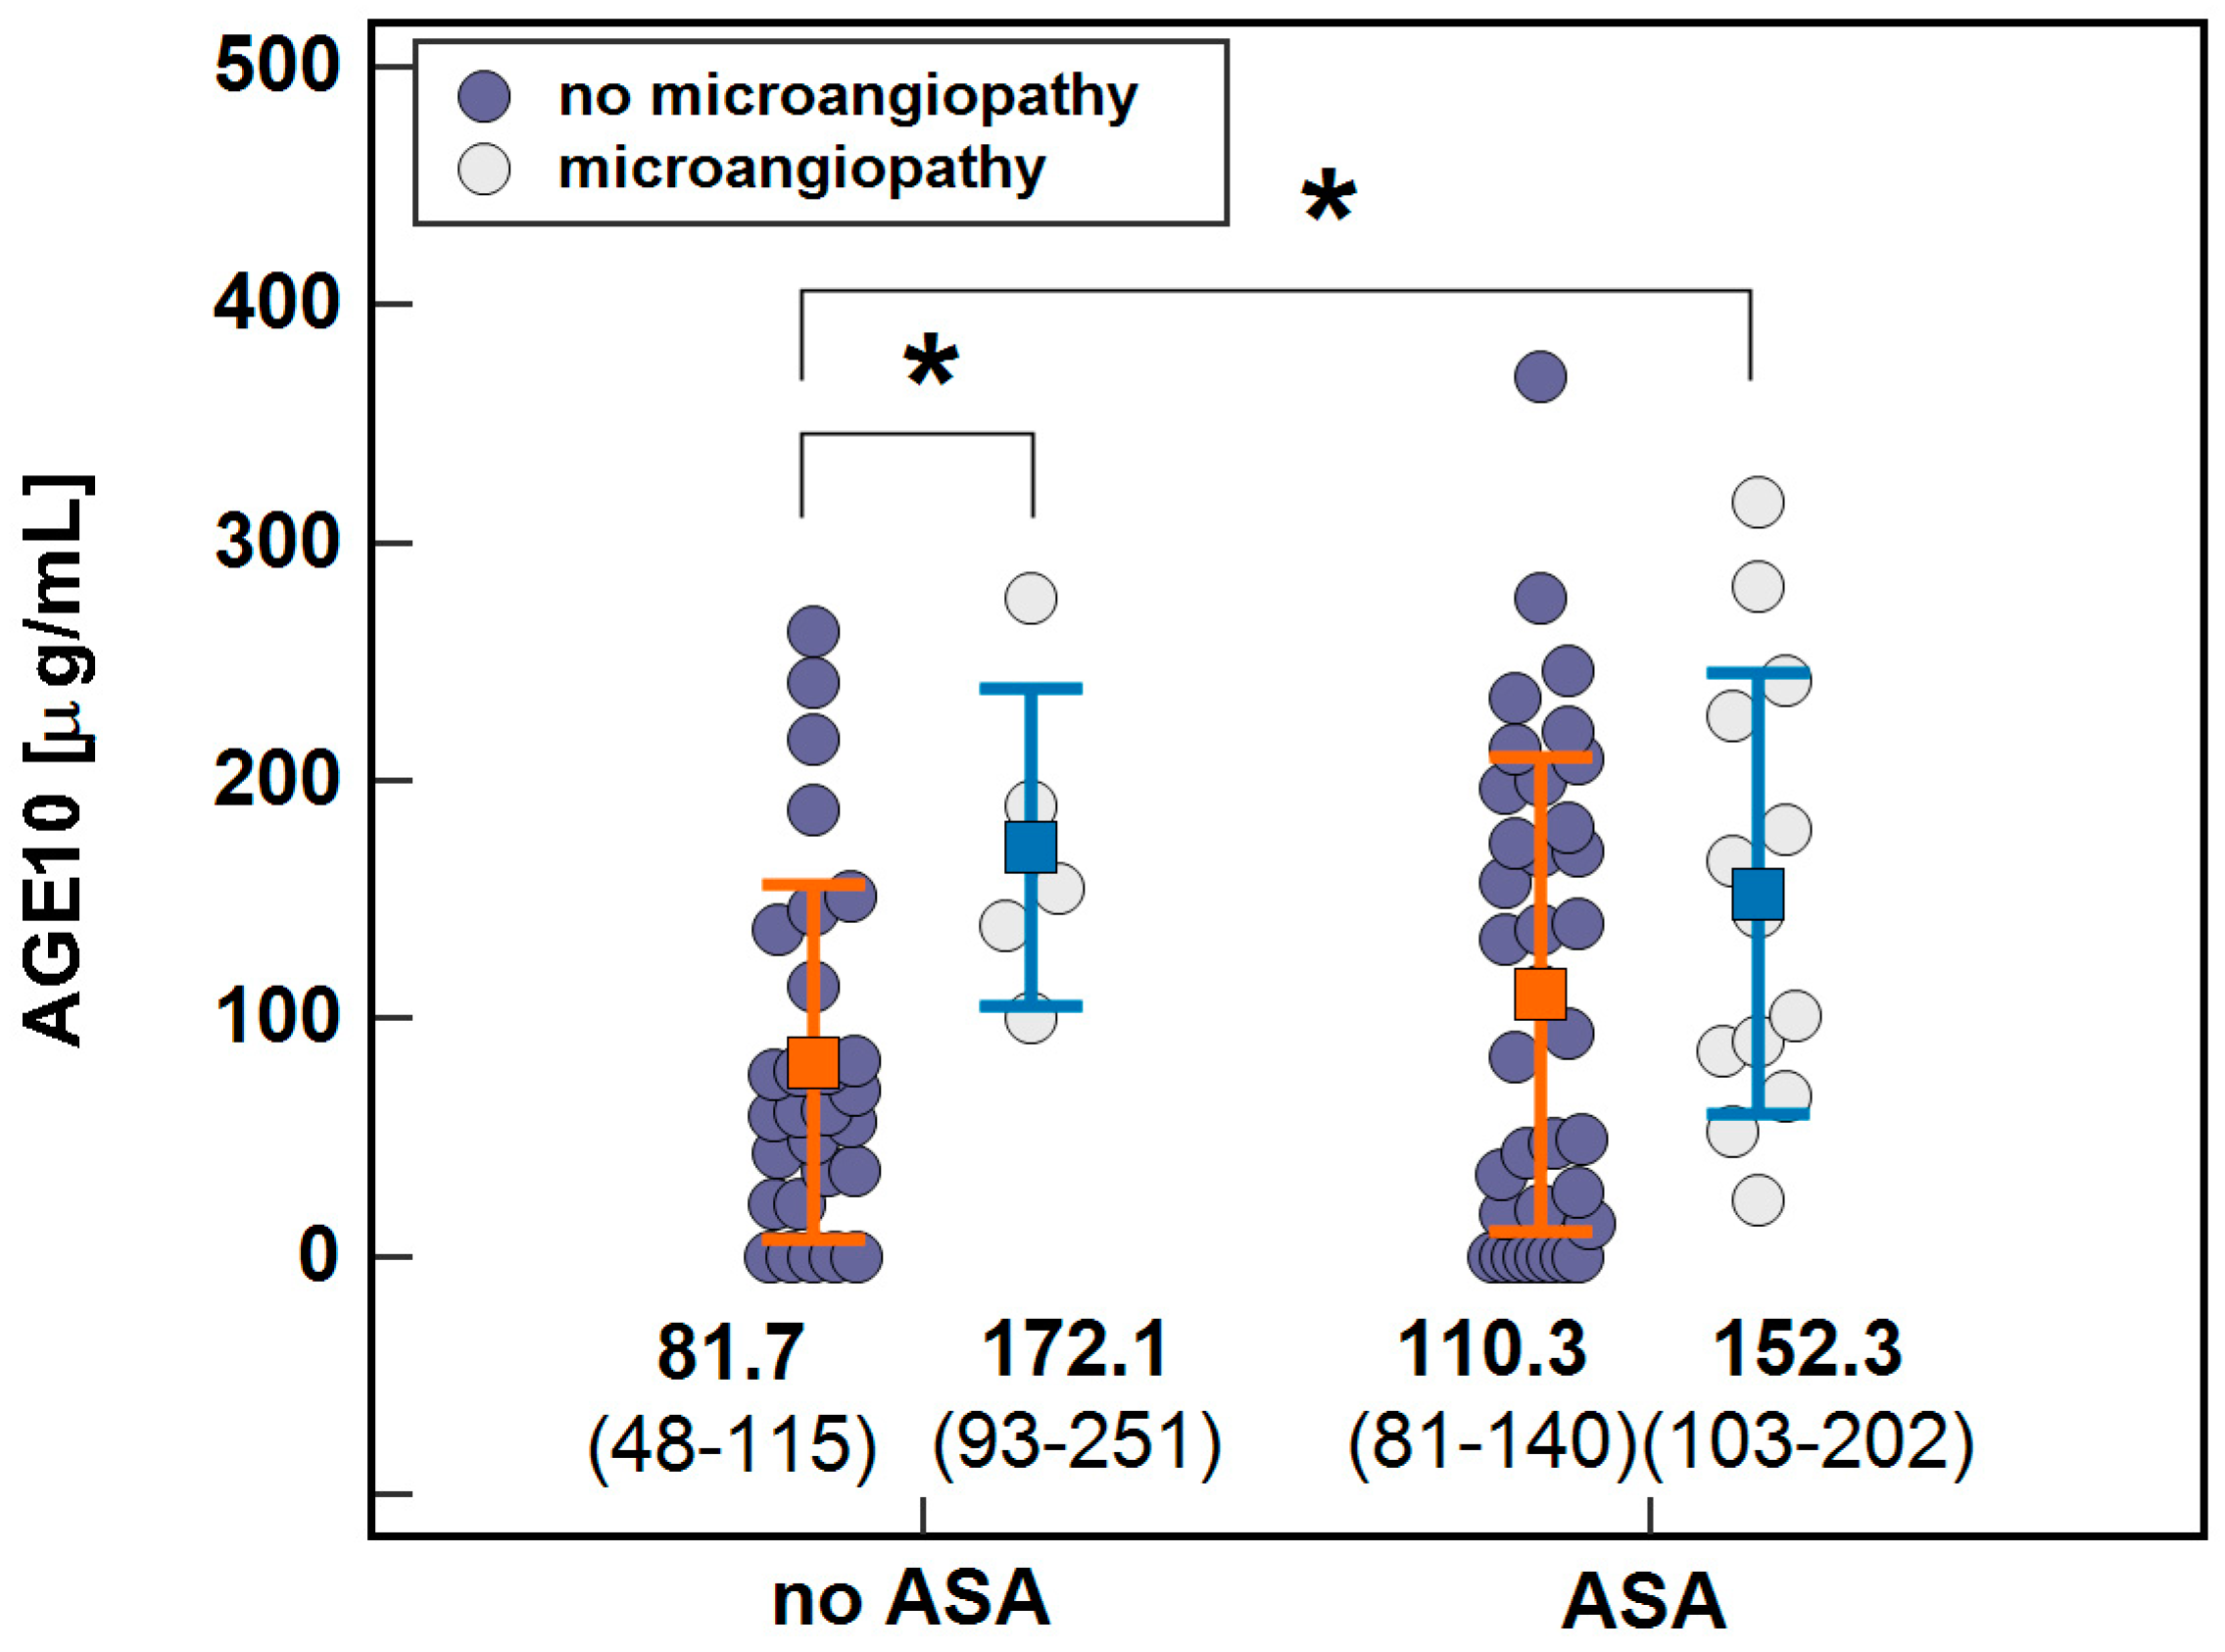
| Microangiopathy | 98 (75–120), 64 | 158 (116–200), 18 | 0.013 |
| Nephropathy | 112 (90–134), 72 | 101 (39–163), 10 | 0.719 |
| Retinopathy | 106 (85–127), 73 | 152 (83–221), 9 | 0.156 |
| Polyneuropathy | 105 (80–129), 53 | 123 (86–159), 29 | 0.404 |
| Hyperlipidemia | 81 (46–115), 15 | 118 (94–141), 67 | 0.160 |
| Hypertension | 95 (51–139), 12 | 114 (91–136), 70 | 0.512 |
| Index | Correlation Coefficient (r), p |
|---|---|
| CRP | 0.05, p = 0.688 |
| Glucose | 0, p = 0.946 |
| HbA1c | 0.04, p = 0.735 |
| HDL-cholesterol | −0.15, p = 0.218 |
| LDL-cholesterol | −0.05, p = 0.684 |
| Triglycerides | −0.11, p = 0.360 |
| Creatinine | −0.25, p = 0.036 |
| eGFR | 0.34, p = 0.005 |
| Albumin/Creatinine ratio | −0.21, p = 0.171 |
| Age | −0.09, p = 0.415 |
| Medication | Mean AGE 10 (95%CI), n | p | |
|---|---|---|---|
| Untreated | Treated | ||
| Oral anticoagulants | 114 (92–135), 72 | 92 (29–155), 10 | 0.495 |
| Aspirin | 97 (68–125), 33 | 120.5 (92–149), 49 | 0.253 |
| Clopidogrel | 106 (86–127), 76 | 172 (60–283), 6 | 0.094 |
| Metformin | 96 (66–125), 24 | 117 (91–143), 58 | 0.340 |
| Sulfonylurea | 101 (76–125), 47 | 125 (90–160), 35 | 0.242 |
Publisher’s Note: MDPI stays neutral with regard to jurisdictional claims in published maps and institutional affiliations. |
© 2021 by the authors. Licensee MDPI, Basel, Switzerland. This article is an open access article distributed under the terms and conditions of the Creative Commons Attribution (CC BY) license (https://creativecommons.org/licenses/by/4.0/).
Share and Cite
Bronowicka-Szydełko, A.; Krzystek-Korpacka, M.; Gacka, M.; Pietkiewicz, J.; Jakobsche-Policht, U.; Gamian, A. Association of Novel Advanced Glycation End-Product (AGE10) with Complications of Diabetes as Measured by Enzyme-Linked Immunosorbent Assay. J. Clin. Med. 2021, 10, 4499. https://doi.org/10.3390/jcm10194499
Bronowicka-Szydełko A, Krzystek-Korpacka M, Gacka M, Pietkiewicz J, Jakobsche-Policht U, Gamian A. Association of Novel Advanced Glycation End-Product (AGE10) with Complications of Diabetes as Measured by Enzyme-Linked Immunosorbent Assay. Journal of Clinical Medicine. 2021; 10(19):4499. https://doi.org/10.3390/jcm10194499
Chicago/Turabian StyleBronowicka-Szydełko, Agnieszka, Małgorzata Krzystek-Korpacka, Małgorzata Gacka, Jadwiga Pietkiewicz, Urszula Jakobsche-Policht, and Andrzej Gamian. 2021. "Association of Novel Advanced Glycation End-Product (AGE10) with Complications of Diabetes as Measured by Enzyme-Linked Immunosorbent Assay" Journal of Clinical Medicine 10, no. 19: 4499. https://doi.org/10.3390/jcm10194499