
Effect of Stress Magnitude on Pit Growth Rate of 304 Austenitic Stainless Steel in Chloride Environments


1
Department of Mechanical Engineering, Korea University, Seoul 02841, Korea
2
Department of Nuclear and Quantum Engineering, Korea Advanced Institute of Science and Technology, Daejeon 34141, Korea
*
Author to whom correspondence should be addressed.
Metals 2021, 11(9), 1415; https://doi.org/10.3390/met11091415
Submission received: 19 July 2021
/
Revised: 4 September 2021
/
Accepted: 5 September 2021
/
Published: 7 September 2021
(This article belongs to the Special Issue Friction and Corrosion Behaviors of Stainless Steels)
Abstract
:In this study, a corrosion pit test using notched bar specimens was conducted to investigate the effect of stress magnitude on the pit growth rate. To produce the notched bar specimens, 304 austenitic stainless steel was used, which is a material used for spent nuclear fuel canisters. Furthermore, three levels of stresses were generated using different notch radii. The corrosion pits were quantitatively measured through scanning electron microscopy and analyzed by finite element analysis. Based on experimental data, the pit growth rate model is suggested in terms of the stress and exposure time.
1. Introduction
For long-term storage of spent nuclear fuels (SNFs), dry storage system with steel canisters have been manufactured and installed at Independent Spent Fuel Storage Installations (ISFSI) near the seashore. Because of their excellent corrosion resistance and weld properties, austenitic stainless steels are generally used for canisters that are welded in the axial and circumferential directions. Because post-weld heat treatment cannot be performed due to sensitization [1], high welding residual stresses can remain in the weld including the heat-affected zone (HAZ).
To quantify welding residual stresses after the welding process of the canister, Sandia National Laboratories (SNL) manufactured a mock-up canister using annealed 304L and 308L stainless steel [2]. Using various methods such as incremental deep hole drilling (iDHD), contour, X-ray diffraction, and ultrasonic methods, welding residual stresses were measured at different locations such as in the weld centerline and the HAZ. The data showed that the maximum residual stress measured using the iDHD method was as high as 400 MPa at the centerline in the axial direction of a longitudinal weld. Note that the maximum residual stress was significantly higher than the yield strength of 304L stainless steel (290 MPa) used in the study. Wu et al. [3] simulated welding residual stresses for the mock-up canister [2] using three-dimensional coupled thermo-mechanical finite element (FE) analysis. The maximum residual stress measured through the FE analysis agreed well with the experimental measurements.
In addition, the high-stress region near the welding line could be exposed to a chloride environment in long-term storage. This is because air flows continuously through the inlet vent for cooling the residual heat of the SNFs and some chloride components from the sea could be deposited on the high-stress region. Bryan et al. [4] reported that the chlorides were included in the dust which deliquesced on the surface of the canisters under rich relative humidity (RH). It explains the process of chloride-induced stress corrosion cracking (CISCC) which makes the austenitic stainless steel sensitive to cracking. To evaluate the structural integrity of long-term storage canisters under CISCC environments, US Nuclear Regulatory Commission has requested to establish the Code Case N-860 in ASME BPVC Section XI for the development of Aging Management Program (AMP).
Therefore, the rates of corrosion pit or corrosion crack growth resulting from CISCC under high residual stresses should be measured. Crack growth tests were conducted by several researchers to evaluate the crack growth rate and the threshold stress intensity factor (Kth). For instance, Tani et al. [5] performed a constant load test using candidate materials for the canister. The results showed that, with increasing temperature, the crevice corrosion potential decreased and the measured Kth was ~30 MPa·√m for 316 austenitic stainless steel at 80 °C and 35% RH. Using a bolt-loaded C(T) and teardrop specimen, Duncan et al. [6] performed constant displacement tests. As a result of compliance change due to the crack, the load drop was observed. The immersion test with constant displacement-type was conducted by Jeong et al. [7] using a C(T) specimen at 50 °C and 5% salinity. The cracked surface showed the transgranular-type CISCC penetrated by the chloride. For 304 austenitic stainless steel, the Kth was ~15 MPa·√m and the temperature dominantly affected the CISCC growth rate.
According to the study conducted by Pistorius et al. [8], cracks generated on the 304 stainless steel were associated with the pit and developed by the metastable pitting corrosion. Similarly, in the case of corrosion pit, CISCC can be a critical factor for structural integrity of canisters. Therefore, the pit growth test under high-stress condition is requisite. Most of the existing works on corrosion pits for austenitic stainless steels have been conducted using the electrochemical test method [9,10]. Khobragade et al. [11] investigated the effect of chloride concentrations on the corrosion rate of austenitic stainless steel. The experimental results showed that with increasing chloride concentration, the corrosion progressed faster and the polarization resistance deteriorated. Pal et al. [12] investigated the effect of temperature and surface treatment on the corrosion rate for forged 304 stainless steel. The corrosion rate was confirmed to increase with an increase in the exposure temperature. The surface roughness also significantly affected the number of corrosion pits. The effect of humidity on the generation of corrosion pit for 304 stainless steel was investigated under sea-salt environments by Srinivasan et al. [13]. It was found that, as the RH decreased from 76% to 40%, the corrosion susceptibility increased gradually. Owing to low RH, brines on the surface became insoluble and more precipitations remained; therefore, the active area where the corrosion pits were generated was concentrated.
The objective of this study is to investigate the effect of high stresses such as high residual stresses in the canister on the pit growth rate, which has not been conducted by previous studies. To apply high stresses to a material, a notched bar specimen is used with different notch radii. The observed corrosion pits from the experiments are analyzed and a new corrosion model is suggested. The pit growth mechanism and the tendency of the corrosion pit growth according to the stress magnitude are presented in this study.
2. Experimental
2.1. Test Material and Specimen
The test material was 304 austenitic stainless steel (UNS S30400 [14,15]), which is commonly used to manufacture a dry storage canister. The chemical composition of the test material is presented in Table 1. It is noteworthy that a dry storage canister is manufactured through axial and circumferential welding. Because post-weld heat treatment is not performed due to sensitization, high tensile residual stresses remain in the weld region. Figure 1 shows through-thickness variations of residual stresses in the centerline and HAZ in the full-scale mock-up canister test [2]. The iDHD technique was used to measure the residual stresses. The maximum measured residual stress was approximately 400 MPa in the axial direction which is greater than the yield strength. To apply such high stress, a notched bar specimen was used.
Figure 2 shows the notched tensile bar used in the present work. The specimen had 8 mm of outer diameter (D), 5.6 mm of net diameter (d), and 1.2 mm of notch depth. Three different notch radii—r = 2 mm (blunt), 0.5 mm (medium), and 0.1 mm (sharp)—were inserted, as shown in Figure 2. The notch radius was determined based on the stress concentration factor (Ktn) [16].
2.2. Test Apparatus and Condition
The apparatus used for the notched bar tensile test under the chloride environments is shown in Figure 3. The notched bar specimen was bolted to the bottom plate and assembled to the load-cell for load control during the test. The load-cell was combined with a spring and nut for loading. All these assembled components were placed into a glass chamber filled with 5% artificial sea-salt brine in deionized (DI) water to create a corrosion environment. To maintain stable environmental condition, the glass chamber was covered with a polymer lid and sealed with a vinyl wrap to prevent the evaporation of the brine. As the brine in the chamber was kept still, the effect of the flow rate was ignored. The material of the support jig such as the bottom plate, a connecting rod, and a square pillar was made of 304 austenitic stainless steel to prevent the galvanic corrosion of the specimen.
The test was conducted in the chamber at constant humidity and temperature (relative humidity = 95% and temperature = 50 °C). To investigate the effect of the exposure time on pit growth rate, the experimental period was set to 135, 432, and 708 h for specimen 1, 2, and 3, respectively. The applied load on each specimen is summarized in Table 2, in addition to the nominal stress in the notched bar specimen (σnet). During the test, it was confirmed that the load was constant. The maximum stress in the notch, σnotch, was obtained by multiplying the Ktn values obtained from the literature [16] (from graphical data), which are given in Table 2. The Ktn value of the specimen can be as high as 5.4.
3. Results and Analysis
3.1. Observed Corrosion Pit
To investigate the depth and width of corrosion pit after the test, notches were vertically sectioned along the sectioning line. The sectioning line was determined by examining the notch surface through optical microscopy (OM). The most corrosive surface was verified by rotating the specimen with a resolution of 15°, as shown in Figure 4a. Furthermore, the sectioning line was marked using a pen, as indicated with the red-dotted line in Figure 4b.
Figure 5 shows scanning electron microscopy (SEM) images of the corrosion pits generated around the notch root. Among the multiple corrosion pits formed around the notch root, the deepest pits were selected. In the case of notch number 1 (sharp, 135 h tested), two adjacent corrosion pits were observed, indicated as 1-1 and 1-2 in Figure 5. For each pit, the depth (a) and width (2c) were measured from the captured picture and were characterized as those of a semicircular shape, as shown in Figure 6. The measured values are summarized in Table 3, showing that most of the pits have a shallow depth and significantly longer width. The longest measured depth was only ~1.5 μm, whereas the longest width was 33.8 μm for the 7th pit (sharp, 708 h tested). The aspect ratio (a/2c) was calculated by dividing the depth by the width. From the measured data, the pit growth rate (da/dt) was calculated by dividing the depth by the test time, and the results are listed in Table 3.
3.2. Determination of Local Pit Stress Using FE Analysis
The corrosion pit generated on the notch, shown in Figure 5, can cause further local stress concentration. A numerical method such as FE analysis has been popularly used to calculate accurate local pit stresses [17,18]. In this study, the elastic FE analysis was performed to calculate local pit stresses.
Corrosion pits were modeled based on the measured dimensions provided in Table 3. Because the size of the corrosion pit was significantly small compared to the notch radius, a volumetric pit on a flat-plate subject to the tensile stress of σnotch was modeled with the geometric dimension, as shown in Figure 7. The shape of the corrosion pit was assumed to be a circle as suggested in other experiments [8].
A quarter symmetric model using the ten-node tetrahedral element (C3D10 in ABAQUS) was used. Mesh size sensitivity analysis was performed using four different mesh sizes (0.1, 0.2, 0.4, and 0.8 μm). The analysis revealed that the calculated maximum principal stress results were not sensitive to the element size. For instance, the maximum principal stress of the second pit using the mesh size of 0.1 μm was 518.4 MPa, whereas that using the mesh size of 0.8 μm was 519.6 MPa (0.2% difference). All pit stresses reported here were the results using the 0.1 μm mesh size.
Calculated local pit stresses from FE analysis are summarized in Table 3. Owing to the pit, the local pit stress (σpit) was further intensified. The ratios of the pit and notch stress (σpit/σnotch) are listed in Table 3. It can be seen that the ratio varies from 1.2 to 1.64. The maximum principal stresses around the notch root (originated from the notch root to the length of 1/3c in tensile direction) were calculated through FE analysis that the magnitude had not a significant difference. Using these data, a corrosion rate model was developed, which is discussed in the following section.
4. Corrosion Rate Model
4.1. Existing Corrosion Models
Herein, some existing corrosion models are reviewed. Paik et al. [19] suggested a corrosion model based on experimental data to analyze the ageing effect of corrosion damage on marine structures. The linear model given in Equation (1) was proposed based on the assumption that corrosion is initiated with the removal of the surface coating.
where a is the corrosion depth in mm, C is the corrosion coefficient, and t is exposure time in year after the breakdown of coating. According to the model, the corrosion depth linearly increases owing to the exposure of the structure to the marine environment, resulting in a constant corrosion rate. Melchers et al. [20] evaluated the corrosion damage by measuring the weight loss of cast iron, aluminum, and copper-nickels in marine environments. It was concluded that most corrosion losses occurred in the first few years (~2 years), this can be expressed as Equation (2).
where c(t) is corrosion loss in mm, and A and B are material constants. The corrosion rate under long-term exposure (more than 8 years) was evaluated nearly as described in Equation (3).
where p and q are material constants. These equations suggest that the corrosion rate reduces with increasing exposure time.
To analyze the effect of welding residual stresses on the corrosion rate in the dry storage canister, a new model should be suggested considering high tensile stresses due to residual stresses. This will be shown in the following section.
4.2. Stress Effect on Pit Growth Rate
The factors affecting the pit growth rate can be the exposure time, salinity, surface treatment of the material, temperature, and others [21]. The test conducted in this study was the immersion test, and most of factors were constant except for the exposure time and maximum principal pit stress.
The calculated pit growth rates (da/dt) listed in Table 3 are shown as the maximum principal stress and exposed time in Figure 8. To suggest a new model, the corrosion rate is assumed to increase exponentially with the initially applied maximum principal stress. The effect of the maximum principal stress on the pit growth rate can be quantified using the following equation:
where m is the exponential coefficient of the maximum principal stress and C’ is a function of the exposed time [μm/(year·MPa)]. As shown in Figure 8a, m = 1.3 provides a good fit to the data. The effect of the exposure time can be separated from C’, providing
where C is a pit growth rate constant [μm/(year·MPa·hr)] and n is an exponential coefficient for the exposed time. Regression of the present test data gives C = 0.8 and n = −0.7. Figure 8b shows the comparison between the results obtained from Equation (5) and the experimental data revealing slightly conservative estimations of the corrosion rate.
4.3. Comparison with Other Models
The corrosion rates of 304 austenitic stainless steel are compared with those of other materials, as shown in Figure 9. The corrosion test in this study was conducted at 50 °C by immersing the notched bar specimen in the 5% artificial sea-salt brine. Ma et al. [22] investigated Q235 carbon steel under marine atmospheric environment, where the average temperature was 24.7 °C and the relative humidity was 87%. The coupon was positioned at a height of 95 m from the sea level and exposed to natural condition. As a result, the corrosion loss of the coupon increased and saturated with the increasing exposure time. The corrosion rate of carbon steel was faster than that of 304 austenitic stainless steel. Melchers et al. [21] performed the test using mild steel in natural conditions. The average temperature was 22 °C, and the increment in the corrosion depth reduced exponentially with the increasing exposure time, as shown in Figure 9. Both data were used to suggest a corrosion model similar to Equation (2). As a result, the corrosion resistance of 304 austenitic stainless steel for pit initiation is more superior than carbon or mild steel even under higher temperature and tensile stress condition.
5. Discussion
5.1. Surface Morphology
The process of the pit growth of the austenitic stainless steel is illustrated in Figure 10. Chromium included in austenitic stainless steel is prone to oxidation. As a result, a thin passive film (Cr2O3) is formed as shown in Figure 10a with the respective chemical equation. The passive film with a thickness of approximately 2–3 nm [23] plays an important role in preventing hydration and oxidation of the material. However, the passive film can be broken through the exposure to chloride ions (Cl−). As shown in Figure 10b, the mixture of salt-deposit and corrosion product (cathodic region) can be piled up on the surface, which induces the dissolution kinetics suggested in previous study [12]. In Figure 10b, M can be Fe, Ni, or Cr, which are included in 304 austenitic stainless steel and n denotes the number of electrons. At the initial process of nucleation, the passive film is broken, and the corrosion pit is generated by the electrochemical gradient between the deposit layer and the steel [24,25].
In this work, tests were conducted under the stable immersion condition such that the deposit layers were formed on the notches, as captured in the SEM images in Figure 11. In the blunt notch (r = 2.0 mm), deposits near the corrosion pits were analyzed using energy dispersive X-ray spectroscopy (EDS), as indicated with an orange box in Figure 11a. As shown in Figure 12a (EDS Spot 1), large amount of oxygen was detected, and some components in the raw material (Fe, Cr, Si, and others) coexisted with the components in the artificial sea salt (K, Na, Ca, Cl, and others). The components in the artificial sea-salt were remarkably measured in EDS Spot 2 in Figure 12a, particularly the salt component (Na, Cl) that can explain the generation of the corrosion pit below the deposits on the surface.
For the medium notch (r = 0.5 mm), a widespread deposit layer was observed on the raw surface, as seen in Figure 11b. A corrosion pit with the width of approximately 10 μm was generated as the materials near the defect would be dissolved with the progression of kinetic dissolution. Other corrosion pits were linked along the machine lines where the inclusions were prone to stack up; thus, nonuniform surface profile can trigger electrochemical reactions.
For the sharp notch (r = 0.1 mm), the deposit layers seemed to be considerably thicker. On the periphery of the separated layers, the deposits were also analyzed using the EDS method captured in the orange box in Figure 11c. The line detection, which corresponds to the EDS detection path (red line), was conducted as shown in Figure 12b, and the amount of each component was measured. On the smooth surface in the detected line, steel components (Fe, Cr, and Ni) and salt components (Mg and Cl) were observed with oxygen (O) that could be included in the corrosion products or the passive film. The noticeable point for the micro-crack was that the amount of Fe (Orange line) and O (Pink line) increased and dropped, respectively. The EDS analysis suggested that the micro-crack between the separated layer was the anodic region in which the corrosion pit could be developed, as shown in Figure 10b. With the increasing notch stress, the deposit layers were piled up and separated to make a micro-crack as the cavity between the grain could be easily formed by the tensile stress as shown in Figure 11c.
5.2. Aspect Ratio of Corrosion Pit
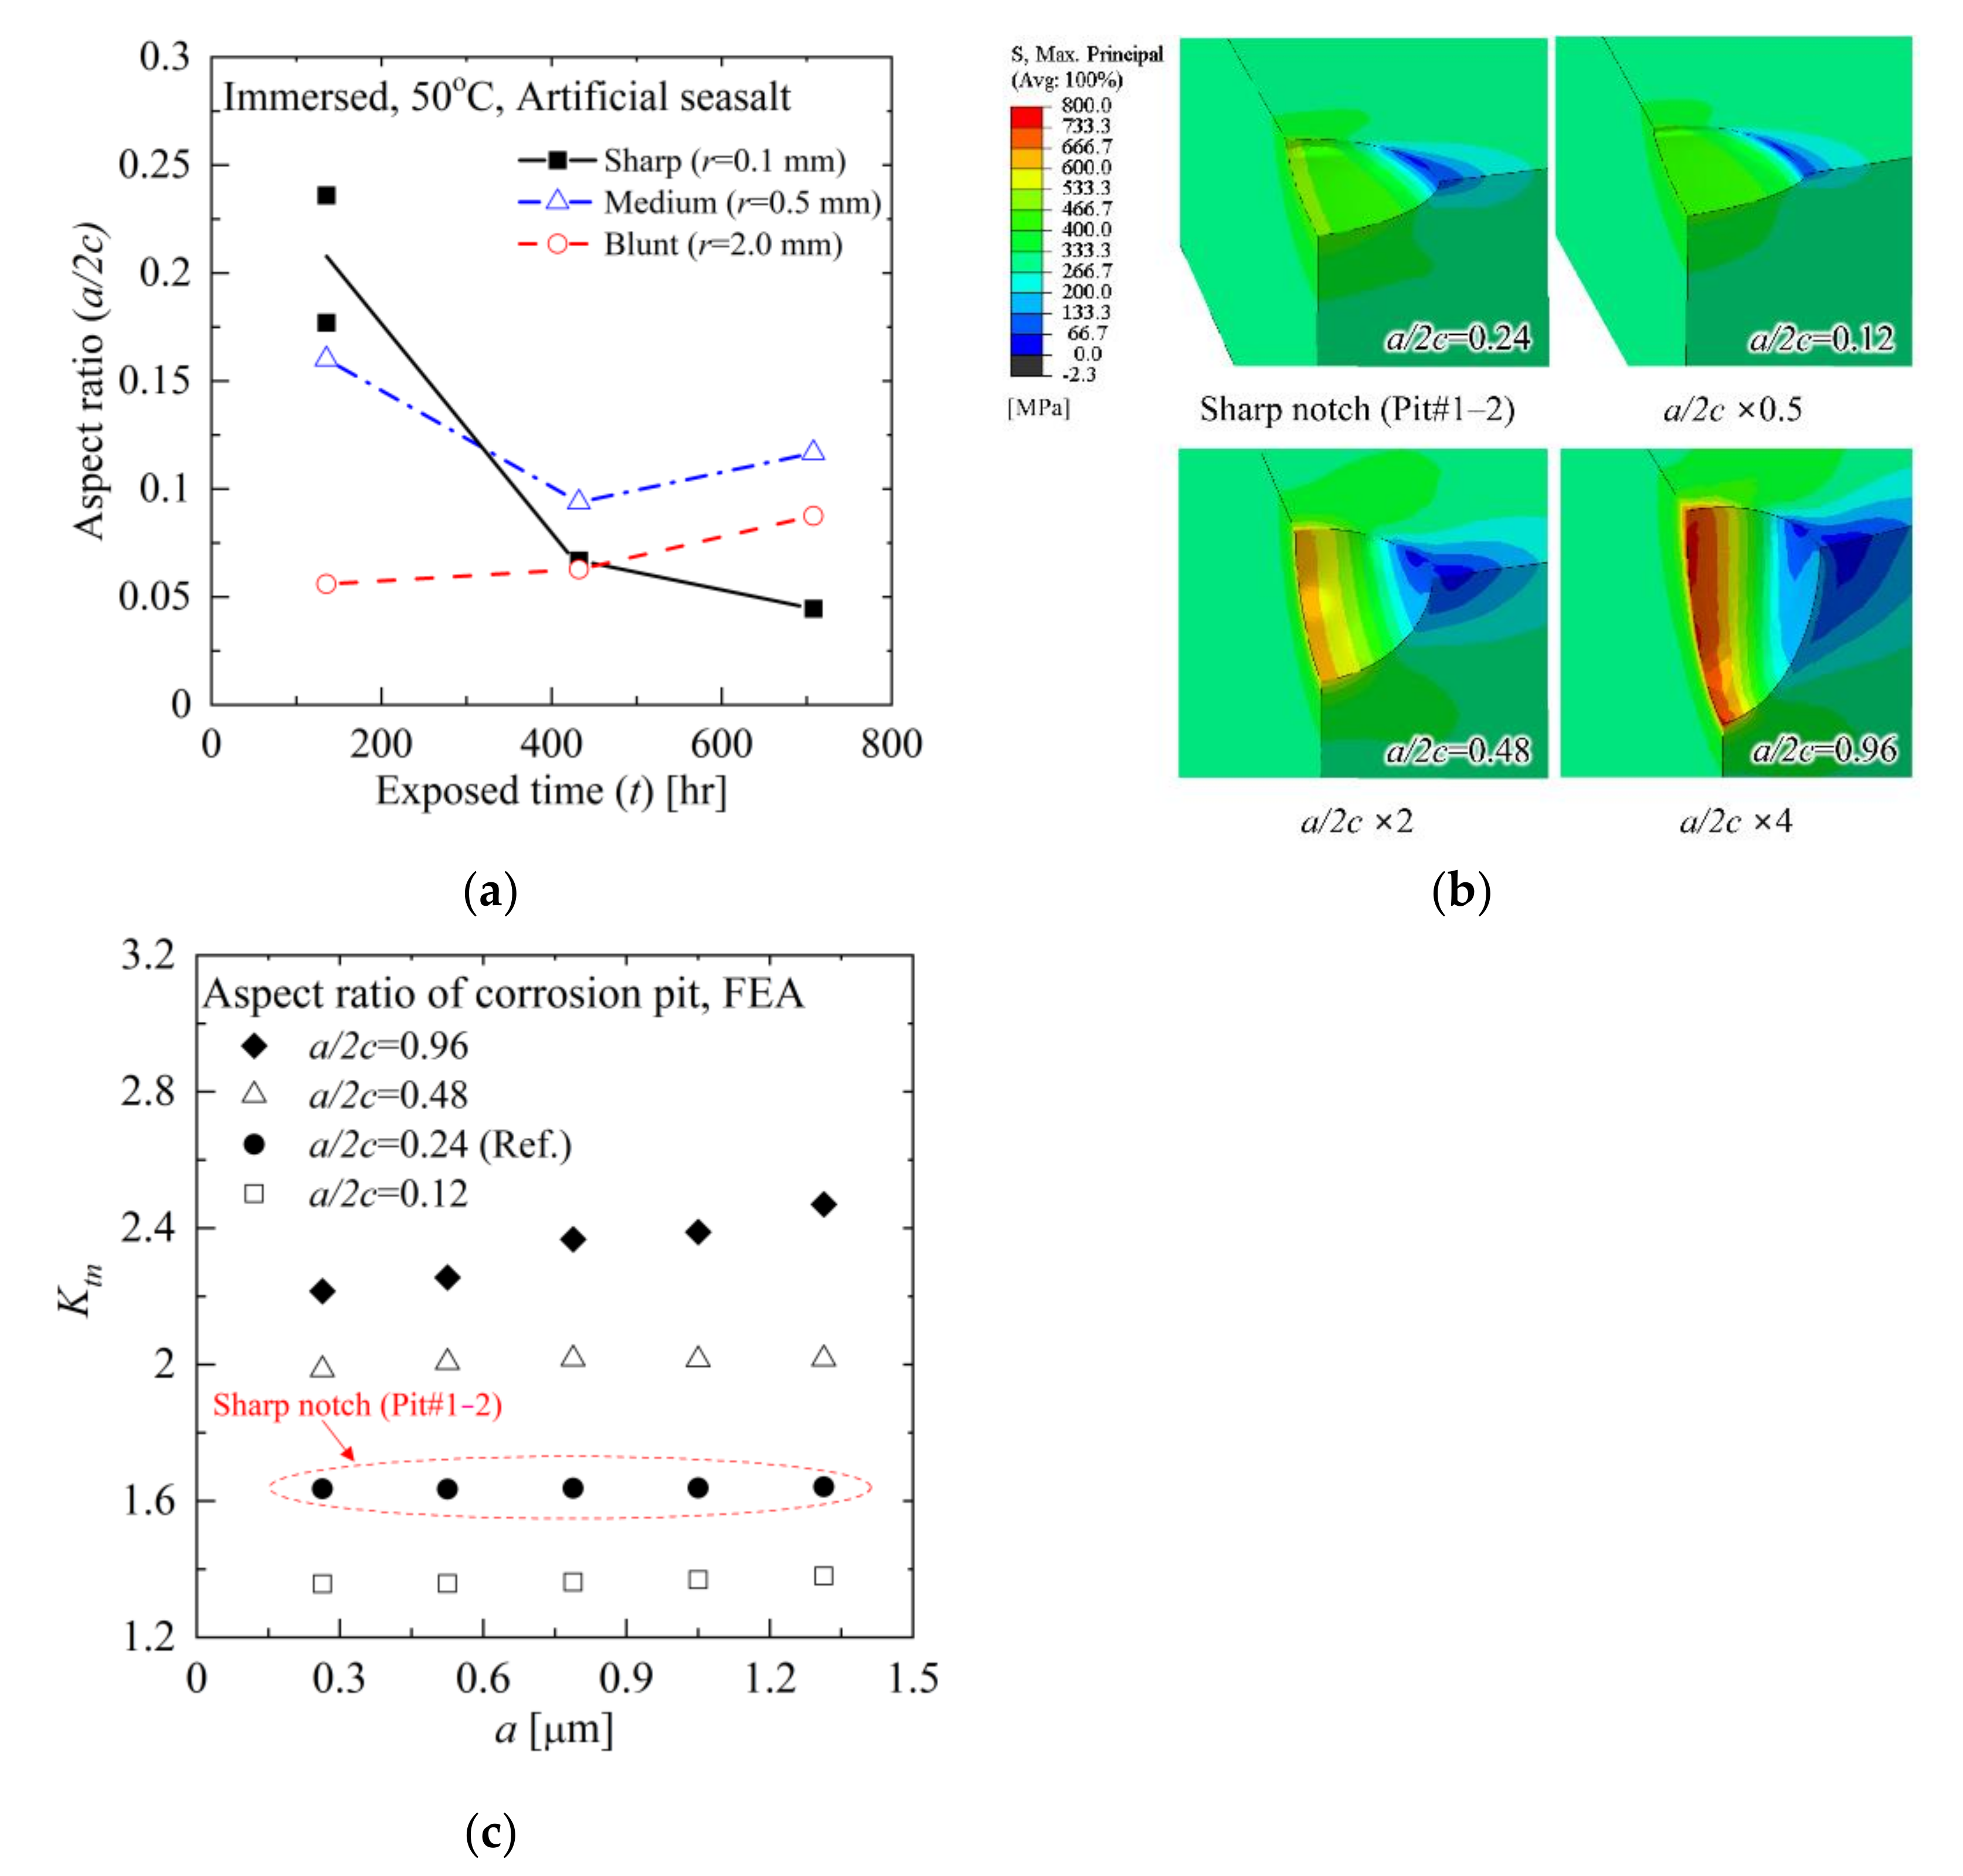
Corrosion pit geometry in Figure 5 shows that the width of a pit is significantly larger than the depth. This could be because of the difference in the dominant factors such as electrochemical potential or diffusion. In the pit nucleation step, the dissolution kinetics are dominantly affected by the electrochemical potential of the deposit layer [26]. After forming of the corrosion pit, the material delivery to the bottom of the corrosion pit is disturbed by the covered layer on the surface. Therefore, diffusion becomes the critical factor for the corrosion pit growth toward the depth direction. Figure 13a shows the aspect ratios provided in Table 3. The aspect ratio in the sharp notch was calculated to be approximated 0.2, which decreased dramatically with increasing exposure time compared to those in other type of notches. Meanwhile, the aspect ratio in the medium or blunt notch was less dependent on the exposure time. Similar features have also been observed in a study by Ghahari et al. [27].
To further analyze the relationship between the aspect ratio (a/2c) of the corrosion pit and Ktn, the FE model in Figure 7 was used to calculate Ktn for the pit geometry. Note that Cerit M. [17] performed a similar analysis for fatigue analysis. The geometry of Pit#1−2 in Table 3 was selected as the reference geometry, for which a/2c = 0.24. The value of Ktn was calculated for a/2c = 1.64. Maximum principal stress contours from FE analysis are shown in Figure 13b. Figure 13c shows variations of Ktn with a for different a/2c values. It shows that Ktn is not so sensitive to a up to a/2c < 0.96. For a/2c = 0.96, Ktn increases linearly with increasing a. It implies that a small notch (corrosion pit) on the main notch of the specimen can affect the stress concentration and confirms that the stress can be intensified with the pit depth.
According to the proposed model, the notch-shaped pit formed on the canister would probably grow faster when initially exposed to the CISCC environments. The growth rate relaxes until the deposit layer and the corrosion product cover the developed pit; thus, the corrosion pit lies in a stable condition. Note that the that the initially applied stress can accelerate the pit growth, as presented in the experimental results. Even the contact area of the sharp notch is narrower than those of other notches such that the highest stress accelerates the growth of the corrosion pit on that notch. When the covers on the corrosion pit are delaminated by exposure to aggressive environmental change of external impact, the pit growth is initiated under higher stress concentration condition. In that case, the pit growth rate can be evaluated by applying the renewed exposure time and intensified stress, considering the notch effect.
6. Conclusions
In this study, the corrosion tests using the notched bar specimens were conducted to investigate the stress magnitude effect on the pit growth rate. The notched bar specimens were produced using 304 austenitic stainless steel with three different radii to generate different notch tip stresses. The specimens were immersed in 5% artificial sea-salt water in DI at 50 °C and exposed for different exposure times. The corrosion pits were analyzed by SEM and FE analysis to quantify the effect of the stress magnitude on the pit growth rate
The key conclusions can be summarized as follows:
- Based on our experimental findings, the pit growth rate model is suggested in terms of the maximum principal stress on the pit (σpit) and exposure time (t) by fitting the experimental data. The model suggested that the pit growth rate increases exponentially with increasing maximum principal stress and decreasing exposure time.
- SEM analysis of the corrosion pits verified that the electrochemical dissolution facilitated the corrosion pit growth toward the width direction.
- The comparison of the corrosion rate obtained in the present work with those reported in literature showed that the corrosion performance of 304 stainless steel in marine environments is better than those of carbon or mild steel.
- The FE analysis results show that the stress concentration factor (Ktn) is not dependent on a for small a/2c. For large a/2c, Ktn increases linearly with a, which suggests that the stress can be intensified as increasing the corrosion pit depth.
Author Contributions
Conceptualization, J.-Y.J.; methodology, J.-Y.J.; software, J.-Y.J.; validation, Y.-J.K. and C.J. (Chaewon Jeong); formal analysis, J.-Y.J.; investigation, J.-Y.J. and C.J. (Chaewon Jeong); resources, J.-Y.J. and C.J. (Chaewon Jeong); data curation, Y.-J.K.; writing—original draft preparation, J.-Y.J.; writing—review and editing, Y.-J.K. and C.J. (Changheui Jang); visualization, J.-Y.J. and C.J. (Chaewon Jeong); supervision, Y.-J.K.; project administration, Y.-J.K. All authors have read and agreed to the published version of the manuscript.
Funding
This research received no external funding.
Acknowledgments
This work is supported by the National Research Foundation of Korea (NRF) grant funded by the Korea Government (MSIT) (NRF-2019M2D2A2048296).
Conflicts of Interest
The authors declare no conflict of interest.
References
- Hall, E.L.; Briant, C.L. Chromium depletion in the vicinity of carbides in sensitized austenitic stainless steels. Met. Mater. Trans. A 1984, 15, 793–811. [Google Scholar] [CrossRef]
- Enos, D.; Bryan, C.R. Residual Stress Measurements from the SNL Mockup Container; Sandia National Lab.(SNL-NM): Albuquerque, NM, USA, 2015. [Google Scholar]
- Wu, X.; Yu, Z.; Gordon, S.; Olson, D.; Liu, S.; Bryan, C.; Schindelholz, E.; Enos, D.; Shayer, Z. Finite Element Analysis of Weld Residual Stresses in Austenitic Stainless Steel Canisters in Dry Storage of Spent Fuel; Sandia National Lab.(SNL-NM): Albuquerque, NM, USA, 2017. [Google Scholar]
- Bryan, C.R.; Enos, D.G. Analysis of dust samples collected from spent nuclear fuel interim storage containers at Hope Creek, Delaware, and Diablo Canyon, California; Sandia National Lab.(SNL-NM): Albuquerque, NM, USA, 2014. [Google Scholar]
- Tani, J.-I.; Mayuzumi, M.; Hara, N. Initiation and Propagation of Stress Corrosion Cracking of Stainless Steel Canister for Concrete Cask Storage of Spent Nuclear Fuel. Corrosion 2009, 65, 187–194. [Google Scholar] [CrossRef]
- Duncan, A.J.; Lam, P.S.; Sindelar, R.L.; Metzger, K.E. Crack Growth Rate Testing of Bolt-Load Compact Tension Specimens Under Chloride-Induced Stress Corrosion Cracking Conditions in Spent Nuclear Fuel Canisters. In Pressure Vessels and Piping Conference; American Society of Mechanical Engineers: New York City, NY, USA, 2018; p. V06BT06A068. [Google Scholar]
- Jeong, J.-Y.; Lee, M.-W.; Kim, Y.-J.; Lam, P.-S.; Duncan, A.J. Chloride-Induced Stress Corrosion Cracking Tester for Austenitic Stainless Steel. J. Test. Evaluation 2020, 49, 2. [Google Scholar] [CrossRef]
- Pistorius, P.C.; Burstein, G.T. Metastable pitting corrosion of stainless steel and the transition to stability. Philos. Trans. R. Soc. London. Ser. A Phys. Eng. Sci. 1992, 341, 531–559. [Google Scholar] [CrossRef]
- Sivakumar, M.; Rajeswari, S. Investigation of failures in stainless steel orthopaedic implant devices: Pit-induced stress corrosion cracking. J. Mater. Sci. Lett. 1992, 11, 1039–1042. [Google Scholar] [CrossRef]
- Tokuda, S.; Muto, I.; Sugawara, Y.; Hara, N. Pit initiation on sensitized Type 304 stainless steel under applied stress: Correlation of stress, Cr-depletion, and inclusion dissolution. Corros. Sci. 2020, 167, 108506. [Google Scholar] [CrossRef]
- Khobragade, N.N.; Khan, M.I.; Patil, A.P. Corrosion Behaviour of Chrome–Manganese Austenitic Stainless Steels and AISI 304 Stainless Steel in Chloride Environment. Trans. Indian Inst. Met. 2013, 67, 263–273. [Google Scholar] [CrossRef]
- Pal, S.; Bhadauria, S.S.; Kumar, P. Pitting Corrosion Behavior of F304 Stainless Steel Under the Exposure of Ferric Chloride Solution. J. Bio- Tribo-Corrosion 2019, 5, 91. [Google Scholar] [CrossRef]
- Srinivasan, J.; Weirich, T.D.; Marino, G.; Annerino, A.; Taylor, J.M.; Noell, P.; Griego, J.J.M.; Schaller, R.F.; Bryan, C.; Locke, J.; et al. Long-Term Effects of Humidity on Stainless Steel Pitting in Sea Salt Exposures. J. Electrochem. Soc. 2021, 168, 021501. [Google Scholar] [CrossRef]
- ASTM International. A240/A240M-19. Standard Specification for Chromium and Chromium-Nickel Stainless Steel Plate, Sheet, and Strip for Pressure Vessels and for General Applications; ASTM International: West Conshohocken, PA, USA, 2019. [Google Scholar]
- ASTM International. E527-16. Standard Practice for Numbering Metals and Alloys in the Unified Numbering System (UNS); ASTM International: West Conshohocken, PA, USA, 2016. [Google Scholar]
- Pilkey, W.D.; Pilkey, D.F.; Bi, Z. Peterson’s Stress Concentration Factors; John Wiley & Sons: Hoboken, NJ, USA, 2020. [Google Scholar]
- Cerit, M. Numerical investigation on torsional stress concentration factor at the semi elliptical corrosion pit. Corros. Sci. 2013, 67, 225–232. [Google Scholar] [CrossRef]
- Zhu, L.K.; Yan, Y.; Qiao, L.J.; Volinsky, A. Stainless steel pitting and early-stage stress corrosion cracking under ultra-low elastic load. Corros. Sci. 2013, 77, 360–368. [Google Scholar] [CrossRef]
- Paik, J.K.; Thayamballi, A.K. Ultimate strength of ageing ships. Proc. Inst. Mech. Eng. Part M: J. Eng. Marit. Environ. 2002, 216, 57–77. [Google Scholar] [CrossRef]
- Melchers, R.E. Progress in developing realistic corrosion models. Struct. Infrastruct. Eng. 2018, 14, 843–853. [Google Scholar] [CrossRef]
- Melchers, R. Modeling of Marine Immersion Corrosion for Mild and Low-Alloy Steels—Part 1: Phenomenological Model. Corrosion 2003, 59, 319–334. [Google Scholar] [CrossRef]
- Ma, Y.; Li, Y.; Wang, F. Corrosion of low carbon steel in atmospheric environments of different chloride content. Corros. Sci. 2009, 51, 997–1006. [Google Scholar] [CrossRef]
- Schumacher, M.M. Seawater Corrosion Handbook; Noyes Data Corporation: Park Ridge, NJ, USA, 1979. [Google Scholar]
- Mohammadi, F.; Nickchi, T.; Attar, M.; Alfantazi, A. EIS study of potentiostatically formed passive film on 304 stainless steel. Electrochimica Acta 2011, 56, 8727–8733. [Google Scholar] [CrossRef]
- Guo, L.; Mi, N.; Mohammed-Ali, H.; Ghahari, M.; Du Plessis, A.; Cook, A.; Street, S.; Reinhard, C.; Atwood, R.C.; Rayment, T.; et al. Effect of Mixed Salts on Atmospheric Corrosion of 304 Stainless Steel. J. Electrochem. Soc. 2019, 166, C3010–C3014. [Google Scholar] [CrossRef]
- Prošek, T.; Iversen, A.; Taxen, C.; Thierry, D. Low-Temperature Stress Corrosion Cracking of Stainless Steels in the Atmosphere in the Presence of Chloride Deposits. Corrosion 2009, 65, 105–117. [Google Scholar] [CrossRef]
- Ghahari, M.; Krouse, D.; Laycock, N.; Rayment, T.; Padovani, C.; Stampanoni, M.; Marone, F.; Mokso, R.; Davenport, A.J. Synchrotron X-ray radiography studies of pitting corrosion of stainless steel: Extraction of pit propagation parameters. Corros. Sci. 2015, 100, 23–35. [Google Scholar] [CrossRef] [Green Version]
Figure 1.
Residual stresses measured in the full-scale mock-up canister test [2]: (a) longitudinal direction in the centerline and (b) circumferential direction in the HAZ.
Figure 1.
Residual stresses measured in the full-scale mock-up canister test [2]: (a) longitudinal direction in the centerline and (b) circumferential direction in the HAZ.

Figure 2.
Dimensions of the notched bar specimen with three different notches.
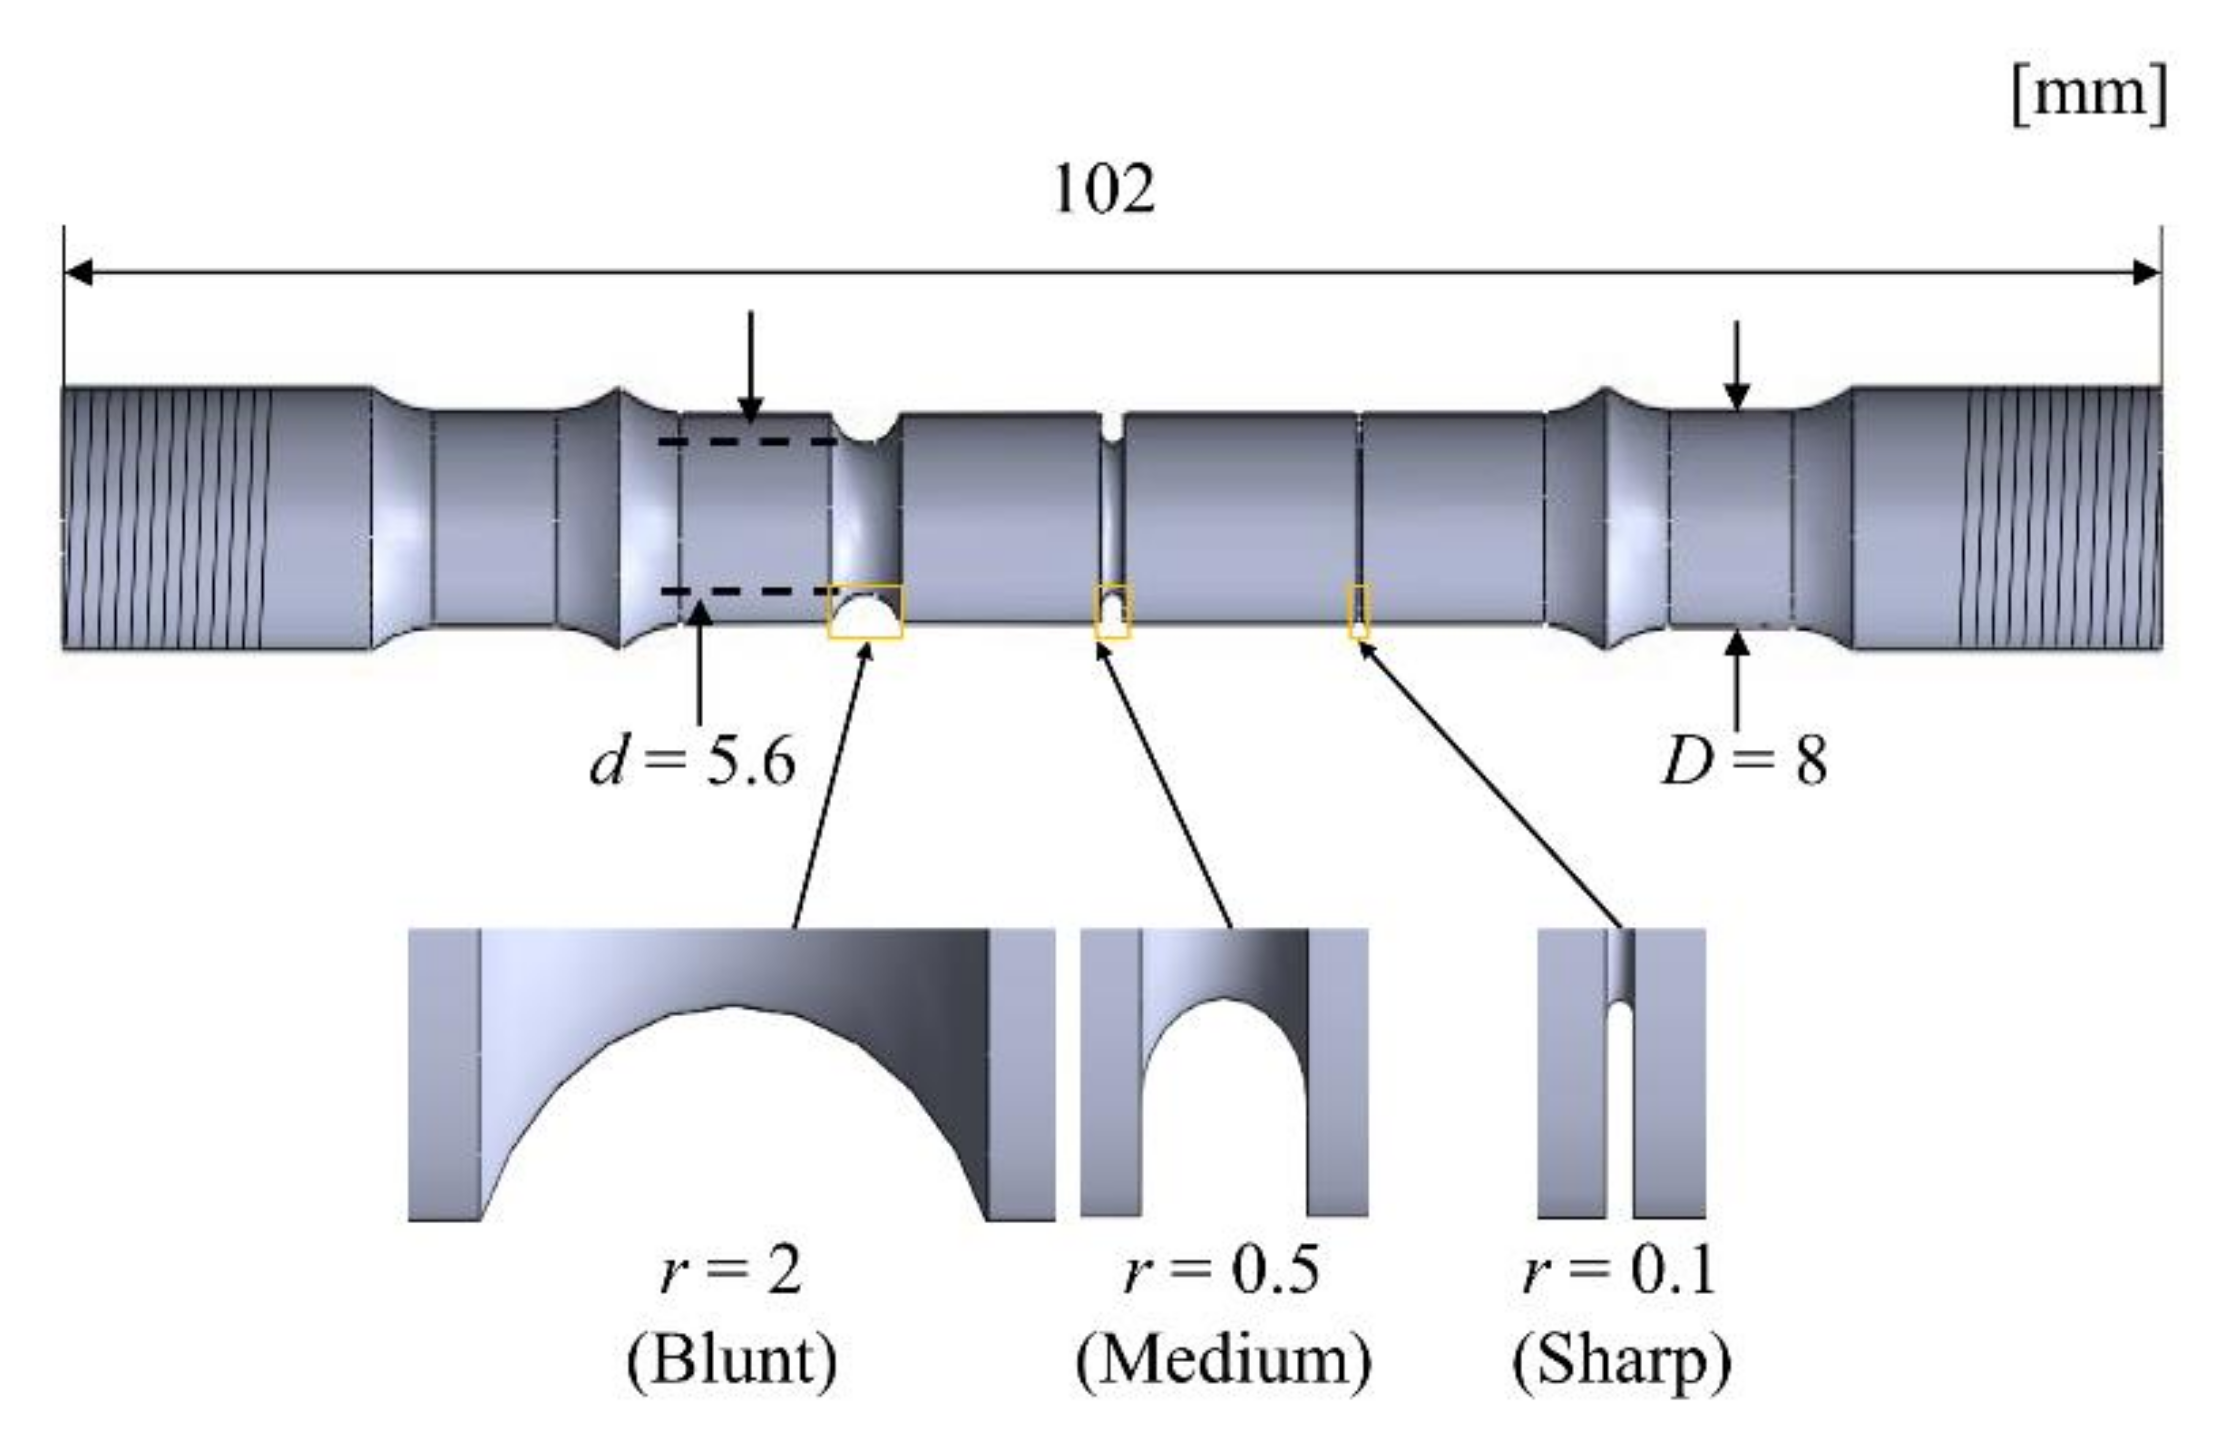
Figure 3.
Schematic illustration (left) and photograph (right) of the notched bar tensile test apparatus.
Figure 3.
Schematic illustration (left) and photograph (right) of the notched bar tensile test apparatus.
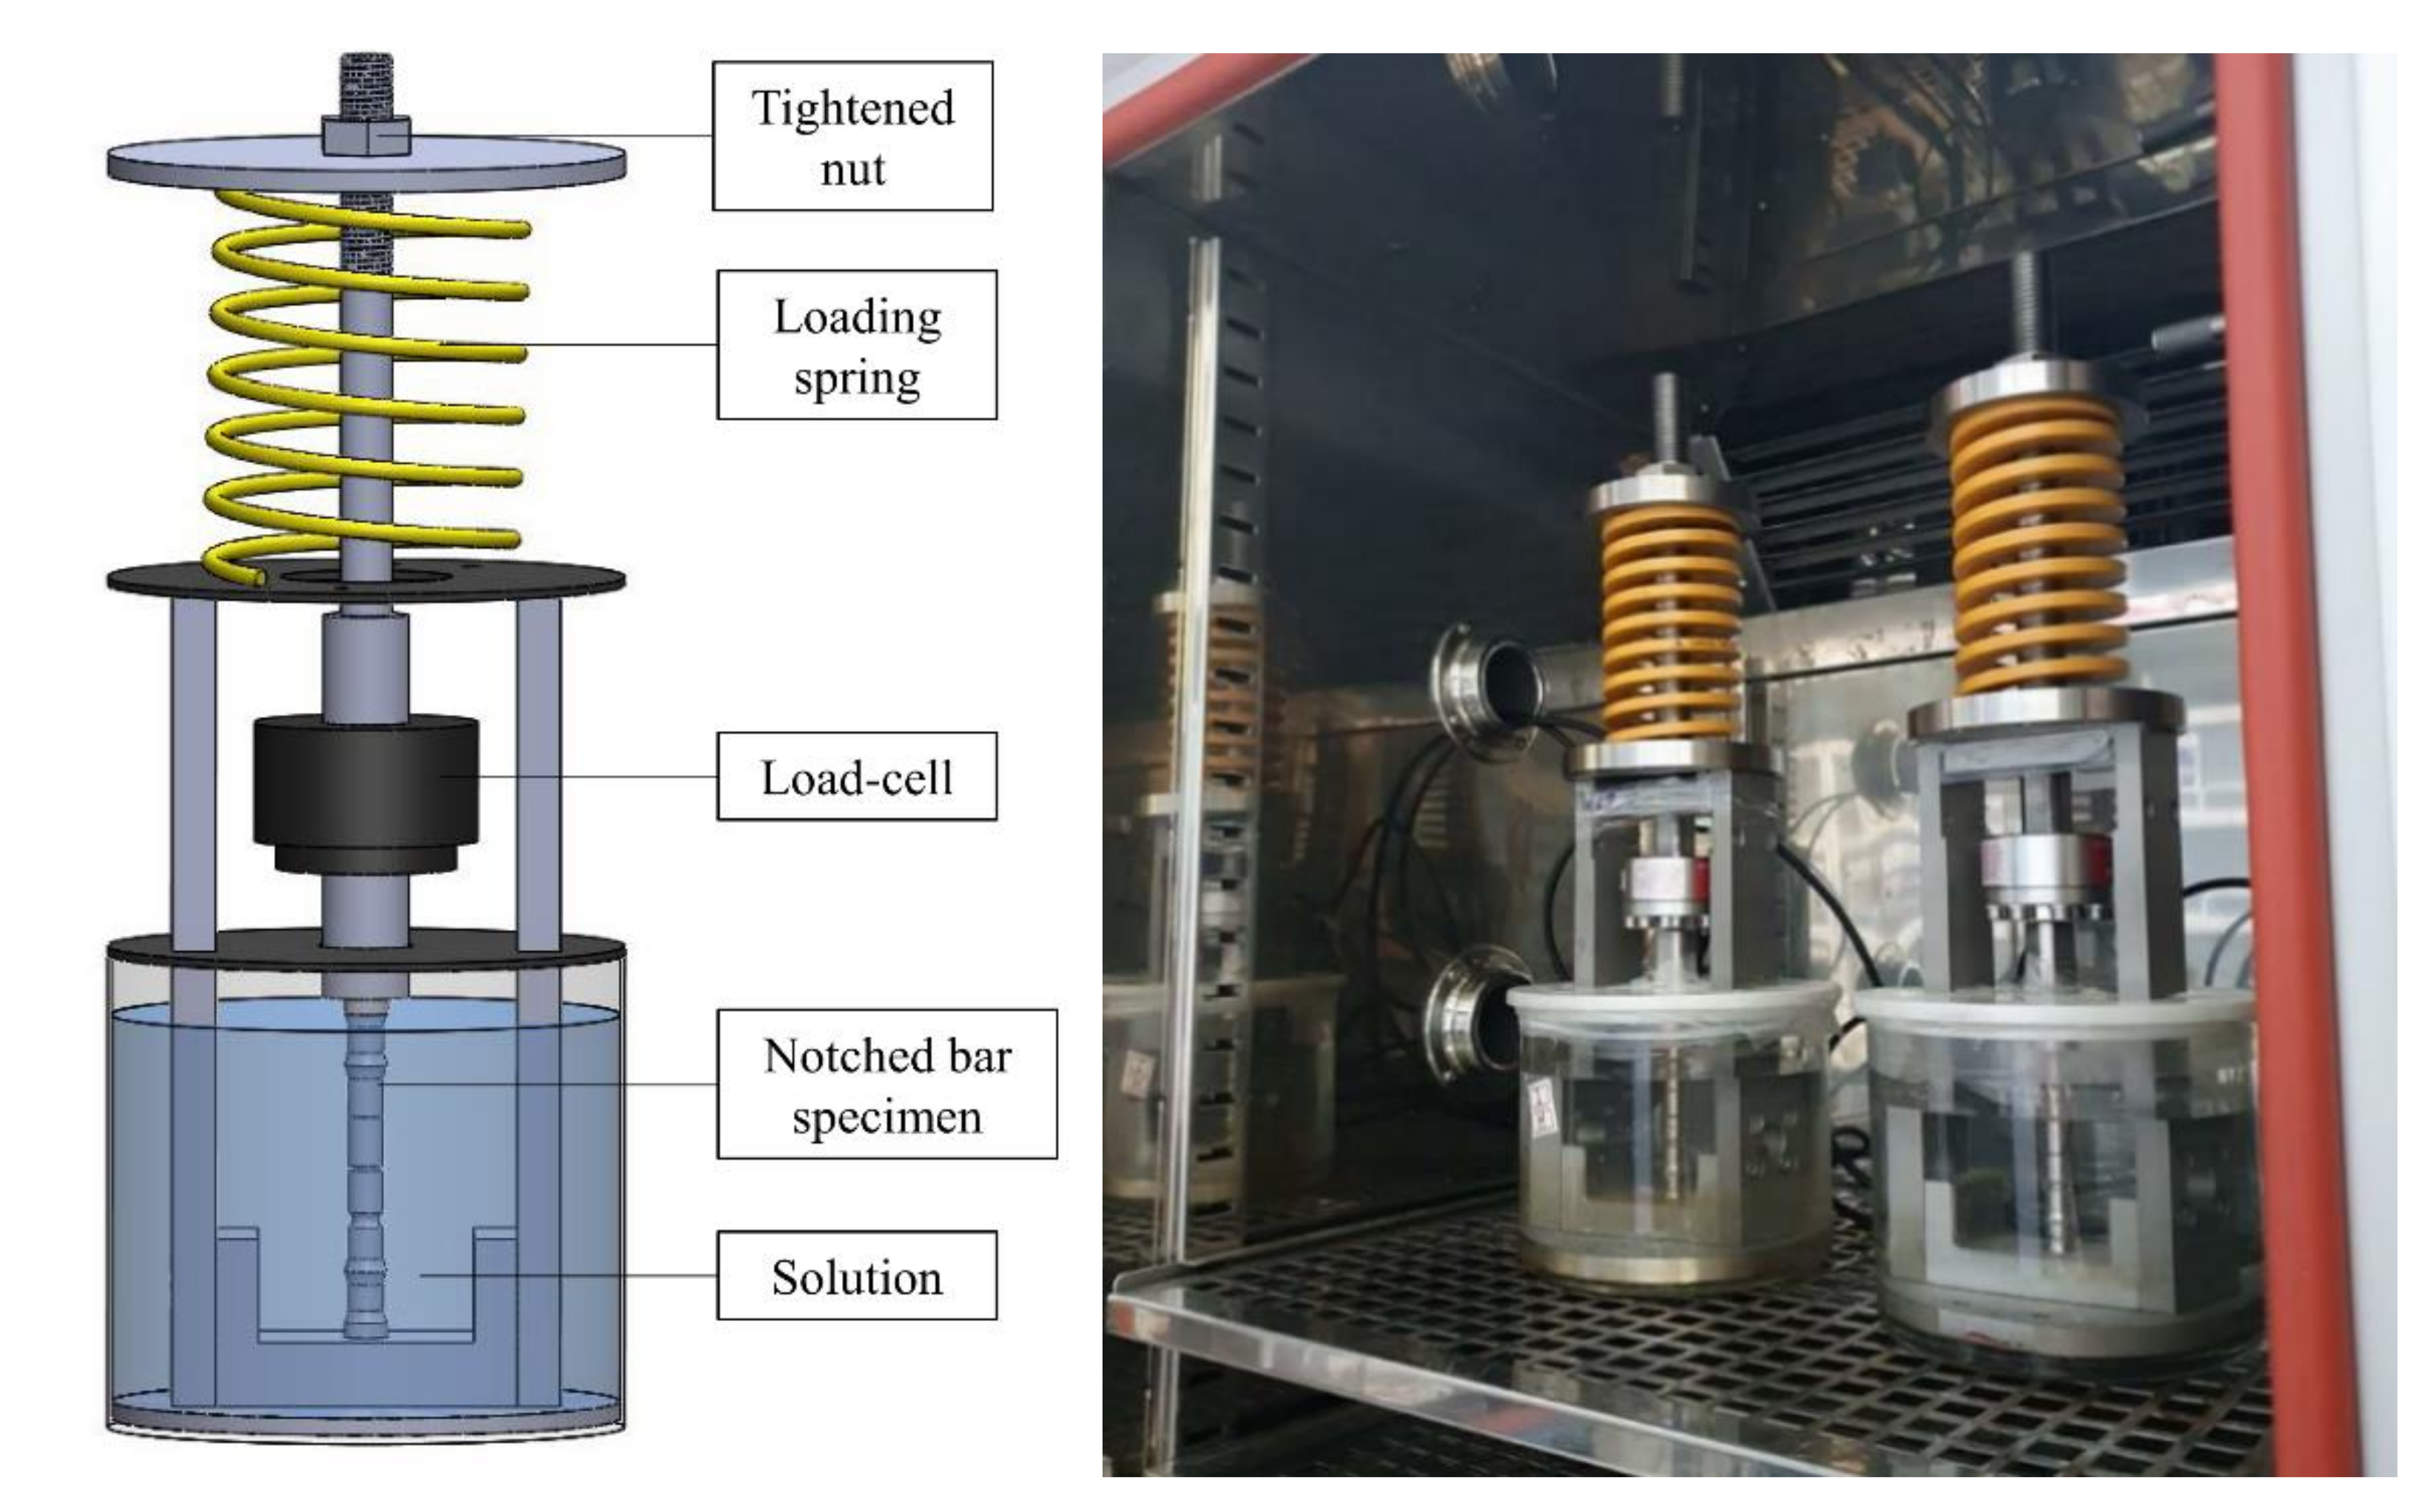
Figure 4.
Analysis of the corrosive surface using OM. (a) Captured surface by rotating the notched bar specimen and (b) sectioning line at the most corroded region.
Figure 4.
Analysis of the corrosive surface using OM. (a) Captured surface by rotating the notched bar specimen and (b) sectioning line at the most corroded region.
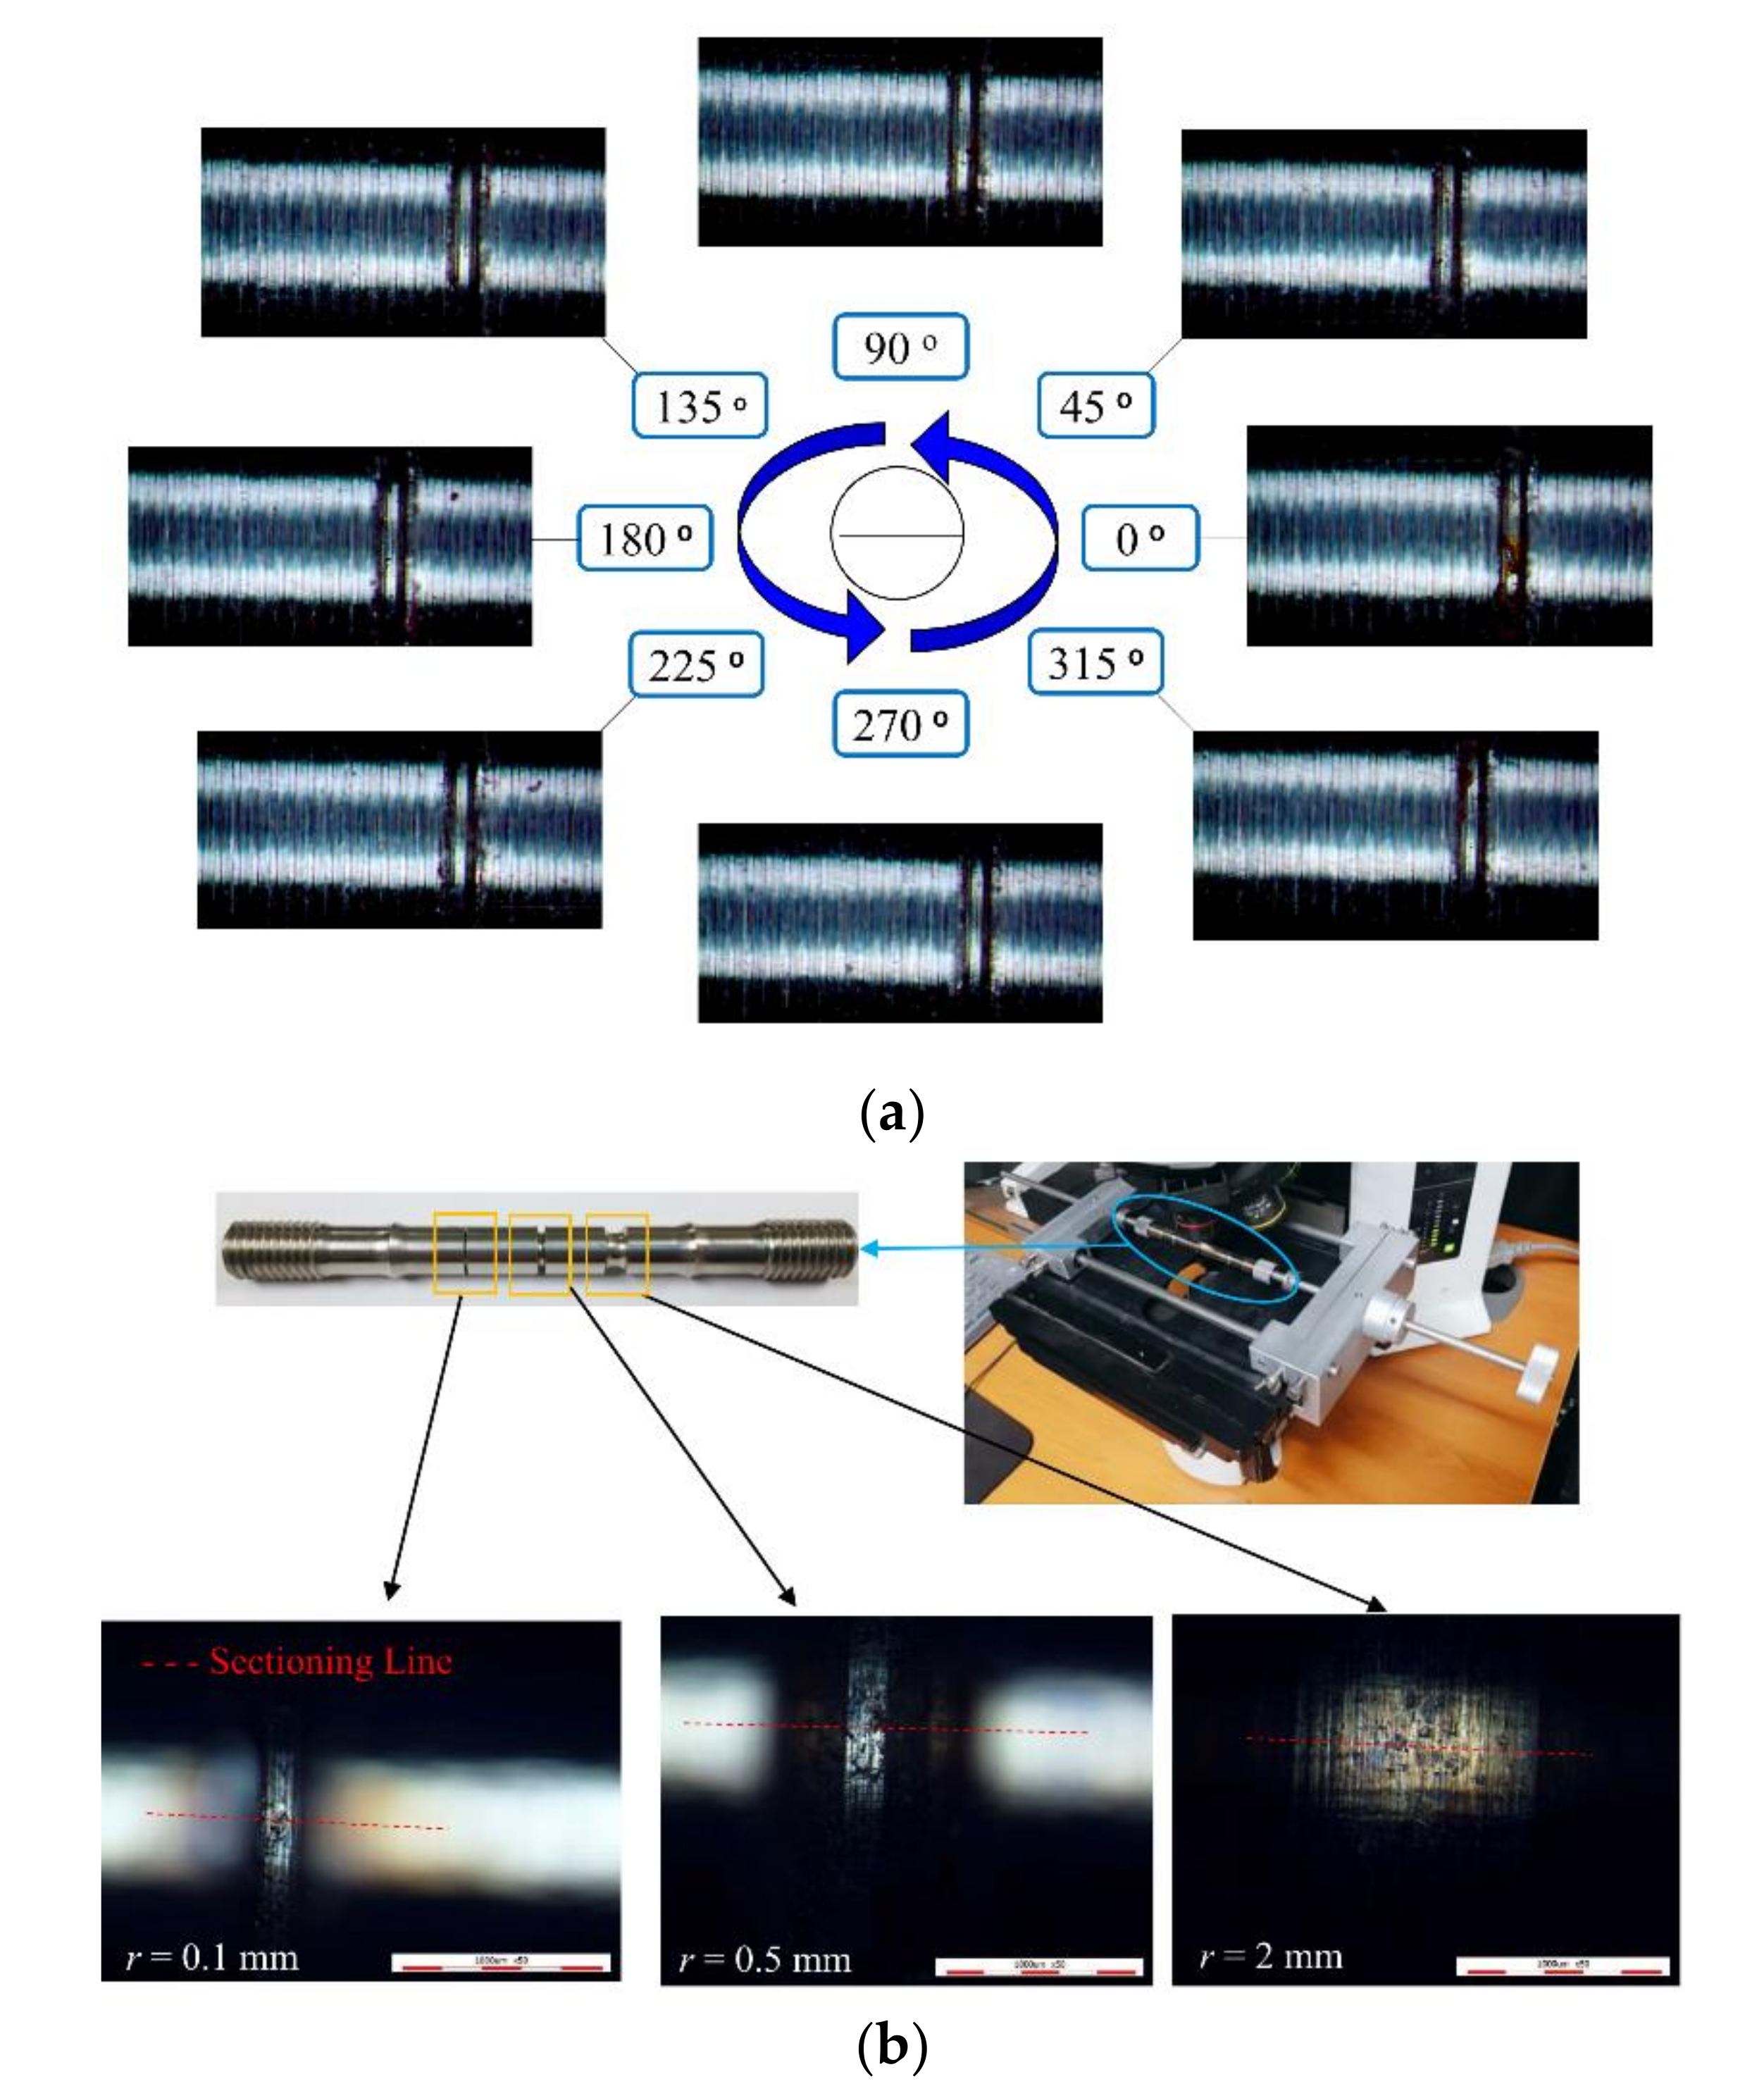
Figure 5.
Captured SEM images; images of 1st row correspond to specimen 1 (135 h), images of 2nd row correspond to specimen 2 (432 h), and images of 3rd row correspond to specimen 3 (708 h).
Figure 5.
Captured SEM images; images of 1st row correspond to specimen 1 (135 h), images of 2nd row correspond to specimen 2 (432 h), and images of 3rd row correspond to specimen 3 (708 h).
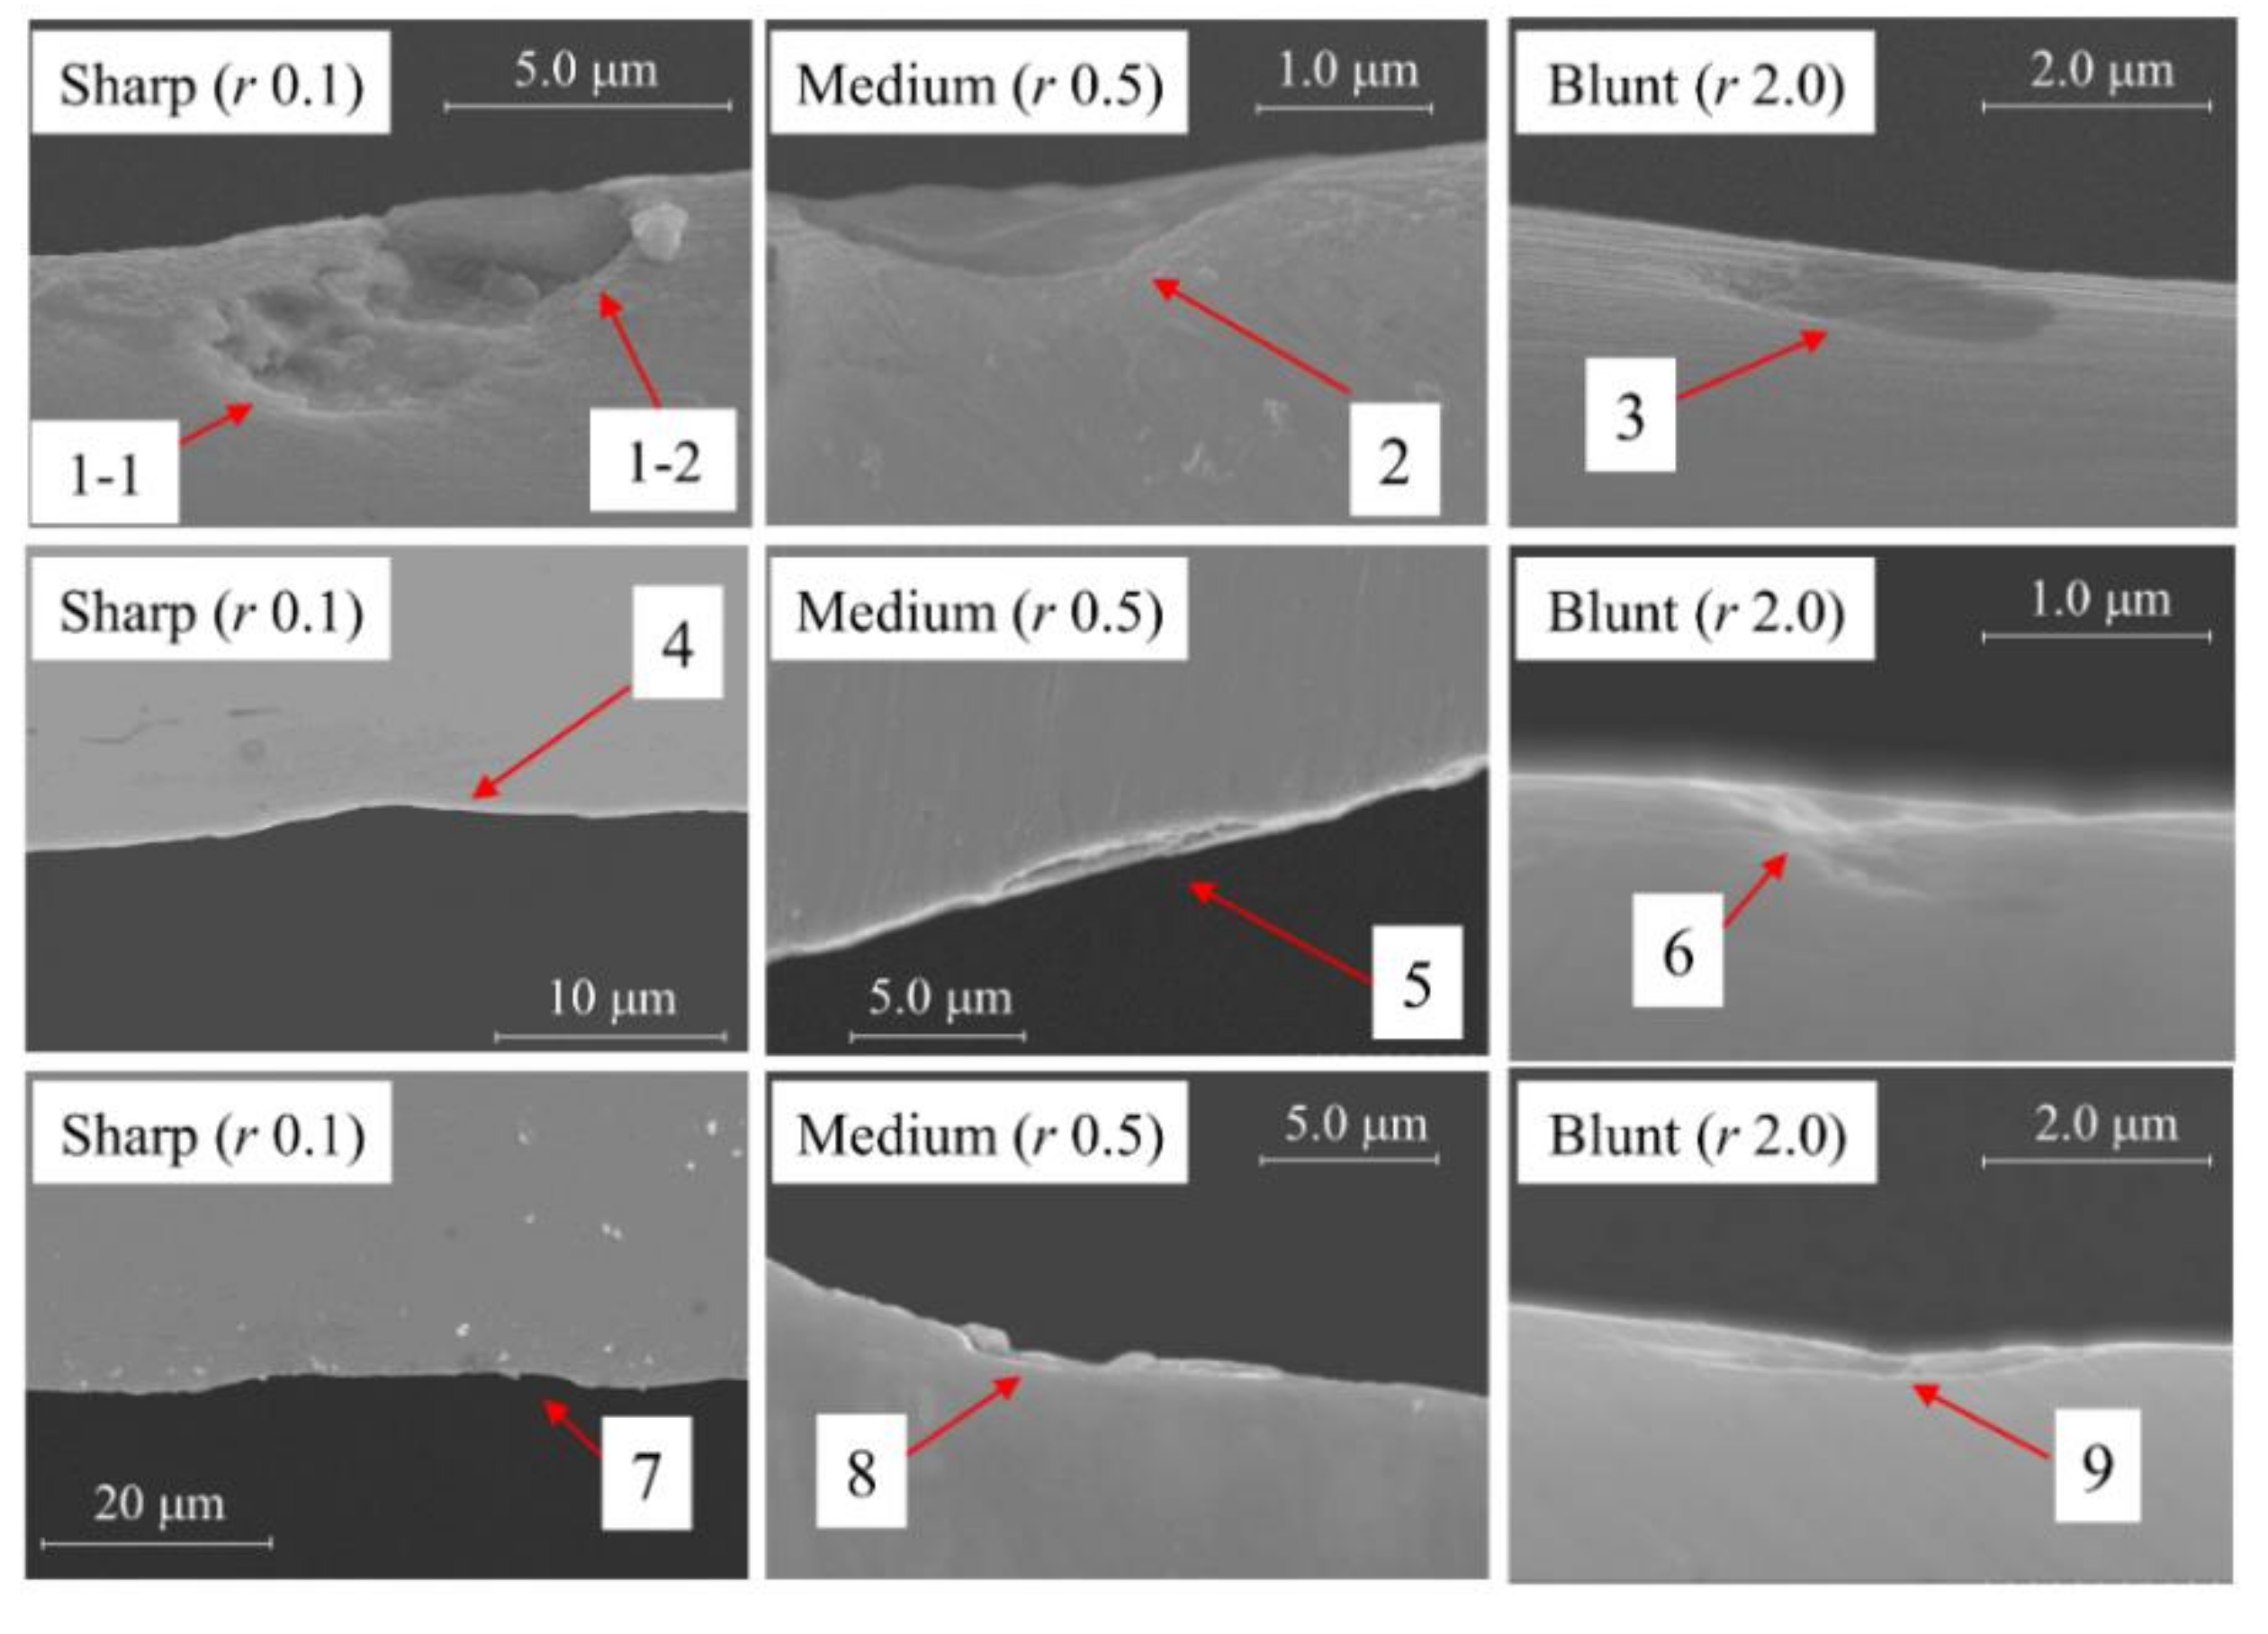
Figure 6.
Schematic illustration of pit dimensions.
Figure 7.
FE model to calculate the maximum principal stress in the local pit, σpit.

Figure 8.
Changes in the calculated corrosion rates (in Table 3) with respect to (a) the maximum principal pit stress and (b) the exposed time. The figures are shown in the log-log scale.
Figure 8.
Changes in the calculated corrosion rates (in Table 3) with respect to (a) the maximum principal pit stress and (b) the exposed time. The figures are shown in the log-log scale.
Figure 9.
Comparison of the corrosion depth and the exposure time for various materials under marine environments [21,22]. The figure is shown in the log-log scale.
Figure 10.
Schematic illustration of the pit growth process: (a) formation of the passive film [23] and (b) corrosion pit generation by film breakdown and metal dissolution [12,24,25].
Figure 11.
SEM images of notch surface regions after the test and the EDS detecting region (orange box) (a) blunt notch (r = 2.0 mm), (b) medium notch (r = 0.5 mm), and (c) sharp notch (r = 0.1 mm).
Figure 11.
SEM images of notch surface regions after the test and the EDS detecting region (orange box) (a) blunt notch (r = 2.0 mm), (b) medium notch (r = 0.5 mm), and (c) sharp notch (r = 0.1 mm).

Figure 12.
EDS analysis for (a) the blunt notch (r = 2.0 mm) and (b) the sharp notch (r = 0.1 mm).
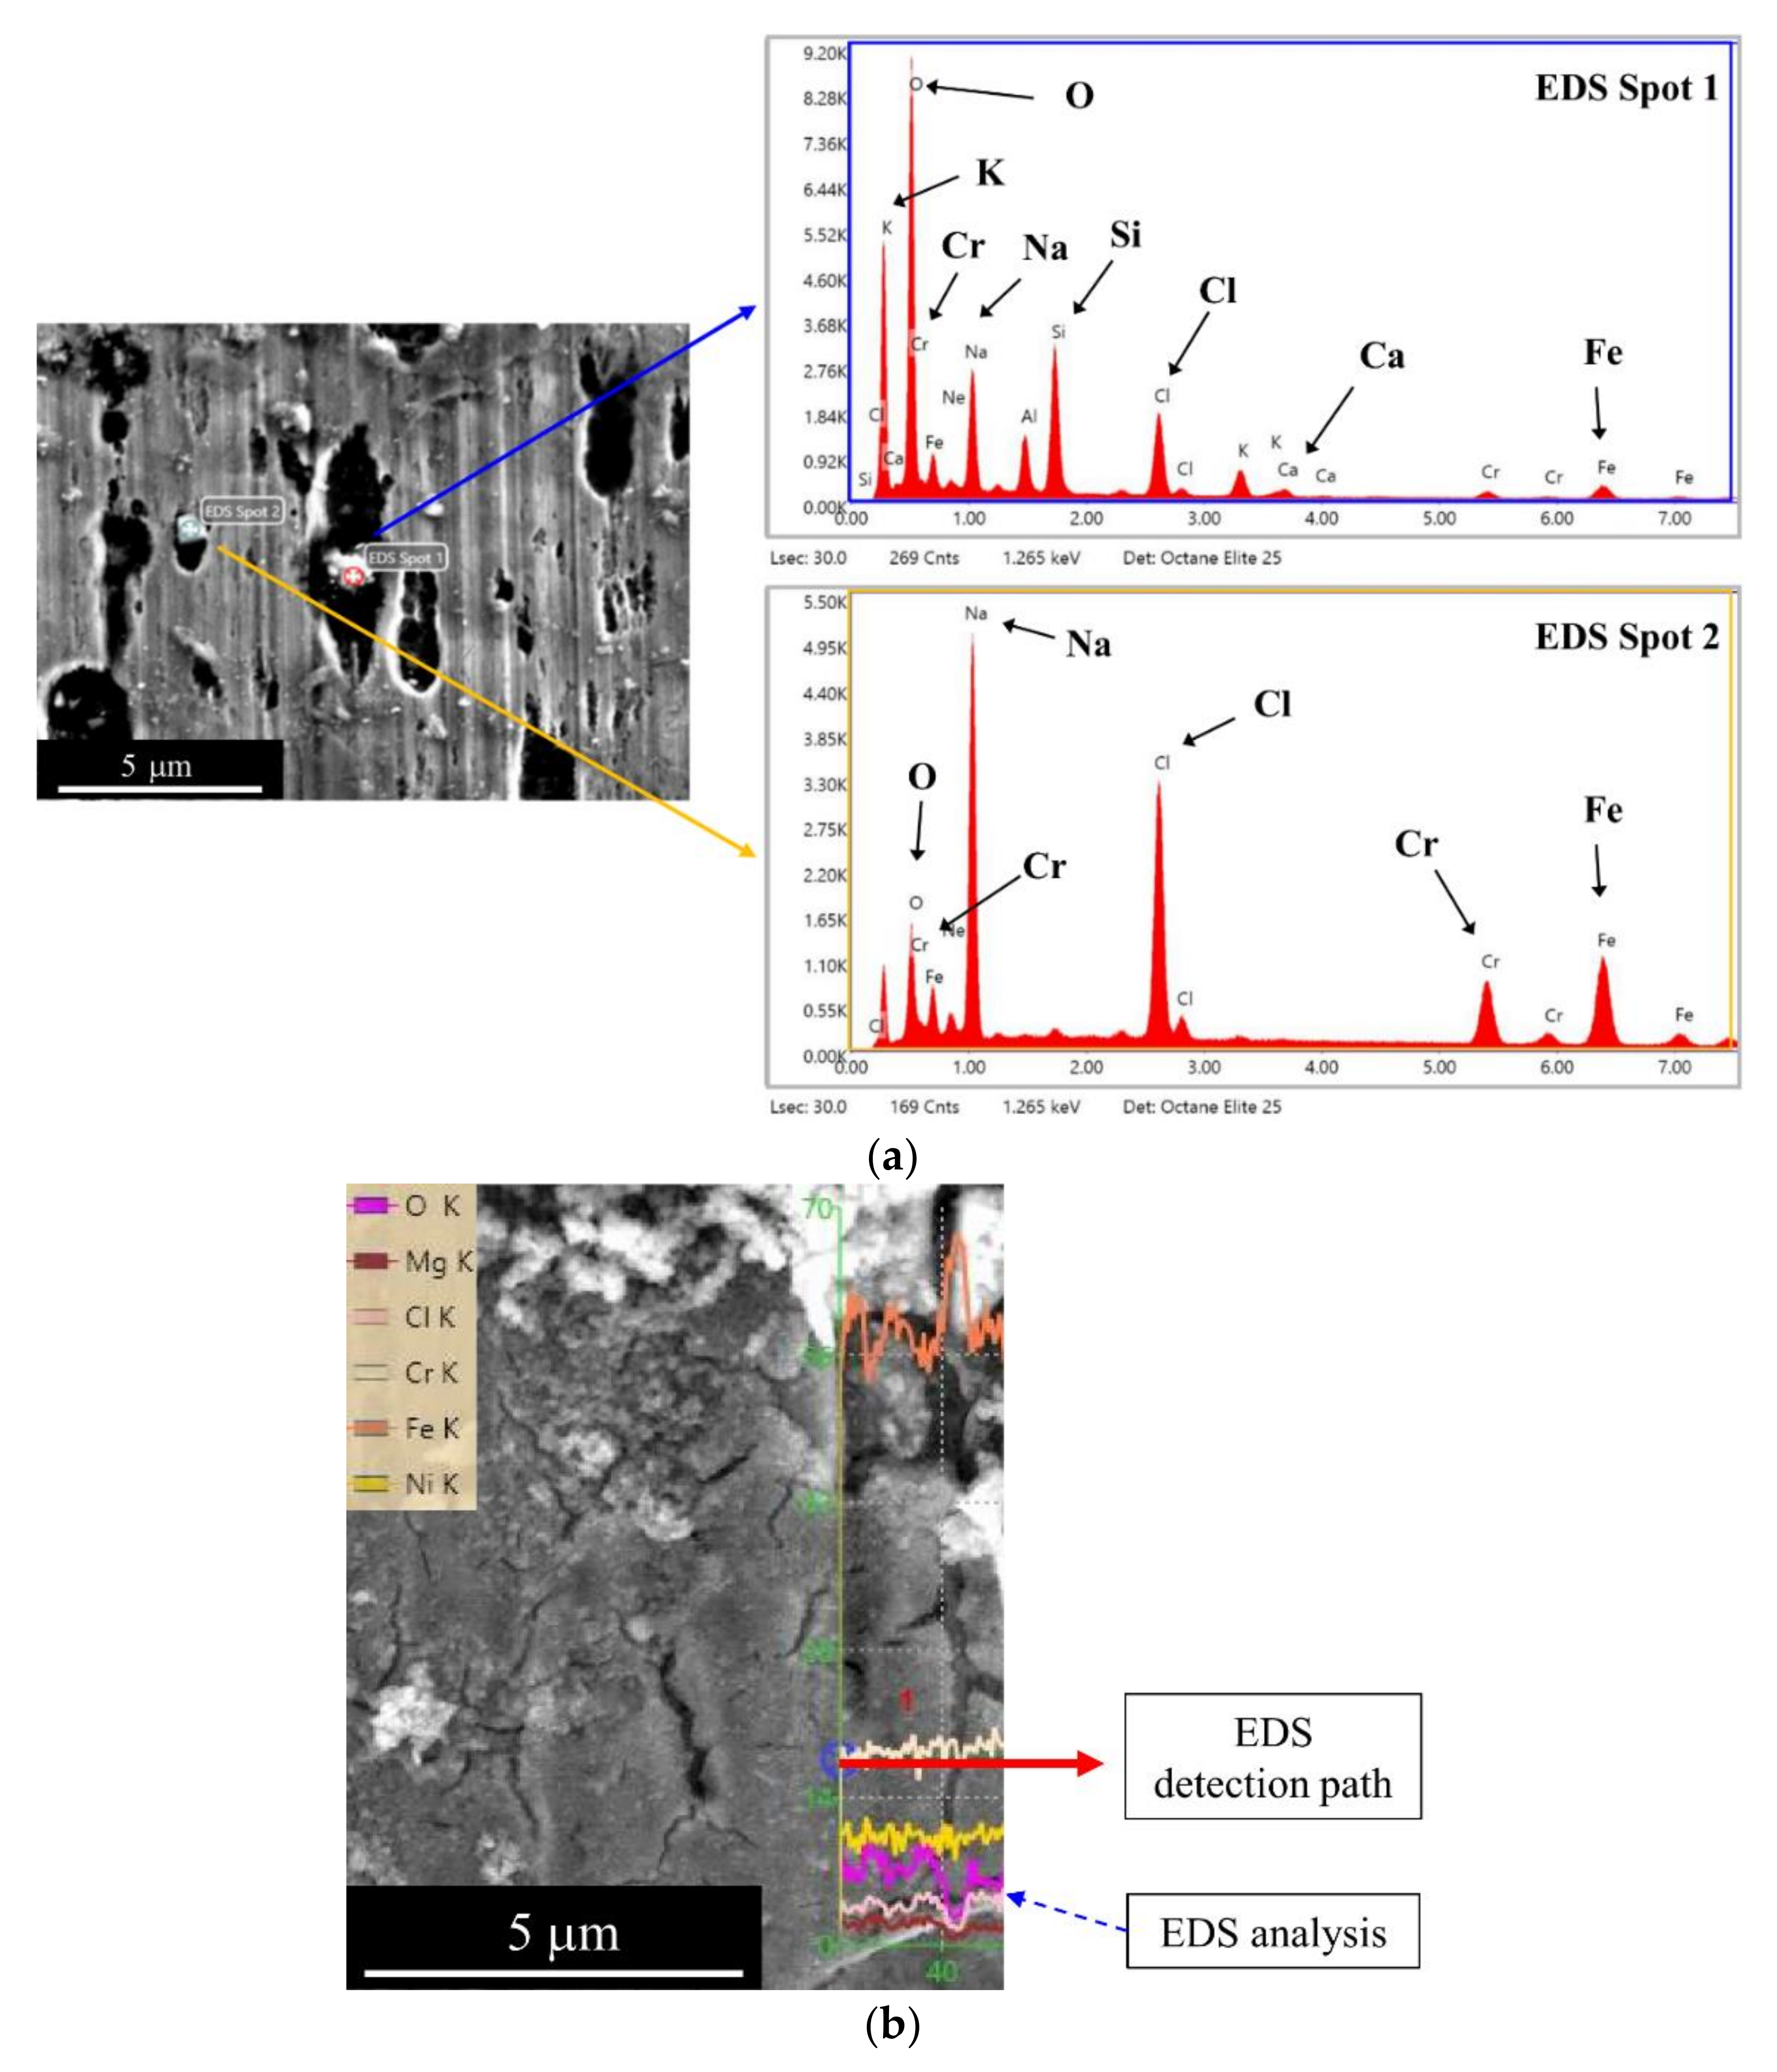
Figure 13.
Analysis results of the aspect ratio effect on the stress in corrosion pits: (a) aspect ratio of observed corrosion pits, (b) FE analysis model for different aspect ratios (0.12–0.96), and (c) the effect of the aspect ratio on the stress concentration factor from FE analysis.
Figure 13.
Analysis results of the aspect ratio effect on the stress in corrosion pits: (a) aspect ratio of observed corrosion pits, (b) FE analysis model for different aspect ratios (0.12–0.96), and (c) the effect of the aspect ratio on the stress concentration factor from FE analysis.

| Chemical Composition | C | Si | Mn | P | S | Ni | Cr |
|---|---|---|---|---|---|---|---|
| Portion [%] | 0.05 | 0.62 | 1.01 | 0.029 | 0.004 | 8.07 | 18.22 |
Table 2.
Test conditions of three specimens (specimen 1, 2, and 3) and the maximum stress in the notch (σnotch).
Table 2.
Test conditions of three specimens (specimen 1, 2, and 3) and the maximum stress in the notch (σnotch).
| Specimen Number | Notch Number | r 1 [mm] | Load [N] | σnet 2 [MPa] | Ktn 3 | σnotch 4 [Mpa] | Test Period [Hour] |
|---|---|---|---|---|---|---|---|
| 1 | 1 | 0.1 | 1443.1 | 58.6 | 5.4 | 316.4 | 135 |
| 2 | 0.5 | 2.6 | 152.3 | ||||
| 3 | 2.0 | 1.6 | 93.7 | ||||
| 2 | 4 | 0.1 | 1456.2 | 59.1 | 5.4 | 319.3 | 432 |
| 5 | 0.5 | 2.6 | 153.7 | ||||
| 6 | 2.0 | 1.6 | 94.6 | ||||
| 3 | 7 | 0.1 | 1531.5 | 62.2 | 5.4 | 335.8 | 708 |
| 8 | 0.5 | 2.6 | 161.7 | ||||
| 9 | 2.0 | 1.6 | 99.5 |
1 r: notch radius; 2 σnet: nominal stress in the notched bar specimen; 3 Ktn: stress concentration factor; 4 σnotch: maximum stress in the notch.
Table 3.
Pit dimensions (depth a and width 2c) and pit growth rates (calculated as da/dt). Note that values of σnotch are given in Table 2.
Table 3.
Pit dimensions (depth a and width 2c) and pit growth rates (calculated as da/dt). Note that values of σnotch are given in Table 2.
| Specimen Number | Pit Number | a 1 [μm] | 2c 2 [μm] | a/2c | da/dt 3 [μm/Year] | σpit 4 [MPa] | σpit/σnotch |
|---|---|---|---|---|---|---|---|
| 1 | 1-1 | 0.99 | 5.58 | 0.18 | 64.11 | 477.8 | 1.51 |
| 1-2 | 1.05 | 4.44 | 0.24 | 68.00 | 518.4 | 1.64 | |
| 2 | 0.43 | 2.69 | 0.16 | 27.97 | 216.6 | 1.42 | |
| 3 | 0.17 | 3.09 | 0.06 | 11.23 | 112.0 | 1.20 | |
| 2 | 4 | 1.04 | 15.6 | 0.07 | 21.09 | 396.8 | 1.24 |
| 5 | 0.74 | 7.83 | 0.09 | 14.90 | 199.0 | 1.29 | |
| 6 | 0.17 | 1.49 | 0.06 | 3.386 | 114.9 | 1.21 | |
| 3 | 7 | 1.51 | 33.8 | 0.04 | 18.66 | 435.1 | 1.30 |
| 8 | 0.78 | 9.63 | 0.12 | 9.626 | 223.0 | 1.38 | |
| 9 | 0.33 | 4.48 | 0.09 | 4.083 | 128.8 | 1.29 |
1 a: depth of the corrosion pit; 2 2c: width of the corrosion pit; 3 da/dt: pit growth rate; 4 σpit: maximum principal stress in the corrosion pit, calculated from elastic FE analysis.
Publisher’s Note: MDPI stays neutral with regard to jurisdictional claims in published maps and institutional affiliations. |
© 2021 by the authors. Licensee MDPI, Basel, Switzerland. This article is an open access article distributed under the terms and conditions of the Creative Commons Attribution (CC BY) license (https://creativecommons.org/licenses/by/4.0/).
Share and Cite
MDPI and ACS Style
Jeong, J.-Y.; Jeong, C.; Kim, Y.-J.; Jang, C. Effect of Stress Magnitude on Pit Growth Rate of 304 Austenitic Stainless Steel in Chloride Environments. Metals 2021, 11, 1415. https://doi.org/10.3390/met11091415
AMA Style
Jeong J-Y, Jeong C, Kim Y-J, Jang C. Effect of Stress Magnitude on Pit Growth Rate of 304 Austenitic Stainless Steel in Chloride Environments. Metals. 2021; 11(9):1415. https://doi.org/10.3390/met11091415
Chicago/Turabian StyleJeong, Jae-Yoon, Chaewon Jeong, Yun-Jae Kim, and Changheui Jang. 2021. "Effect of Stress Magnitude on Pit Growth Rate of 304 Austenitic Stainless Steel in Chloride Environments" Metals 11, no. 9: 1415. https://doi.org/10.3390/met11091415
Note that from the first issue of 2016, this journal uses article numbers instead of page numbers. See further details here.