
Passive ESG Portfolio Management—The Benchmark Strategy for Socially Responsible Investors


1
Department of Finance, Accounting and Statistics, WU (Vienna University of Economics and Business), Welthandelsplatz 1, 1020 Vienna, Austria
2
Department of International Management, MU (Modul University Vienna), Am Kahlenberg 1, 1190 Vienna, Austria
*
Author to whom correspondence should be addressed.
Sustainability 2021, 13(16), 9388; https://doi.org/10.3390/su13169388
Submission received: 2 June 2021
/
Revised: 30 July 2021
/
Accepted: 17 August 2021
/
Published: 21 August 2021
Abstract
:In this article, we investigate the notion of doing well while doing good from the perspective of passive portfolio strategies. We analyze a number of asset allocation strategies based on ESG-weighting and compare their financial and ESG performance for the US and Europe. We find no significant difference in the financial performance but superior ESG performance of ESG-based strategies. It can be concluded that, compared to a naive strategy, socially responsible investors are willing to pay a small premium for the impact of the portfolio via transaction costs when rebalancing the portfolio according to their preferences for social responsibility. In addition, when comparing the ESG-based strategies to a value-weighted strategy, we observe no significant difference in ESG performance but a high degree of significance in the superior financial performance of the ESG-based strategy. We also analyze the strategies with regards to the factor loadings given by the Fama–French five-factor model and a sixth factor denoted GMB (Good minus Bad) and find significant differences across the regions and strategies. Overall, the results show strong support of ESG-based strategies being preferred by socially responsible investors but also suggest that such strategies might be preferred by conventional investors looking for a passively managed alternative compared to a value-weighted index. Furthermore, it seems that such a strategy might be a more adequate benchmark for active SRI funds.
Keywords:
sustainable finance; portfolio management; fund management; social finance; asset management; asset pricing; factor analysis; socially responsible investingJEL Classification:
G11; G12; G151. Introduction
For many decades firms have been operating with a traditional economic viewpoint, which advocates the control of firms by profit-maximizing shareholders in pursuit of self-interest and efficiency. The “Invisible hand of the market" described by Adam Smith in 1759, operating under conditions of relatively free and competitive markets within minimal public policy, has proven successful in generating superior economic performance. see [1].
Nevertheless, over the years, voices assigning the role of social responsibility to firms have become louder and an increasing number of firms have been adopting policies aimed at managing their environmental, social and governance impact (ESG), while investors have also started to incorporate social responsibility criteria into their investment decisions. This development is documented by the strong increase in the investment volume of socially responsible investments (SRI). In 2018, the funds allocated to socially repsonsible investment strategies represented more than USD 12 trillion in assets under management (AUM) in the US and EUR 11 trillion in Europe [2,3]. These strategies include all types of investments in which non-financial variables related to socially responsible investing are taken into consideration for asset management decisions [4]. While such strategies have become more popular in recent years, their beginnings can be traced back several hundred years when religious ethical beliefs were taken into consideration when making investment decisions [5].
Socially responsible investors derive utility not only from the financial outcome but also the societal impact of their investments. These preferences regarding return, risk and social responsibility can be realized in several ways, and a number of multi-criteria portfolio optimization models have been introduced over the years to fill this gap. (An overview is provided in Section 2.) However, the vast majority of AUM invested in SRI strategies and funds are based on an asset selection of socially responsible investments via positive or negative screenings of stocks by industry or topic. Industry- and topic-based screenings imply the exclusion/inclusion of stocks from certain industries and stocks operating within a certain topic of social responsibility. More recently, ESG integration has become more relevant for constructing SRI strategies due to the rise of ESG rating providers and the widespread availability of ESG scores (see, e.g., [3]). However, in this approach, the ESG information is also typically only used for stock screening based on a certain threshold value. Overall, these traditional screening-based strategies raise a number of concerns.
Excluding certain industries or topics does not necessarily avoid including socially low performing stocks in the portfolio. This can be resolved by screening according to a chosen social responsibility measure. However, the threshold value of this mesaure is often chosen in an arbitrary way or as a function of the asset universe rather than the investor’s preference due to diversification considerations. Moreover, the asset allocation follows mostly conventional strategies only focusing on financial performance after the initial asset selection has been made.
In line with the increased interest from the practitioners’ side, a great number of studies have been carried out investigating the relationship between social responsibility and firm performance with mixed results slightly favoring a positive relationship.The most relevant studies will be presented in Section 2. An extensive overview of SRI investments dealing with 85 studies and 150 experiments was performed by Revelli and Viviani [6]. A second interesting overview is provided by Von Wallis and Klein [7]. Studies focusing on the comparison between socially responsible and conventional investments have attracted a lot of attention but ultimately do not lead to a common conclusion among the researchers or institutions as their findings seem to depend on the reference market, the time period, the asset-management strategy, the aggregation of ESG scores or other factors.
This ambiguous evidence forms the starting point for our analysis. In this study, we propose a simple asset allocation strategy using a portfolio weighting based on ESG scores as social responsibility measure in which the socially responsible investors’ preference can be directly expressed instead of, or in addition to, screening activities. In order to avoid inconsistencies and follow a systematic approach when investigating this topic, we base our study design on the most important regions, Europe and the US, with a very large sample determined by the most important equities in their respective regions. For both regions, we cover a long observation period starting from 2005 when ESG data started to become widely available. We specifically focus on passive strategies in order to avoid potential biases from fund manager skill and compare our strategies with common passive portfolio strategies, such as value-weighted and naive asset allocations as benchmarks.
As a first step, we analyze the general relationship between ESG score, risk, returns and firm size. As a second step, we construct portfolios using a number of passive asset allocation strategies, such as a naive, value-weighted or ESG-weighted allocation. For the latter, we refer to the ESG data provided by ASSET4 and Thomson Reuters Refinitiv for robustness checks. Finally, we explain the portfolio results using the Fama–French five-factor model and include an additional risk factor called GMB, which is defined as the difference in returns of good minus bad ESG stocks.
The comparative analysis of the asset allocation strategies shows that an ESG-based weighting strategy seems to perform on par with a naive asset allocation in terms of financial performance while providing a superior social performance. This suggests that achieving a significantly higher social performance might come at a small premium, which seems to be purely related to the cost of rebalancing the ESG-based portfolio with turnover rates being very low. The advantage compared to the value-weighted strategy seems to be more pronounced, as a higher financial performance and similar or higher social performance can be achieved depending on the rating regime used. The regression results show significant factor loadings for the Fama–French five-factor model and the GMB factor. While these loadings are not consistent across regions, similarities can be found throughout all strategies within their respective regions.
Overall, our results suggest that such ESG-based strategies might not only be viable options for socially responsible investors but also for conventional investors looking for a passively managed alternative compared to a value-weighted index while generating a possibly higher social impact at the same time.
The remainder of this paper is structured as follows. Section 2 discusses the relevant literature. Section 3 introduces the ESG-based asset allocation strategies and the regression model, while Section 4 presents the data set and provides some descriptive statistics. Section 5 contains the results of the strategies and regression analysis, and Section 6 concludes.
2. Literature
To begin, we will provide a short overview of the relevant SRI-related studies, focusing on multi-criteria portfolio optimization models from an active portfolio management perspective. These studies address the problem of how socially responsible investors can optimize their individual preferences for risk, return and social responsibility in order to overcome any trade offs between these potentially conflicting preferences. Then, we will discuss the main literature investigating the general question of the performance of SRI and its relation to conventional investments.
Bilbao-Terol et al. [8], for example, introduce a goal-programming model for an SRI portfolio that aims to enable investors to match their ethical and financial preferences. Using UK mutual funds, they demonstrate that investors’ risk attitudes tend to influence the loss of return as a result of choosing SRIs. Ballestero et al. [5] and Bilbao-Terol et al. [9] also focus on SRIs and propose different models as ways to incorporate investor preferences into the portfolio-optimization process. They find that ethical investments are accompanied by an increase in risk exposure, while the results of Bilbao-Terol et al. [9] suggest that the potential tradeoffs are relatively minor for highly risk-averse investors. Hirschberger et al. [10] develop a multiparametric algorithm for the computation of the non-dominated set of portfolios in a tri-criterion optimization. Gasser et al. [11] propose a Markowitz model modification to set up a three-dimensional capital allocation plane that illustrates the complete set of feasible optimal portfolios on the basis of return, risk and social responsibility.
In this study, we extend the literature on SRI portfolio management by investigating passively managed strategies for socially responsible investors specifically, which can be executed with no expectations or expert knowledge required. This also allows an unbiased analysis of the relationship between social responsibility and financial performance at the fund level, as these passive strategies are not affected by management skills or fees.
A large number of studies are dedicated to investigating the differences between conventional and SRI investments with ambiguous results. This literature is presented below sorted by the evidence on the over, under or equal performance of conventional and social investment portfolios.
2.1. No Difference between Conventional and Social Investment Financial
Early evidence dealing with the question of how socially responsible investments compare to their conventional counterparts is given, for example, by Luther et al. [12], who refer to British ethical funds, or Hamilton et al. [13], who investigate US funds by examining Jensen’s alpha. White [14] also follows a similar approach, focusing on German and US funds by regressing fund performance against their respective market index. Other studies comparing conventional and social funds also include transaction costs, for example, in Mallin et al. [15], Gregory et al. [16], Statman [17], Stone et al. [18] and Kreander et al. [19], which all find no significant difference between the different types of investor. Bauer et al. [20] was the first who aimed to find a general explanation of the differences in performance between SRI and conventional funds. They analyze social funds by referring to a four-factor model and find that the differences in social and conventional investments can be traced back to different asset management strategies. Galema et al. [21] criticize the procedure of controlling risk factors via Fama-French regressions and showed that, in general, SRIs have lower book-to-market ratios such that the regression results may be biased, as alphas do not capture SRI effects appropriately. Schröder [22] aims to overcome the bias of asset management strategies and, thus, focuses on SRI indices and not on investment funds. He concludes that there are similar risk-adjusted returns for SRI stock indices and conventional benchmarks. More recently, Humphrey and Lee [23] and Humphrey and Tan [24] “conclude that a typical socially responsible fund will neither gain nor lose from screening its portfolio”. Junkus and Berry [25] claim that the performance of SRI mutual funds and conventional funds are not significantly different but strongly sensitive towards the model applied, period considered and benchmark used. One thing that all these articles have in common is they do not find a significant difference in the performance of the different types of investments. More recently, Badía et al. [26] find a non-significant overperformance of high ESG firms compared to firms with lower ESG scores within their sample of government bond portfolios from 24 countries over a period ranging from 2006 to 2017. Finally, Folger-Laronde et al. [27] “analyze the differences and relationship between the financial returns of ETFs and their Eco-fund ratings during the COVID-19 pandemic-related financial market crash”. They show that a higher sustainability performance in terms of higher ESG scores do not protect firms from financial losses during a severe market downturn.
2.2. SRI Investments Outperform Conventional Investments
In contrast to these studies, a number of studies also document the outperformance of socially responsible investments. Derwall et al. [28] and Kempf and Osthoff [29] show for their sample, and using SRI screening, a significant outperformance of ethical products, which was also confirmed by Statman and Glushkov [30], who show that shifting a portfolio towards high social responsibility scores is beneficial and even compensates for the possible resulting disadvantage from excluding sin stocks.A good overview of this topic is also given in Derwall et al. [31], who develop a model in order to shed light on the different reasons and economics as well as the persistence of the different results showing the out- or underperformance of one type of investment. Furthermore, El Ghoul et al. [32] conclude that firms with socially responsible practices have higher valuations and lower risk. Rathner [33] show further that funds from Europe show a significant outperformance of their conventional benchmark, whereas this cannot be confirmed for US funds. Capelle-Blancard and Monjon [34] show that the quality and quantity of the screening process may critically affect the fund performance for a sample of French funds.
2.3. Underperformance of SRI Social Investments
In contrast to these findings, Geczy et al. [35] state that investors who allocate their wealth to socially responsible equity mutual funds pay a price and thus receive significantly lower risk-adjusted returns, which is also confirmed for the extreme case of only investing in bad firms, so-called sin stocks such as alcohol, tobacco, etc., by Hong and Kacperczyk [36]. Trinks and Scholtens [37] shed light on different social issues and conclude that a negative screening may have negative financial effects on the portfolio performance.They also provide an excellent discussion on the literature dealing with the screening processes in general. More recently, Riedl and Smeets [38] have argued that for socially responsible investors, the financial reward is not the only goal so that in their sample, the investors accepted lower returns on SRI funds and higher management fees in general, which means that in doing so, they forego financial return in order to realize their preference for social responsibility.
Geczy et al. [35] and Manescu [39] show that the compensation of risk for socially responsible investments depends on their attributes and conclude that only certain attributes linked to environmental, social and governance factors (ESG) might be relevant in terms of value to certain firms and, thus, could lead to mispricing aggregated ESG measures when it comes to risk-adjusted returns.
Maiti [40] clearly shows that ESG is an important risk factor and suggests that investment decisions by socially responsible investors should be based on ESG factors. He shows that “higher Sharpe ratios for environment, social and governance factors indicate that portfolios formed on these factors show better investment performance over traditional size and value-based portfolios”.
With this article, we contribute to the literature in several ways. Our study is the first one to investigate passive strategies for socially responsible investors, which are unaffected by management skill or fees. Furthermore, and in line with Maiti [40], we construct asset allocation strategies based on ESG integration, which go beyond pure stock selection and utilize the full information contained in ESG scores for deriving the portfolio weights. We conduct a comparative analysis of these ESG-based strategies with naive and value-weighted strategies as most common benchmarks. In addition, we investigate the differences between socially responsible investments in the US and Europe systematically. Finally, we compare the performance of all strategies and explain their factor loadings with respect to the well-known Fama–French five-factor model (see [41]) and extend this analysis by introducing an additional risk factor GMB defined as the difference in returns of good minus bad ESG stocks. This allows us to gain further insights into the discussion of return, risk and social responsibility.
3. Methodology
In this section, we describe the asset allocation strategies and outline the performance analysis of the resulting portfolios.
The regional portfolio for the US and Europe has been created based on the asset universe outlined in Section 4. The benchmark strategies are based on a value-weighted and equally-weighted (1/N) asset allocation (see for example DeMiguel et al. [42]).
For the ESG-based strategy, we adopt an ESG-weighting approach in which the asset allocation is based on the ESG scores of the individual assets i, where the sum of the ESG scores in each region represents the total ESG market value at a given time t
The individual portfolio weight is computed as the proportion of the ESG score relative to the total ESG market value and is given by
We also construct an additional ESG-based strategy that promotes the ESG performance of the portfolio even further by applying an exponential function to all ESG scores and re-calculates the portfolio weights of each asset the same way as before.
This exponential ESG-weighting strategy (ESG) further shifts the asset allocation towards assets with a strong ESG performance to express a stronger investor preference for social responsibility. This strategy implicitly represents a combination of screening and ESG-weighting as low ESG stocks receive a very small weight. However, in traditional screening approaches, the asset allocation is usually based on a mean-variance optimization, in which the preferences for social responsibility are neglected after the intial screening has been completed. Such a screening is based on arbitrary, subjective lower thresholds for ESG scores, while in the ESG approach, a stock’s weight still depends on its contribution to the overall ESG performance of the portfolio. The cutoff point is implicitly given by each stock’s ESG performance relative the overall asset universe. While a cutoff is generally also possible in the ESG-weighting strategy depending on the asset universe, it is much more likely for the ESG strategies. This also allows us to investigate potential screening effects on the strategy’s performance due to diversification considerations.A combination of a traditional screening using subjective ESG thresholds and these ESG-weighting approaches is also possible if investors wish to explicitly screen out certain stocks.
The proposed strategies should, on average, provide a significantly higher ESG performance compared to the considered benchmark strategies. While the portfolio results are reported based on daily returns, all portfolios are rebalanced on a monthly basis.
Following Dorfleitner and Utz [43], it is assumed that investors do not consider the change in the level of a firm’s social responsibility (a “socially responsible return”) after they have made their investment decision.As we investigate two different ESG rating regimes in our portfolio analysis, we do not take ESG disagreement into consideration, and we neither challenge the question about the tradeoff between the different ESG scores nor the question whether these visualize the true social, governmental, ethical or environmental behavior of a certain firm. For an explicit consideration of the effect of ESG disagreement on the risk aversion of an investor, see Friedman and Heinle [44], Grant and Satchell [45] or Avramov et al. [46]. This implies that investors do not consider the risk of an ESG score’s deviation from the expectation and derive utility from holding high ESG stocks.This is also in line with Dorfleitner et al. [47] and Basso and Funari [48]. On the one hand, ESG scores remain rather stable over time for most stocks. On the other hand, ESG scores are usually provided as z-Scores, and a firm’s ESG score can only decrease/ increase until a lower/upper bound is reached. This suggests that the change in ESG score is not an ideal measure for portfolio management decisions. However, while the asset allocation is based on the level of a firm’s ESG score, our ESG-based strategies certainly acknowledge a change in the ESG score when rebalancing the portfolios.Please see Section 5.1 for a discussion on the topic of backfilling bias.
To investigate the portfolios’ performance, we examine the daily returns and standard deviation, as well as the Sharpe ratio and portfolio ESG scores. We then examine the effect of transaction costs by computing the turnover rates for all strategies.
To analyze the daily returns of the implemented portfolio strategies further, we use the well-known Fama–French five-factor model and extend it with a sixth factor called GMB (Good minus Bad). The factor loadings allow us to analyze a bias or tilt of the resulting portfolio returns with respect to the six factors included in the model.
with denoting the market risk premium measured as the return difference of the value-weighted market portfolio of the full asset universe and the one-month Treasury bill rate. SMB (Small minus Big) describes the size premium, as small-cap stocks are expected to earn higher returns than large-cap stocks. HML (High minus Low) relates to the value premium, which accounts for the return spread between value and growth stocks, as it is expected that stocks with high book-to-market ratios will outperform those with low book-to-market ratios. RMW (Robust minus Weak) refers to the profitability premium, as stocks with a robust operating profitability are expected to outperform stocks with a weak operating profitability. CMA (Conservative minus Aggressive) refers to the return difference between firms that invest conservatively and aggressively [41]. The additional factor GMB (Good minus Bad) describes the difference in returns between good stocks and bad stocks, in which the portfolios of good and bad stocks contain the top and bottom 50% of stocks given by their ESG scores, respectively. This factor is related to the systematic difference in financial performance between good and bad stocks. It is included due to the ambiguous literature in which no final conclusion about the direction of the relationship between returns and ESG scores has been reached. Furthermore, the measurable relationship may be overlaid by other factors, such as size.The factor has also been constructed using the top and bottom 30%, respectively, with virtually identical results.
4. Data
For the portfolio analysis, we refer to the daily stock price data provided by Bloomberg of firms included in the S&P 500 and the Eurostoxx 600 for the respective constituents lists of February 2018. These indices have been chosen as they represent the most common market benchmarks used by investors. We focus on the time period from 2005 to 2018.As ESG ratings only started to become available for some listed companies in the early 2000s onwards, we chose this time period to ensure that we achieve a sufficiently large data sample of the respective indices. After removing firms with an incomplete price or ESG score history, the sample consists of 423 firms for Europe and 477 for the US.In order to keep our asset universe constant throughout the full observation period, we include all firms contained in the S&P500 as per the constituents list of February 2018. Thus, all firms delisted earlier are not included in the set. The regression factors for the US and Europe are obtained from the data library of Kenneth R. French, based on the full asset universe of public equities in their respective regions.
The ESG disagreement among rating agencies is well-documented and has important implications for the use of ESG data for investment decisions.See, e.g., [49,50,51]. To ensure the robustness of our results, we use ESG scores from both ASSET4 (denoted as ESG-A4 or ) and Thomson Reuters Refinitiv (denoted as TRESG or ) to construct the portfolio strategies.
The ESG data is presented in Table 1, while full descriptions of the price and ESG data for Europe and the US are shown in Table 2 and Table 3.
Table 1 shows that TRESG scores exhibit a smaller range and variability of values as compared to their ASSET4 counterparts, as shown by the lower standard deviation, higher minimum and lower maximum values. When comparing Europe and the US, it can be seen that both ESG data providers report higher average ESG scores for Europe with a lower standard deviation.
Based on the well-known theory of slack resources (see Makni et al. [52]), we investigate whether companies with larger market capitalization have higher ESG scores as compared to companies with medium or small market capitalization. We rank the firms according to their ESG scores and group them into deciles. This analysis provides insight into the importance of size-based passive portfolio strategies for socially responsible investing. Value-weighting is used to construct stock market indices, which commonly serve as market benchmarks and passive-investment strategies with no management fees. A strong positive relationship between ESG performance and size would suggest that value-weighted portfolios and ESG-weighted portfolios share common characteristics and overlap in their asset selection to a certain extent. The results of this exercise are presented in Table 4 and Table 5.
Overall, we observe a positive relationship between ESG scores and market capitalization for both regions, which, however, does not seem to be consistent throughout the whole distribution. In Europe, it seems that the increase in ESG scores throughout the deciles is more often accompanied by an increase in market capitalization for firms with higher ESG scores within the top 40% of deciles. In the US, we also find a positive but even less pronounced relationship. We see that the highest (lowest) ESG score deciles are accompanied by the highest (lowest) market capitalization, respectively, with, notably, the largest market capitalization by far in the highest decile. This also holds true for Europe, even though the lowest market capitalization is reported in decile 2 and the highest in decile 9. The positive relationship between the ESG score and market capitalization seems to be most consistent for both regions in the tails of the distributions, with a larger difference in ESG score and market capitalization between the tails in the US. This stronger variability could be the result of higher ESG standards originating from the mandatory ESG disclosure regulation in Europe.While the EU directive had been enacted in 2017, most large European firms had adopted the ESG regulation standards before, as the first drafts were already available in 2014. Recent evidence from Krueger et al. [53] shows that mandatory ESG disclosure has beneficial effects for firms, as it “increases the availability and quality of ESG reporting”, which, in turn, reduces the risk of negative ESG incidents and stock price crashes. As firms gain more awareness of the positive and negative effects of ESG on firm financials, mandatory ESG disclosure further contributes to a more active management of ESG activities in Europe, which could explain the lower variability between low and high ESG firms.An investigation of the change in the distribution of ESG scores over time shows that ESG scores in the US were more evenly distributed at the beginning of the observation period in 2005–2007, i.e., there was a higher number of firms with lower ESG scores. Over time, the distribution skewed to the left, and ESG scores increased. In Europe, a left-skewed distribution can be observed from the beginning, and the skew has further increased over time. In comparison to the US, a higher concentration of strong ESG stocks can be observed. These results are available from the authors upon request.
Unsurprisingly, we find a negative relationship between ESG scores and returns, which supports the previous results, since large-cap stocks exhibit lower expected returns than small-cap stocks due to the size effect described in Section 3. However, this negative relationship between ESG scores and average returns seems to be more consistent for Europe than for the US. These findings are in line with Ahmad et al. [54], who studied the relationship between ESG and financial performance of the FTSE350 for the time period between 2002 and 2018 and found that “firm size moderates the relationship between ESG performance and financial performance”. We also conduct this investigation using Thomson Reuters Refinitiv ESG Scores and find similar results for the positive relationship between ESG and market capitalization. However, these cannot be confirmed for the whole distribution or for the negative relationship between ESG scores and returns. For both regions and rating regimes, we also run a series of quantile regressions to corroborate our findings. These results are available upon request.
These results suggest a degree of overlap in the asset allocation between value-weighted and ESG-weighted strategies. While it seems that, on average, large-cap stocks also receive a larger share of funds in an ESG-weighting strategy, it still allows for putting larger weights on mid- and small-cap stocks with nevertheless potentially higher ESG scores compared to value-weighting. Depending on the level of diversification achieved, these firms could contribute to the overall financial performance significantly, as they exhibit higher expected returns than large-cap stocks.
5. Results
First, we discuss the results of the portfolio strategies, i.e., the financial and social performance by investigating the results for return, risk and ESG scores. Second, we shed light on the transaction costs of all the strategies, and finally, we analyze the portfolio returns using the Fama–French five-factor regression model to provide further insights.
5.1. Asset Selection and Portfolio Choice
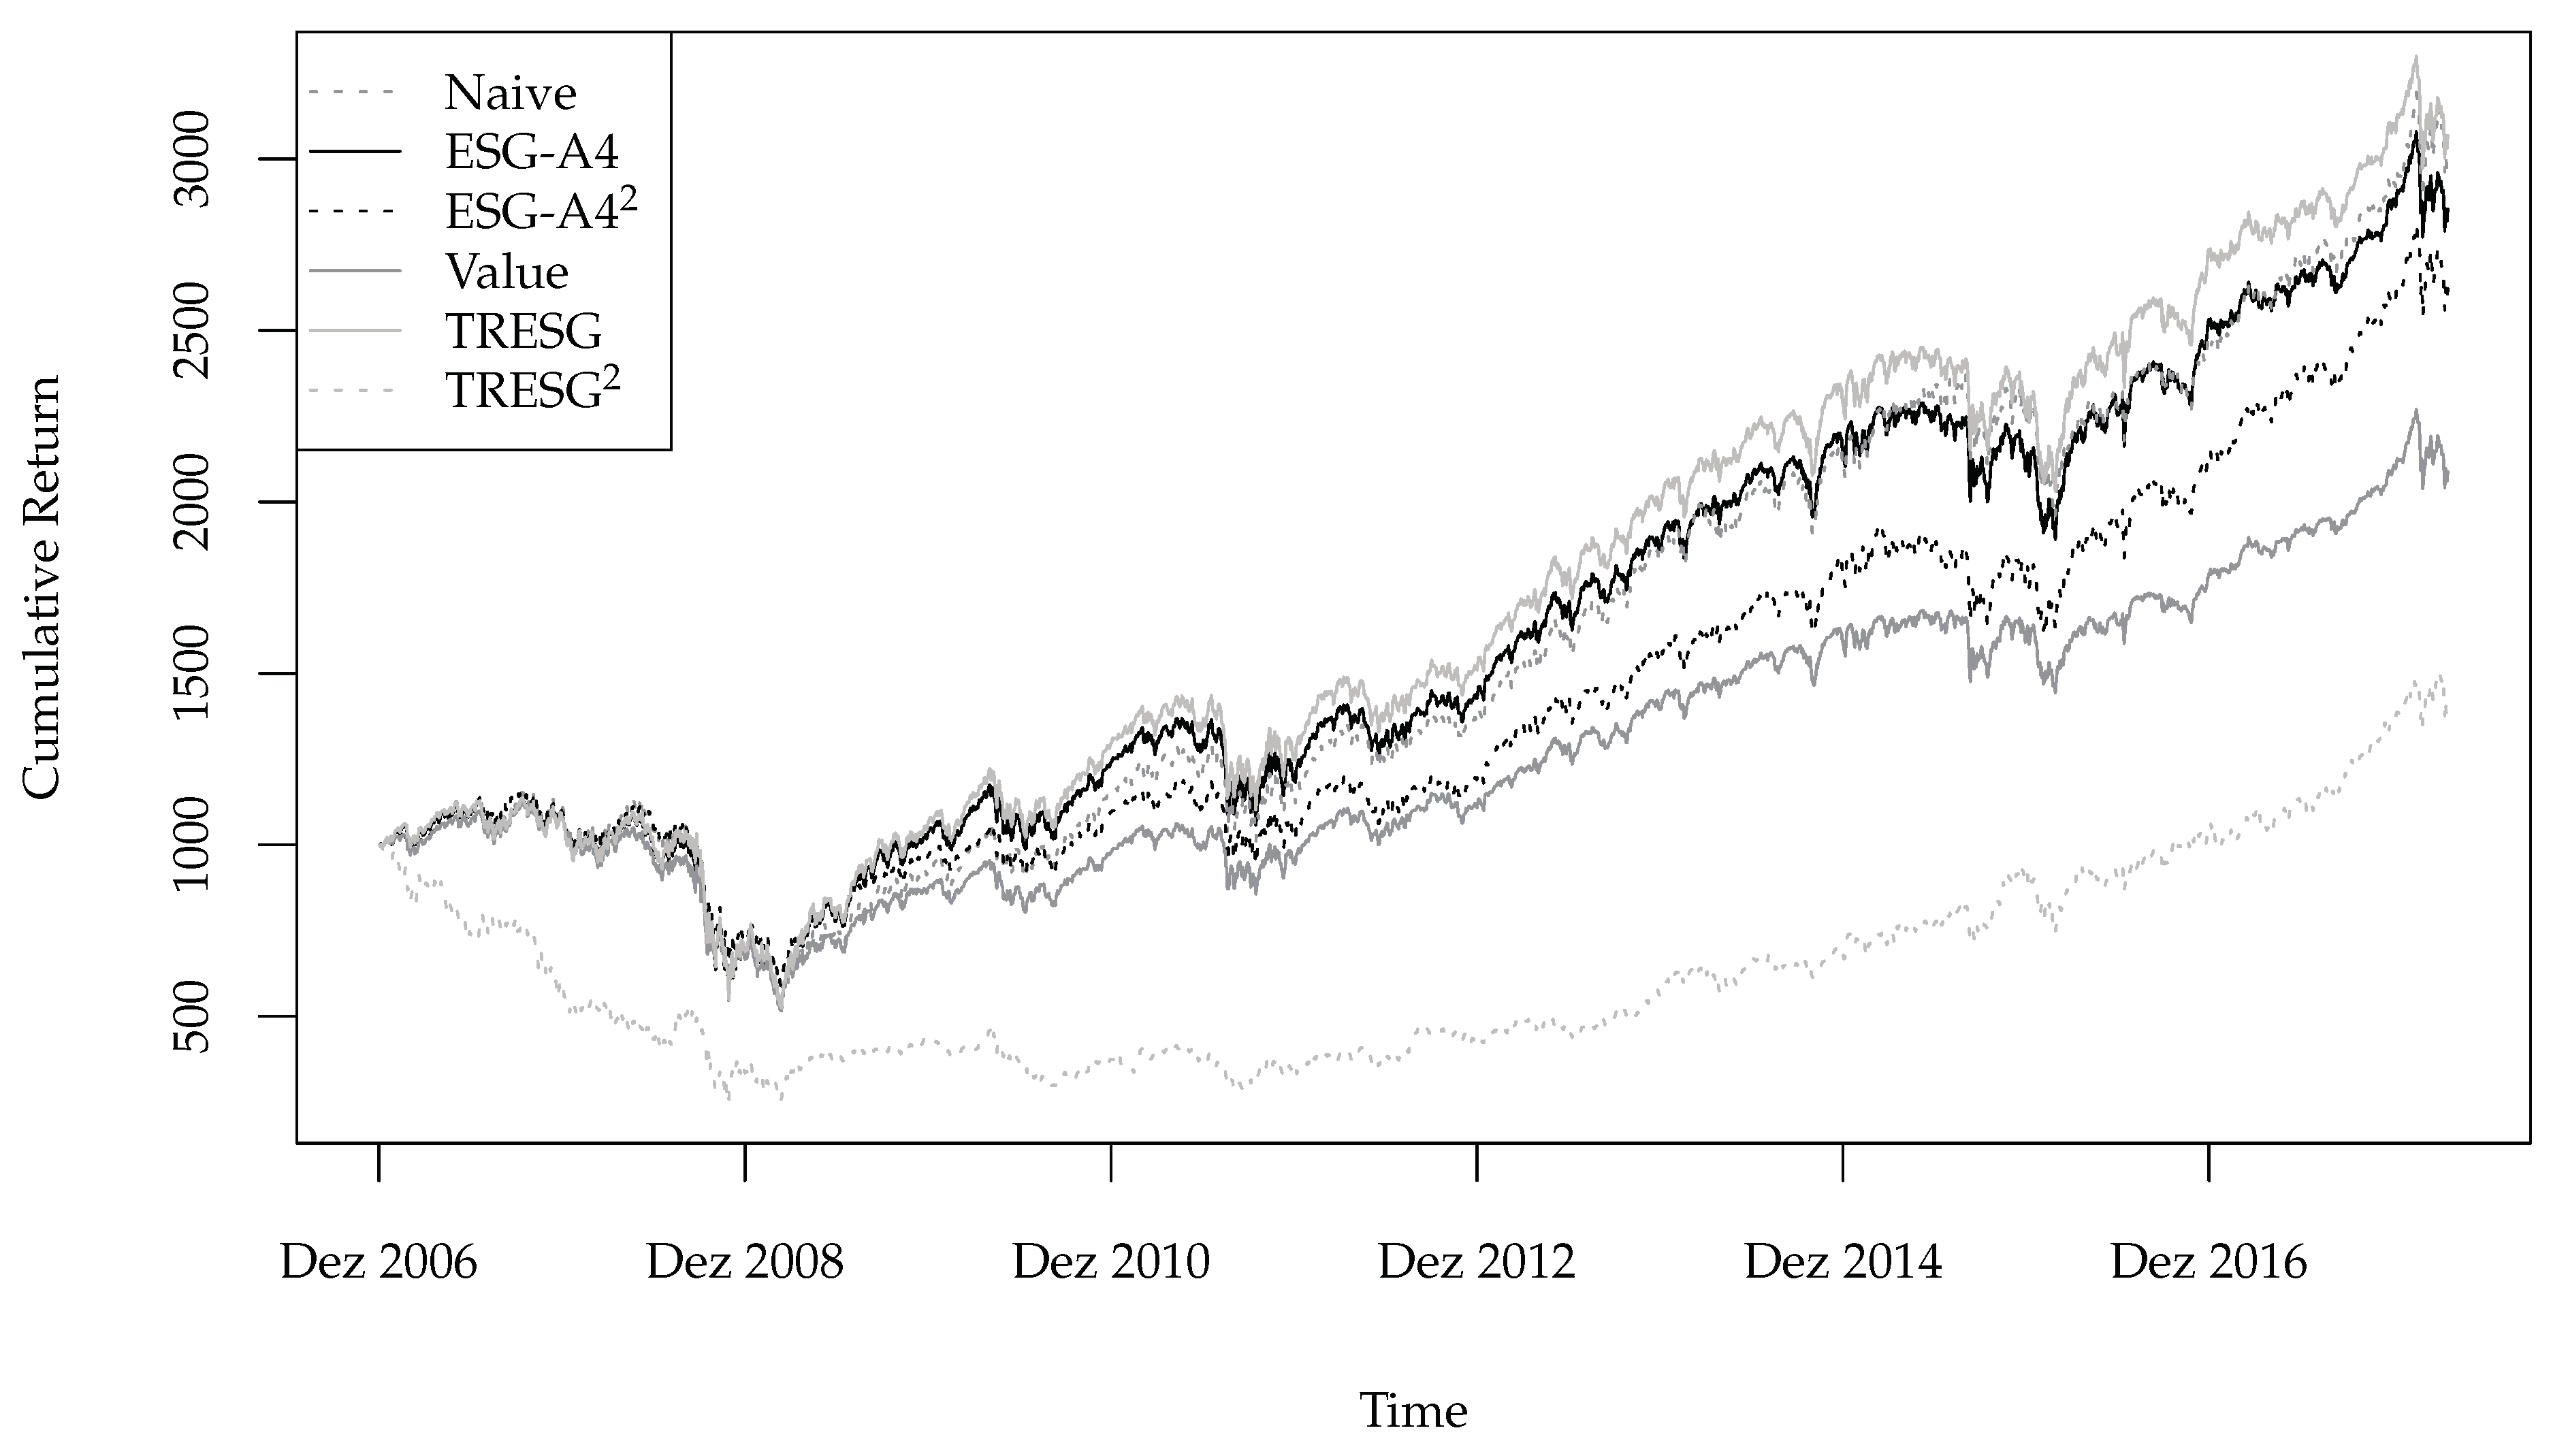
The cumulative portfolio returns based on the asset-allocation strategies outlined in Section 3 are shown in Figure 1 and Figure 2, respectively.
A comparison of the cumulative returns of the strategies for the US shows that the naive and both ESG-weighted portfolios have very similar final values, which are not significantly different from each other. For Europe, it seems that both the ESG-A4 and TRESG portfolios show the highest cumulative daily returns, followed by the naive portfolio strategy. In comparison, both ESG strategies and the value-weighted portfolios show lower cumulative returns, ranking them consistently in the bottom half of both regions.
In order to evaluate the financial performance of the strategies, we refer to the mean daily returns, standard deviation and Sharpe ratio, which is tested between all the strategies for pairwise significance following Wright et al. [55]. The social performance is reported as the average portfolio ESG score computed from both rating providers. The results of all the portfolio strategies for both regions are shown in Table 6 and Table 7.
For the US, the naive portfolio strategy provides the highest Sharpe ratio, closely followed by TRESG, ESG-A4 and ESG-A4. However, the difference is not statistically significant. TRESG reports the highest average return, closely followed by the naive and ESG-A4 strategies. The highest standard deviation is shown for TRESG, followed by TRESG and ESG-A4. The value-weighted and TRESG strategies show the lowest financial performance overall, and all the higher ranked portfolios report statistically significantly larger Sharpe ratios compared to the value-weighted portfolio.
In terms of social performance, it can be seen that the ESG-based strategies always outperform the naive strategy in both ESG rating regimes. As expected, the ESG-A4 and TRESG strategies outperform each other, if the social performance is reported in the same rating regime as that used for constructing those strategies.This means that the ESG-A4 strategy outperforms if the ESG-A4 Score is reported and the TRESG strategy outperforms if the TRESG score is reported. This also holds true for the ESG strategies under TRESG reporting but does not hold true under ESG-A4 reporting since the TRESG and ESG-A4 strategies show almost identical ESG-A4 scores. Both ESG strategies report the highest ESG scores under both rating regimes. The value-weighting strategy shows a similar performance to the ESG-A4 strategy under ESG-A4 reporting, while it shows the lowest social performance of all the strategies under the TRESG reporting. Unsurprisingly, an investigation of the distribution of average portfolio weights for the ESG-based strategies shows significant differences between the vanilla ESG and the ESG strategies. While 90% of the total portfolio weight is, on average, made up of roughly 71% and 84% of stocks for the ESG-A4 and TRESG strategies, respectively, the portfolio concentration of the ESG portfolios is significantly higher. In the ESG-A4 strategy, 20% of the firms constitute 90% of the total portfolio weight, while it is only just above 1% of firms in the TRESG strategy. This implies that, on average, a smaller number of stocks receive very high ESG scores and that this strategy is comparable to a best-in-class approach, in which only the top ESG stocks are selected. The high portfolio concentration suggests that the overall worst financial performance generated by the TRESG strategy is a result of a diversification loss.
The portfolio results for Europe indicate that TRESG has the highest financial performance in terms of expected return and Sharpe ratio, followed by ESG-A4, the naive strategy and ESG-A4. The outperformance of TRESG is statistically significant, whereas the difference between the other three is not. The value-weighting and TRESG strategies again report the lowest financial performance.
The rankings in terms of social performance are identical to the US, with all ESG-based strategies outperforming the naive strategy under both rating regimes and the value-weighted portfolio showing similar performance to the ESG-A4 strategy under ESG-A4 reporting and the lowest performance under TRESG reporting.
It can be concluded that in both regions, the vanilla ESG-based strategies either match or outperform the naive strategy in terms of cumulative returns and the Sharpe ratio. However, they clearly outperform the naive portfolio in terms of social performance under both rating regimes. All ESG-based strategies, except TRESG, also report higher cumulative returns and Sharpe ratios compared to the value-weighted strategy, while the social performance of the value-weighted strategy is similar or lower compared to the ESG-based strategies depending on the reported ESG score. For the ESG strategies, the results are much less consistent across regions and rating regimes. While the ESG-A4 strategy shows a competitive financial performance and higher social performance under both rating regimes compared to the vanilla strategies in the US, it falls short on financial performance in Europe. However, the TRESG strategy consistently shows the lowest financial performance and the highest social performance under both rating regimes, implying a larger tradeoff in financial performance to reach a higher ESG score. The analysis of the average distribution of the portfolio weights for the ESG-based strategies shows similar results for Europe as for the US. For the ESG-A4 and TRESG strategies, 81% and 85% of firms constitute 90% of the total portfolio weight, while the results are 27% and 3% for the ESG and TRESG strategies, respectively. This overall lower concentration is in line with our findings in Section 4, which document, on average, higher ESG scores and lower variability for Europe than for the US. This is further confirmed by comparing the ESG performance of the portfolios between both regions. Only the ESG portfolios have similar ESG performances, as these portfolios only contain the stocks with the highest ESG scores in both regions. The vanilla ESG-based strategies for Europe report, on average, a 10% higher ESG score compared to the US. The lower variability between low and high ESG firms for Europe, possibly due to aforementioned higher ESG reporting standards based on mandatory ESG disclosure, is clearly favorable for the vanilla ESG-based strategies.
Overall, it seems that under both rating regimes and for both regions, it is possible to achieve a superior outcome using the vanilla ESG-based strategy compared to both the naive portfolio, with a higher social and similar financial performance, and the value-weighted portfolio, with higher financial and equal or higher social performance. The fact that ESG scores are usually published with a delay of at least two quarters might create concerns regarding the existence of backfilling bias in our results. Indeed, so far, we have presented all results based on concurrent ESG scores, e.g., the portfolio weights in March 2017, say, were determined by the ESG scores in the first quarter of 2017, even though, at that moment in time, these scores would not yet have been available. We used this procedure due to the high temporal stability and low updating frequency of the ESG score, which means that strategies that base their weights on concurrent or lagged ESG scores will only be marginally different in terms of their portfolio weights and thus in terms of their performance. To substantiate these qualitative claims quantitatively and in order to further check our results for robustness, we also implemented strategies based on lagged ESG scores that take the availability of information at the hypothetical moment of investment into account. We determined portfolio weights based on the ESG scores from q quarters earlier, where we varied q from 2 to 6. As expected, the corresponding results remained virtually unchanged compared to the case where we use ESG scores at time t. Specifically, all performance and risk measures remained very stable and changed only in the fourth or fifth decimal point.
5.2. Transaction Cost
The analysis of the portfolio results so far has focused on the comparison of the financial and social performance of all the strategies. In this section, we extend the analysis by investigating the effect of the transaction cost on each strategy for both regions. We compute the turnover rate of each asset in each strategy based on monthly rebalancing and report the average turnover rate for each strategy in Table 8. Since the asset universe considered for the analysis remains constant throughout the whole observation period, the weights of the firms in the naive portfolio do not change, and therefore, the turnover is zero. We find that both vanilla ESG strategies have the lowest turnover rates, followed by the value-weighted and ESG strategies. This implies a small reduction in the financial performance for the vanilla ESG portfolios as a tradeoff to obtain a higher social performance. This means that investors might have to accept slightly lower returns compared to the naive portfolio by paying transaction costs in exchange for significantly increased social performance. For the ESG strategies, this tradeoff appears to be much larger, putting these strategies at a disadvantage compared to the vanilla ESG-based strategies, as turnover rates are 10 and 7 times larger in Europe and the US, respectively. At the same time, the previously reported financial outperformance of the vanilla ESG-based portfolios over the value-weighted strategies is further increased due to the 3.7 and 2.5 times higher turnover rates in Europe and the US.
5.3. Factor Regressions
In this section, we report the results of the Fama–French five-factor regression models for both regions and all strategies. Moreover, we add an additional factor denoted by GMB (Good minus Bad). In nearly all cases, the regression models show statistically significant coefficients for all five Fama–French factors and the additional GMB factor. Nevertheless, the loadings of the beta coefficients vary substantially.
5.3.1. Regression Analysis—US Market
In Table 9, we report the correlation matrix of the factors considered for the regression model for the US. We find weak to moderate correlation coefficients ranging from between SMB and GMB and between Market and HML. The negative coefficient between SMB and GMB is in line with our findings in Section 4, which indicates a positive relationship between size and ESG scores.
Table 10 gives an overview of the signs of all the regression factors used in the full models for each strategy for the US. While the market itself and RMW are always positive in their impact, for the other factors, the outcome is not that clear and varies with the asset-allocation strategy.
The results of the regression models using the Fama–Franch factors alone and with the GMB factor for the US are shown in Table 11 and Table 12, respectively.
For all the strategies, we observe a market beta close to one. There is a small discrepancy because the reference market composites may not be exactly replicated by the value-weighted portfolio throughout the total observeration period. The naive portfolio shows a positive loading on SMB and RMW, implying a tilt towards small firms with robust operating profitability. The loadings on HML and CMA are negative, which points to firms that also have low book-to-market ratios and aggressive investment styles.
The value-weighted portfolio shows a negative loading on the SMB factor, implying an expected tilt towards large companies. All the other factors besides CMA show a positive sign, indicating a loading on value firms with robust operating profitability and a tilt towards a conservative investment strategy. These results are in line with Fama and French [56].
For the ESG-A4 portfolio, the loadings on the coefficients differ significantly. In contrast to the value-weighted portfolio, we find positive SMB and CMA loadings, indicating that the portfolio return is explained by small firms with conservative investment strategies. The signs of the coefficients of the factor HML and RMW are in line with the value-weighed portfolio but show a more pronounced risk exposure with respect to robust value firms. For the TRESG portfolio, similar results can be observed. The signs and, therefore, the factor loadings are identical to the ESG-A4 portfolio. However, the coefficients vary substantially. TRESG shows a larger coefficient for SML, HML and RMW, while the coefficient of CMA is slightly smaller.
For the ESG strategies, we observe less consistent results with respect to the sign and levels of the coefficients. For both strategies, we observe an insignificant loading on SMB in the full model. This implies that there is no longer a tilt towards small firms compared to the vanilla ESG-based strategies. This can possibly be explained by the more pronounced focus on high-ESG firms in these strategies in combination with the positive relationship to size. The sign of RMW is in line with the value-weighted portfolio, whereas HML and CMA show opposite signs. RMW shows a loading on robust firms, which is expressed even more strongly in the ESG-A4 portfolio. HML with a negative sign is neither in line with the value-weighted portfolio nor with the ESG-A4 portfolio. CMA shows a positive sign, which opposes the value-weighted portfolio but is in line with the ESG-A4 portfolio. Overall, the explanatory power increases compared to the value-weighted portfolio but starts from a lower value. For the TRESG portfolio, the explanatory power is drastically reduced to 0.53, given by R. The loading on firms with low book-to-market ratios is more pronounced than for the ESG-A4 portfolio. For RMW and CMA, the signs of both ESG portfolios are the same, although the coefficients are even larger for TRESG.
Regarding the GMB factor, we find significant but inconsistent loadings for all the strategies. It can be observed that adding the factor has a notable and consistent effect on the SMB factor for the ESG-based strategies. On both ESG strategies, the SMB coefficient becomes insignificant when the GMB factor is added, while it becomes less significant for the ESG-A4 strategy. For the ESG-A4, TRESG and naive strategies, the value of the coefficient of the SMB factor also decreases, while it increases in the value-weighted strategy but has a negative sign. The vanilla ESG-based strategies both show positive SMB and negative GMB factor loadings. This suggests an impact of the size premium on the GMB factor, which is consistent with the previous explanations in Section 4, as the largest (smallest) firms are accompanied by the highest (lowest) ESG scores.
5.3.2. Fama–French analysis—European Market
The correlation matrix for all the factors for Europe are presented in Table 13. The coefficients range from between Market and SMB and between Market and HML. As with the US, we observe a negative correlation of between SMB and GMB.
Table 14 gives an overview of the loadings of all regression factors used in the full model for each strategy for Europe. Compared to the US, the factor loadings are much more consistent between strategies since 5 out of 6 factors show the same loading for all strategies with a positive sign on Market and negative sign for all factors except HML. However, it has to be noted that HML is insignificant for both ESG strategies and only significant at the 10% level for TRESG and the 5% level for ESG-A4.
The results of the regression analysis using the Fama–French factors alone and with the GMB factor for Europe are shown in Table 15 and Table 16, respectively.
The naive and value-weighted portfolios show a negative loading on all factors except the market factor. This indicates a tilt towards large growth stocks with weak operating profitability and aggressive investment strategies. These results differ from the US for both the naive and value-weighted portfolios, which did not show consistent loadings except for Market and RMW.
The vanilla ESG-weighted portfolios (ESG-A4 and TRESG) show similar results with respect to the factor loadings. We find negative loadings on SMB, RMW and CMA and a positive loading on HML, indicating a tilt towards large value firms with weak operating profitability and aggressive investment styles. However, as mentioned earlier, for both strategies, a weaker significance for HML can be observed. For the ESG and TRESG portfolios, we observe similar loadings but a larger negative coefficient for RMW for ESG and for CMA for TRESG and an insignificant coefficient for HML. This implies a tilt torwards large firms with weak operating profitability and an aggressive investment style. The results for the ESG-based strategies show the reduced importance of the HML factor in explaining the portfolio returns.
For Europe, the GMB factor is consistently negative for all the strategies. However, in contrast to the US, both the GMB and SMB factors report negative beta values for the vanilla ESG-based strategies. A possible explanation for the different results could be derived from the distribution of ESG scores. As outlined in Section 4, the distribution of ESG scores is heavily skewed to the left for Europe while also reporting higher average values compared to the US. This implies that the good and bad portfolios are more homogeneous, and the difference in social performance and market capitalization is smaller for Europe. Some firms assigned to the bad portfolio in Europe would be part of the good portfolio in the US based on their ESG scores. We also find a similar pattern as for the US, such that adding the GMB factor to the model leads to a decrease in the beta value of the SMB factor, suggesting an effect of the size premium nevertheless.
The factor regression results report very different explanations for the portfolio strategies for both regions. These results are also much less consistent between strategies in the US than in Europe. However, in the US, strong similarities can still be found for both vanilla ESG-based strategies, while in Europe, the results hold more generally. Furthermore, the positive link between size and ESG seems to be better supported in Europe by the strong similarity in the factor loadings between the ESG-based strategies and the value-weighted portfolio, especially due to the consistently negative loading on SMB. As already mentioned in Section 4, this relationship does not seem to be as strong in the US. This can be somewhat confirmed by the regression results. Even though the loading on SMB is positive, the coefficients are rather small and not or weakly significant for the majority of the ESG-based strategies.
Overall, the results presented in this section suggest that investors can do well and do good by implementing passive ESG-based asset-allocation strategies that require no asset management skills for fees. It is possible to receive similar or superior financial performance compared to the naive portfolio, which is only slightly affected by the transaction cost in the case of the vanilla ESG-weighted portfolios. In comparison to the value-weighted portfolio, a similar or higher social performance (depending on the rating regime) and higher financial performance is possible. These findings hold for both the US and Europe and suggest that an asset allocation based on ESG ratings might be preferable compared to common passive benchmark strategies.
6. Conclusions
Several articles have shown that there is no common agreement on the question of whether doing well and doing good is possible. Aiming to answer this question from a passive portfolio-management perspective, we designed a number of asset-allocation strategies based on ESG data and compared them with a naive and value-weighted portfolio as benchmark strategies for the US and Europe. All the strategies are passive and thus are not affected by management skills or fees.
We find a negative relationship between ESG scores and returns, which seems to be stronger in Europe and less pronounced in the US. Moreover, firms with the highest ESG scores in the US and Europe are on average larger than the firms with the lowest ESG scores. Overall, the range of ESG scores across the whole distribution is lower in Europe than the US, which could be explained by higher CSR standards in Europe.
The portfolio results suggest that an asset-allocation strategy based on a simple ESG-weighting is preferable to both the naive and value-weighted portfolio strategies. The vanilla ESG-based strategy produces a similar financial and superior social performance compared to the naive strategy. The advantage compared to the value-weighted strategy seems to be even more pronounced, as a higher financial performance and similar or higher social performance can be achieved depending on the rating regime used.
This conclusion changes only slightly after the consideration of the rebalancing cost since the turnover rates of the vanilla ESG-based portfolios are very low. This suggests that achieving a significantly higher social performance might come at a rather small premium compared to the financial performance of the naive portfolio, which seems to be purely related to the cost of rebalancing the ESG-based portfolio. At the same time, the superior financial performance compared to the value-weighted strategy further increases after considering the rebalancing cost.
The regression results do not reveal any consistent factor loadings across the regions. However, for the vanilla ESG-based strategies in the US, consistent results can be found, indicating a tilt towards small value firms with robust operating profitability and conservative investment styles. In Europe, the results, while being different to the US, hold more generally across the strategies and indicate a tilt towards large firms with weak operating profitability and an aggressive investment style. The book-to-market ratio seems to have little explanatory power for the strategies constructed in Europe. The added GMB factor shows a negative loading on the vanilla ESG-based strategies for both Europe and the US. While this implies a tilt towards bad firms for explaining the changes in the strategy returns, the impact of the size premium on the GMB factor could provide an alternative explanation for the factor loading as well.
While this paper investigates passive asset-allocation strategies based on ESG-weighting from the perspective of a socially reponsible investor, the results seem to suggest that such strategies might also be preferred by conventional investors looking for a passively managed alternative compared to a value-weighted index. Furthermore, it seems that such a strategy might be a more adequate benchmark for active SRI funds.
Author Contributions
Conceptualization, M.R.; methodology, M.R., K.W.; software, J.A.; data curation, K.W., J.A.; writing—original draft preparation, M.R., K.W., J.A.; writing—review and editing, M.R., K.W.; All authors have read and agreed to the published version of the manuscript.
Funding
This research received no external funding.
Data Availability Statement
Not publicly available.
Conflicts of Interest
The authors declare no conflict of interest.
References
- Smith, A. The Theory of Moral Sentiments; Penguin: London, UK, 2010. [Google Scholar]
- US SIF. Report on US Sustainable, Responsible and Impact Investing Trends 2018; Technical report; The Forum for Sustainable and Responsible Investment: Washington, DC, USA, 2018. [Google Scholar]
- Eurosif. European SRI Study 2018; Technical report;European Sustainable Investment Forum: London, UK, 2018. [Google Scholar]
- Dorfleitner, G.; Halbritter, G.; Nguyen, M. Measuring the level and risk of corporate responsibility—An empirical comparison of different ESG rating approaches. J. Asset Manag. 2015, 16, 450–466. [Google Scholar] [CrossRef]
- Ballestero, E.; Bravo, M.; Pérez-Gladish, B.; Arenas-Parra, M.; Plà-Santamaria, D. Socially Responsible Investment: A multicriteria approach to portfolio selection combining ethical and financial objectives. Eur. J. Oper. Res. 2012, 216, 487–494. [Google Scholar] [CrossRef]
- Revelli, C.; Viviani, J.L. Financial performance of socially responsible investing (SRI): What have we learned? A meta-analysis. Bus. Ethics Eur. Rev. 2015, 24, 158–185. [Google Scholar] [CrossRef]
- Von Wallis, M.; Klein, C. Ethical requirement and financial interest: A literature review on socially responsible investing. Bus. Res. 2015, 8, 61–98. [Google Scholar] [CrossRef] [Green Version]
- Bilbao-Terol, A.; Arenas-Parra, M.; Cañal-Fernández, V. Selection of socially responsible portfolios using goal programming and fuzzy technology. Inf. Sci. 2012, 189, 110–125. [Google Scholar] [CrossRef]
- Bilbao-Terol, A.; Arenas-Parra, M.; Cañal-Fernández, V.; Bilbao-Terol, C. Selection of socially responsible portfolios using hedonic prices. J. Bus. Ethics 2013, 115, 515–529. [Google Scholar] [CrossRef]
- Hirschberger, M.; Steuer, R.E.; Utz, S.; Wimmer, M.; Qi, Y. Computing the Nondominated Surface in Tri-Criterion Portfolio Selection. Oper. Res. 2013, 61, 169–183. [Google Scholar] [CrossRef] [Green Version]
- Gasser, S.M.; Rammerstorfer, M.; Weinmayer, K. Markowitz revisited: Social portfolio engineering. Eur. J. Oper. Res. 2017, 258, 1181–1190. [Google Scholar] [CrossRef] [Green Version]
- Luther, R.G.; Matatko, J.; Corner, D.C. The investment performance of UK ethical Unit Trusts. Account. Audit. Account. J. 1992, 5. [Google Scholar] [CrossRef]
- Hamilton, S.; Jo, H.; Statman, M. Doing well while doing good? The investment performance of socially responsible mutual funds. Financ. Anal. J. 1993, 49, 62–66. [Google Scholar] [CrossRef]
- White, M.A. The performance of environmental mutual funds in the United States and Germany: Is there economic hope for green investors? Res. Corp. Soc. Perform. Policy 1995, 1, 323–344. [Google Scholar]
- Mallin, C.A.; Saadouni, B.; Briston, R.J. The financial performance of ethical investment funds. J. Bus. Financ. Account. 1995, 22, 483–496. [Google Scholar] [CrossRef]
- Gregory, A.; Matatko, J.; Luther, R. Ethical Unit Trust Financial Performance: Small Company Effects and Fund Size Effects. J. Bus. Financ. Account. 1997, 24, 705–725. [Google Scholar] [CrossRef]
- Statman, M. Socially responsible mutual funds. Financ. Anal. J. 2000, 56, 30–39. [Google Scholar] [CrossRef]
- Stone, B.; Guerard, J.; Gultekin, M.J.; Adams, G. Socially Responsible Investment Screening: Strong Evidence of no Significant Cost for Actively Managed Portfolios. Working Paper. 2001. Available online: http://media.terry.uga.edu/documents/finance/guerard.pdf (accessed on 1 August 2021).
- Kreander, N.; Gray, R.; Power, D.; Sinclair, C. The financial performance of European ethical funds 1996–1998. J. Account. Financ. 2002, 1, 22. [Google Scholar]
- Bauer, R.; Koedijk, K.; Otten, R. International evidence on ethical mutual fund performance and investment style. J. Bank. Financ. 2005, 29, 1751–1767. [Google Scholar] [CrossRef] [Green Version]
- Galema, R.; Plantinga, A.; Scholtens, B. The stocks at stake: Return and risk in socially responsible investment. J. Bank. Financ. 2008, 32, 2646–2654. [Google Scholar] [CrossRef]
- Schröder, M. Is there a difference? The performance characteristics of SRI equity indices. J. Bus. Financ. Account. 2007, 34, 331–348. [Google Scholar] [CrossRef]
- Humphrey, J.; Lee, D. Australian socially responsible funds—Performance, risk and screening intensity. J. Bus. Ethics 2011, 102, 519–535. [Google Scholar] [CrossRef]
- Humphrey, J.E.; Tan, D.T. Does it really hurt to be responsible? J. Bus. Ethics 2014, 122, 375–386. [Google Scholar] [CrossRef]
- Junkus, J.; Berry, T.D. Socially responsible investing: A review of the critical issues. Manag. Financ. 2015, 41, 1176–1201. [Google Scholar] [CrossRef]
- Badía, G.; Pina, V.; Torres, L. Financial performance of government bond portfolios based on environmental, social and governance criteria. Sustainability 2019, 11, 2514. [Google Scholar] [CrossRef] [Green Version]
- Folger-Laronde, Z.; Pashang, S.; Feor, L.; ElAlfy, A. ESG ratings and financial performance of exchange-traded funds during the COVID-19 pandemic. J. Sustain. Financ. Invest. 2020, 1–7. [Google Scholar] [CrossRef]
- Derwall, J.; Guenster, N.; Bauer, R.; Koedijk, K. The eco-efficiency premium puzzle. Financ. Anal. J. 2005, 61, 51–63. [Google Scholar] [CrossRef] [Green Version]
- Kempf, A.; Osthoff, P. The effect of socially responsible investing on portfolio performance. Eur. Financ. Manag. 2007, 13, 908–922. [Google Scholar] [CrossRef] [Green Version]
- Statman, M.; Glushkov, D. The wages of social responsibility. Financ. Anal. J. 2009, 65, 33–46. [Google Scholar] [CrossRef]
- Derwall, J.; Koedijk, K.; Ter Horst, J. A tale of values-driven and profit-seeking social investors. J. Bank. Financ. 2011, 35, 2137–2147. [Google Scholar] [CrossRef]
- El Ghoul, S.; Guedhami, O.; Kwok, C.C.; Mishra, D.R. Does corporate social responsibility affect the cost of capital? J. Bank. Financ. 2011, 35, 2388–2406. [Google Scholar] [CrossRef]
- Rathner, S. The Performance of Socially Responsible Investment Funds: A Meta-Analysis; Technical, Report; Working Papers in Economics and Finance, University of Salzburg; Economics and Finance, University of Salzburg: Salzburg, Austria, 2012. [Google Scholar]
- Capelle-Blancard, G.; Monjon, S. The performance of socially responsible funds: Does the screening process matter? Eur. Financ. Manag. 2014, 20, 494–520. [Google Scholar] [CrossRef]
- Geczy, C.; Stambaugh, R.; Levin, D. Investing in Socially Responsible Mutual Funds. Working Paper. 2005. Available online: https://repository.upenn.edu/cgi/viewcontent.cgi?article=1444&context=fnce_papers (accessed on 1 August 2021).
- Hong, H.; Kacperczyk, M. The price of sin: The effects of social norms on markets. J. Financ. Econ. 2009, 93, 15–36. [Google Scholar] [CrossRef]
- Trinks, P.J.; Scholtens, B. The opportunity cost of negative screening in socially responsible investing. J. Bus. Ethics 2017, 140, 193–208. [Google Scholar] [CrossRef] [Green Version]
- Riedl, A.; Smeets, P. Why do investors hold socially responsible mutual funds? J. Financ. 2017, 72, 2505–2550. [Google Scholar] [CrossRef] [Green Version]
- Manescu, C. Stock returns in relation to environmental, social and governance performance: Mispricing or compensation for risk? Sustain. Dev. 2011, 19, 95–118. [Google Scholar] [CrossRef] [Green Version]
- Maiti, M. Is ESG the succeeding risk factor? J. Sustain. Financ. Invest. 2021, 11, 199–213. [Google Scholar] [CrossRef]
- Fama, E.F.; French, K.R. Incremental variables and the investment opportunity set. J. Financ. Econ. 2015, 117, 470–488. [Google Scholar] [CrossRef]
- DeMiguel, V.; Garlappi, L.; Uppal, R. Optimal versus naive diversification: How inefficient is the 1/N portfolio strategy? Rev. Financ. Stud. 2009, 22, 1915–1953. [Google Scholar] [CrossRef] [Green Version]
- Dorfleitner, G.; Utz, S. Safety first portfolio choice based on financial and sustainability returns. Eur. J. Oper. Res. 2012, 221, 155–164. [Google Scholar] [CrossRef]
- Friedman, H.L.; Heinle, M.S. Taste, information, and asset prices: Implications for the valuation of CSR. Rev. Account. Stud. 2016, 21, 740–767. [Google Scholar] [CrossRef] [Green Version]
- Grant, A.; Satchell, S. Investment decisions when utility depends on wealth and other attributes. Quant. Financ. 2020, 20, 499–513. [Google Scholar] [CrossRef]
- Avramov, D.; Cheng, S.; Lioui, A.; Tarelli, A. Investment and Asset Pricing with ESG Disagreement. 2020. Available online: https://www.eticanews.it/wp-content/uploads/2021/01/SSRN-Investment-and-asset-pricing-with-Esg-disagreement_FATTO.pdf (accessed on 1 August 2021).
- Dorfleitner, G.; Leidl, M.; Reeder, J. Theory of social returns in portfolio choice with application to microfinance. J. Asset Manag. 2012, 13, 384–400. [Google Scholar] [CrossRef] [Green Version]
- Basso, A.; Funari, S. Constant and variable returns to scale DEA models for socially responsible investment funds. Eur. J. Oper. Res. 2014, 235, 775–783. [Google Scholar] [CrossRef] [Green Version]
- Berg, F.; Koelbel, J.F.; Rigobon, R. Aggregate Confusion: The Divergence of ESG Ratings; MIT Sloan School of Management: Cambridge, MA, USA, 2019. [Google Scholar]
- Gibson, R.; Krueger, P.; Schmidt, P.S. ESG Rating Disagreement and Stock Returns (December 22, 2019). Swiss Finance Institute Research Paper No. 19-67. European Corporate Governance Institute–Finance Working Paper No. 651/2020. Financial Analyst Journal. Forthcoming. 2019. Available online: https://ssrn.com/abstract=3433728; http://dx.doi.org/10.2139/ssrn.3433728 (accessed on 1 August 2021).
- Dimson, E.; Marsh, P.; Staunton, M. Divergent ESG ratings. J. Portf. Manag. 2020, 47, 75–87. [Google Scholar] [CrossRef]
- Makni, R.; Francoeur, C.; Bellavance, F. Causality between corporate social performance and financial performance: Evidence from Canadian firms. J. Bus. Ethics 2009, 89, 409. [Google Scholar] [CrossRef]
- Krueger, P.; Sautner, Z.; Tang, D.Y.; Zhong, R. The Effects of Mandatory ESG Disclosure around the World. 2021. Available online: https://ssrn.com/abstract=3832745; http://dx.doi.org/10.2139/ssrn.3832745 (accessed on 1 August 2021).
- Ahmad, N.; Mobarek, A.; Roni, N.N. Revisiting the impact of ESG on financial performance of FTSE350 UK firms: Static and dynamic panel data analysis. Cogent Bus. Manag. 2021, 8, 1900500. [Google Scholar] [CrossRef]
- Wright, J.; Yam, S.; Pang Yung, S. A test for the equality of multiple Sharpe ratios. J. Risk 2014, 16. [Google Scholar] [CrossRef] [Green Version]
- Fama, E.F.; French, K.R. International tests of a five-factor asset pricing model. J. Financ. Econ. 2017, 123, 441–463. [Google Scholar] [CrossRef]
Figure 1.
The Cumulative Returns of Portfolio Strategies—US. Notes: This figure shows the cumulative daily return development of all strategies for the US based on an initial investment of USD 1000 for the US.
Figure 1.
The Cumulative Returns of Portfolio Strategies—US. Notes: This figure shows the cumulative daily return development of all strategies for the US based on an initial investment of USD 1000 for the US.

Figure 2.
The Cumulative Returns of Portfolio Strategies—Europe. Notes: This figure shows the cumulative daily return development of all strategies for Europe based on an initial investment of EUR 1000.
Figure 2.
The Cumulative Returns of Portfolio Strategies—Europe. Notes: This figure shows the cumulative daily return development of all strategies for Europe based on an initial investment of EUR 1000.


Table 1.
Descriptive Statistics of ESG data.
| Source | # | Min | 1st Qu. | 3rd Qu. | Max | ||
|---|---|---|---|---|---|---|---|
| US | 477 | 63.353 | 25.228 | 7.305 | 44.030 | 86.649 | 96.860 |
| US | 477 | 47.110 | 10.703 | 16.880 | 39.820 | 53.820 | 78.840 |
| Europe | 423 | 76.781 | 19.444 | 5.303 | 67.865 | 90.970 | 95.928 |
| Europe | 423 | 52.880 | 10.500 | 18.290 | 45.670 | 60.190 | 79.190 |
Notes: This table provides descriptive statistics for the ESG-A4 and TRESG scores for both Europe and the US. # represents the number of firms, while columns 2–6 show the average daily return, standard deviation, minimum, first and third quantile as well as maximum return.
Table 2.
Descriptive Statistics by Industry (SIC)—US.
| SIC | # | Min | Max | Median | Min | Max | Median | |||
|---|---|---|---|---|---|---|---|---|---|---|
| 1 | 30 | −39.344% | ||||||||
| 2 | 80 | −42.553% | ||||||||
| 3 | 93 | −35.420% | ||||||||
| 4 | 64 | −34.813% | ||||||||
| 5 | 49 | −40.394% | ||||||||
| 6 | 99 | −60.791% | ||||||||
| 7 | 49 | −34.894% | ||||||||
| 8 | 13 | −41.022% |
Notes: This table contains descriptive statistics for the daily returns and ESG scores of our sample for the US grouped by industry (one-digit SIC code): 1 is for mining and construction, 2 for manufacturing of consumption goods, 3 for manufacturing of capital goods, 4 for infrastructure, 5 for wholesale and retail trade, 6 for finance, insurance and real estate, 7 for services and 8 for public administration. # stands for the number of firms in the respective sic code group. Columns 2–7 report the average daily return, standard deviation, minimum, maximum and median daily return, while columns 8–11 report the average, minimum, maxiumum and median ESG scores (based on ) for each industry.
Table 3.
Descriptive Statistics by Industry (SIC)—Europe.
| SIC | # | Min | Max | Median | Min | Max | Median | |||
|---|---|---|---|---|---|---|---|---|---|---|
| 1 | 26 | −41.667% | ||||||||
| 2 | 80 | −32.547% | ||||||||
| 3 | 89 | −84.919% | ||||||||
| 4 | 58 | −48.007% | ||||||||
| 5 | 29 | −38.462% | ||||||||
| 6 | 89 | −66.571% | ||||||||
| 7 | 33 | −61.573% | ||||||||
| 8 | 12 | −30.238% |
Notes: This table contains descriptive statistics for the daily returns and ESG scores of our sample for Europe grouped by industry (one-digit SIC code): 1 is for mining and construction, 2 for manufacturing of consumption goods, 3 for manufacturing of capital goods, 4 for infrastructure, 5 for wholesale and retail trade, 6 for finance, insurance and real estate, 7 for services and 8 for public administration. # stands for the number of firms in the respective sic code group. Columns 2–7 report the average daily return, standard deviation, minimum, maximum and median daily return, while columns 8–11 report the average, minimum, maxiumum and median ESG scores (based on ) for each industry.
Table 4.
TRESG Score Deciles—US.
| Decile | # | Min | Max | |||
|---|---|---|---|---|---|---|
| 1 | 48 | |||||
| 2 | 48 | |||||
| 3 | 47 | −0.002% | ||||
| 4 | 48 | −0.007% | ||||
| 5 | 47 | |||||
| 6 | 48 | −0.043% | ||||
| 7 | 47 | |||||
| 8 | 48 | |||||
| 9 | 48 | |||||
| 10 | 48 | −0.029% | ||||
| Total | 477 | −0.043% |
Notes: This table shows descriptive statistics of the ESG-based deciles for the firms ranked according to for the US. For example, group 1 contains the 10% of firms with the lowest and group 10 the 10% of firms with the highest ESG scores, whereas # shows the number of firms in each decile, the average ESG score, the average market capitalization, , min and max the average, minimum and maximum daily return of each decile.
Table 5.
TRESG Score Deciles—Europe.
| Decile | # | Min | Max | |||
|---|---|---|---|---|---|---|
| 1 | 42 | |||||
| 2 | 42 | |||||
| 3 | 43 | − 0.009% | ||||
| 4 | 42 | |||||
| 5 | 42 | − 0.014% | ||||
| 6 | 42 | − 0.005% | ||||
| 7 | 42 | − 0.006% | ||||
| 8 | 43 | − 0.002% | ||||
| 9 | 43 | |||||
| 10 | 42 | − 0.008% | ||||
| Total | 423 | − 0.014% |
Notes: This table shows descriptive statistics of the ESG-based deciles for the firms ranked according to for Europe. For example, group 1 contains the 10% of firms with the lowest and group 10 the 10% of firms with the highest ESG scores, whereas # shows the number of firms in each decile, the average ESG score, the average market capitalization, , min and max the average, minimum and maximum daily return of each decile.
Table 6.
Portfolio Results—US.
| Strategy | SR | ||||
|---|---|---|---|---|---|
| Naive | |||||
| TRESG | |||||
| ESG-A4 | |||||
| TRESG | |||||
| ESG-A4 | |||||
| Value |
Notes: This table shows the results of the portfolio strategies for the US. Columns 2 and 3 show the average daily return and standard deviation, while columns 4 and 5 show the average ESG-A4 and TRESG Score of the portfolios. Column 6 shows the Sharpe ratio based on the daily returns.
Table 7.
Portfolio Results—Europe.
| Strategy | SR | ||||
|---|---|---|---|---|---|
| Naive | |||||
| TRESG | |||||
| ESG-A4 | |||||
| TRESG | |||||
| ESG-A4 | |||||
| Value |
Notes: This table shows the results of the portfolio strategies for Europe. Columns 2 and 3 show the average daily return and standard deviation, while columns 4 and 5 show the average ESG-A4 and TRESG Score of the portfolios. Column 6 shows the Sharpe ratio based on the daily returns.
Table 8.
The Average Strategy Turnover Rates—Europe and the US.
| Region | ESG-A4 | ESG-A4 | TRESG | TRESG | Value |
|---|---|---|---|---|---|
| Europe | |||||
| US |
Notes: This table reports the average turnover rates of each strategy in each region based on monthly rebalancing.
Table 9.
Factor Correlation—US.
| Market | SMB | HML | RMW | CMA | GMB | |
|---|---|---|---|---|---|---|
| Market | 1 | 0.25 | 0.39 | −0.39 | −0.15 | −0.30 |
| SMB | 0.25 | 1 | 0.13 | −0.30 | 0.01 | −0.52 |
| HML | 0.39 | 0.13 | 1 | −0.43 | 0.25 | −0.13 |
| RMW | −0.39 | −0.30 | −0.43 | 1 | 0.02 | 0.37 |
| CMA | −0.15 | 0.01 | 0.25 | 0.02 | 1 | 0.22 |
| GMB | −0.30 | −0.52 | −0.13 | 0.37 | 0.22 | 1 |
Notes: This table shows the correlation matrix of the factors included in the regression analysis for the US including the five Fama–French factors and GMB (Good minus Bad).
Table 10.
Signs of the Factor Beta Coefficients—US.
| Factor | Naive | ESG-A4 | ESG-A4 | TRESG | TRESG | Value |
|---|---|---|---|---|---|---|
| Market | + | + | + | + | + | + |
| SMB | + | + | (−) | + | (+) | − |
| HML | − | + | − | + | − | + |
| RMW | + | + | + | + | + | + |
| CMA | (−) | + | + | + | + | − |
| GMB | − | − | + | − | − | + |
Notes: This table reports the signs of the factor beta coefficients contained in the final regression models for all strategies for the US. The results in brackets indicate insignificant coefficients at .
Table 11.
Fama–French Regression Results for the US.
| Dependent Variable: | ||||||
|---|---|---|---|---|---|---|
| Portfolio Return | ||||||
| Naive | ESG-A4 | ESG-A4 | TRESG | TRESG | Value | |
| Mkt.RF | 1.046 *** | 1.055 *** | 0.990 *** | 1.064 *** | 1.088 *** | 1.013 *** |
| (0.003) | (0.003) | (0.004) | (0.003) | (0.021) | (0.002) | |
| SMB | 0.160 *** | 0.057 *** | −0.045 *** | 0.185 *** | 0.134 *** | −0.132 *** |
| (0.006) | (0.006) | (0.009) | (0.007) | (0.041) | (0.003) | |
| HML | −0.051 *** | 0.117 *** | −0.149 *** | 0.162 *** | −0.291 *** | 0.065 *** |
| (0.005) | (0.006) | (0.008) | (0.006) | (0.040) | (0.003) | |
| RMW | 0.050 *** | 0.093 *** | 0.116 *** | 0.109 *** | 0.204 *** | 0.045 *** |
| (0.010) | (0.010) | (0.015) | (0.011) | (0.071) | (0.005) | |
| CMA | −0.065 *** | 0.077 *** | 0.234 *** | 0.039 *** | 0.443 *** | −0.018 *** |
| (0.010) | (0.011) | (0.016) | (0.012) | (0.078) | (0.006) | |
| Constant | 0.0001 ** | 0.0001 ** | 0.00002 | 0.0001 ** | −0.0002 | −0.00003 ** |
| (0.00003) | (0.00003) | (0.00005) | (0.00004) | (0.0002) | (0.00002) | |
| Observations | 2825 | 2825 | 2825 | 2825 | 2825 | 2825 |
| R | 0.986 | 0.985 | 0.959 | 0.982 | 0.541 | 0.995 |
| Adjusted R | 0.986 | 0.985 | 0.959 | 0.982 | 0.541 | 0.995 |
Note: This table illustrates the effect of the five Fama–French factors in explaining the portfolio returns. Herein, ∗∗ p < 0.05; ∗∗∗ p < 0.01.
Table 12.
Fama–French Regression Results including GMB for the US.
| Dependent Variable: | ||||||
|---|---|---|---|---|---|---|
| Portfolio Return | ||||||
| Naive | ESG-A4 | ESG-A4 | TRESG | TRESG | Value | |
| Mkt.RF | 1.041 *** | 1.052 *** | 0.992 *** | 1.060 *** | 1.083 *** | 1.014 *** |
| (0.003) | (0.003) | (0.004) | (0.003) | (0.021) | (0.002) | |
| SMB | 0.093 *** | 0.013 ** | −0.014 | 0.121 *** | 0.054 | −0.118 *** |
| (0.006) | (0.006) | (0.010) | (0.007) | (0.046) | (0.003) | |
| HML | −0.053 *** | 0.116 *** | −0.148 *** | 0.160 *** | −0.293 *** | 0.065 *** |
| (0.005) | (0.005) | (0.008) | (0.006) | (0.040) | (0.003) | |
| RMW | 0.097 *** | 0.125 *** | 0.095 *** | 0.154 *** | 0.260 *** | 0.035 *** |
| (0.009) | (0.010) | (0.015) | (0.011) | (0.073) | (0.005) | |
| CMA | −0.003 | 0.118 *** | 0.206 *** | 0.099 *** | 0.518 *** | −0.031 *** |
| (0.010) | (0.011) | (0.017) | (0.012) | (0.080) | (0.006) | |
| GMB | −0.238 *** | −0.159 *** | 0.109 *** | −0.230 *** | −0.286 *** | 0.049 *** |
| (0.009) | (0.010) | (0.016) | (0.012) | (0.077) | (0.006) | |
| Constant | 0.0001 * | 0.0001 * | 0.00003 | 0.0001 ** | −0.0002 | −0.00003 * |
| (0.00003) | (0.00003) | (0.00005) | (0.00003) | (0.0002) | (0.00002) | |
| Observations | 2825 | 2825 | 2825 | 2825 | 2825 | 2825 |
| R | 0.988 | 0.986 | 0.959 | 0.985 | 0.544 | 0.995 |
| Adjusted R | 0.988 | 0.986 | 0.959 | 0.984 | 0.543 | 0.995 |
Note: This table illustrates the effect of the five Fama–French factors and GMB in explaining the portfolio returns. Herein, ∗ p < 0.1; ∗∗ p < 0.05; ∗∗∗ p < 0.01.
Table 13.
Factor Correlation—Europe.
| Market | SMB | HML | RMW | CMA | GMB | |
|---|---|---|---|---|---|---|
| Market | 1 | −0.72 | 0.40 | −0.20 | −0.31 | 0.19 |
| SMB | −0.72 | 1 | −0.26 | 0.12 | 0.19 | −0.39 |
| HML | 0.40 | −0.26 | 1 | −0.65 | 0.20 | −0.18 |
| RMW | −0.20 | 0.12 | −0.65 | 1 | −0.29 | −0.05 |
| CMA | −0.31 | 0.19 | 0.20 | −0.29 | 1 | 0.07 |
| GMB | 0.19 | −0.39 | 0.18 | −0.05 | 0.07 | 1 |
Notes: This table shows the correlation matrix of the factors included in the regression analysis for Europe, including the five Fama–French factors and GMB (Good minus Bad).
Table 14.
Signs of the Factor Beta Coefficients—Europe.
| Factor | Naive | ESG-A4 | ESG-A4 | TRESG | TRESG | Value |
|---|---|---|---|---|---|---|
| Market | + | + | + | + | + | + |
| SMB | − | − | − | − | − | − |
| HML | − | + | (+) | + | (−) | − |
| RMW | − | − | − | − | − | − |
| CMA | − | − | − | − | − | − |
| GMB | − | − | − | − | − | − |
Notes: This table reports the signs of the factor beta coefficients contained in the final regression models for all strategies for Europe. The results in brackets indicate insignificant coefficients at .
Table 15.
Fama–French Regression Results for Europe.
| Dependent Variable: | ||||||
|---|---|---|---|---|---|---|
| Portfolio Return | ||||||
| Naive | ESG-A4 | ESG-A4 | TRESG | TRESG | Value | |
| Mkt.RF | 0.660 *** | 0.672 *** | 0.645 *** | 0.674 *** | 0.595 *** | 0.638 *** |
| (0.011) | (0.012) | (0.012) | (0.012) | (0.024) | (0.011) | |
| SMB | −0.347 *** | −0.423 *** | −0.742 *** | −0.369 *** | −0.742 *** | −0.544 *** |
| (0.024) | (0.025) | (0.026) | (0.025) | (0.052) | (0.024) | |
| HML | −0.144 *** | 0.029 | 0.013 | 0.022 | −0.021 | −0.122 *** |
| (0.028) | (0.028) | (0.030) | (0.029) | (0.060) | (0.027) | |
| RMW | −0.275 *** | −0.382 *** | −0.450 *** | −0.380 *** | −0.233 *** | −0.339 *** |
| (0.041) | (0.042) | (0.045) | (0.042) | (0.088) | (0.040) | |
| CMA | −0.435 *** | −0.489 *** | −0.455 *** | −0.494 *** | −0.655 *** | −0.466 *** |
| (0.036) | (0.038) | (0.040) | (0.038) | (0.078) | (0.036) | |
| Constant | 0.0002 ** | 0.0003 *** | 0.0003 ** | 0.0003 *** | 0.00000 | 0.0001 |
| (0.0001) | (0.0001) | (0.0001) | (0.0001) | (0.0002) | (0.0001) | |
| Observations | 2558 | 2558 | 2558 | 2558 | 2558 | 2558 |
| R | 0.839 | 0.852 | 0.860 | 0.846 | 0.587 | 0.861 |
| Adjusted R | 0.838 | 0.852 | 0.860 | 0.845 | 0.586 | 0.860 |
Note: This table illustrates the effect of the five Fama–French factors in explaining the portfolio returns. Herein, ** p < 0.05; *** p < 0.01.
Table 16.
Fama–French Regression Results including GMB for Europe.
| Dependent Variable: | ||||||
|---|---|---|---|---|---|---|
| Portfolio Return | ||||||
| Naive | ESG-A4 | ESG-A4 | TRESG | TRESG | Value | |
| Mkt.RF | 0.647 *** | 0.659 *** | 0.639 *** | 0.661 *** | 0.588 *** | 0.623 *** |
| (0.011) | (0.012) | (0.012) | (0.012) | (0.025) | (0.011) | |
| SMB | −0.425 *** | −0.504 *** | −0.779 *** | −0.455 *** | −0.787 *** | −0.640 *** |
| (0.026) | (0.027) | (0.028) | (0.027) | (0.056) | (0.025) | |
| HML | −0.114 *** | 0.060 ** | 0.027 | 0.055 * | −0.003 | −0.085 *** |
| (0.027) | (0.028) | (0.030) | (0.029) | (0.060) | (0.027) | |
| RMW | −0.245 *** | −0.350 *** | −0.435 *** | −0.347 *** | −0.216 ** | −0.302 *** |
| (0.040) | (0.042) | (0.045) | (0.042) | (0.089) | (0.039) | |
| CMA | −0.407 *** | −0.460 *** | −0.442 *** | −0.463 *** | −0.639 *** | −0.431 *** |
| (0.036) | (0.037) | (0.040) | (0.037) | (0.079) | (0.035) | |
| GMB | −0.199 *** | −0.206 *** | −0.095 *** | −0.218 *** | −0.115 ** | −0.246 *** |
| (0.024) | (0.025) | (0.027) | (0.025) | (0.054) | (0.024) | |
| Constant | 0.0002 ** | 0.0003 *** | 0.0003 ** | 0.0003 *** | −0.00001 | 0.0001 |
| (0.0001) | (0.0001) | (0.0001) | (0.0001) | (0.0002) | (0.0001) | |
| Observations | 2558 | 2558 | 2558 | 2558 | 2558 | 2558 |
| R | 0.843 | 0.856 | 0.861 | 0.850 | 0.588 | 0.866 |
| Adjusted R | 0.842 | 0.855 | 0.860 | 0.850 | 0.587 | 0.866 |
Note: This table illustrates the effect of the five Fama–French factors and GMB in explaining the portfolio returns. Herein, ∗ p < 0.1; ∗∗ p < 0.05; ∗∗∗ p < 0.01.
Publisher’s Note: MDPI stays neutral with regard to jurisdictional claims in published maps and institutional affiliations. |
© 2021 by the authors. Licensee MDPI, Basel, Switzerland. This article is an open access article distributed under the terms and conditions of the Creative Commons Attribution (CC BY) license (https://creativecommons.org/licenses/by/4.0/).
Share and Cite
MDPI and ACS Style
Amon, J.; Rammerstorfer, M.; Weinmayer, K. Passive ESG Portfolio Management—The Benchmark Strategy for Socially Responsible Investors. Sustainability 2021, 13, 9388. https://doi.org/10.3390/su13169388
AMA Style
Amon J, Rammerstorfer M, Weinmayer K. Passive ESG Portfolio Management—The Benchmark Strategy for Socially Responsible Investors. Sustainability. 2021; 13(16):9388. https://doi.org/10.3390/su13169388
Chicago/Turabian StyleAmon, Julian, Margarethe Rammerstorfer, and Karl Weinmayer. 2021. "Passive ESG Portfolio Management—The Benchmark Strategy for Socially Responsible Investors" Sustainability 13, no. 16: 9388. https://doi.org/10.3390/su13169388
Note that from the first issue of 2016, this journal uses article numbers instead of page numbers. See further details here.