Article

Efficient Ranking-Based Whale Optimizer for Parameter Extraction of Three-Diode Photovoltaic Model: Analysis and Validations

1
Department of Computer Science, Faculty of Computers and Informatics, Zagazig University, Zagazig 44519, Egypt
2
Electrical Power and Machines Department, Faculty of Engineering, Zagazig University, Zagazig 44519, Egypt
3
Department of Statistics and Operations Research, College of Science, King Saud University, Riyadh 11451, Saudi Arabia
4
Department of Mathematics, Faculty of Science, Mansoura University, Mansoura 35516, Egypt
5
Department of Computational Mathematics, Science, and Engineering (CMSE), College of Engineering, Michigan State University, East Lansing, MI 48824, USA
*
Author to whom correspondence should be addressed.
Energies 2021, 14(13), 3729; https://doi.org/10.3390/en14133729
Submission received: 24 April 2021 / Revised: 17 June 2021 / Accepted: 18 June 2021 / Published: 22 June 2021
(This article belongs to the Section F5: Artificial Intelligence and Smart Energy)

Abstract

:
Efficient and accurate estimations of unidentified parameters of photovoltaic (PV) models are essential to their simulation. This study suggests two new variants of the whale optimization algorithm (WOA) for identifying the nine parameters of the three-diode PV model. The first variant abbreviated as RWOA is based on integrating the WOA with ranking methods under a novel updating scheme to utilize each whale within the population as much as possible during the optimization process. The second variant, namely HWOA, has been based on employing a novel cyclic exploration-exploitation operator with the RWOA to promote its local and global search for averting stagnation into local minima and accelerating the convergence speed in the right direction of the near-optimal solution. Experimentally, RWOA and HWOA are validated on a solar cell (RTC France) and two PV modules (Photowatt-PWP201 and Kyocera KC200GT). Further, these proposed variants are compared with five well-known parameter extraction models in order to demonstrate their notable advantages over the other existing competing algorithms for minimizing the root mean squared error (RMSE) between experimentally measured data and estimated one. The experimental findings show that RWOA is superior in some observed cases and superior in the other cases in terms of final accuracy and convergence speed; yet, HWOA is superior in all cases.

1. Introduction

The conversion of solar energy using photovoltaic (PV) systems plays a significant role in providing a cost-effective renewable alternative energy source [1]. Key to the successful deployment of the PV system is the ability to create an optimal design to achieve the requirements at a defined level of availability with the lowest possible cost [2]. To achieve that, the PV systems must be modeled, formulated, and simulated accurately using a PV model, which models the current-voltage (I-V) and the power-voltage (P-V) characteristics of the PV system under various operations conditions [3].
PV systems can be modeled using a single-diode model (SDM), a double-diode model (DDM), and a triple-diode model (TDM). Despite the simplicity of SDM, its performance deteriorates with temperature deviation and low irradiance levels [4]. Therefore, DDM has been proposed to overcome this problem by adding another diode to recombine current and other non-idealities of the solar cell [5]. Due to the anomalies that occur through the recombination process in DDM [5], the TDM [6] has been developed recently for overcoming this drawback to improve the model’s accuracy. TDM adds another diode in parallel with the diodes of the DDM to overcome the defects of the recombination process in DDM. Although TDM results in significant improvement in the performance of PV models, it has nine unknown parameters that must be extracted accurately and efficiently to utilize the PV model optimally. This motivates us to propose a new parameter extraction method to estimate accurately those nine unknown parameters.
To assure higher performance for PV systems, the unknown parameters of the used model must be extracted accurately and efficiently. In the literature, several methodologies have been suggested for addressing parameter estimation of PV models such as numerical [7,8], analytical [9], and optimization methods [10,11]. Analytical and numerical methods are not useful for defining the parameters of the PV model, due to the problem of having such a large search space. Consequently, optimization methods have been extensively used to replace classical methods to achieve better outcomes for the multi-modal and nonlinear PV models [2]. The most significant of those optimization methods are reviewed in the remainder of this section.
By Wei, T. [12], particle swarm optimization (PSO) was shown to be useful for estimating the parameters of TDM of organic solar cells. El-Hameed [13] adapted the manta-rays foraging optimizer for determining the unknown parameters of the TDM, which was validated on two test cases, involving Kyocera polycrystalline KC200GT and Ultra 85-P under different changeable conditions. The moth-flame optimization (MFO) algorithm [14] was suggested for extracting the unknown parameters of TDM and compared with a number of optimization algorithms: differential evolution with integrated mutation per iteration (DEIM) and flower pollination (FPA) algorithms.
Elazab [15] adapted the grasshopper optimization algorithm for estimating the parameters of TDM and was validated on two modules: Kyocera KC200GT and Solarex MSX-60 PV cells. Number of other algorithms have been suggested for addressing parameter identification for the TDM, such as coyote optimization algorithm [16], Harris hawks optimization (HHO) algorithm [10], and fractional chaotic ensemble PSO [17].
Recently, a whale optimization algorithm (WOA) [18]—inspired by the behaviors of the whales when attacking their prey—has been proposed for tackling the global optimization problem. WOA has proved its efficiency in solving several optimization problems [18,19], but it still suffers from some drawbacks:
  • Slow convergence toward the best solution because of the distance control factor that reduces gradually with the iterations;
  • Using the current positions in the next generation, even if it is worse, may reduce the probability of getting to better solutions;
  • After half the maximum iterations, the exploration operator will be terminated and hence stagnation inside local minima is inevitable if the best-so-far solution is so.
Therefore, to overcome those limitations, this paper improves the WOA by a ranking method with a novel updating methodology to help the algorithm in accelerating convergence toward the best-so-far solution. Additionally, memory saving is used with the WOA to save the best solution obtained by each whale in order to use that solution within the next generations to search around it for better solutions. Those two improvements: Ranking strategy and memory saving are integrated with a new variant of the classical WOA named RWOA. Finally, a cyclic exploration-exploitation strategy is here proposed to promote both the local search and global search of the RWOA for further better outcomes under a new variant of RWOA called HWOA. The proposed algorithms, abbreviated as RWOA and HWOA, are validated on three PV modules based on TDM and observed with some well-known optimization algorithms to confirm their superiority in accurately extracting the parameters of the TDM at varied irradiance and temperature levels. The list of contributions within this paper are:
  • Proposing a new updating scheme to replace the unbeneficial solutions under the ranking method for reducing the probability of stagnation into local optimal and then integrating the WOA with this strategy in a variant named RWOA to utilize each solution within the optimization process as possible;
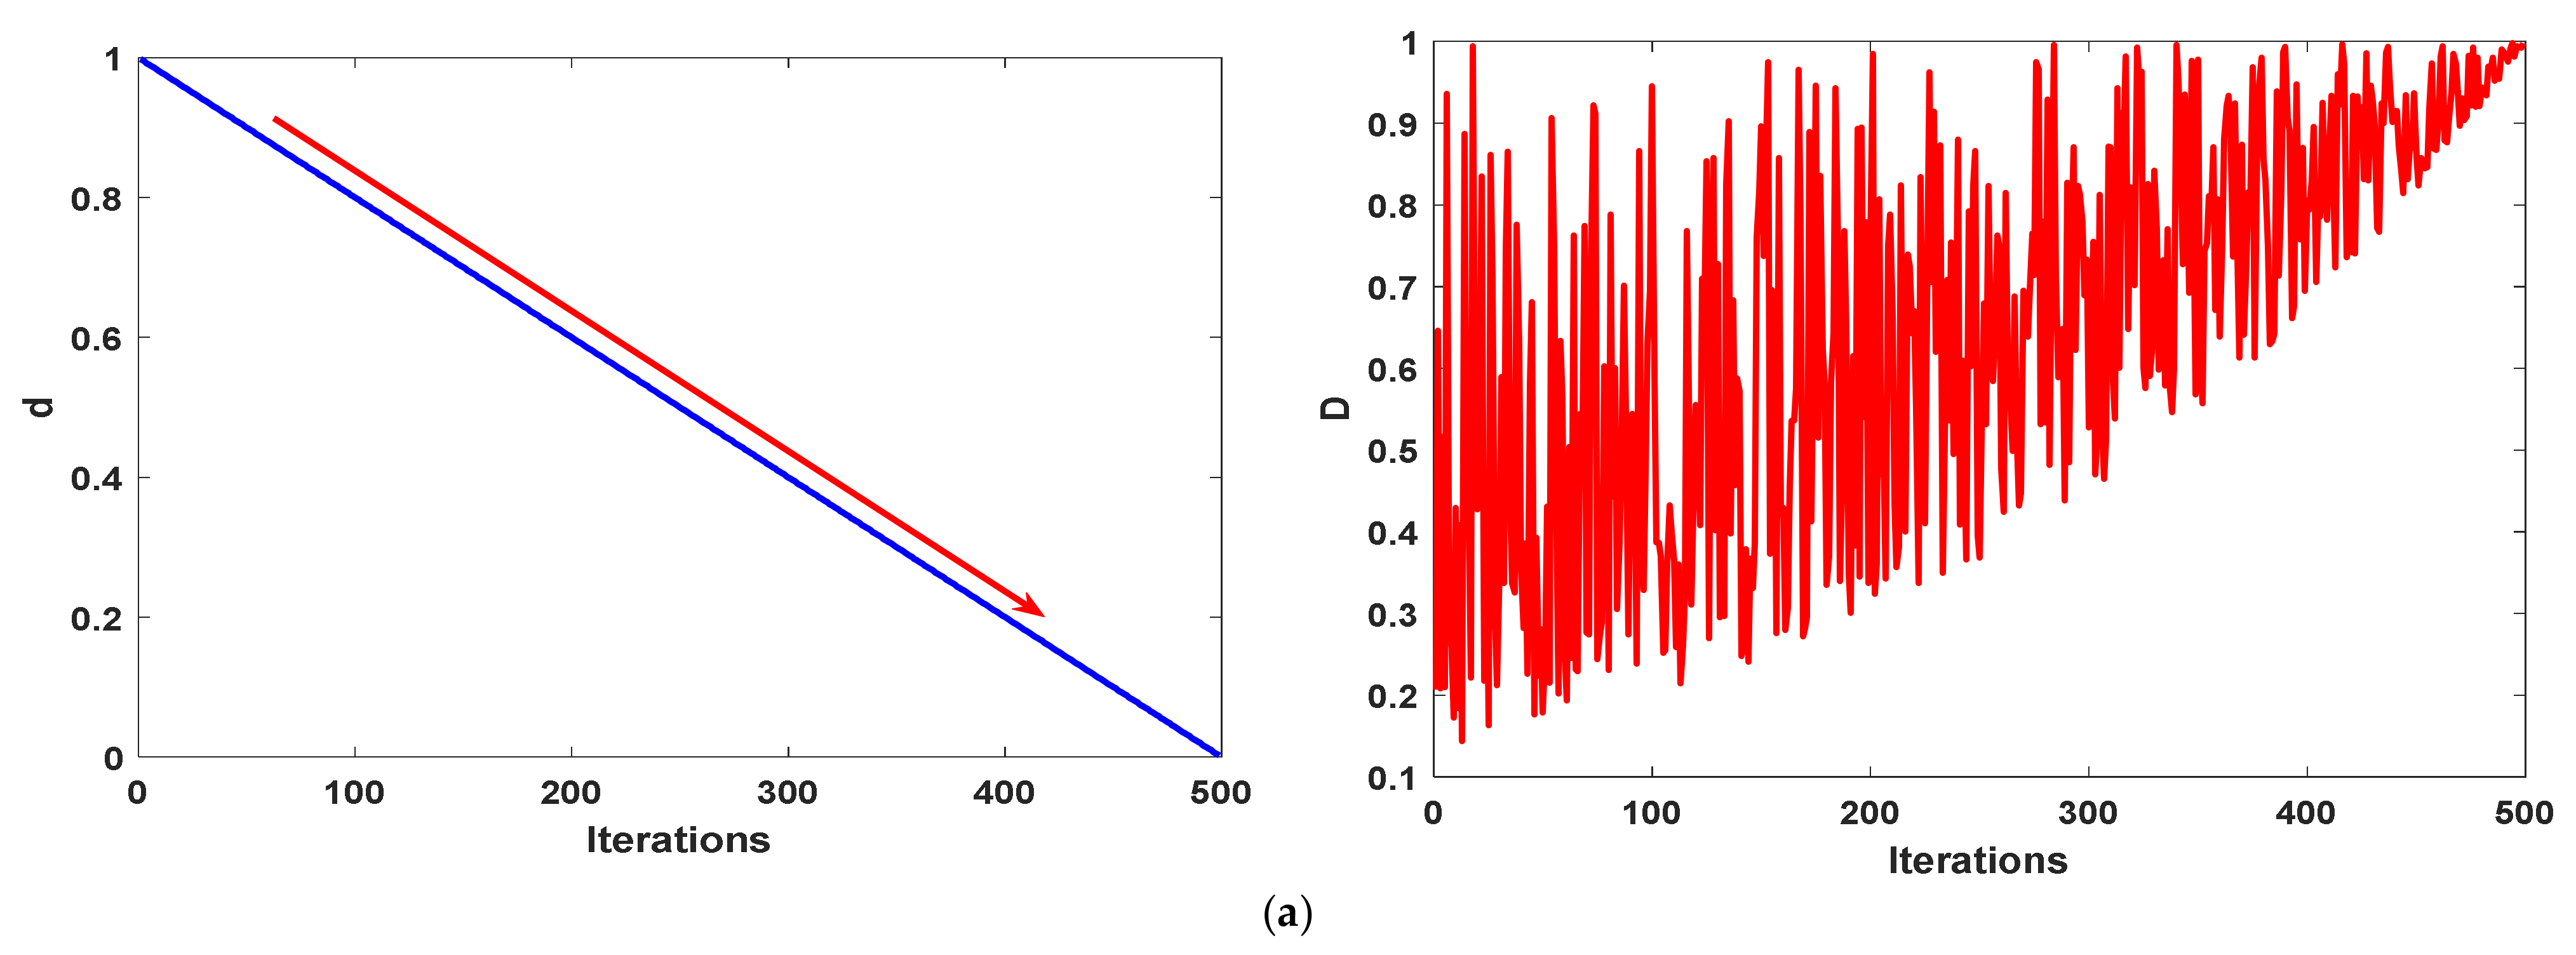
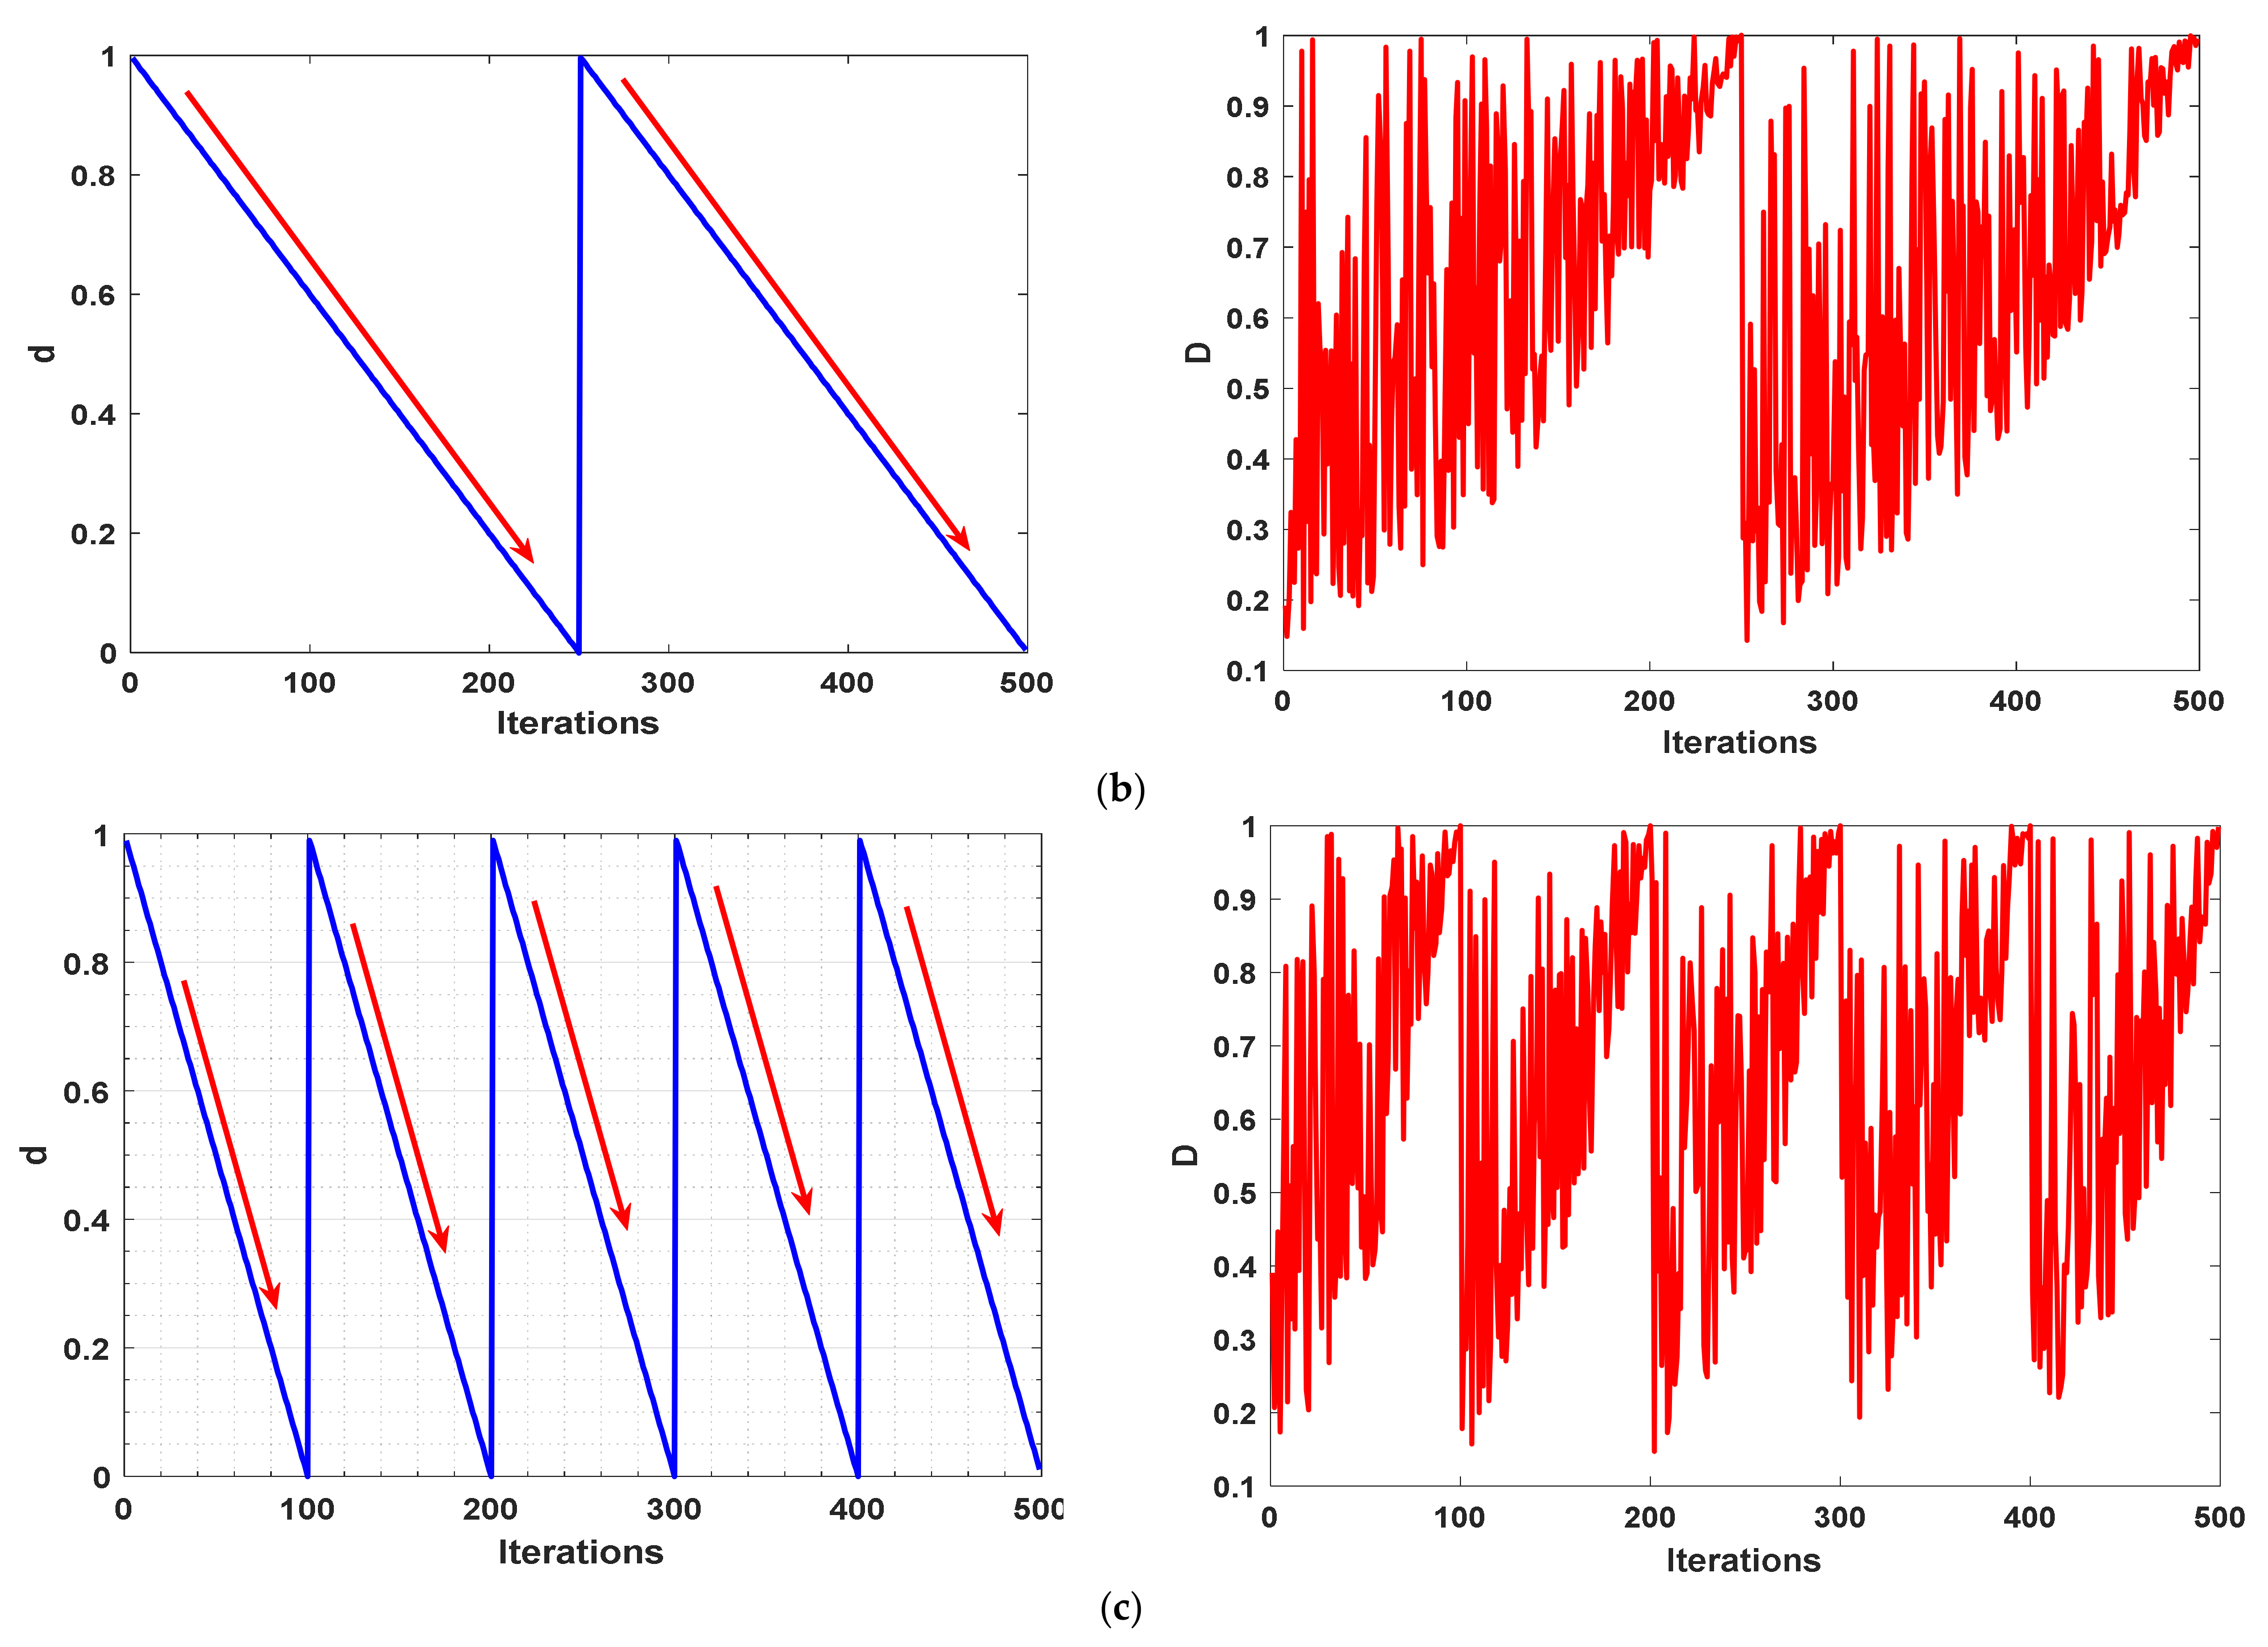
  • Developing a novel strategy called a cyclic exploration and exploitation strategy to promote both local and global search of the RWOA for reaching further better outcomes in a new variant of RWOA called HWOA;
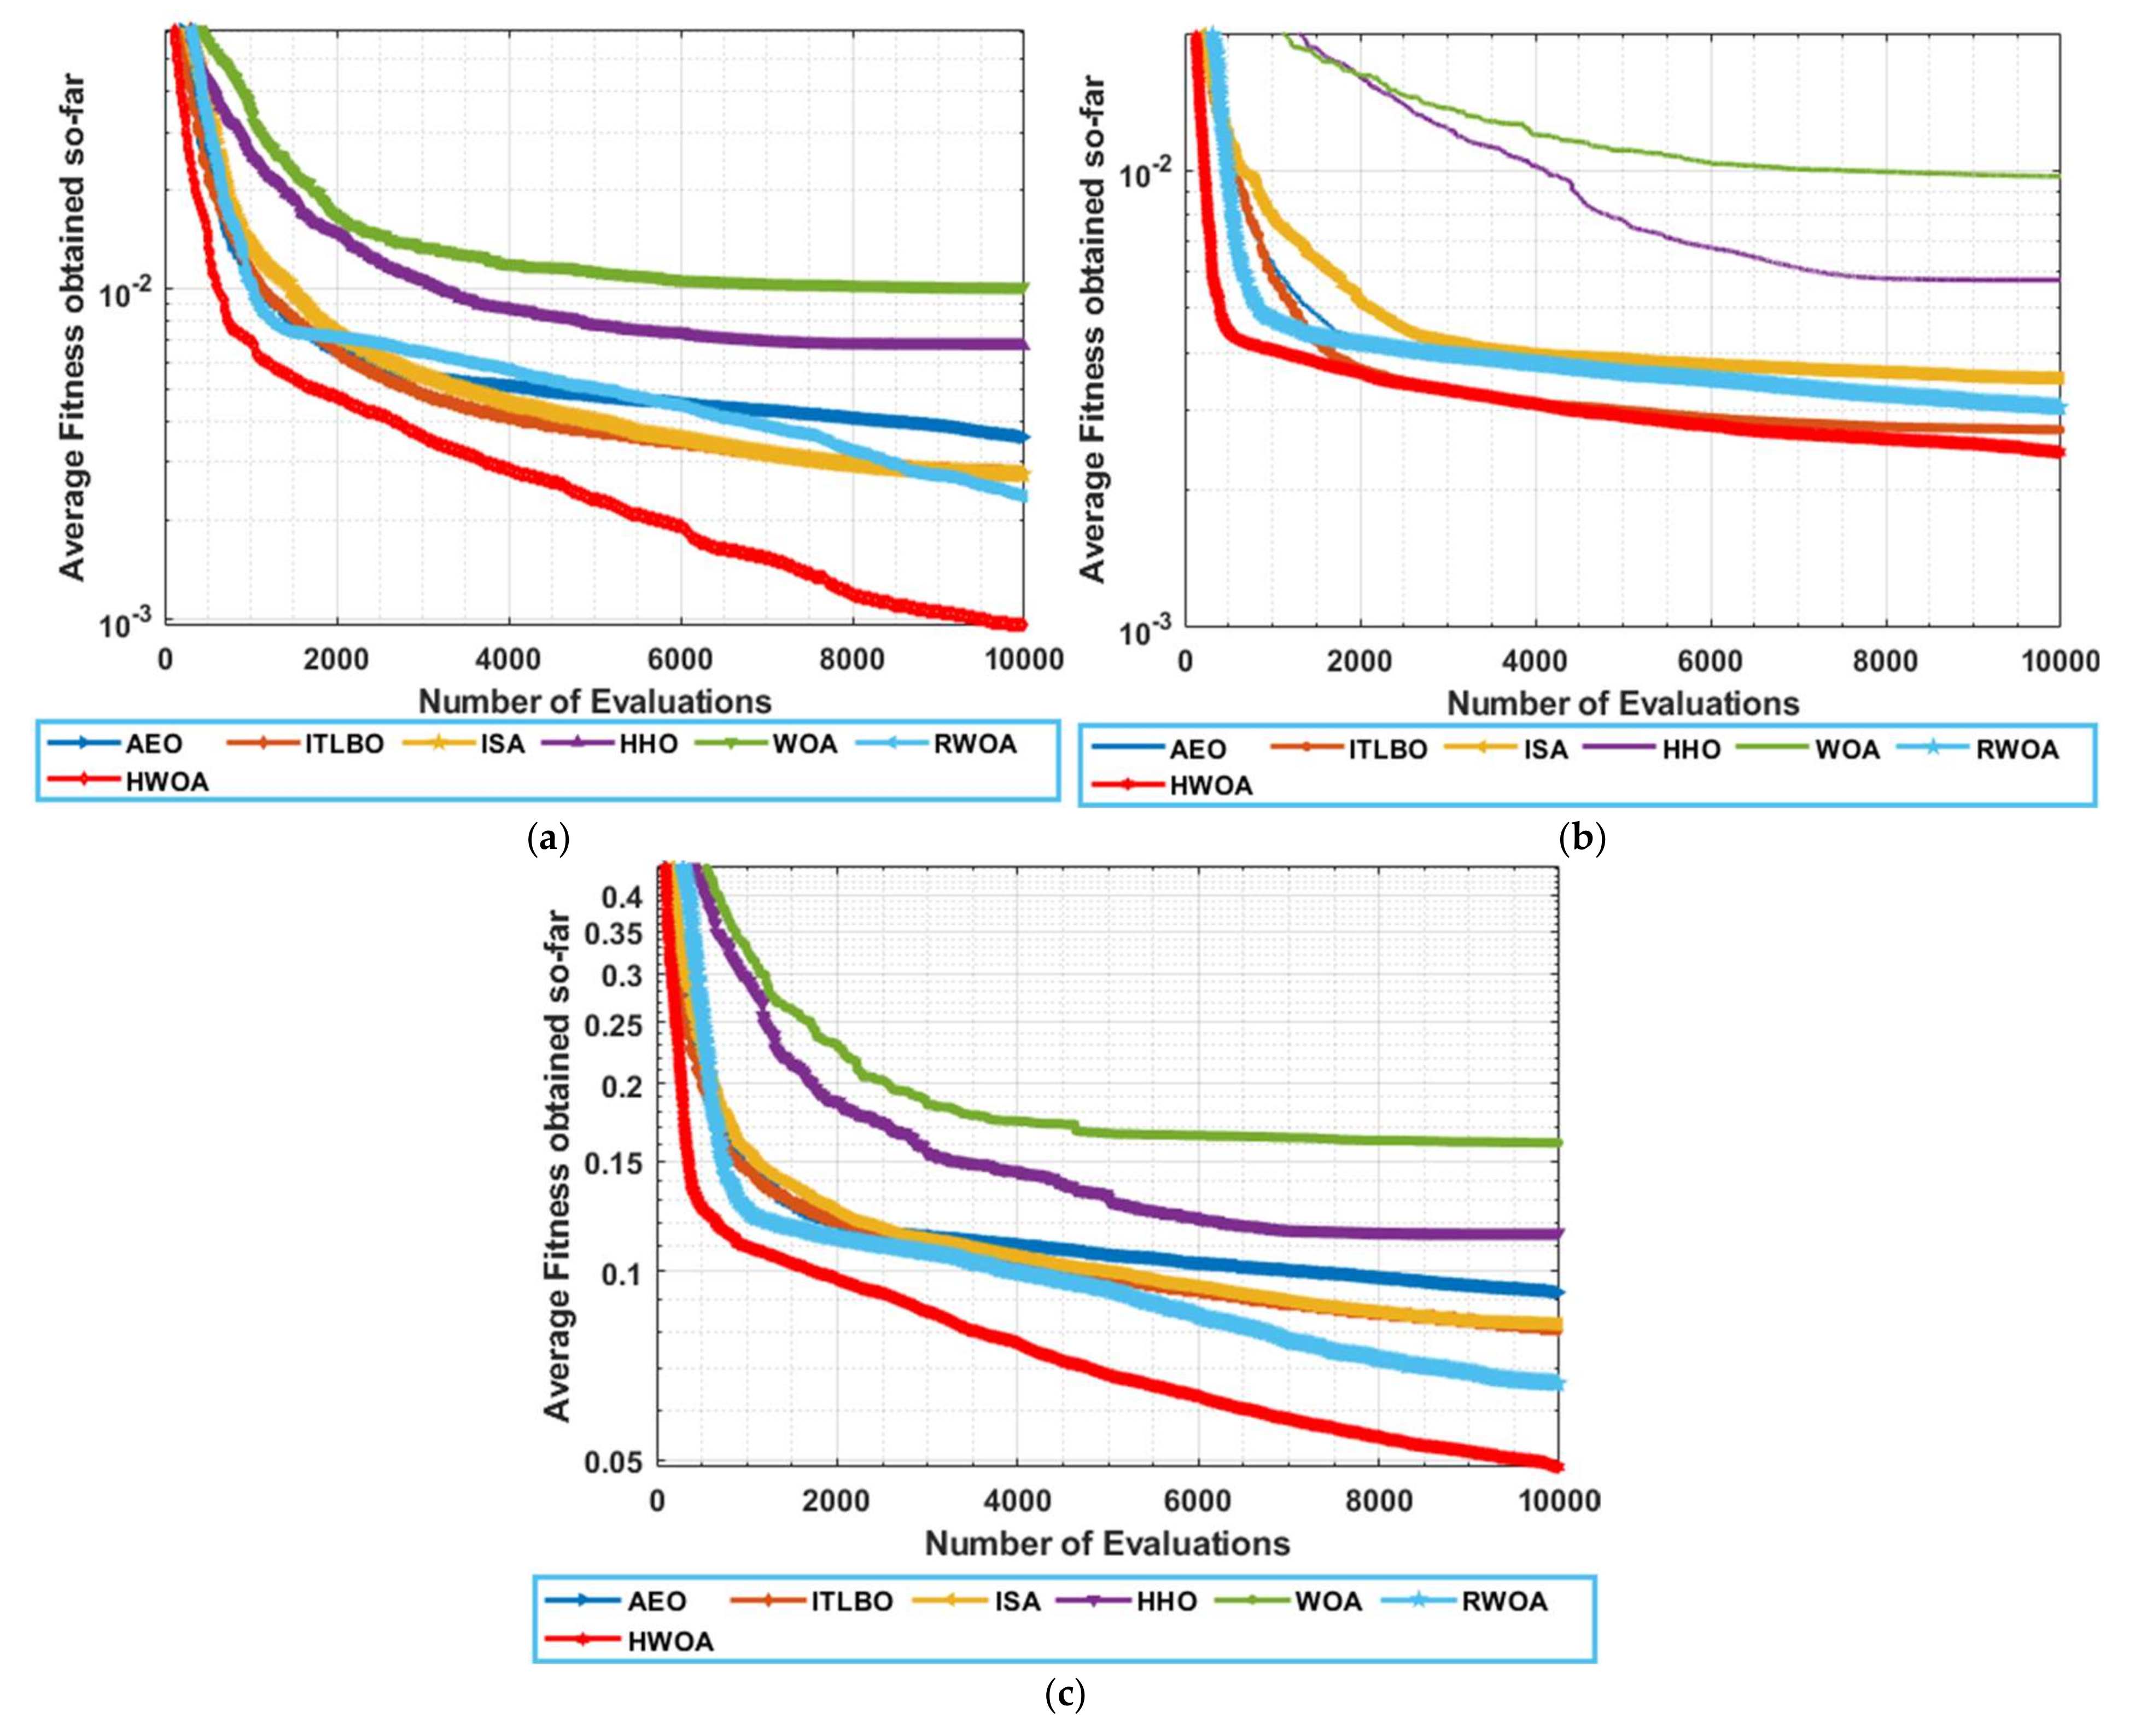
  • Our findings show that RWOA is competitive in some cases and superior in the others in terms of final accuracy and convergence speed compared to five well-established algorithms for estimating the unknown parameters of RTC France and two PV modules (Photowatt-PWP201 and Kyocera KC200GT); however, the HWOA can be superior in all cases.
The remainder of this study is structured as in Section 2, the mathematical model of TDM is described, Section 3 describes the proposed work, Section 4 elaborates the experimental settings, Section 5 describes the experiment outcomes and comparison, and finally, some conclusions, in addition to the future suggestions are presented in Section 6.

2. Mathematical Formulation of the Three-Diode Model

The TDM comprises a photo-current source, Iph, three parallel diodes, a shunt resistor Rsh, and series resistance, Rs, as illustrated in Figure 1.
Mathematically, the TDM can be expressed as follows:
I = I p h i 3 I D , i I s h
where I D , i is the current in the ith diode, I s h is the current in R s h ; and I defines the current in Rs.
The diode and shunt currents can be modeled as follows:
I D , i = I s d i e q V + I R s N s a i K T 1     i 1 : 3 ,   I s h = V + I R s R s h
where I s d i is the saturation current for ith diode; a i is the ith diode ideality factor; K is Boltzmann’s Constant 1.3806503 × 10 23   J / K ; the electron charge is symbolized as q and equals 1.60217646 × 10 19   C ; NS is the number of cells connected in series; V expresses the output voltage of the solar cell, and T is the cell temperature in kelvin (K). Substituting Equation (2) into Equation (1):
I = I p h I s d 1 e q V + I R s N s a 1 K T 1 I s d 2 e q V + I R s N s a 2 K T 1 I s d 3 e q V + I R s N s a 3 K T 1 V + I R s R s h
However, unfortunately, Equation (3) involves nine unknown parameters: I p h ,   I s d 1 , I s d 2 , I s d 3 ,   R s , R s h , a 1 ,   a 2 , and   a 3 that must be estimated accurately and efficiently to improve the performance of the PV model. Extracting those parameters defines the core objective of this research.

3. Proposed Approaches: RWOA and HWOA

Recently, Mirjalili [18] has proposed a nature-inspired-based metaheuristic algorithm called the WOA for tackling continuous optimization problems. This algorithm is based on the behaviors of whales when searching for and attacking their prey. The mathematical model of the WOA according to [18] is formulated in the following subsection.

WOA, Overview

The behavior of the whales for foraging their prey is called bubble-net foraging and consists of two strategies:
  • The first strategy is based on using a spiral shape to spin around their prey;
  • The second uses a shrinking circle—called an encircling mechanism—to attack the prey.
WOA switches between those two strategies to update its position with a probability of 50%. Mathematically, the encircling mechanism is described as:
W t + 1 = W t A ×   D
A = 2 a ×   r a
a = 2 2 t t m a x
D = C ×   W t W t  
C = 2 × r
W indicates the current position vector, t is the current evaluation, W is the best-so-far vector, r is a random vector created at the range of 0 and 1, t m a x refers to the maximum evaluations, || is used to convert negative values into positive ones, and a is a parameter used to control in the exploration and exploitation operator, and linearly decreased from 2 to 0. The mathematical formula for the spiral model is as follows:
W t + 1 = W t + D × e l b × cos 2 π l
D = W t W t  
where b is a fixed value to depict the logarithmic spiral shape. For exploring most of the regions within the defined lookup boundary of the problem, WOA used another formula to update the position of the current whale in a direction of another one selected randomly from the population:
W t + 1 = W t A × D
D = C × W r t W t  
where W r is the randomly selected whale. The WOA tradeoff is between moving toward the randomly selected one and the best according to A: if |A| is greater than 1, then the current whale is moved toward the random one; otherwise, it is moved toward the best one. The standard WOA has the following limitations:
  • Low premature convergence toward the best solution;
  • Local minima problem.
Therefore, for application to the estimation of unknown parameters of the TDM, improvements to the standard WOA are incorporated as follows:
  • Each whale in the population is used as much as possible based on the ranking method suggested in [20];
  • The whales selected using the previous method are replaced by a novel formula to accelerate convergence;
  • Memory saving is used to avoid reducing the diversity between the individuals of the population and subsequently reducing the probability of becoming trapped into local minima;
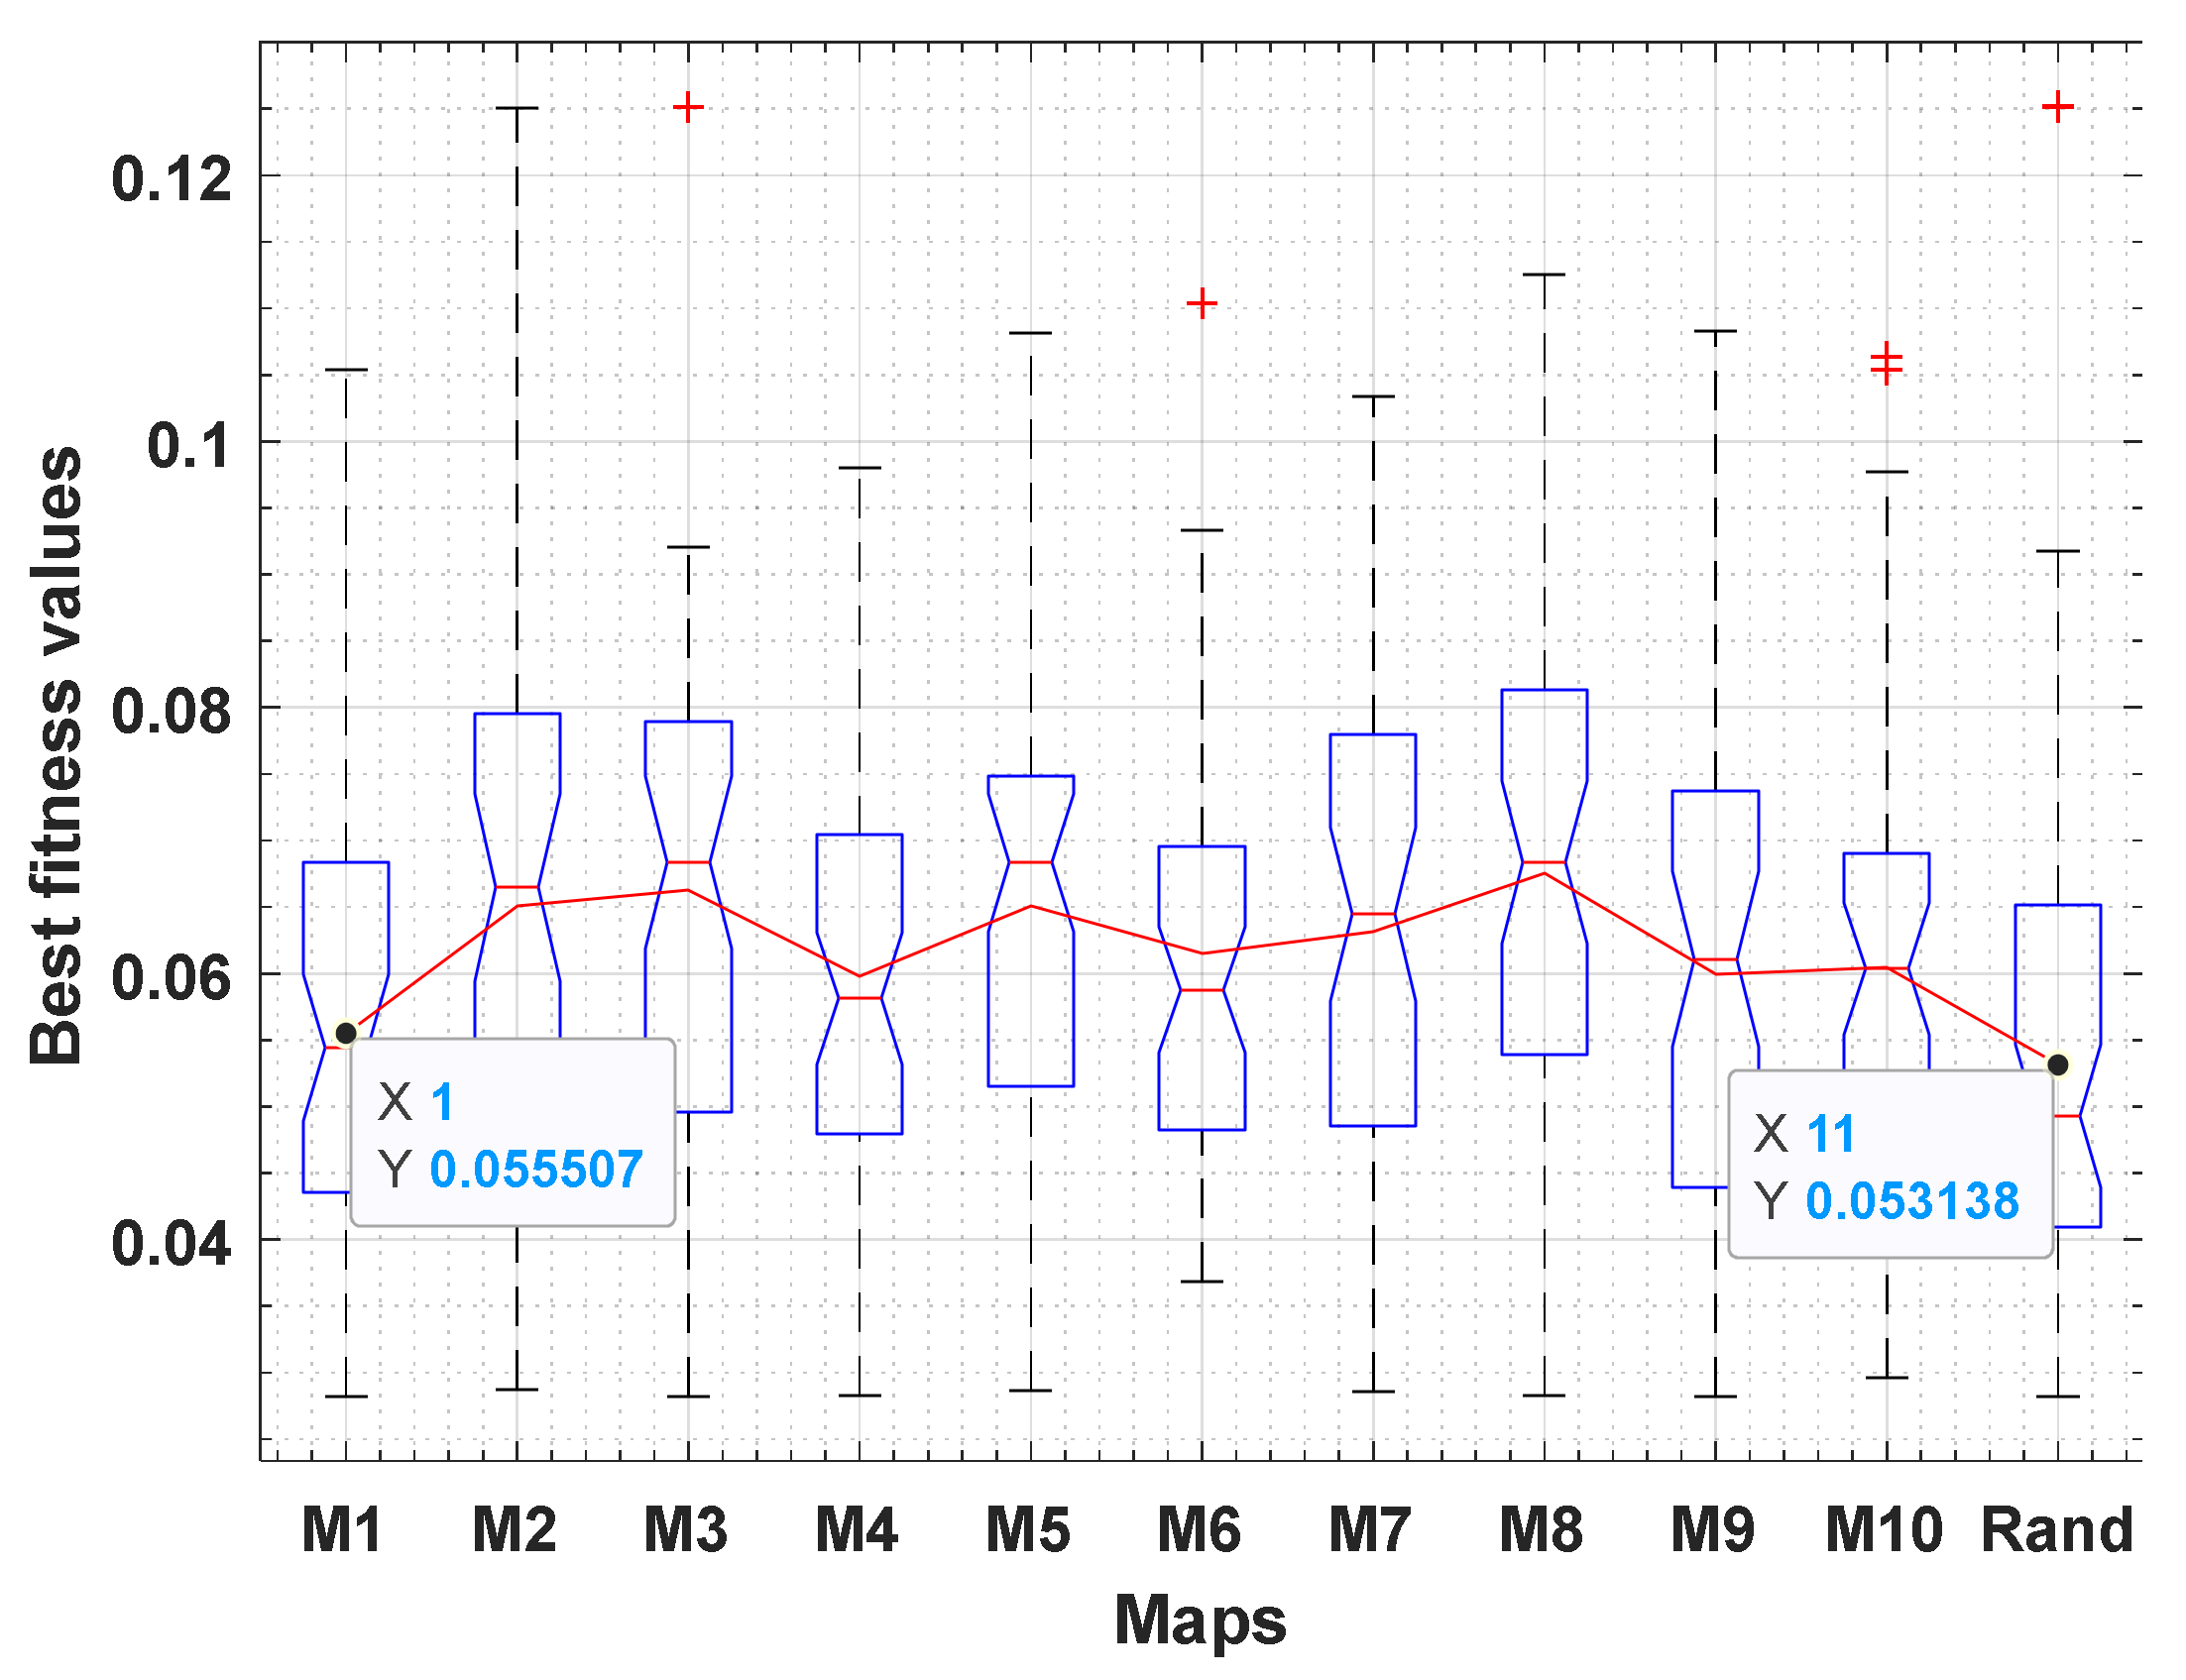
  • Finally, to distribute the whales efficiently within the boundary of the optimization problem, ten chaotic maps are investigated for their suitability to be incorporated in the proposed approach.
Firstly, the ranking method proposed in [21] replaces whales that failed in finding better solutions than the current local best one within a successive number of iterations with other solutions to help the algorithm to reach better outcomes. In the work of [21], those whales are replaced with solutions created between the current positions and the best-so-far solution. However, the updated solutions generated using the scheme proposed in [21] might take the algorithm to local minima if the best-so-far solution is so; therefore, in this research, another way for replacing those unbeneficial solutions to accelerate the convergence with avoiding stagnation into local minima is proposed and its mathematical model is as follows:
W t + 1 = W t + r × W r 1 t W r t
C F = 1 e t t m a x × r 1 × C C
W t + 1 = W t + C F × W t W r t
where CC is a fixed value to determine the length of the step size between the current and the best solution obtained even now; if this value is large, then the step size is large, and vice versa. r 1 and r are two indices of two randomly selected solutions from the population. r is a random vector generated between 0 and −1. In Equation (13), the step size between the two randomly picked solutions is generated randomly. Therefore, if this step size is small, then the current solution will be moved to a position so near to the best solution even now and subsequently, a large number of the solutions between the current and the best-so-far that may be more beneficial than the current will be skipped. Furthermore, if the best-so-far solution is local minima, premature convergence to it may reduce the possibility of reaching a better solution. Therefore, in Equation (15), a convergence factor (CF) is generated according to Equation (14) and is utilized to gain control over the step size generated between the randomly selected and the best solutions. In Figure 2, different scenarios for CF under various CC values are depicted. This figure shows that, with increasing the value of CC, CF values are increased to generate enough large step sizes enabling the algorithm of avoiding stagnation into local minima which might be caused by the randomization search. Switching between Equations (13) and (15) is based on a convergence probability (CP) elaborated in the parameter settings section.
W t + 1 = u p d a t i n g   u s i n g   13 ,       i f   r 2 C P u p d a t i n g   u s i n g   14 ,       o t h e r w i s e
Finally, to evaluate the quality of each solution when estimating the parameters of the TDM, the root means squared error (RMSE) is used as the objective function between the measured current and the simulated current computed by solving the non-linear equation using the Newton–Raphson method:
R M S E = f X i = k = 1 M I m I e V e ,   X i 2 M  
where M is the size of the measured data, I m is the measured current, X i is the extracted parameters of the i t h whale, and I e is the simulated current computed under the extracted parameters and the Newton–Raphson [22] as follows:
I e n + 1 = I e n f f
where f is the function of I (Equation (3)), and f is the first derivative of f with respect to I, and n is number of iterations used with the Newton–Raphson method.
Algorithm 1 elaborates the steps of the initialization of the proposed approach, where taking the number of whales N, the number of unknown parameters d, the lower bound (LB), and upper bound (UB) of the search space as inputs. Finally, Algorithm 2 describes the steps of the suggested algorithm called the ranking-based WOA (RWOA) to address the parameter extraction problem of the TDM.
Algorithm 1 Initialization (N, d, LB, UB)
1. create an array W of size N   X   d
2. //initialization
3. for i = 1: N
4. for j = 1: d
5. create a random number r between 0 and 1;
6. W (i + 1, j) = LB(j) + r × (UB(j) − LB(j));
7. end for
8. end for
9. Return W.
Algorithm 2 The Steps of RWOA
1.      Calling initialization (N, d, LB, UB)
2.       O W = W i .
3.       f : Evaluate the fitness of W using Equation (17).
4.       o f = f , set the current fitness values in a vector called old fitness, o f .
5.       R : is a ranking vector of N cells with an initial value 0
6.      Find the best whale W
7.       t = 1
8.      while ( t < t m a x )
9.      for each i whale
10. Update a, A, p, C, and l
11. if ( p < 0.5 )
12. if ( | A | < 1 )
13. Update W i t + 1   using Equation (4)
14. else
15. Update W i t + 1   using Equation (11)
16. end if
17. else
18. Update W i t + 1 using Equation (9)
19. end if
20. If    R i > N I
21. Calculate C F using Equation (14)
22. Update W i using Equation (16)
23. End
24. If  f i <   o f
25.  o f i = f i
26.  O W i = W i
27.  R i = 0
28. Else
29.  W i = O W i
30.  R i + +
31. End
32.  f i : Calculating the fitness of the W i using Equation (17)
33. end for
34. Update the best whale W with W t + 1 if better
35.  t ++
36. end while.
The RWOA seeks to improve the exploitation operator of the standard WOA, but still, both exploration and exploitation operators need further improvement. Therefore, herein, another improvement has been proposed to help the RWOA to explore the search space as a new attempt to accelerate the convergence speed with averting stagnation into local minima. Specifically, this improvement is based on two folds swapped randomly with each other within the optimization process to promote the searchability of the proposed: the first fold is based on searching around the best-so-far solution with a step size generated based on the difference between two solutions selected randomly from the population as described mathematically in Equation (19) (exploitation operator), and the second one formulated in Equation (20) exploring area between two randomly selected solutions from the population (exploration one).
W t + 1 = W t + D × W r 2 t W r 3 t ,                   i f   f W r 2 t < f W r 3 t W t + D × W r 3 t W r 2 t ,                   i f   f W r 3 t f W r 2 t
W t + 1 = W r 3 t + D × W r 2 t W r 3 t ,                   i f   f W r 2 t > f W r 3 t W r 2 t + D × W r 3 t W r 2 t ,                   i f   f W r 3 t f W r 2 t
d = t m a x t % t m a x T / t m a x T
D = e 2 d r 4
where r 2 , r 3 , and r 4 are three indices randomly picked from the population size, meanwhile T is a cyclic control factor utilized to determine the iterations’ slice whereas the scale will be restarted again to 1 after completing this slice, and within it, the scale will be linearly decreased from 1 to 0 to balance the exploration and exploitation operators. Different scenarios for T and the corresponding outcomes for d and D factors are depicted in Figure 3. From this figure, it is obvious that when T = 1, the algorithm will take a one-way to search for a better solution by starting with a scale value of 1 decreased linearly to 0 even with the completion of the optimization process. On the contrary, when T > 1 , the scale factor will be again restarted to 1 after a while, and subsequently, the algorithm will vary the scale values within the optimization process, as such, if the near-optimal solution is near or far and far away from the current solution, the various small- and large-scale values within the whole optimization process might quickly find it to accelerate the convergence speed. This proposed method is called a cyclic exploration-exploitation strategy (CEES). Finally, this strategy is effectively integrated with RWOA as shown in Algorithm 3 to propose a new variant called HWOA.
Algorithm 3 The Steps of HWOA
1.      Calling initialization (N, d, LB, UB)
2.       O W = W i .
3.       f : Evaluate the fitness of W using Equation (17)
4.       o f = f , set the current fitness values in a vector called old fitness, o f
5.       R : is a ranking vector of N cells with an initial value 0
6.      Find the best whale W
7.       t = 1
8.      while ( t < t m a x )
9.      for each i whale
10. Update a, A, p, C, and l
11. if ( p < 0.5 )
12. if ( | A | < 1 )
13. Update W i t + 1   using Equation (4)
14. else
15. Update W i t + 1   using Equation (11)
16. end if
17. else
18. Update W i t + 1 using Equation (9)
19. end if
20. If    R i > N I
21. Calculate C F using Equation (14)
22. Update W i using Equation (16)
23. End
24.  f i : Calculating the fitness of the W i using Equation (17)
25. end for
26. for each i whale
27.  r 1 ,   r 2 : Generate two random numbers between 0 and 1.
28. if  r 1 < r 2
29. Update W i t + 1 using Equation (19)
30. else
31. Update W i t + 1 using Equation (20)
32. end if
33. if  f i <   o f
34.  o f i = f i
35.  O W i = W i
36.  R i = 0
37. else
38.  W i = O W i
39.  R i + +
40. end
41. end for
42. Update the best whale W with W t + 1 if better.
43.  t ++
end while.

4. Experimental Settings

The proposed RWOA and HWOA methods are experimentally utilized to define the nine unknown parameters of an SC: RTC France [23] and two different PV modules: Photowatt-PWP201 module [24], and Kyocera KC200GT [16]. Those three models are experimentally tested in this paper to extract their optimal parameter values at standard operating conditions. Additionally, to check the performance of the proposed at various temperatures and irradiance levels, Kyocera KC200GT is used to do that. The upper and lower boundaries for the unidentified parameters of those modules are given per cell in Table 1 as used widely in the literature [13].
In addition, to show the superiority of the proposed algorithms: HWOA and RWOA, an extensive comparison is conducted between them and some robust recent optimization algorithms recently proposed for tackling the parameter estimation problems of the photovoltaic models. Those algorithms are executed according to their parameters in the cited papers, with the difference that N and t m a x are respectively set to 50 and 10,000, to ensure an equitable comparison. The investigated algorithms are artificial ecosystem-based optimization (AEO, 2020) [23], improved teaching-learning-based optimization (ITLBO, 2019) [20], Interior Search Algorithm (ISA, 2020) [25], HHO (2020) [10], and WOA (2016) [18]. The experiments are developed using MATLAB R2019a with 30 independent trials for each algorithm.
Besides, 10 well-known chaotic maps are experimented to identify if they will affect the performance of the RWOA or not; those chaotic maps are Chebyshev (M1), Circle (M2), Gauss (M3), Iterative (M4), Logistic (M5), Piecewise (M6), Sine (M7), Singer (8), Sinusoidal (M9), and Tent (M10) [26]. The experiments illustrated in Figure 4 which shows the comparison of the different chaotic maps and the randomization (Rand) based on the uniform normal distribution on the Kyocera KC200GT elaborates that using the randomization to distribute the solutions within the search space is better than all observed chaotic maps.
Three parameters should be tuned efficiently to reach the near-optimal performance of RWOA and HWOA: CC, CP, and T, which are set to 9, 0.1, and 5, respectively, according to the experiments conducted on the Kyocera KC200GT and depicted in Figure 5, Figure 6 and Figure 7, respectively. Figure 5 presents the outcomes under various CC values to show the optimal value for it. After witnessing this figure, it is clear that the performance of the algorithm is significantly improved after a value of 4 even reaching the optimality when 9. Concerning the parameter CP, Figure 6 shows that the best value for this parameter is of 0.1 and that the performance is significantly converged even at the value of 0.2, and when higher than that, the performance is significantly degraded. The parameter T is tuned in Figure 7, from which it is shown that the performance of the algorithm is significantly competitive after 2, but a value of 5 has a simple improvement on the performance.

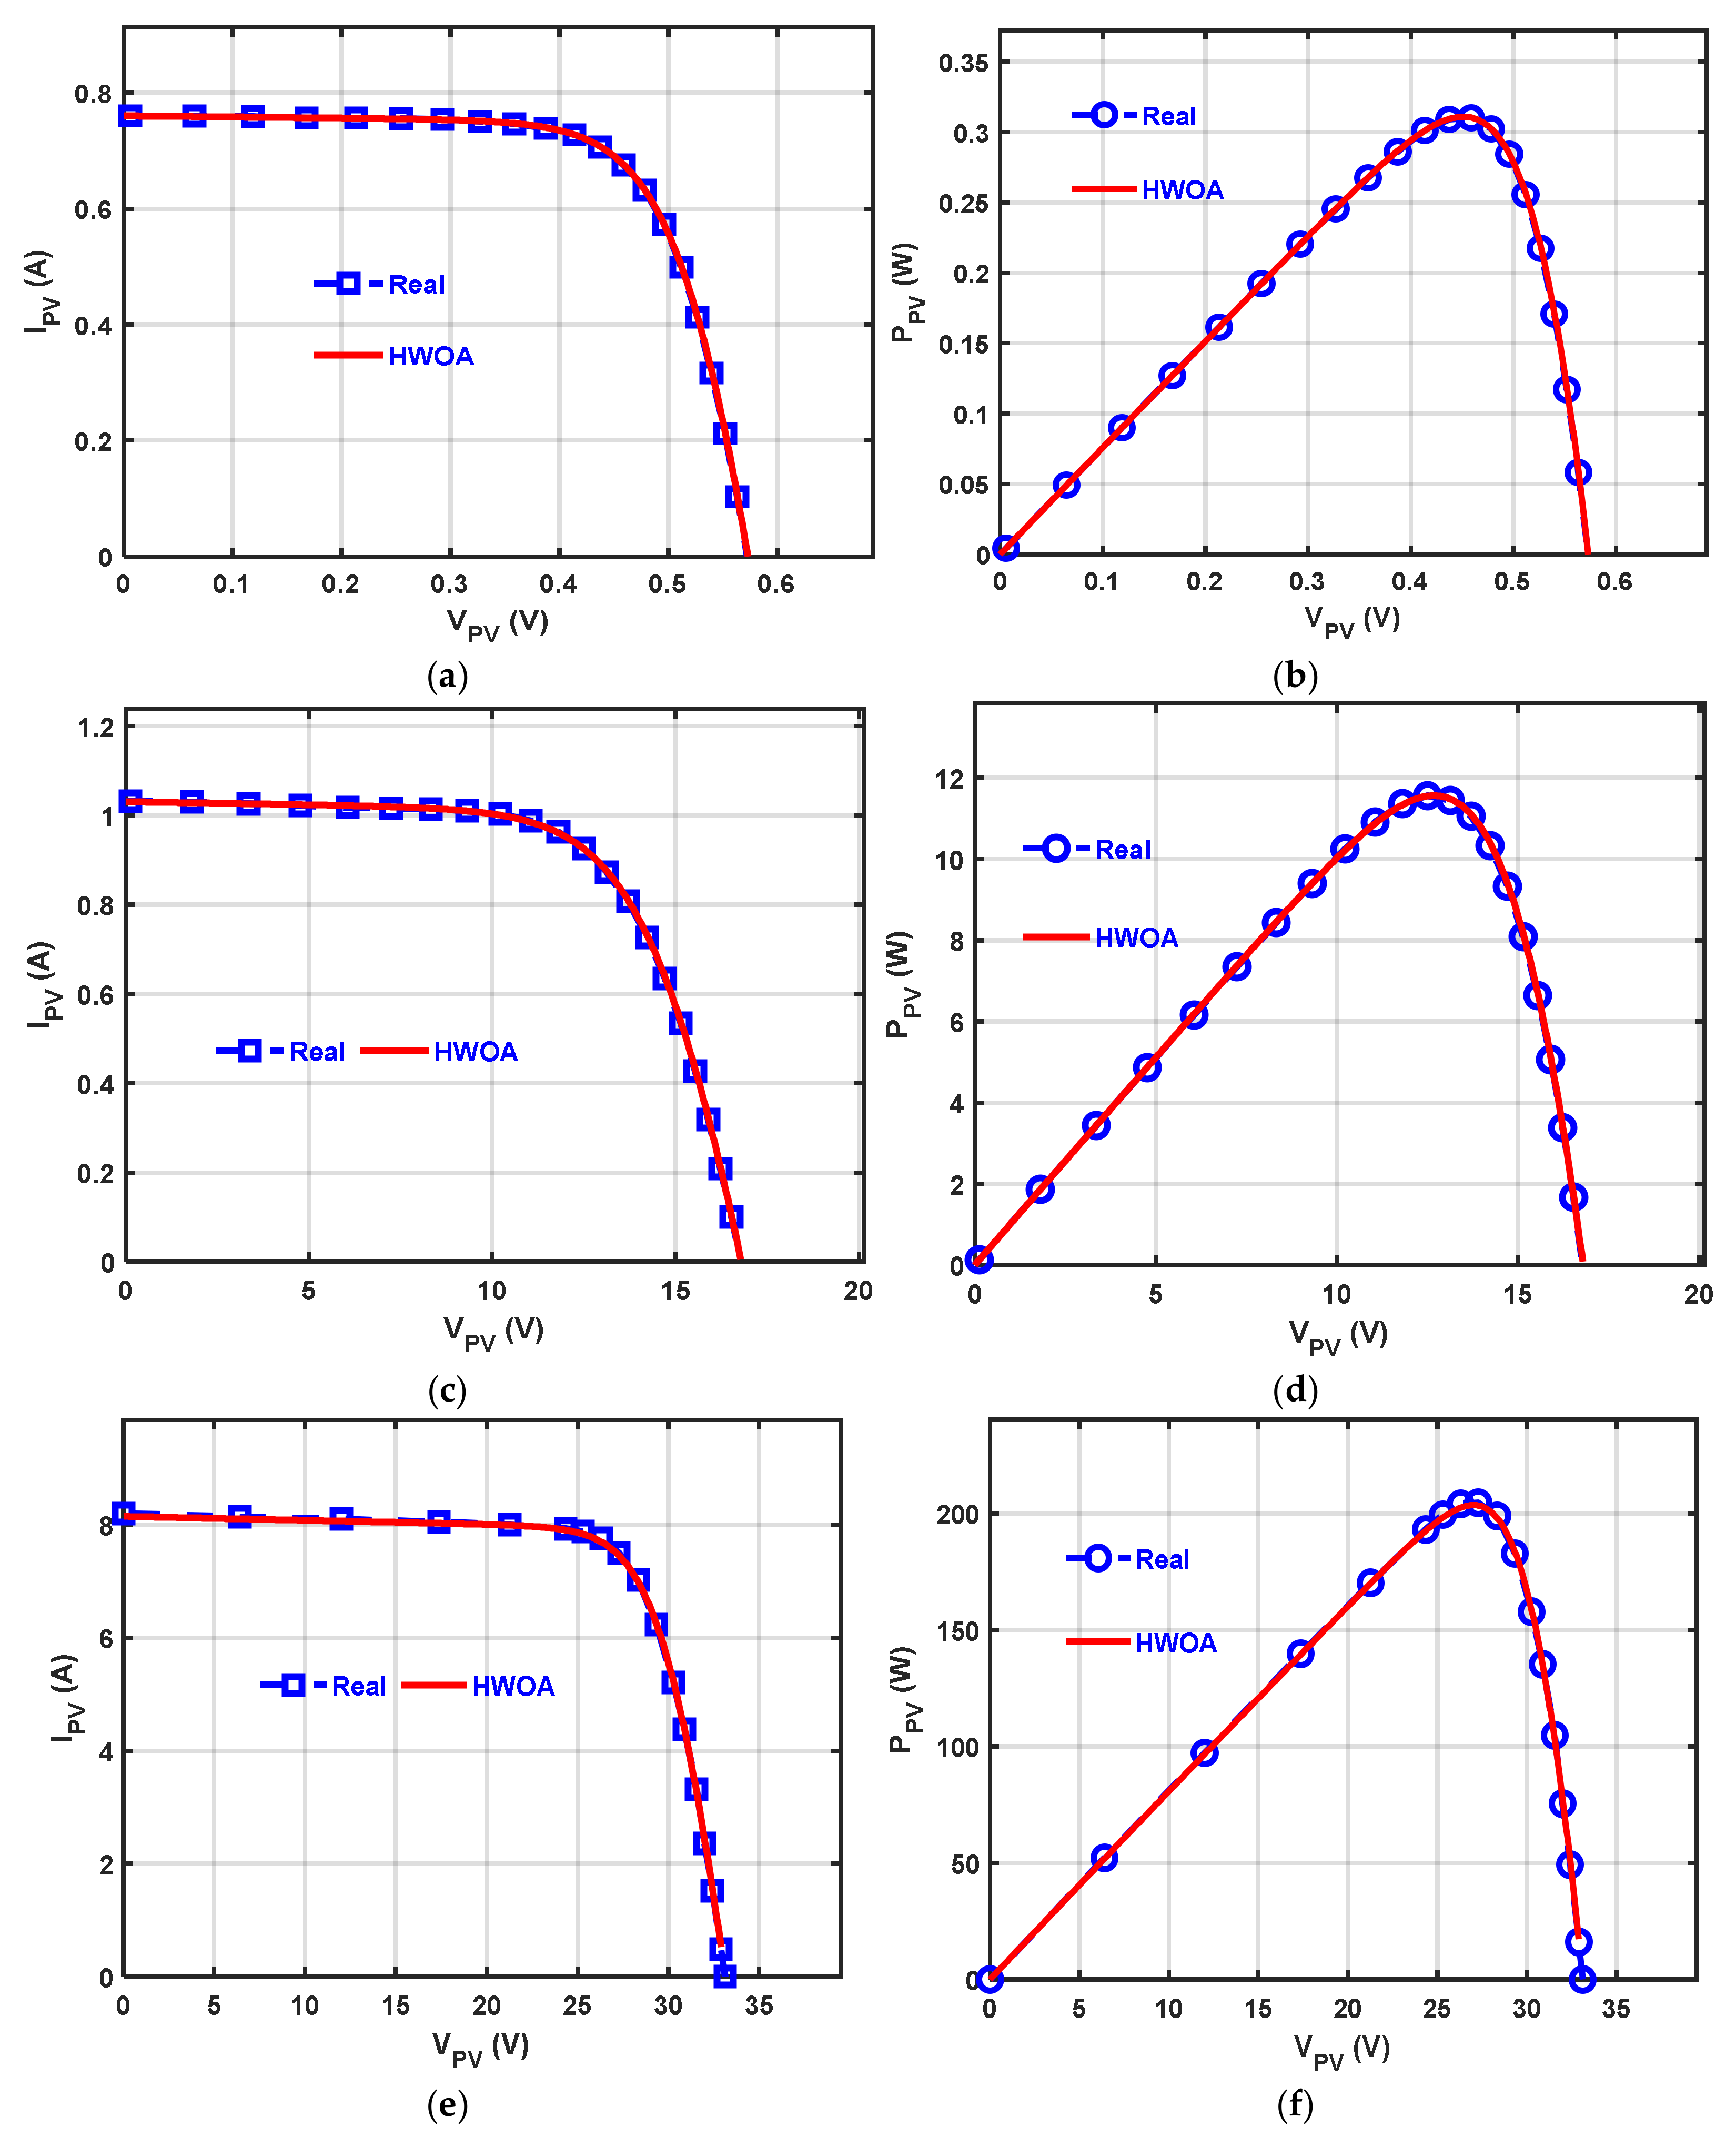
5. Results and Discussion

This section elaborates in detail the experimental outcomes for each module investigated.

5.1. RTC France Cell

The RTC France Silicon unit consists of one cell with I S C = 0.7605   A ,   T = 33   ° C , and an irradiance (G) level of 1000   W / m 2 . Table 2 announces the extracted parameters by each algorithm and its corresponding RMSE. HWOA achieves the lowest RMSE value that is substantially near to the ITLBO’s outcome with an improvement value of 0.000028 for HWOA. However, this improvement, although it is small, signifies that the proposed algorithm could minimize the error value between the estimated I and the measured one, and subsequently, the obtained parameters by HWOA are more accurate. Table 3 introduces the best, avg, worst, and standard deviation (SD) of RMSE extracted by each algorithm through 50 independent trials, in addition to the computational time, which illustrates the superiority of the HWOA for all metrics except for the time that is significantly competitive between HWOA and ISA. From Table 3, also, it is clear that HWOA consumes half the time as ITLBO, which was, to some extent, competitive with HWOA for the best RMSE, and subsequently, the proposed is the best since it is more converged with less computational cost. Furthermore, to more appear the effectiveness of HWOA, the error values (EV) between the measured and estimated I under both HWOA and ITLBO as the second-best algorithm are presented in Table 4 after computing using Equation (23). This table (Table 4) shows that HWOA is the nearest to 20 measured I out of 26 ones, and this affirms the proposed algorithm: HWOA could find more accurate parameter values. Figure 8a,b illustrate the consistency of the estimated I-V and P-V curves against the measured ones, demonstrating that HWOA produces estimates that are highly coherent with the measured ones. Additionally, Figure 9a shows the convergence rate of each algorithm and that confirms the proposed approach: HWOA converges fastest and is followed by RWOA as the second more converged. Last but not least, the algorithms are compared in Table 5 under the Wilcoxon rank-sum test to determine if there is a difference among them or not. According to Table 5, the outcomes of HWOA on RTC France are significantly different from those of the others. In a general sense, HWOA is the best due to its superiority for time, stability (less SD), accuracy, and convergence speed:
E V = I m , k I e , k V e ,   X i ,     k M

5.2. Photowatt-PWP201 Module

This module consists of 36 series cells with I S C = 1.0317   A ,   T = 45 °C and G of 1000   W / m 2 . The extracted parameters by each algorithm and the corresponding RMSE are shown in Table 6, from which it is obvious that AEO which is to some extent competitive to HWOA and RWOA has fulfilled the best value of 0.0021239, while both the proposed variants have respectively achieved the best RMSE of 0.0020506744 and 0.0020936002 with an improvement rate up to 0.00007322 and 0.0000302 compared to AEO; HWOA is more efficient, accurate, and speedup (see Table 7) since the obtained parameters have less RMSE even if with a small rate because this will minimize the error rate between the measured and estimated-I as depicted in Table 8, which shows that HWOA has gotten to less EVs for 15 data points of 26 as a total, while its performance is competitive for the others. Figure 8c,d show that the estimated I-V and P-V curves are extremely coherent with the measured I-V and P-V curves. Table 7 shows the best, avg, worst, Rank, time, and the SD of RMSE obtained by each algorithm within 50 independent runs, which confirms that the proposed approach outperforms the others for all those rather than the time metric. Furthermore, Table 5 presents the outcomes under the significant-rank sum test on this module, which shows the difference of the outcomes obtained under HWOA compared to those obtained under the others. Additionally, Figure 9b shows that HWOA converges fastest. In a brief, HWOA is the best for all the previously-mentioned metrics except for the time consumption, whereas it is competitive with ISA. It may be useful stating that the reported values of unknown parameters in Table 6 are based on per cell.

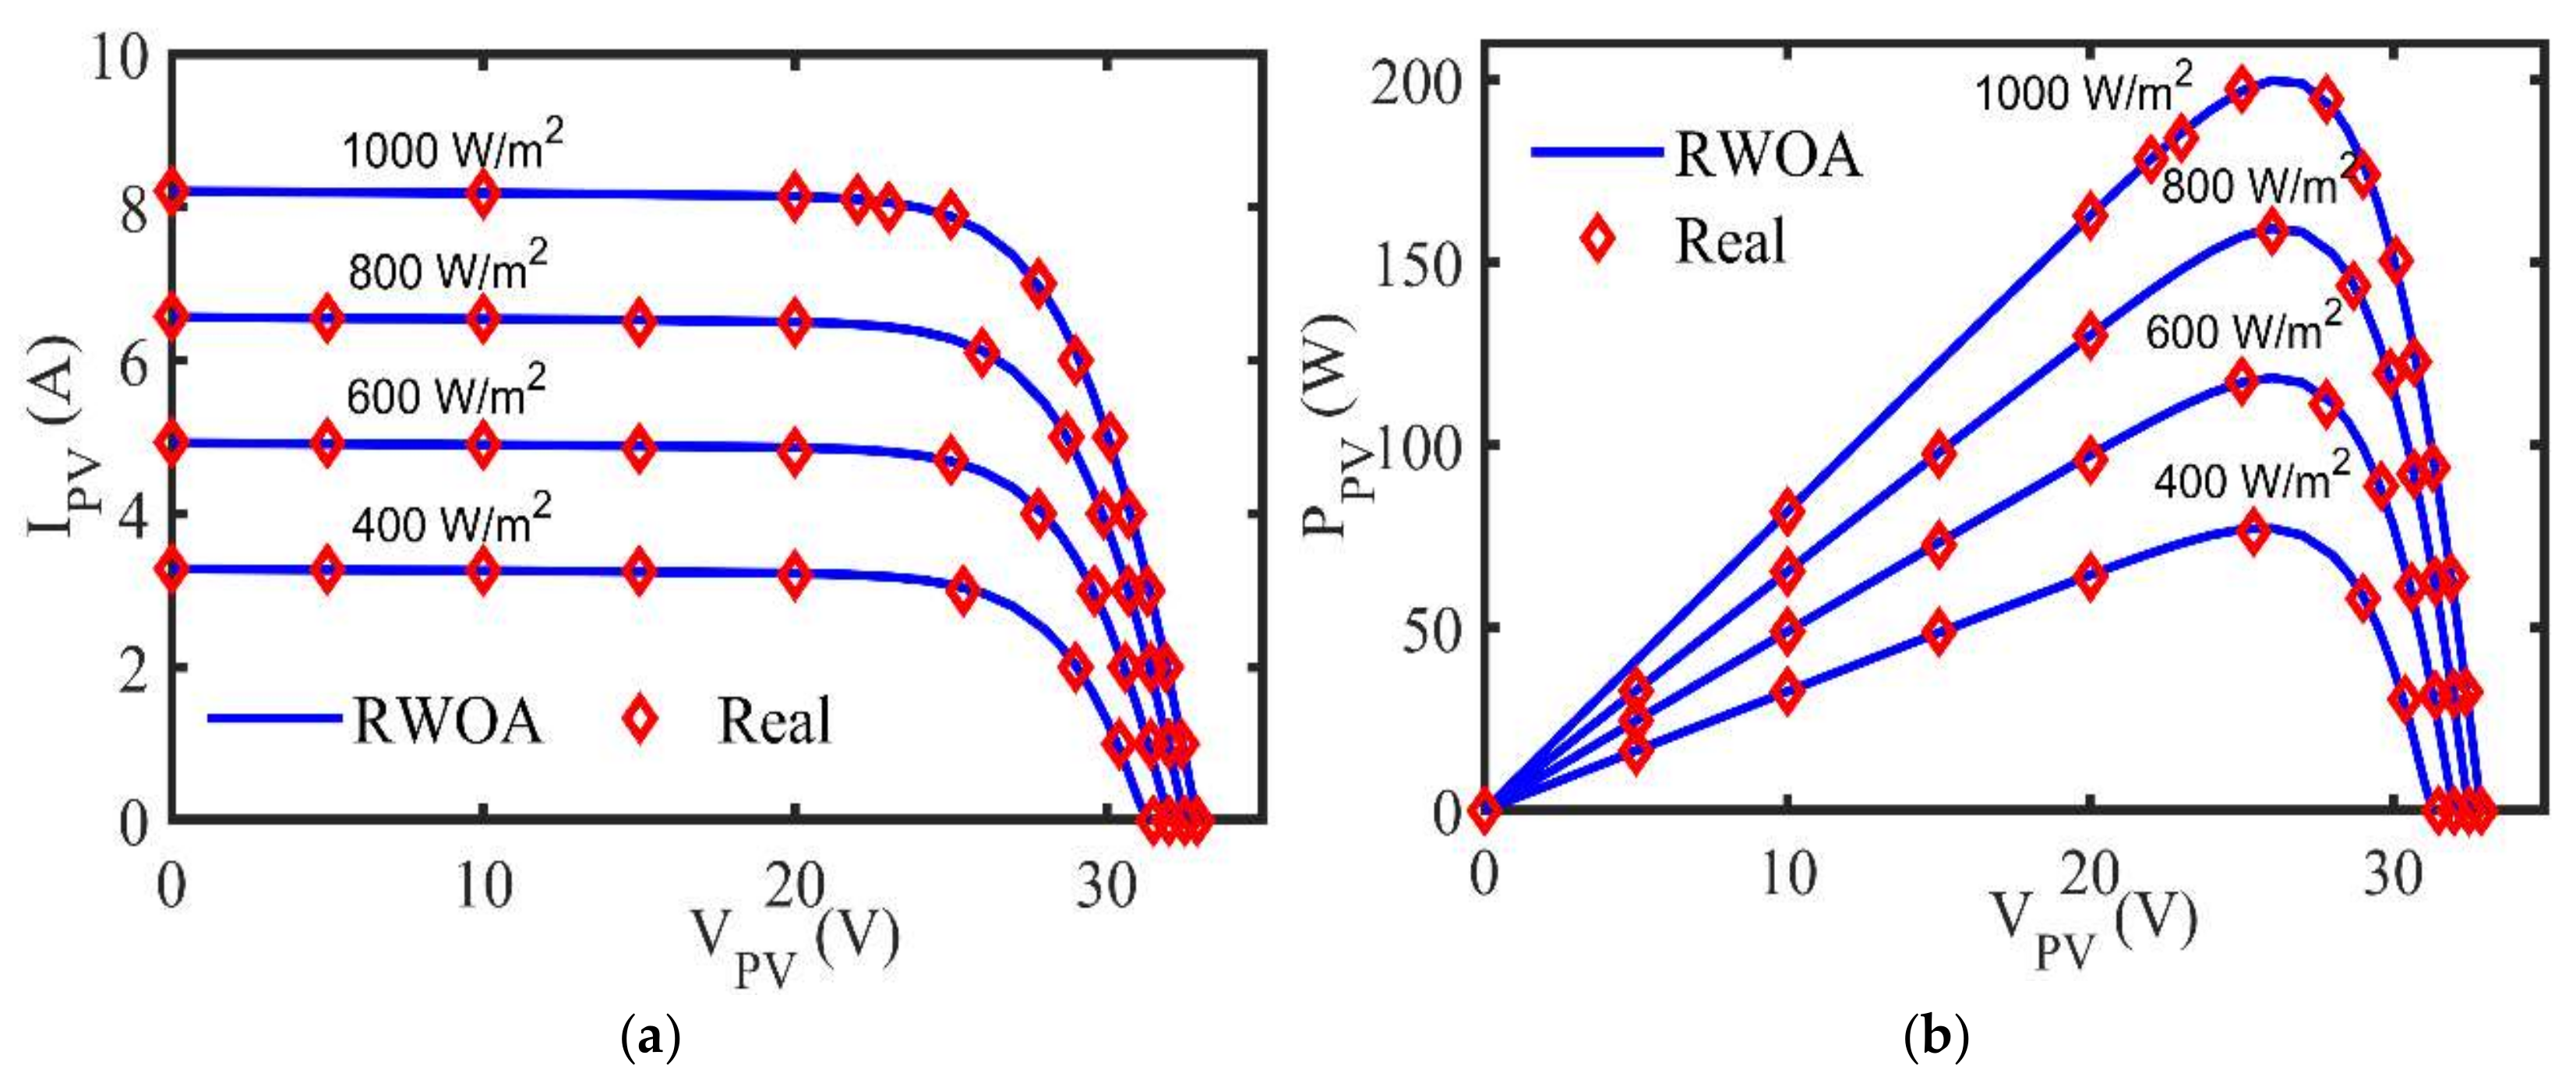
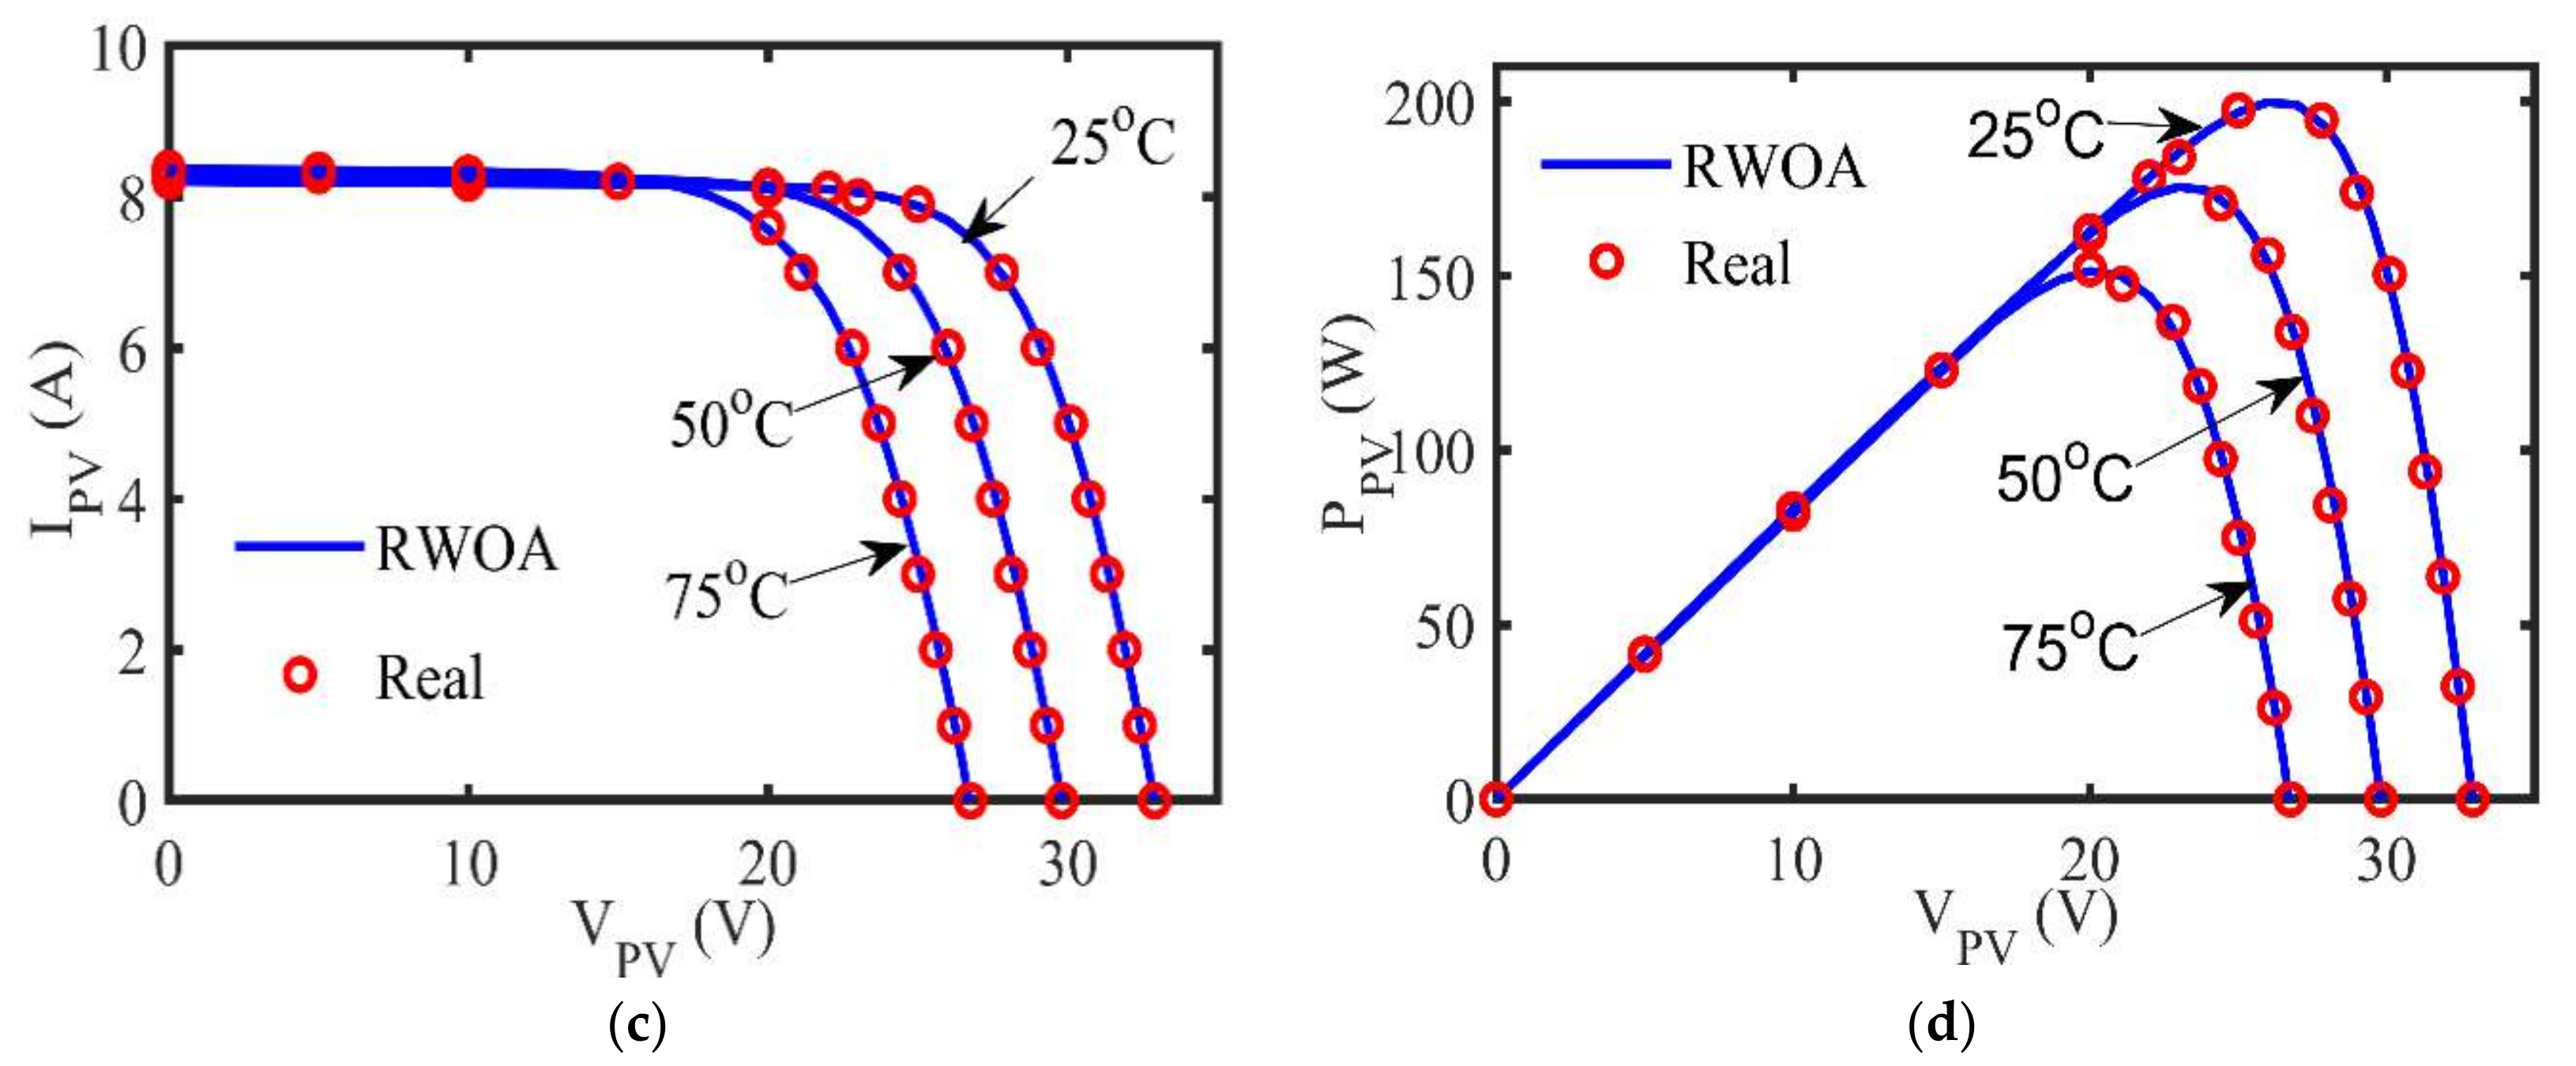
5.3. Kyocera KC200GT-204.6W

The Kyocera KC200GT-204.6W module involves 54 cells connected in series with I S C = 8.21   A ,   T = 2545 °C, and G of 1000   W / m 2 . Table 9 announces the extracted parameters with the best fitness for each algorithm, from which it is obvious that RWOA achieves the lowest RMSE value that is significantly competitive with HWOA. Furthermore, Table 10 shows the best, avg, worst, time, and SD of RMSE extracted by each algorithm within 50 independent trials, confirming that the proposed approach achieves the best of all values except for the time metric, for which HWOA is significantly competitive with ISA. To determine the difference among the outcomes of the algorithms on this module, the Wilcoxon rank-sum test is employed to show so, and its outcomes are presented in Table 5 which confirms that HWOA could fulfill significantly different outcomes. Figure 8e,f show that the I-V and P-V curves obtained by HWOA are highly consistent with the measured ones. Additionally, Figure 9c shows that the proposed approaches: HWOA (fastest) and RWOA (less speed) converge fastest compared to the compared ones. Once again, it worth mentioning that the reported values of unknown parameters in Table 9 are based on per cell.
At this stage, further validations can be made to examine the robustness of the cropped best settings of the nine model parameters by the HWOA under varied operating conditions. It may be useful mentioning that this proposed methodology can estimate the unknown parameters at any test condition (not necessarily at standard test condition (STC)). It is well-known that suppliers of PV units provide the datasheets at STC ( G r = 1000 W / m 2 ,   T r = 25   ° C , and 1.5 air mass).
It is well-known that I p h , I S D ,   E g , and   R s h , are hooked with the variations of G and T which can be adjusted based on the Formulas detailed in (24) to (27), respectively [27,28,29,30,31] for non-standard conditions. On the other hand, the diode ideality factors along with the series resistor of the models are treated as fixed values and they are independent of such G and T variations.
I p h = G G r I p h r + k i T T r e f
I S D i = I S D r i   T T r 3   e q   E g N s a i K   1 T r 1 T ,     i 1 : 3
E g = E g r   ×   1 0.0026677 T T r
R s h = G r G R s h r
where k i defines the PV unit’s current coefficient (A/K), I p h r , I S D r i , and R s h r denote the generated photo-current, diode-reserve saturation current, and shunt resistor at STC, respectively, and E g r is the semi-conductor energy band-gap (eV) at STC.
Various scenarios can be performed on the three defined test cases as demonstrated in the above subsections with necessary validations and comprehensive comparisons. However, due to the difficulty in estimating its unknown parameters as shown above by the obtained outcomes, the module of Kyocera KC200GT is chosen as a representative case study for such anticipated variations. Figure 10 illustrates the principal characteristics of this unit under different operating conditions. More specifically, Figure 10a,b shows the patterns of I-V and P-V characteristics under four levels of sun irradiances at a fixed temperature of 25 °C. However, the impacts of temperature changes are revealed in Figure 10c,d for three levels of temperature as indicated in the figure at 1000 W / m 2 .

6. Conclusions and Future Work

Solar energy is considered an important renewable energy source. However, to simulate the photovoltaic models accurately, some unidentified parameters in the mathematical model must be estimated accurately and effectively. In this study, the authors develop two variants of the WOA for tackling the parameter extraction problem. The first variant called RWOA is based on integrating the ranking method with a novel methodology to replace the unbeneficial solutions out of the population for utilizing each solution inside the population as possible. The second one improved RWOA by a novel cyclic exploration-exploitation strategy to promote its local and global search. This variant is abbreviated as HWOA. The performance of the proposed variants has been validated on a solar cell and two PV modules, in addition to comparing them with number of well-known optimization algorithms proposed recently for estimating the unidentified parameters of the TDM. At this stage, the performance of these units are made under changeable environmental conditions. The experimental outcomes prove the viability of RWOA and the superiority of HWOA for all performance measures and the Wilcoxon rank-sum test. Our future work involves searching for a better strategy to further improve the performance of the HWOA algorithm.

Author Contributions

Conceptualization, M.A.-B., R.M. and A.E.-F.; methodology, M.A.-B., R.M., M.A. and A.E.-F.; software, R.M., A.E.-F. and M.A.-B.; validation, A.E.-F., S.S.A. and M.A.-B.; formal analysis, M.A., R.M. and M.A.-B.; investigation, S.S.A., A.E.-F. and M.A.; resources, M.A.-B., S.S.A. and R.M.; data curation, M.A.-B., R.M. and A.E.-F.; writing—original draft preparation, M.A.-B., R.M. and A.E.-F.; writing—review and editing, S.S.A., A.E.-F. and M.A.; visualization M.A.-B., A.E.-F. and R.M.; supervision, A.E.-F., M.A.-B. and S.S.A.; project administration, A.E.-F., R.M. and M.A.-B.; funding acquisition, S.S.A. All authors have read and agreed to the published version of the manuscript.

Funding

This project is funded by King Saud University, Riyadh, Saudi Arabia.

Institutional Review Board Statement

The study did not involve humans or animals.

Informed Consent Statement

The study did not involve humans.

Data Availability Statement

Not applicable.

Acknowledgments

Research Supporting Project number (RSP-2021/167), King Saud University, Riyadh, Saudi Arabia.

Conflicts of Interest

The authors declare no conflict of interest.

References

  1. Wang, Y.; Rousis, A.O.; Strbac, G. On microgrids and resilience: A comprehensive review on modeling and operational strategies. Renew. Sustain. Energy Rev. 2020, 134, 110313. [Google Scholar] [CrossRef]
  2. Ibrahim, I.A.; Hossain, M.; Duck, B.C.; Nadarajah, M. An improved wind driven optimization algorithm for parameters identification of a triple-diode photovoltaic cell model. Energy Convers. Manag. 2020, 213, 112872. [Google Scholar] [CrossRef]
  3. Bharadwaj, P.; Lehman, B. Modelling Flexible a-Si PV for Increased Energy Capture and Improved Reliability. In Proceedings of the 2020 IEEE Applied Power Electronics Conference and Exposition (APEC), New Orleans, LA, USA, 15–19 March 2020; Institute of Electrical and Electronics Engineers (IEEE): Piscataway, NJ, USA, 2020; pp. 2794–2799. [Google Scholar]
  4. Ahmad, T.; Sobhan, S.; Nayan, M.F. Comparative Analysis between Single Diode and Double Diode Model of PV Cell: Concentrate Different Parameters Effect on Its Efficiency. J. Power Energy Eng. 2016, 4, 31–46. [Google Scholar] [CrossRef] [Green Version]
  5. Askarzadeh, A.; Rezazadeh, A. Parameter identification for solar cell models using harmony search-based algorithms. Sol. Energy 2012, 86, 3241–3249. [Google Scholar] [CrossRef]
  6. Khanna, V.; Das, B.K.; Bisht, D.; Vandana; Singh, P.K. A three diode model for industrial solar cells and estimation of solar cell parameters using PSO algorithm. Renew. Energy 2015, 78, 105–113. [Google Scholar] [CrossRef]
  7. Villalva, M.G.; Gazoli, J.R.; Filho, E.R. Comprehensive Approach to Modeling and Simulation of Photovoltaic Arrays. IEEE Trans. Power Electron. 2009, 24, 1198–1208. [Google Scholar] [CrossRef]
  8. Shongwe, S.; Hanif, M. Comparative Analysis of Different Single-Diode PV Modeling Methods. IEEE J. Photovolt. 2015, 5, 938–946. [Google Scholar] [CrossRef]
  9. Bai, J.; Liu, S.; Hao, Y.; Zhang, Z.; Jiang, M.; Zhang, Y. Development of a new compound method to extract the five parameters of PV modules. Energy Convers. Manag. 2014, 79, 294–303. [Google Scholar] [CrossRef]
  10. Qais, M.H.; Hasanien, H.M.; Alghuwainem, S. Parameters extraction of three-diode photovoltaic model using computation and Harris Hawks optimization. Energy 2020, 195, 117040. [Google Scholar] [CrossRef]
  11. ElAzab, O.S.; Hasanien, H.M.; Elgendy, M.A.; Abdeen, A.M. Parameters estimation of single- and multiple-diode photovoltaic model using whale optimisation algorithm. IET Renew. Power Gener. 2018, 12, 1755–1761. [Google Scholar] [CrossRef]
  12. Wei, T.; Yu, F.; Huang, G.; Xu, C. A Particle-Swarm-Optimization-Based Parameter Extraction Routine for Three-Diode Lumped Parameter Model of Organic Solar Cells. IEEE Electron Device Lett. 2019, 40, 1511–1514. [Google Scholar] [CrossRef]
  13. El-Hameed, M.A.; Elkholy, M.M.; El-Fergany, A.A. Three-diode model for characterization of industrial solar generating units using Manta-rays foraging optimizer: Analysis and validations. Energy Convers. Manag. 2020, 219, 113048. [Google Scholar] [CrossRef]
  14. Allam, D.; Yousri, D.; Eteiba, M. Parameters extraction of the three diode model for the multi-crystalline solar cell/module using Moth-Flame Optimization Algorithm. Energy Convers. Manag. 2016, 123, 535–548. [Google Scholar] [CrossRef]
  15. ElAzab, O.S.; Hasanien, H.M.; Alsaidan, I.; Abdelaziz, A.Y.; Muyeen, S.M. Parameter Estimation of Three Diode Photovoltaic Model Using Grasshopper Optimization Algorithm. Energies 2020, 13, 497. [Google Scholar] [CrossRef] [Green Version]
  16. Diab, A.A.Z.; Sultan, H.M.; Do, T.D.; Kamel, O.M.; Mossa, M.A. Coyote Optimization Algorithm for Parameters Estimation of Various Models of Solar Cells and PV Modules. IEEE Access 2020, 8, 111102–111140. [Google Scholar] [CrossRef]
  17. Yousri, D.; Thanikanti, S.B.; Allam, D.; Ramachandaramurthy, V.K.; Eteiba, M. Fractional chaotic ensemble particle swarm optimizer for identifying the single, double, and three diode photovoltaic models’ parameters. Energy 2020, 195, 116979. [Google Scholar] [CrossRef]
  18. Mirjalili, S.; Lewis, A. The Whale Optimization Algorithm. Adv. Eng. Softw. 2016, 95, 51–67. [Google Scholar] [CrossRef]
  19. Elazab, O.S.; Hasanien, H.M.; Elgendy, M.A.; Abdeen, A.M. Whale optimisation algorithm for photovoltaic model identification. J. Eng. 2017, 2017, 1906–1911. [Google Scholar] [CrossRef]
  20. Li, S.; Gong, W.; Yan, X.; Hu, C.; Bai, D.; Wang, L.; Gao, L. Parameter extraction of photovoltaic models using an improved teaching-learning-based optimization. Energy Convers. Manag. 2019, 186, 293–305. [Google Scholar] [CrossRef]
  21. Abdel-Basset, M.; Mohamed, R.; Elhoseny, M.; Chakrabortty, R.K.; Ryan, M. A Hybrid COVID-19 Detection Model Using an Improved Marine Predators Algorithm and a Ranking-Based Diversity Reduction Strategy. IEEE Access 2020, 8, 79521–79540. [Google Scholar] [CrossRef]
  22. Nunes, H.G.G.; Pombo, J.; Mariano, S.; Calado, M.; de Souza, J.F. A new high performance method for determining the parameters of PV cells and modules based on guaranteed convergence particle swarm optimization. Appl. Energy 2018, 211, 774–791. [Google Scholar] [CrossRef]
  23. Yousri, D.; Rezk, H.; Fathy, A. Identifying the parameters of different configurations of photovoltaic models based on recent artificial ecosystem-based optimization approach. Int. J. Energy Res. 2020, 44, 11302–11322. [Google Scholar] [CrossRef]
  24. Selem, S.I.; El-Fergany, A.A.; Hasanien, H.M. Artificial electric field algorithm to extract nine parameters of triple-diode photovoltaic model. Int. J. Energy Res. 2021, 45, 590–604. [Google Scholar] [CrossRef]
  25. Fathy, A.; Rezk, H. Robust electrical parameter extraction methodology based on Interior Search Optimization Algorithm applied to supercapacitor. ISA Trans. 2020, 105. [Google Scholar] [CrossRef]
  26. Chou, J.-S.; Truong, D.-N. A novel metaheuristic optimizer inspired by behavior of jellyfish in ocean. Appl. Math. Comput. 2021, 389, 125535. [Google Scholar] [CrossRef]
  27. Ma, X.; Li, M.; Du, L.; Qin, B.; Wang, Y.; Luo, X.; Li, G. Online extraction of physical parameters of photovoltaic modules in a building-integrated photovoltaic system. Energy Convers. Manag. 2019, 199, 112028. [Google Scholar] [CrossRef]
  28. Yadir, S.; Bendaoud, R.; El-Abidi, A.; Amiry, H.; Benhmida, M.; Bounouar, S.; Zohal, B.; Bousseta, H.; Zrhaiba, A.; Elhassnaoui, A. Evolution of the physical parameters of photovoltaic generators as a function of temperature and irradiance: New method of prediction based on the manufacturer’s datasheet. Energy Convers. Manag. 2020, 203, 112141. [Google Scholar] [CrossRef]
  29. Aly, S.P.; Ahzi, S.; Barth, N. An adaptive modelling technique for parameters extraction of photovoltaic devices under varying sunlight and temperature conditions. Appl. Energy 2019, 236, 728–742. [Google Scholar] [CrossRef]
  30. Abdel-Basset, M.; Mohamed, R.; El-Fergany, A.; Abouhawwash, M.; Askar, S.S. Parameters identification of pv triple-diode model using improved generalized normal distribution algorithm. Mathematics 2021, 9, 995. [Google Scholar] [CrossRef]
  31. Abdel-Basset, M.; Mohamed, R.; Chakrabortty, R.K.; Ryan, M.J.; El-Fergany, A. An improved artificial jellyfish search optimizer for parameter identification of photovoltaic models. Energies 2021, 14, 1867. [Google Scholar] [CrossRef]
Figure 1. The electrical circuit of TDM.
Energies 14 03729 g001
Figure 2. Various scenarios for CF under various CC: (a) CC = 1; (b) CC = 2; (c) CC = 1; (d) CC = 2.
Energies 14 03729 g002
Figure 3. Investigation of various T and their influence on D’s outcomes: (a) T =1; (b) T = 2; and (c) T = 5.
Energies 14 03729 g003aEnergies 14 03729 g003b
Figure 4. Observations of different chaotic maps.
Energies 14 03729 g004
Figure 5. Parameter tuning of the CC parameter.
Energies 14 03729 g005
Figure 6. Parameter tuning of the CP parameter.
Energies 14 03729 g006
Figure 7. Parameter tuning of the CP parameter.
Energies 14 03729 g007
Figure 8. Schemes follow the same formatting. Depictions of the measured and estimated data obtained under HWOA: (a) I-V distinctive curve of RTC France; (b) P-V distinctive curve of RTC France; (c) I-V distinctive curve of PWP201; (d) P-V distinctive curve of PWP201; (e) I-V distinctive curve of KC200GT; and (f) P-V distinctive curve of KC200GT.
Energies 14 03729 g008
Figure 9. Comparison of algorithm convergence: (a) Convergence for RTC France; (b) Convergence for PWP201; and (c) Convergence for KC200GT.
Energies 14 03729 g009
Figure 10. Principal characteristics of Kyocera KC200GT under changeable G and T: (a) I-V distinctive curve at varied G; (b) P-V distinctive curve at varied G; (c) I-V distinctive curve at varied T; and (d) P-V distinctive curve at varied T.
Energies 14 03729 g010aEnergies 14 03729 g010b
Table 1. The boundary of unknown parameters per cell.
ParameterLBUB
I p h A 0.9   I S C 1.1   I S C
I s d i A ,   i 1 : 3 1   n A 10   μ A
R s Ω 0 0.5
R s h Ω 0 500
a 1 1 2
a 2 1.2 2
a 3 1.4 2
Table 2. Comparison of the TDM based on the best-extracted parameter values and their RMSEs under RTC France cell.
Algorithms I p h A   I s d 1 A   I s d 2 A   I s d 3 A   R s Ω   R s h Ω   a 1   a 2   a 3   RMSE
AEO [23]0.759221.238 × 10−76.438 × 10−74.294 × 10−90.0350585.166811.430681.686751.417570.00129701
ITLBO [20]0.760491.401 × 10−73.675 × 10−71.071 × 10−90.0367657.436691.424061.668621.658400.00077984
ISA [25]0.760501.141 × 10−81.350 × 10−64.648 × 10−70.0389970.307441.240341.786861.905770.00081148
HHO [10]0.759692.036 × 10−81.531 × 10−81.264 × 10−60.03720108.841721.292431.510251.742640.00122689
WOA [18]0.760501.170 × 10−63.306 × 10−77.065 × 10−70.02743429.581321.707001.702991.699580.00352126
RWOA0.760502.639 × 10−65.205 × 10−81.049 × 10−80.0384164.454172.000001.341151.400000.00075626
HWOA0.760507.668 × 10−78.966 × 10−81.193 × 10−60.0379560.857091.954801.376041.998360.00075148
Bold values distinguish the best findings.
Table 3. Comparison of the fitness on RTC France.
AlgorithmsAEO [23]ITLBO [20]ISA [25]HHO [10]WOA [18]RWOAHWOA
Best0.00129700610.00077984280.00081147550.00122688600.00352125940.00075625610.0007514822
Worst0.00585575730.00758620700.00498718630.01807512290.01820476560.00855512160.0058540672
Avg0.00383072930.00299209660.00278885080.00732410720.00982321460.00246448420.0010557685
SD0.00126251660.00145673140.00099874750.00375305930.00254908060.00162999820.0007712976
Time (s)1.84840648002.44458740201.13838674804.23494100202.21077202202.51963253801.3130094500
Rank5436721
Table 4. Error values between measured- and estimated-I on RTC France.
PointsITLBO [20]HWOAPointsITLBO [20]HWOA
10.000421400.00059436140.000637360.00094555
20.000245780.00014751150.000435400.00023563
30.000522400.00049222160.000186220.00019598
40.000600740.00056986170.001057620.00087708
50.001129080.00104595180.000840370.00055163
60.001079380.00095619190.000554820.00082578
70.000023040.00016786200.000509830.00065411
80.000883370.00074426210.000671920.00064497
90.000409420.00031250220.000005010.00017199
100.000320500.00030689230.000924240.00113327
110.000897630.00079535240.000603470.00048777
120.000840040.00061514250.001488410.00135363
130.001569240.00125975260.000758500.00117864
Table 5. Comparison under Wilcoxon rank-sum test.
RTCPWP201KC200GT
Algorithmshp-Valuehp-Valuehp-Value
HWOA vs. AEO13.1949811 × 10−1615.1397061 × 10−1015.6387345 × 10−17
HWOA vs. ITLBO12.7981570 × 10−1419.6808330 × 10−513.5812605 × 10⁻¹⁶
HWOA vs. ISA13.1940068 × 10−1517.2511469 × 10−1415.0379086 × 10−16
HWOA vs. HHO13.7391900 × 10−1712.1975265 × 10−1715.0154613 × 10−17
HWOA vs. WOA17.9688116 × 10−1819.5403423 × 10−1818.4619555 × 10−18
HWOA vs. RWOA12.1162998 × 10−1011.2795224 × 10−613.9885266 × 10⁻⁶
Table 6. Comparison of the TDM based on the best-extracted parameter values and their RMSEs under PWP201 module.
Algorithms I p h A   I s d 1 A   I s d 2 A   I s d 3 A   R s Ω   R s h Ω   a 1   a 2   a 3   RMSE
AEO [23]1.031672.299 × 10−64.908 × 10−62.116 × 10−70.0342323.206611.310991.983401.879610.00212391
ITLBO [20]1.030943.314 × 10−68.137 × 10−82.028 × 10−90.0336126.156661.346081.809841.705480.00215662
ISA [25]1.030332.399 × 10−63.636 × 10−71.082 × 10−90.0343626.495861.321681.370551.956770.00216172
HHO [10]1.026782.052 × 10−62.572 × 10−62.259 × 10−60.0316378.983231.365861.447771.510620.00313249
WOA [18]1.026265.197 × 10−62.776 × 10−65.301 × 10−60.03173474.240801.970391.949771.402020.00340767
RWOA1.031703.101 × 10−61.000 × 10−91.000 × 10−90.0337623.595341.338962.000002.000000.00209360
HWOA1.031702.594 × 10−61.005 × 10−91.000 × 10−90.0343622.165261.320492.000001.999960.00205067
Bold value indicates the best result.
Table 7. Comparison of the fitness on PWP201 module.
AlgorithmsAEO [23]ITLBO [20]ISA [25]HHO [10]WOA [18]RWOAHWOA
Best0.00212390700.00215662280.00216172170.00313249270.00340767440.00209360020.0020506744
Worst0.00458556750.00397488260.00493289470.01336246790.03396533920.00487511040.0037856010
Avg0.00319097750.00281013430.00343955270.00498637920.00924434120.00296618320.0024630570
SD0.00055290850.00044784180.00059880610.00213153080.00664778650.00058269250.0003765776
Time (s)2.02594898402.54258940601.06904366804.11461055802.18647618202.52889495401.1371688640
Rank4256731
Bold value indicates the best result.
Table 8. Error-values between measured and estimated I on PWP201 module.
PointsAEO [23]HWOAPointsAEO [23]HWOA
10.002026120.00196520140.000708500.00107830
20.001509290.00155811150.000514250.00072990
30.002054880.00218585160.002064360.00208065
40.000016160.00017725170.002342230.00215810
50.002111950.00188234180.001290390.00094117
60.004051180.00381960190.001157460.00069973
70.003985030.00379324200.000157240.00066030
80.001783490.00167704210.001020090.00150851
90.000112910.00009277220.002951070.00337354
100.003335240.00316378230.000287510.00060339
110.003636410.00331901240.000200450.00002180
120.003270060.00285082250.000418890.00039876
130.002080710.00163878260.001942150.00209381
Table 9. Comparison of the TDM based on the best-extracted parameter values and their RMSEs under Kyocera KC200GT-204.6W.
Algorithms I p h A   I s d 1 A   I s d 2 A   I s d 3 A   R s Ω   R s h Ω   a 1   a 2   a 3   RMSE
AEO [23]8.132731.457 × 10−7 6.419 × 10−75.324 × 10−80.00317142.951431.338781.998861.678330.06162560
ITLBO [20]8.092778.870 × 10−82.782 × 10−95.431 × 10−70.00328347.121201.302851.754601.889850.06196293
ISA [25]8.131931.794 × 10−81.432 × 10−64.577 × 10−90.0039412.382241.202401.865301.530530.05929216
HHO [10]8.139231.000 × 10−91.956 × 10−82.460 × 10−80.00418138.065311.068111.269601.461770.05470326
WOA [18]8.159323.135 × 10−91.579 × 10−94.621 × 10−70.00277500.000002.000002.000001.429040.07293691
RWOA8.200301.000 × 10−91.310 × 10−91.053 × 10−90.004602.657651.046872.000001.945520.02821562
HWOA8.201861.000 × 10−91.000 × 10−91.000 × 10−90.004592.630091.046872.000001.693480.02822241
Bold value indicates the best value.
Table 10. Comparison of the fitness on Kyocera KC200GT-204.6W.
AlgorithmsAEO [23]ITLBO [20]ISA [25]HHO [10]WOA [18]RWOAHWOA
Best6.16256 × 10−26.19629 × 10−25.92922 × 10−25.47033 × 10−27.29369 × 10−22.82156 × 10−22.82224 × 10−2
Worst1.20377 × 10−11.18683 × 10−11.11085 × 10−12.09556 × 10−12.53518 × 10−11.25166 × 10−18.74320 × 10−2
Avg9.26133 × 10−28.08383 × 10−28.24407 × 10−21.15432 × 10−11.60725 × 10−16.62490 × 10−24.86870 × 10−2
SD1.45518 × 10−21.12456 × 10−21.15311 × 10−23.13564 × 10−24.59415 × 10−21.98688 × 10−21.29875 × 10−2
Time (s)2.137786392.591469170.921156763.922174102.169866712.480340501.06056147
Rank5346721
Bold values distinguish the best findings.
Publisher’s Note: MDPI stays neutral with regard to jurisdictional claims in published maps and institutional affiliations.

